Abstract
Interactions between the splicing machinery and RNA Polymerase II (RNA Pol II) increase protein-coding gene transcription. Similarly, exons and splicing signals of enhancer-generated lncRNAs (elncRNAs) augment enhancer activity. However, elncRNAs are inefficiently spliced, suggesting that compared to protein-coding genes they contain qualitatively different exons with a limited ability to drive splicing. We show here that the inefficiently spliced first exons of elncRNAs as well as promoter-antisense lncRNAs (pa-lncRNAs) in human and mouse cells trigger a transcription termination checkpoint that requires WDR82, an RNA Pol II-binding protein, and its RNA-binding partner of previously unknown function, ZC3H4. We propose that the first exons of elncRNAs and pa-lncRNAs are an intrinsic component of a regulatory mechanism that on the one hand maximizes the activity of these cis-regulatory elements by recruiting the splicing machinery, and on the other contains elements that suppress pervasive extragenic transcription.
Introduction
Nascent RNAs are immediately bound by protein complexes that control their fate as well as that of the transcribing RNA Pol II. The recruitment of splicing factors to the nascent end of pre-mRNAs is promoted by interactions of the cap-binding complex (CBC) with virtually all components of the splicing machinery1–3, by exonic sequences (exonic splice enhancers, ESEs) recognized by sequence-specific trans-acting factors such as the SR proteins3 and finally by the splice site at the 3’ end of the first exon. Recruitment of the splicing machinery to the nascent RNA reinforces gene transcription by promoting RNA Pol II elongation4–6, pre-initiation complex formation7,8 as well as the recruitment of co-regulators and chromatin remodelers9,10.
The impact of the splicing machinery on transcriptional control also starts emerging at enhancers. While many thousands putative enhancers can be identified in each cell type based on the histone mark H3K4me111, only a subset of them are active, as indicated by high histone acetylation levels and by the synthesis of enhancer RNAs (eRNAs)12–14. The term eRNAs has commonly been linked to short, capped and non-poly-adenylated transcripts that emanate bi-directionally from enhancer cores13. However, enhancers also commonly drive the production of long, spliced and poly-adenylated transcripts (elncRNAs)12,15,16. An emerging concept is that the recruitment of the splicing machinery mediated by splice sites and ESEs in the exons of elncRNAs contributes to enhancer activity and strength. Indeed, deletion of the splice sites of lncRNAs was shown to affect the expression of the adjacent gene in a lncRNA-independent manner, suggesting a cis-regulatory effect17. Moreover, genomic analyses indicate that conserved splice sites of lncRNAs increase enhancer activity18 and that polymorphisms affecting lncRNA splice site integrity are associated with reduced transcription of neighbouring genes19. Consistent with this conceptual framework, splice sites of lncRNAs represent the main target of purifying selection acting on lncRNAs in humans, suggesting a critical role20,21.
The effects generated by the recruitment of the splicing machinery to enhancers may occur at the level of both transcription initiation7,8 and elongation4–6. However, in spite of the abundant loading of RNA Pol II at highly acetylated and active enhancers12,13, their transcriptional output is extremely limited, which points to the existence of active termination mechanisms. This possibility is also suggested by the observation that RNA Pol II associated with enhancers lacks modifications associated with active elongation, notably Ser2 phosphorylation of its carboxy-terminal repeat domain (CTD), and it is instead associated with Ser5 phosphorylation, which marks the initiating and early elongating RNA Pol II22.
We previously reported that the adapter protein WDR82, which interacts with Ser5-phosphorylated RNA Pol II23, suppresses extragenic transcription emanating from active enhancers and promoters24. In cells depleted of WDR82, increased extragenic transcription was associated with the appearance of Ser2-phosphorylated RNA Pol II and H3K36me3 (a histone mark associated with productive transcription elongation) over extended genomic regions, suggesting the release from an early termination mechanism or an elongation block24. WDR82 is part of both the SET1 (COMPASS) H3K4 methyltransferase23,25 and the PNUTS complex26, in which the PP1 protein phosphatase is associated with the nuclear targeting subunit PNUTS. However, whereas the depletion of SET1 or PNUTS complex components also caused various termination defects, it did not recapitulate the phenotype of WDR82 depletion24.
Here we report that WDR82 forms an additional complex, conserved from flies to humans, with the RNA-binding zinc finger protein ZC3H4 (formerly known as C19ORF7). We show that this complex controls an early transcription termination checkpoint activated by the inefficiently spliced first exon of elncRNAs and promoter anti-sense lncRNAs (pa-lncRNAs).
Results
WDR82 depletion induces specific extragenic transcription changes
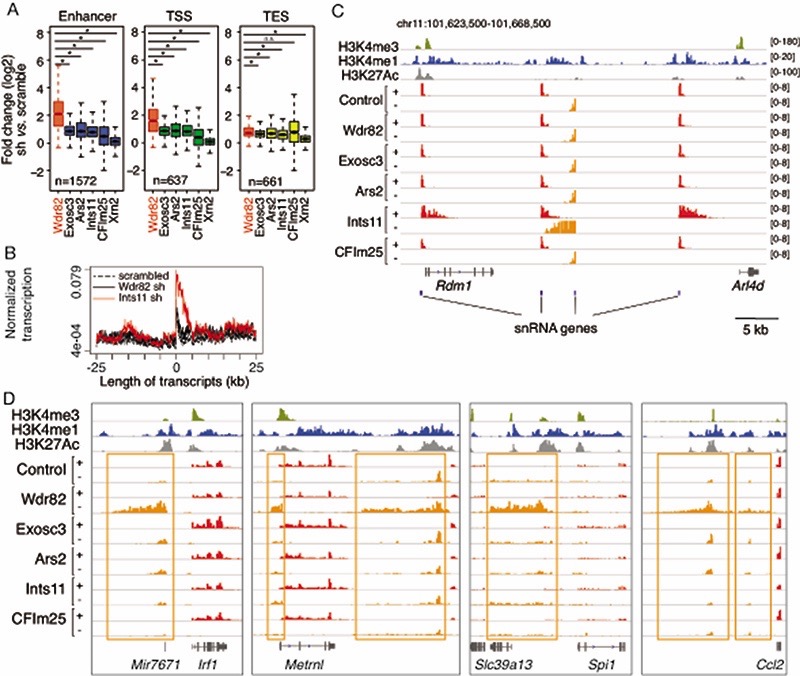
The depletion of WDR82 strongly increases transcription over kilobase-long extragenic regions originating from highly active putative enhancers and upstream of gene promoters24. It also causes termination defects at the 3’ end of selected genes24. We used 4-thiouridine labeling and sequencing (4sU-seq) of newly synthesized transcripts to test whether the depletion of factors involved in transcription termination and in processing or degradation of extragenic transcripts could recapitulate the effects of WDR82 depletion (Extended Data Figure 1, Supplementary Figure 1). The factors analyzed included 1) the INTS11 subunit of the Integrator complex, which cleaves short non-coding RNAs including snRNAs27 and eRNAs28; 2) the EXOSC3 subunit of the nuclear exosome, which degrades unstable and short extragenic transcripts29; 3) the ARS2 protein, which connects the 5’ Cap-binding complex with the nuclear exosome machinery30; 4) the CPSF5 (NUDT21) subunit of the Cleavage Factor (CF), which collaborates with the cleavage and polyadenylation specificity factor (CPSF) to control transcript cleavage and transcription termination at the poly-adenylation sites of canonical genes; 5) the XRN2 exonuclease, which promotes transcription termination at sites of transcript cleavage. Experiments were carried out in mouse bone marrow-derived macrophages infected with shRNA-expressing retroviruses and activated by lipopolysaccharide (LPS), with LPS expanding the repertoire of highly active enhancers in this system24,31. Data in unstimulated cells were qualitatively comparable (data not shown).
The depletion of WDR82 with two distinct shRNAs resulted in the upregulation of extragenic transcription at an overlapping, high-confidence set of 2,870 regions, including enhancers (n=1,572), transcription start site (TSS)-proximal regions (n=637) and regions downstream of transcription end sites (TES, n=661) (Extended Data Figure 1 and Supplementary Table 1). The depletion of the other termination factors tested resulted in detectable increases in extragenic transcription, but the effects observed at WDR82-sensitive enhancers and TSS were considerably smaller than those found in cells depleted of WDR82 (Extended Data Figure 1), in spite of overall similar depletion efficiencies (Supplementary Figure 1). Among the factors tested, the depletion of INTS11 mildly increased the abundance of slightly longer enhancer-generated transcripts which is in line with the proposed role in transcription termination at enhancers28 while it caused strong termination defects at snRNA genes, which were instead unaffected by WDR82 depletion (Extended Data Figure 1).
Overall, from both a qualitative and a quantitative point of view, the transcriptional phenotypes caused by the depletion of WDR82 were not recapitulated by the depletion of other termination factors, hinting at distinct molecular mechanisms.
A conserved WDR82-ZC3H4 complex controls transcription termination
To determine the molecular basis of WDR82-dependent suppression of extragenic transcription, we sought to identify WDR82 interactors that may be responsible for this activity. In addition to SET1 and PNUTS-PP1 complex components26,32, previous analyses of WDR82 immuno-precipitates by mass spectrometry identified a large protein of unknown function, initially named C19ORF7 and currently annotated as ZC3H426. ZC3H4 was not co-immunoprecipitated when PNUTS-PP1 or SET1 complex components were used as baits32.
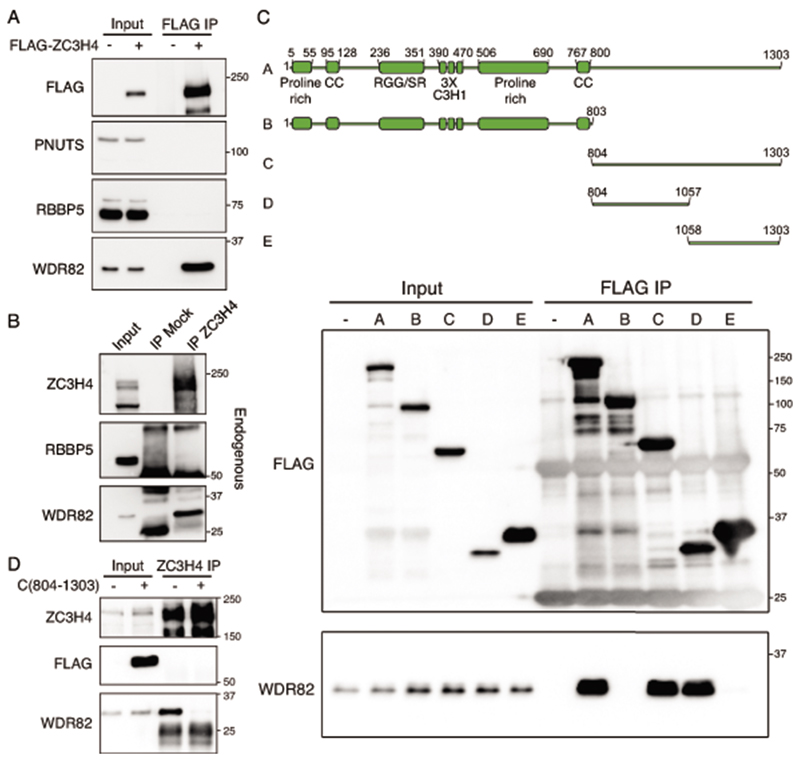
To validate the existence of a WDR82-ZC3H4 complex, we carried out co-immunoprecipitation experiments either on extracts of HEK-293 cells transduced with a Flag-ZC3H4 expression vector or extracts from untransfected Raw264.7 mouse macrophages (Extended Data Figure 2). The anti-FLAG and anti-ZC3H4 immuno-precipitates were blotted with antibodies specific for WDR82, the SET1 complex component RBBP5, and PNUTS. ZC3H4 efficiently co-precipitated WDR82 but neither RBBP5 or PNUTS, indicating that the WDR82-ZC3H4 complex is a distinct entity.
ZC3H4 is the ortholog of Drosophila Su(s) (Suppressor of sable), which was identified as a suppressor of transcription of a gene in which a 7.5 kb transposon was inserted at the 5’ end of the first exon33,34 and was independently found to form a complex with the Drosophila ortholog of WDR8235. ZC3H4 is a 1303 aa. protein (Figure 1A) found to bind RNA in multiple screens36–38 and containing in the amino-terminus several features characteristic of RNA binding proteins, including three adjacent C3H1 type zinc fingers, which are present in ca. 60 human and mouse RNA-binding proteins39 and a region rich in both SR dipeptides and RG repeats, which commonly mediate protein-RNA interactions40. An internal proline-rich domain (aa. 506-690) showed high homology to a proline-rich region of the SF3A2 splicing factor. ZC3H4 interacted with WDR82 via a carboxy-terminal region devoid of identifiable domains (Extended Data Figure 2). Over-expression of this ZC3H4 carboxy-terminal fragment (aa. 804-1303) abrogated the interaction of endogenous ZC3H4 with WDR82 (Extended Data Figure 2).
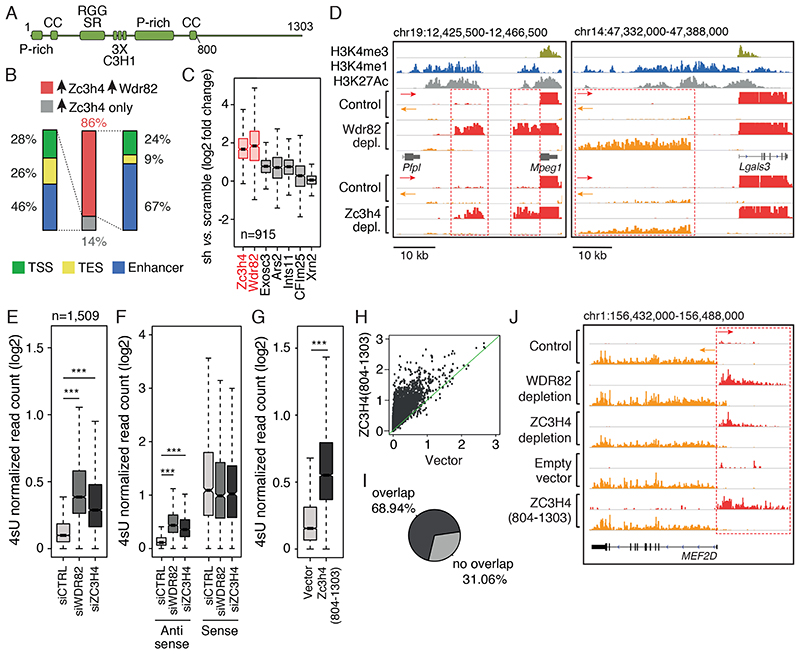
Figure 1. Effects of ZC3H4 depletion on extragenic transcription.
A) Schematic representation of the ZC3H4 protein with annotated domains. P-rich: proline-rich region; CC: coiled-coil; RGG: Arginine-Glycine-rich domain; SR: Arginine-Serine dipeptide-rich motif; C3H1: CCCH type Zn fingers.
B) Overlap between extragenic transcripts upregulated upon ZC3H4 depletion (n=915) and those upregulated upon WDR82 depletion (n=3) in mouse macrophages. Genomic annotation of transcripts concordantly upregulated upon depletion of ZC3H4 and WDR82 or transcripts upregulated only upon depletion of ZC3H4. TSS = Transcription Start Site; TES = Transcription End Site. Data from n=3 independent experiments are shown.
C) Effects of the depletion ZC3H4 and other termination factors on transcription of extragenic regions suppressed by WDR82 in mouse macrophages. Data from n=3 independent experiments are shown.
D) Representative genomic regions showing the effects of WDR82 and ZC3H4 depletion on extragenic transcription in macrophages. Red and orange tracks correspond to plus and minus strand RNAs, respectively.
E) Upregulation of extragenic transcription in HeLa cells depleted of WDR82 or ZC3H4 by siRNA transfection. Read counts at n=1,513 extragenic regions upregulated in HeLa cells depleted of WDR82 are reported. Data from n=3 independent experiments are shown. Statistical significance was assessed using the two-tailed Wilcoxon signed rank test (p-value < 2.2e-16 in both comparisons). *** = p-value <0.01.
F) Promoter-antisense RNAs (n=429) upregulated in 4sU-seq data sets upon WDR82 or ZC3H4 depletion in HeLa cells. Transcription of the paired sense (coding) RNAs is shown. Data from n=3 independent experiments are shown. Statistical significance was assessed using the two-tailed Wilcoxon signed rank test for the comparison between siWDR82 vs. siCTRL (p-value=1.9e-210) and siZC3H4 vs siCTRL (p-value=1.1e-203). *** = p-value <0.01.
G) Effects of ZC3H4(804-1303) overexpression on transcription of the n=1,509 extragenic regions upregulated in WDR82-depleted HeLa cells. Data from n=3 independent experiments are shown. Statistical significance was assessed using the two-tailed Wilcoxon signed rank test (p-value < 2.2e-16).
H) Same data as in panel G were represented as scatter plot.
I) Overlap of the transcripts upregulated upon over-expression of ZC3H4(804-1303) and the transcripts upregulated in HeLa cells depleted of WDR82 or ZC3H4.
J) A representative genomic region showing MEF2D sense and promoter-antisense transcription in HeLa cells depleted of WDR82 or ZC3H4 or over-expressing ZC3H4(804-1303).
For panels C, E and F, the median value for each fold change is shown with a horizontal black line. Boxes show values between the first and the third quartile. The lower and upper whisker show the smallest and the highest value, respectively. Outliers are not shown. The notches correspond to ~95% confidence interval for the median.
We depleted ZC3H4 from mouse macrophages by retroviral shRNA delivery and analyzed 4sU-labeled nascent transcripts as above. The depletion of ZC3H4 unveiled an auto-regulatory loop whereby WDR82-ZC3H4 repressed ZC3H4 transcription (Supplementary Figure 2). ZC3H4 depletion caused the upregulation of the 4sU signal at 915 genomic regions that extensively overlapped with the WDR82-suppressed extragenic and TSS-proximal regions (Figure 1B and Supplemental Table 2). The magnitude of the extragenic transcription changes observed upon ZC3H4 depletion were similar to those measured upon depletion of WDR82 (Figure 1C). The visual inspection of the data on the genome browser confirmed that the depletion of ZC3H4 and WDR82 caused similar effects (Figure 1D). A clear divergence of effects was found only at TES, where most of the read-through events determined by WDR82 depletion were not recapitulated in cells depleted of ZC3H4 (Supplemental Table 2). Selective control of read-through transcription at TES by WDR82 may depend on its interaction with PNUTS-PP1, a component of the pre-mRNA 3’ processing complex41 whose depletion causes termination defects at TES24,42.
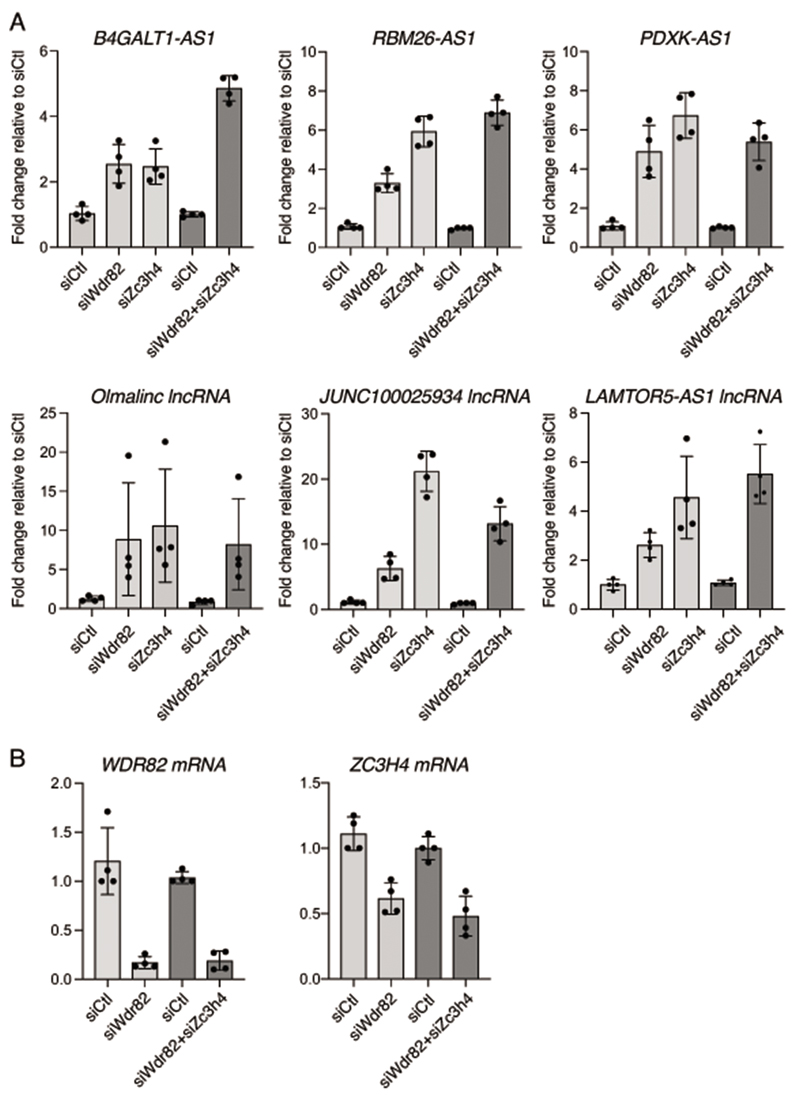
To determine whether the main findings obtained in mouse macrophages could be reproduced also in other cell types, we depleted WDR82 and ZC3H4 in HeLa cells by transfection of siRNAs (Supplementary Figure 3) and we generated 4sU RNA-seq data sets (Supplemental Table 3). 1,509 extragenic regions were upregulated upon WDR82 depletion and 1,494 upon ZC3H4 depletion (Figure 1E) with a high overlap (53% of the WDR82-repressed regions overlapped those repressed also by ZC3H4 and 55% of those repressed by ZC3H4 overlapped the regions sensitive to WDR82). Co-depletion of WDR82 and ZC3H4 did not cause significant additive effects at the extragenic regions tested (Extended Data Figure 3). Consistent with the preferential effects of WDR82-ZC3H4 on extragenic transcripts, when considering sense (coding) / antisense (non-coding) transcript pairs, we nearly invariably detected the strong upregulation of the promoter anti-sense RNA in the absence of any detectable effect on the associated sense transcript (Figure 1F).
We next used 4sU-seq to test the effects of the disruption of the WDR82-ZC3H4 complex. Over-expression of the ZC3H4(804-1303) deletion mutant in HeLa cells caused the upregulation of a large set (n=2,475) of extragenic transcripts that extensively overlapped (68.9%) those upregulated upon WDR82 or ZC3H4 depletion (Figure 1G–I and Supplemental Table 3). A representative snapshot is shown in Figure 1J. Overall, these data indicate that the WDR82-ZC3H4 complex is a repressor of extragenic transcription.
Recruitment of WDR82 and ZC3H4 at sites of high RNA Polymerase II occupancy
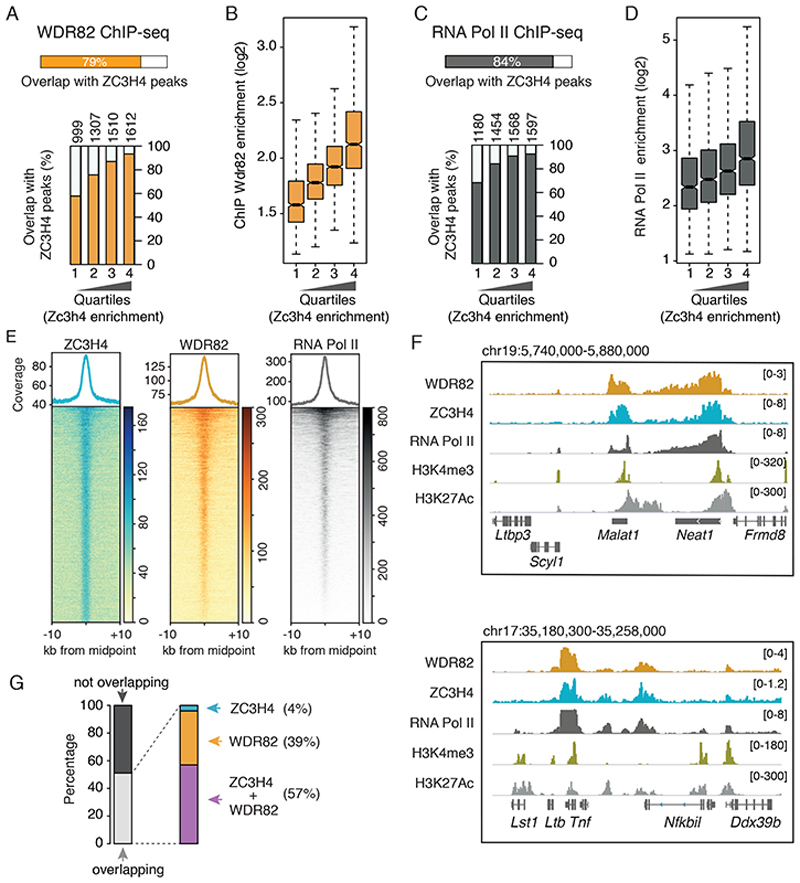
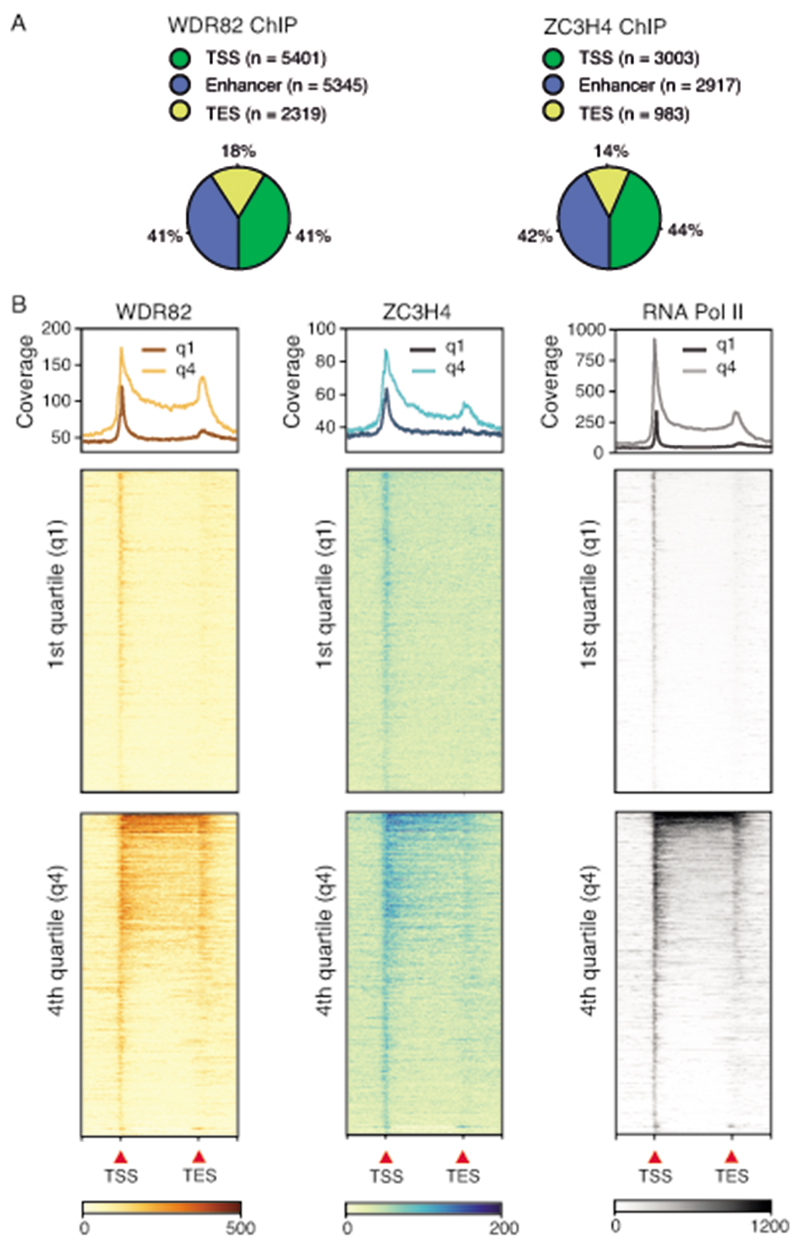
We next used ChIP-seq to determine the genomic distribution of WDR82 and ZC3H4 and their overlap. By intersecting two biological ChIP-seq replicates generated for each protein in mouse macrophage Raw264.7 cells, we obtained a high-confidence set of 13,065 genomic regions bound by WDR82 and a set of 6,903 sites bound by ZC3H4, distributed over genes and extragenic regulatory regions (Extended Data Figure 4). The ZC3H4 peaks showed extensive overlap with WDR82 peaks (Figure 2A and Supplemental Table 4). The overlap with WDR82 (Figure 2A ) and the intensity of the WDR82 peaks (Figure 2B) increased progressively with the increase in the ZC3H4 signal, as shown by dividing the ZC3H4 ChIP-seq peaks into quartiles of increasing signal intensity.
Figure 2. Recruitment of the ZC3H4-WDR82 complex to genomic sites with high RNA Pol II occupancy in mouse macrophages.
A) Overlap of WDR82 peaks with ZC3H4 peaks in Raw264.7 mouse macrophages. Below, ZC3H4 peaks were divided into quartiles of increasing signal intensity with respect to the input and the overlap of WDR82 with ZC3H4 peaks in each quartile was measured.
B) Signal intensity of WDR82 ChIP-seq peaks was measured at ZC3H4-bound genomic regions, divided into quartiles of increasing ZC3H4 signal. Data from n=2 independent ChIP-seq experiments are shown.
C) Overlap of RNA Pol II with ZC3H4 peaks. Below, ZC3H4 ChIP-seq peaks were divided into quartiles of increasing signal intensity and the overlap of RNA Pol II with ZC3H4 peaks in each quartile was measured.
D) Signal intensity of RNA Pol II peaks was measured in ZC3H4-bound genomic regions, divided into quartiles of increasing ZC3H4 signal. Data from n=2 independent ChIP-seq experiments are shown.
E) WDR82 and RNA Pol II ChIP-seq signals are shown in correspondence of the midpoint (+/− 10kb) of the ZC3H4 peaks. The heatmap was ordered based on the increasing coverage of RNA Pol II inside ZC3H4 peaks. For more details see the Online Methods.
F) Two representative genomic regions showing the overlap between WDR82, ZC3H4 and RNA Pol II in Raw264.7 mouse macrophages. H3K4me3 and H3K27Ac are also shown.
G) Overlap between the n=2,870 extragenic regions at which transcription was upregulated upon WDR82 depletion with WDR82 and/or ZC3H4 ChIP-seq peaks.
For panels B and D, the median value for each fold change is shown with a horizontal black line. Boxes show values between the first and the third quartile. The lower and upper whisker show the smallest and the highest value, respectively. Outliers are not shown. The notches correspond to ~95% confidence interval for the median.
84% of the ZC3H4 peaks overlapped with RNA Pol II (Figure 2C). Both the overlap with, and the intensity of the RNA Pol II ChIP-seq peaks increased from the first to the fourth quartile of ZC3H4 occupancy, indicating that ZC3H4 is recruited to sites of high RNA Pol II occupancy (Figure 2C, D). The WDR82 and RNA Pol II signals at regions bound by ZC3H4 is shown in the heatmaps in Figure 2E and representative snapshots are reported in Figure 2F.
We next analyzed whether the genomic regions where transcription increased upon WDR82 or ZC3H4 depletion were bound by these two proteins. When considering the 2,870 regions upregulated by WDR82 depletion, 51% of them were bound by ZC3H4 and/or WDR82 (Figure 2G). The presence of a fraction of genomic regions in which increased transcription was not associated with direct binding of WDR82 or ZC3H4 may depend on issues related to the distinct signal-to-noise ratios and analytical thresholds in 4sU-seq and ChIP-seq experiments, although other explanations cannot be excluded.
WDR82 and ZC3H4 suppress lncRNAs transcribed from enhancers and promoters
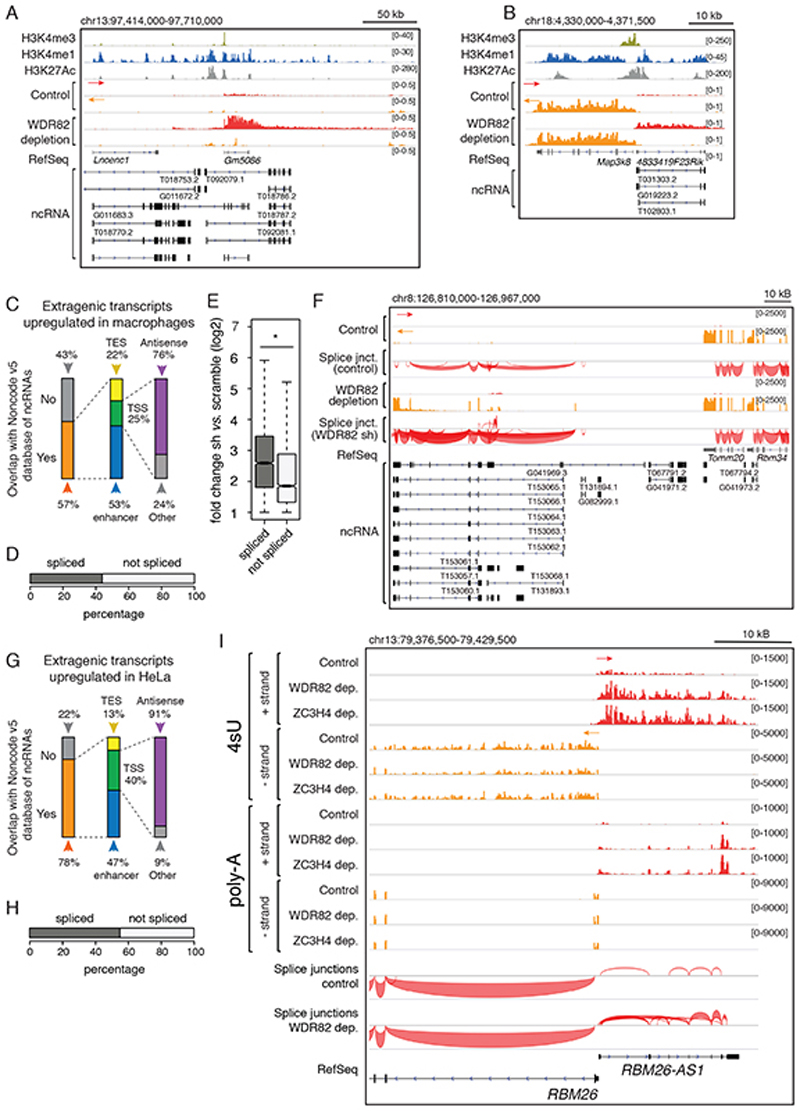
Two main considerations prompted us to analyze the interplay between WDR82-ZC3H4 and lncRNAs generated by cis-regulatory elements such as enhancers and promoters. First, both at highly acetylated enhancers and upstream of active genes the depletion of WDR82 enabled long-range RNA Pol II elongation associated with the gain of Ser2 phosphorylation at the CTD24. Second, most lncRNAs are generated from putative enhancers16 and as antisense transcripts from promoters43, namely from genomic regions where depletion of WDR82-ZC3H4 resulted in increased transcription. Since elncRNAs and pa-lncRNAs are expressed at very low levels16, we considered the possibility that they might be suppressed by WDR82-ZC3H4. We analyzed the overlap of TSS-proximal regions and enhancers subjected to WDR82-ZC3H4 transcriptional suppression with the extensive collection of lncRNAs annotated in the NONCODE v5 database. Visual inspection of the data showed that at both enhancers and promoters, many regions suppressed by WDR82-ZC3H4 overlapped annotated lncRNAs (Figure 3A, B and Supplemental Table 5). The 2,870 regions whose transcription was upregulated upon WDR82 depletion overlapped NONCODE v5 lncRNAs in 57% of cases, with a prevalence of elncRNAs and pa-lncRNAs (Figure 3C). Therefore, lncRNAs generated both at enhancers and at promoters of protein-coding genes were targets for WDR82-ZC3H4-mediated suppression.
Figure 3. Control of lncRNA production by WDR82-ZC3H4.
A-B) A representative candidate enhancer (A) and promoter (B) showing the overlap of WDR82-suppressed transcription with annotated lncRNAs in macrophages.
C) Overlap between WDR82-suppressed extragenic transcripts (n=2,870) in mouse macrophages and lncRNAs in the NONCODE v5 database. TSS = Transcription Start Site; TES = Transcription End Site.
D) Transcripts upregulated upon WDR82 depletion in 4sU RNA-seq data in mouse macrophages (n=2,870) were classified as spliced (n=1,292) or unspliced (n=1,578) based on polyA RNA-seq data.
E) Signal intensity of spliced and unspliced WDR82-suppressed transcripts detected in 4sU-seq data in mouse macrophages (n=4 independent experiments). The median value for each fold change is shown with a horizontal black line. Boxes show values between the first and the third quartile. The lower and upper whisker show the smallest and the highest value, respectively. Outliers are not shown. The notches correspond to ~95% confidence interval for the median. Statistical significance was assessed using the two-tailed Wilcoxon rank sum test (p-value=2.1e-92). * = p-value < 0.01.
F) PolyA-RNA-seq snapshot from mouse macrophages showing splice junctions at a representative genomic region containing lncRNAs whose expression was increased upon WDR82 depletion.
G) Overlap between transcripts upregulated in 4sU-seq datasets from HeLa cells depleted of WDR82 (n=1,509) and lncRNAs annotated in NONCODE v5.
H) Transcripts identified as upregulated in 4sU RNA-seq data in HeLa cells depleted of WDR82 (n=1,509) were classified as spliced (n = 850) or unspliced (n = 659) based on polyA RNA-seq data.
I) Representative genomic region showing a coding gene (RBM26) and the associated promoter-antisense transcription in HeLa cells depleted of WDR82 or ZC3H4. Strand-specific 4sU-seq and polyA RNA-seq data are shown.
To determine if, and how many extragenic regions upregulated in the 4sU-seq data generated spliced and polyadenylated transcripts, we produced strand-specific polyA RNA-seq datasets at high sequencing depth. In macrophages, 45% of the upregulated extragenic regions generated transcripts with at least one splice junction (Figure 3D and Supplemental Table 6). Presence of splice junctions correlated with significantly higher induction in WDR82-depleted macrophages (Figure 3E). A representative snapshot is shown in Figure 3F.
In HeLa cells 78% of the 4sU-labeled regions upregulated upon WDR82 depletion overlapped annotated lncRNAs (Figure 3G and Supplemental Table 7) and in polyA RNA-seq data 56% of them contained transcripts with one or more splice junctions (Figure 3H and Supplemental Table 8). A representative snapshot is shown in Figure 3I.
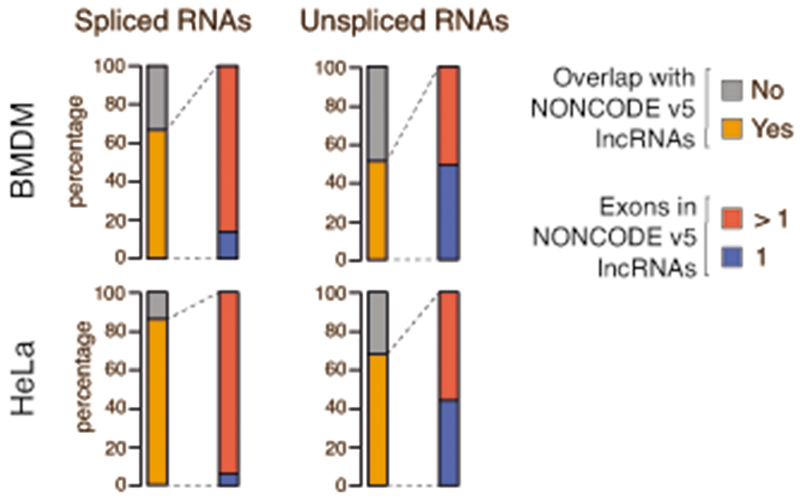
When considering spliced and unspliced transcripts separately, most of the spliced ones overlapped annotated multi-exonic lncRNAs (Extended Data Figure 5). Instead, about half of the unspliced transcripts regulated by WDR82-ZC3H4 overlapped annotated lncRNAs and among these 50% were multi-exonic. Therefore, lack of detectable splicing in a fraction of WDR82-ZC3H4-suppressed lncRNAs may reflect sensitivity issues related to the combination of low splicing efficiency and low expression of these transcripts.
Overall, transcripts suppressed by WDR82-ZC3H4 were often long and spliced RNAs.
lncRNAs upregulated by WDR82 depletion contain inefficiently spliced exons
These data hint at a termination activity of WDR82-ZC3H4 on transcription triggered by cis-regulatory elements located in close proximity to one or more non-coding exons. Moreover, the asymmetry of the effects of WDR82 depletion at bidirectional promoters directing transcription of a sense/antisense (coding/non-coding) pair suggests that fundamental differences in transcriptional or co-transcriptional processes that occur inside vs. outside genes may underlie sensitivity to WDR82-ZC3H4.
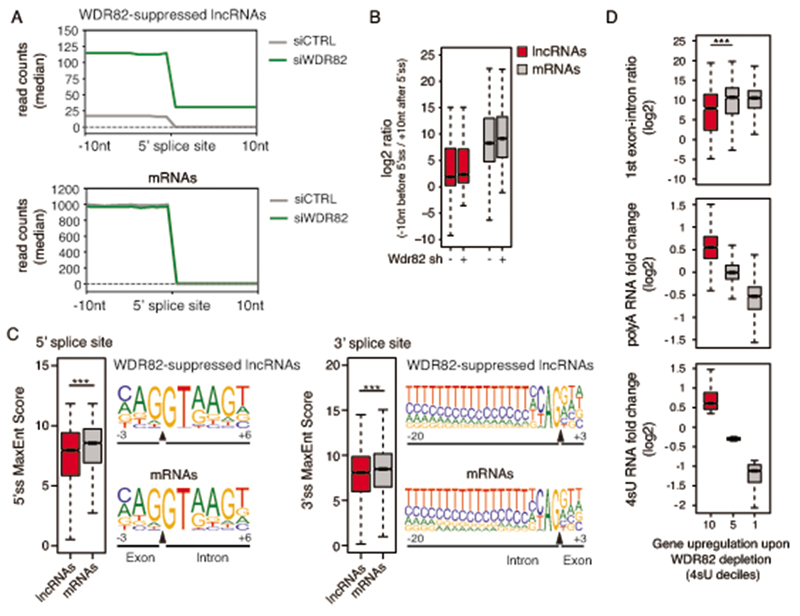
We noticed that poly-adenylated transcripts upregulated upon WDR82 depletion presented a chaotic splicing pattern due to the large variation in the usage of splice donor and acceptor sites. Chaotic splicing was associated with high abundance of intronic reads (Figure 3F, I). These two features suggest inefficient splicing and are consistent with reports showing that exons of lncRNAs are characterized by a massive splicing diversity44 and a lower splicing efficiency compared to the exons of protein coding genes45.
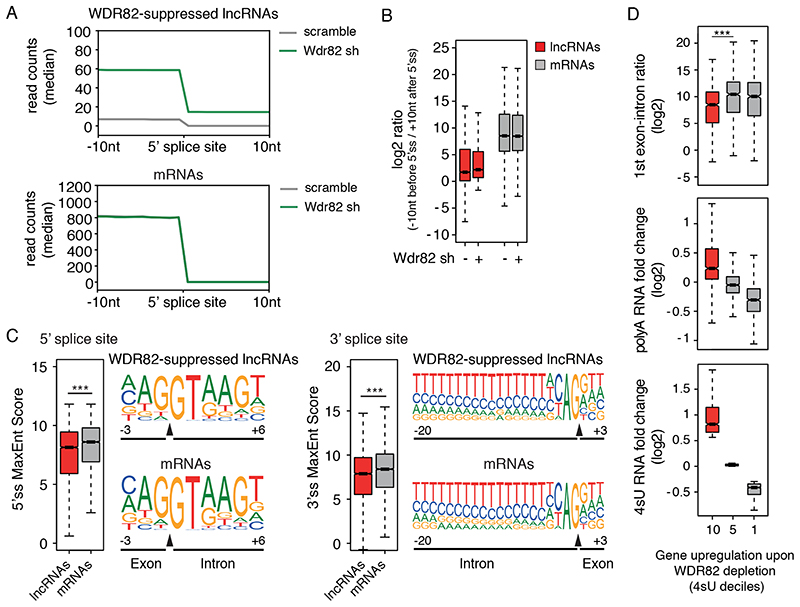
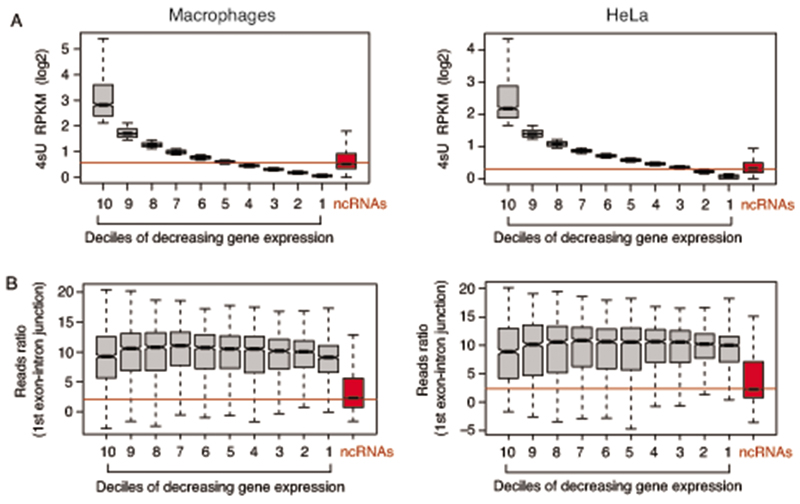
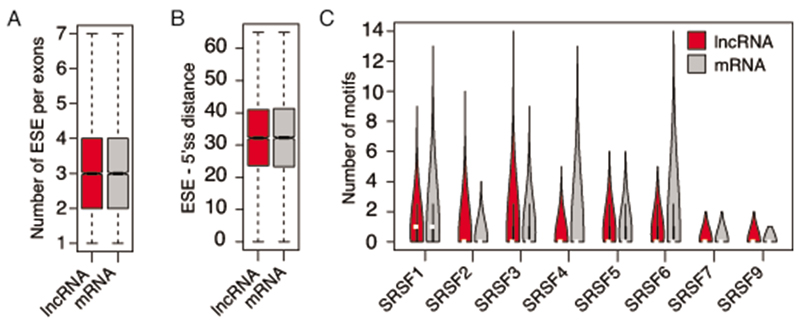
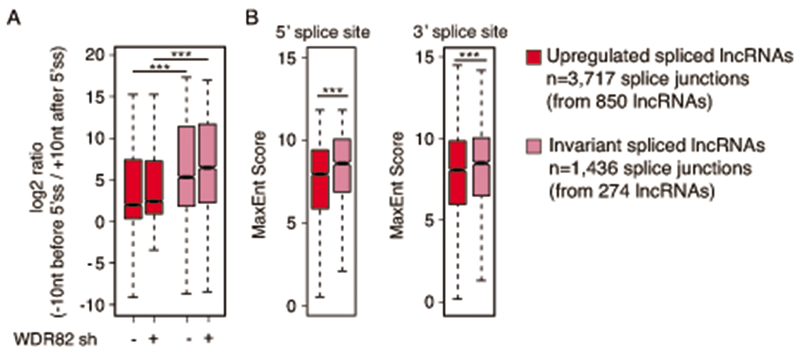
We analyzed the splice junctions of WDR82-sensitive extragenic transcripts vs. the splice junctions of mRNAs. Compared to protein-coding transcripts, the junctions of non-coding transcripts upregulated upon WDR82 depletion both in macrophages (Figure 4A, B) and in HeLa cells (Extended Data Figure 6) revealed inefficient splicing, as indicated by the reads ratio in a 20 nt window centered on the 5’ splice site junction. Low splicing efficiency was also evident when comparing WDR82-sensitive lncRNAs with mRNAs with similar expression levels (Extended Data Figure 7), indicating that the distinctive splicing properties of elncRNAs and pa-lncRNAs were not determined by their low level of expression. The sequence motifs of the donor and acceptor splice sites in WDR82-ZC3H4-sensitive lncRNAs and in mRNAs were overall similar (Figure 4C and Extended Data Figure 6). However, the strength of the splice signals as measured by Maximum Entropy Modeling46 was significantly, albeit only moderately lower at both the 5’ and at the 3’ splice sites of WDR82-ZC3H4-suppressed extragenic transcripts as compared to mRNAs (Figure 4C and Extended Data Figure 6). Conversely, the density of ESE motifs47,48 associated with the exons of WDR82-sensitive lncRNAs and of mRNAs was identical (Extended Data Figure 8). When considering a set of spliced extragenic transcripts that were insensitive to WDR82 depletion, both splicing efficiency and strength of the splice sites were greatly and significantly higher compared to WDR82-sensitive transcripts (Extended Data Figure 9).
Figure 4. lncRNAs suppressed by ZC3H4-WDR82 contain inefficiently spliced exons.
A) Splicing efficiency at junctions (n=6,280) of WDR82-sensitive lncRNAs (top) and at a randomly selected set of mRNA junctions (n = 6,500) (bottom) in mouse macrophages. A window of +/− 10 nucleotides centered on the 5’ splice sites was used to measure read counts in polyA RNA-seq data.
B) log2-transformed ratio of polyA RNA-seq reads in a window of 20 nucleotides centered on the 5’ splice sites of WDR82-suppressed lncRNA (n=6,280) and of randomly selected set of mRNAs (n = 6,500) with at least one splice junction.
C) Analysis of 5’ (left) and 3’ (right) splice site strength at WDR82-suppressed lncRNAs (n=6,280 junctions) and randomly selected mRNA (n=6,500 junctions). MaxEnt scores were measured as described46. Statistical significance was assessed using the two-tailed Wilcoxon rank sum test in correspondence of both the 5’ (p-value=3.3e-34) and the 3’ (p-value=1.3e-22) splice sites. Nucleotide frequencies at splice sites are shown as sequence logos. Donor and acceptor splice sites are indicated with a black triangle in correspondence of the sequence. *** = p-value < 0.01.
D) Effects of the depletion of WDR82-ZC3H4 on transcription of protein coding genes in mouse macrophages. Expressed protein-coding genes (n=9,466) were divided into deciles based on their sensitivity to the depletion of WDR82 in the 4sU-seq data, with the 10th decile including the most upregulated genes. The log2-transformed RNA fold changes (polyA and 4sU RNA-seq data) and the log2-transformed reads ratio across the first exon-intron junction are shown for the genes (n=946 in each group) in the 10th, 5th and 1st deciles. Statistical significance was assessed using the two-tailed Wilcoxon signed rank test (p-value=4.5e-22). * = p-value < 0.01. Data were from n=3 independent experiments.
For panels B, C and D, the median value for each fold change is shown with a horizontal black line. Boxes show values between the first and the third quartile. The lower and upper whisker show the smallest and the highest value, respectively. Outliers are not shown. The notches correspond to ~95% confidence interval for the median.
Protein-coding genes were in general poorly sensitive to WDR82-ZC3H4-mediated repression24 although upregulation upon WDR82 depletion was observed in some cases, as exemplified by the case of ZC3H4 (Supplementary Figure 2). However, by dividing them into deciles based on their sensitivity to WDR82-ZC3H4 depletion, we found that the most WDR82-repressed genes were characterized by low splicing efficiency in their first exon in both macrophages and HeLa (Figure 4D and Extended Data Figure 6), thus strengthening the correlation between inefficient splicing and WDR82-ZC3H4-mediated suppression.
Transcription termination by WDR82-ZC3H4 requires the first exon of lncRNAs
Transcription termination by WDR82-ZC3H4 appears to be an early event during transcription elongation since the corresponding extragenic transcripts produced in cells expressing WDR82-ZC3H4 are short24. Therefore, the possibility exists that the signals determining sensitivity to WDR82-ZC3H4 are close to the 5’ end of the transcript, either residing in the anti-sense promoter or at the beginning of the nascent transcript.
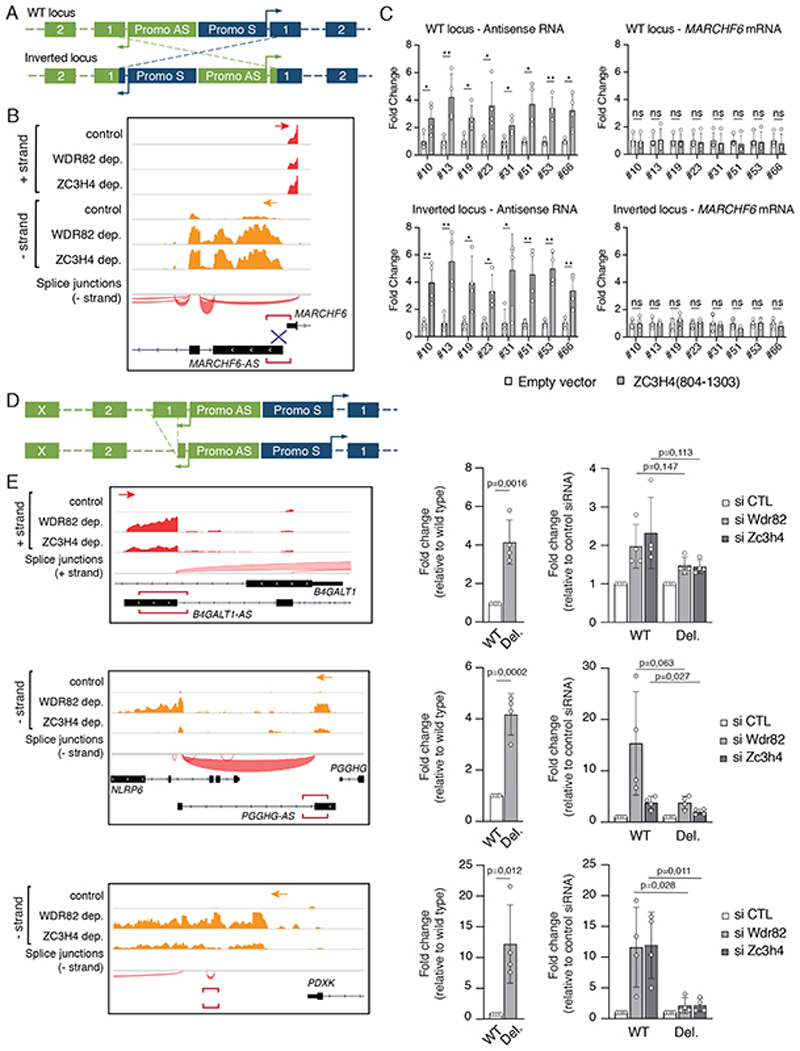
To address this issue, we used Crispr/Cas9 to generate HeLa cell clones bearing inversions of the promoters (including the TSSs) of a sense/anti-sense transcriptional unit so that the sense (coding) promoter was placed upstream of the non-coding unit and vice versa (Figure 5A). In this manner, we determined if sensitivity to WDR82-ZC3H4 was encoded in the promoter of the anti-sense transcript. The MARCHF6 sense-antisense unit was selected because it contains an anti-sense non-coding transcript highly sensitive to WDR82-ZC3H4 depletion (Figure 5B) as well as appropriately located DNA sequences amenable to targeting by sgRNAs with high specificity. We engineered multiple (n=8) clones containing one inverted allele and one wild type allele (Supplementary Figure 4) and tested the effects of the overexpression of the ZC3H4 C-terminal fragment (aa. 804-1303) on the sense and the antisense transcripts. After promoter inversion, the non-coding unit remained sensitive, and the coding unit resistant, to WDR82-ZC3H4 depletion, respectively (Figure 5C), thus showing that susceptibility to WDR82-ZC3H4-mediated suppression was not determined by the pa-lncRNA promoter.
Figure 5. A first exon transcription termination checkpoint.
A) Schematic drawing showing promoter/TSS inversions at sense/antisense transcription units.
B) Snapshot of the MARCHF6 - MARCHF6-AS genomic locus. Plus strand (red) and minus strand (orange) polyA-RNA-seq data in control, WDR82-depleted and ZC3H4-depleted HeLa cells are shown.
C) Effects of the over-expression of ZC3H4(804-1303) on the sense and antisense transcriptional units of the MARCHF6 locus at wild type and promoter-inverted alleles. Data are shown as mean ± s.d. from n=4 independent experiments. *P < 0.05, ** P < 0.01, by two tailed t-test.
D) Schematic drawing showing the deletion of the first exon of pa-lncRNAs generated using Crispr/Cas9 in HeLa cells.
E) Effects of first exon deletion on pa-lncRNA transcription. On the left, polyA-RNA-seq data in control, WDR82-depleted and ZC3H4-depleted HeLa cells are shown (plus strand RNA: red; minus strand RNA: orange). The genomic regions deleted by Crispr-Cas9 are indicated by red horizontal square brackets. Effects of WDR82 or ZC3H4 depletion on the transcription of the wild type (WT) or first exon-deleted (Del.) pa-lncRNAs are shown on the right. The bar plots show the mean s.d. of RNA fold changes measured in n=4 independent experiments. P values obtained by two-tailed t-test are shown for the indicated comparisons. All the data were normalized based on the housekeeping gene NRSN2 or CDC25B.
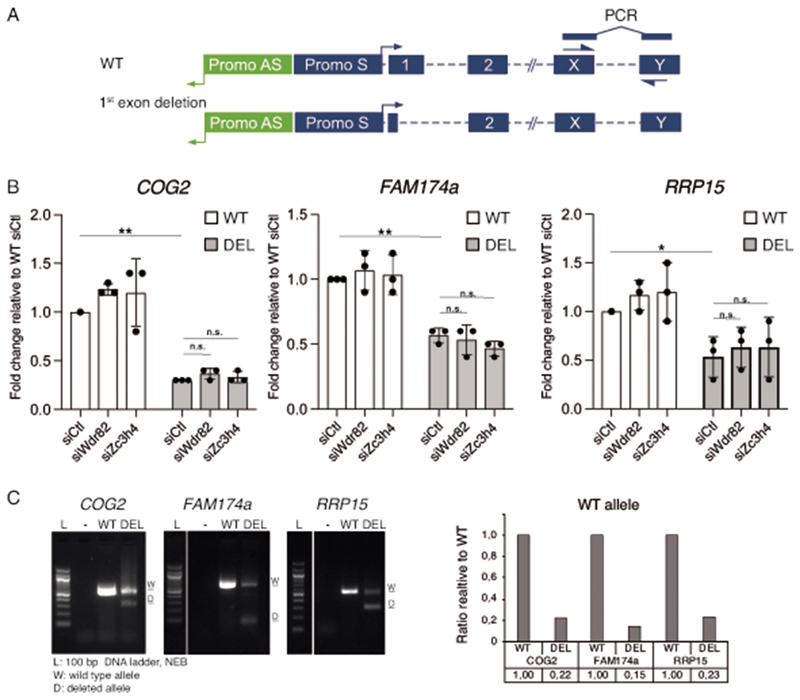
Having excluded a role for the promoter, we hypothesized that the cis-acting elements required to terminate transcription and generating sensitivity to WDR82-ZC3H4 depletion resided in the very 5’ of the nascent RNAs. To challenge this model, we analyzed the effects of the deletion of the first exon of several pa-lncRNAs on transcription and sensitivity to WDR82-ZC3H4 depletion in HeLa cells. Deletions were generated using Cas9 and sgRNAs designed to remove the first exon from ca. 30 nt after the TSS of the antisense transcript (based on CAGE-seq data) to intronic sequences just downstream of the 5’ splice site (Figure 5D). After checking for deletion efficiency (Supplementary Figure 5), bulk populations of cells were transduced with WDR82 siRNAs, ZC3H4 siRNAs or scramble siRNAs and levels of the corresponding pa-lncRNAs were measured by RT-qPCR. At the B4GALT1-AS1 and PGGHG-AS1 lncRNAs, deletion of the first exon strongly increased basal transcription (Figure 5E), suggesting the relief from a termination checkpoint. A similar effect was detected upon deletion of inefficiently spliced sequences of a lncRNA extending antisense from the PDXK gene promoter (Figure 5E). At the same time, sensitivity to the depletion of WDR82 or ZC3H4 was strongly attenuated in first exon-deleted cells (Figure 5E). Importantly, deletion of the efficiently spliced first exon of protein-coding genes caused the opposite effect, namely transcriptional attenuation, but it did not result in gain of sensitivity to WDR82 or ZC3H4 depletion (Extended Data Figure 10), indicating that loss of strong splicing signals is not sufficient to render a transcriptional unit sensitive to WDR82-ZC3H4-dependent termination.
Overall, these results indicate that the first exon of inefficiently spliced lncRNAs generated by cis-regulatory elements is required to trigger the WDR82-ZC3H4-mediated transcription termination checkpoint.
Discussion
Our data show that the first exon of elncRNAs and pa-lncRNAs triggers a WDR82-ZCH4-mediated termination checkpoint that restrains non-coding transcription in the genome. This checkpoint appears to have evolved from an ancestral mechanism present in flies, wherein WDR82 and its partner Su(s) (Suppressor of sable, the ortholog of ZC3H4), suppress transcription from genes in which splice signals in the first exon of protein coding genes have been disrupted by transposon insertions33,34.
Although most gene promoters appear to be bidirectional and to also generate a plethora of both short and long antisense RNAs43,49,50, they drive sense transcription much more efficiently than antisense transcription. An explanation for promoter directionality is the higher density of poly-A signals (PAS) in the antisense relative to the sense transcript, combined with the suppression of PAS usage inside genes because of the presence of motifs recognized by the spliceosomal U1 snRNP51–53. A similar mechanism may underlie the inefficient transcription of e-lncRNAs. However, data shown in this study indicate that in the absence of WDR82-ZC3H4, PAS-mediated termination did not suffice to efficiently prevent extragenic RNA Pol II elongation and the generation of long promoter-antisense and enhancer-driven transcripts.
Indeed, our data point to the existence of an additional dominant mechanism possibly based on the direct sensing of inefficiently spliced first exons and the subsequent delivery of a termination signals to RNA Pol II. Based on our results, we propose the following working hypothesis. As shown by the extensive overlap with RNA Pol II ChIP-seq signals, the WDR82-ZC3H4 complex is systematically tethered to sites of transcription initiation, possibly via WDR82 binding to Ser5-P in the CTD of the initiating RNA Pol II. The N-terminal domains of ZC3H4 such as the C3H1 zinc fingers and the RS- and RG-rich domain may then directly recognize specific cis-acting elements in the nascent RNAs, such as imperfect 5’ splice sites, as reported for Su(s)54. Cross-talk with the splicing machinery may be enabled by the interaction of Ser5-P RNA Pol II with spliceosomal components55,56 as well as by direct interactions of ZC3H4 with exon-definition complexes (as suggested by datasets from ref.57). The inefficient resolution of splicing, and thus the persistence of the splicing machinery onto the nascent RNA, may underlie the delivery of termination signals to the early elongating RNA Pol II. It would thus be tempting to describe this mechanism as a first exon “quality” checkpoint, but the precise identity of the RNA sequence features underlying the relative inefficiency of splicing of extragenic exons has remained elusive insofar.
An important issue is the evolutionary origin of the exons of e-lncRNAs and pa-lncRNAs that are subjected to the WDR82-ZC3H4-mediated checkpoint. A possibility is that these exons were generated from transposable elements (TEs), such as non-functional relics of retrotransposons58. Cooption of TE-derived exons to cis-regulatory elements may have been positively selected to enable the positive feedback of the splicing machinery onto the transcriptional machinery. Indeed, differently from protein-coding genes, exons and splicing junctions of lncRNAs have a high content of sequences derived from TEs59. Moreover, lncRNAs devoid of TEs are expressed at higher levels than those containing these sequences59, possibly implying that TE-derived sequences may negatively control their transcription. The notion that the termination checkpoint controlled by WDR82-ZC3H4 mainly operates on TE-derived sequences is also consistent with the observation that in Drosophila the WDR82-Su(s) complex suppresses transcription from genes containing a transposon inserted at their very 5’ end33,34. Therefore, the WDR82-ZC3H4 suppressive pathway may have initially appeared in evolution to limit transcription of TEs in the relatively compact genomes of higher eukaryotes, with its function being subsequently coopted in large genomes for the negative control of pervasive transcription initiated by highly active cis-regulatory elements associated with lncRNA exons.
Finally, a central question is the biological relevance of the transcription termination mechanism described in this study: is the extensive prevention of extragenic RNA Pol II elongation by WDR82-ZC3H4 an essential homeostatic process in higher eukaryotes and specifically in mammals? In keeping with a critical biological role of the first exon termination checkpoint described here, heterozygous loss of function mutations of ZC3H4 are strongly counter-selected in the human population, as indicated by the analysis of thousands of whole exome data60. The precise biological impact of this pathway, however, will require extensive ad hoc investigation in cells and animals.
Methods
Cells and culture
Bone marrow isolation from female mice (age 6-8 weeks, FVB/Hsd strain from Envigo) was performed in accordance with the Italian Laws (D.L.vo 116/92 and following additions), which enforce the EU 86/609 Directive. All animal procedures were approved by the OPBA (Organismo per il Benessere e Protezione Animale) of the Cogentech animal facility at the IFOM-IEO Campus, Milan. Bone marrow derived macrophage (BMDM) cultures were carried out as described61. LPS from E.Coli serotype 055:B5 (cat. no. L4524, Sigma) was used at 10 ng/ml.
HeLa and HEK 293 cells (both from ATCC) were cultured in DMEM with South American serum (10%), Pen/Strep (1%, cat. no. P4333, Sigma) and L-Glutamax (1%, cat. no. 35050061, Gibco). RAW264.7 cells (from ATCC) were cultured in DMEM with North American serum (10%), Pen/Strep (1%) and L-Glutamax (1%). Cell lines were authenticated by the Tissue Culture Facility of IEO using the GenePrint10 System (Promega) and routinely screened for Mycoplasma contamination.
Retroviral shRNA delivery in BMDMs
Retroviral infections were carried out as described62 using the MSCV-based pLMP vector with either a scrambled shRNA or an shRNA specific for the gene of interest. Sequences of all the shRNA oligoes and expression primers used are provided in Supplemental Table 9.
siRNA-mediated knockdown of target genes in HeLa cells
For siRNA-mediated knockdown of WDR82 and ZC3H4 in HeLa cells, siRNAs from Santa Cruz were used: siWdr82 cat. no. sc-78161, siZC3H4 cat. no. sc-97377 and control siRNA a or b (cat. no. sc-37007 or sc-44230). For transfection of the siRNAs, Lipofectamine RNAiMAX reagent (cat. no. 13778150, Thermo Fisher) was used according to the manufacturer’s protocol.
Antibodies for western blots
The following antibodies were used: anti-WDR82 (cat. no. 99751, clone D2I3B, Cell Signaling Technologies), anti-PNUTS (cat. no. A300-440A, Bethyl Laboratories), anti-ARS2 (cat. no. A304-550A, Bethyl Laboratories), anti EXOSC3 (cat. no. Ab156683, Abcam), anti-CFI25m/Nudt21 (cat. no. sc-81109, Sant Cruz Biotechnology), anti-VINCULIN (cat. no. V9131, Sigma), anti-ZC3H4 (cat. no. HPA040934, Sigma) and anti-ACTIN (cat. no. A2547, Sigma). Images were acquired using Chemidoc (Bio-Rad).
Expression vectors
Full-length human ZC3H4 was cloned into pcDNA3.1+N-terminal FLAG (DYK) tag expression vector (Genscript Piscataway, USA). Vectors corresponding to the ZC3H4 C-terminal fragment (aa. 804-1303), the ZC3H4 N-terminal fragment (aa. 1-803), and to the two smaller fragments of the ZC3H4 C-terminal portion (aa. 804-1057 and aa 1057-1303) were PCR-amplified from the full-length cDNA, sequenced and cloned into pcDNA3.1+N-terminal FLAG (DYK).
PolyA-RNAseq and 4sU-RNAseq
For sequencing of poly-adenylated RNA, total RNA was first isolated using the Quick-RNA MiniPrep kit from Zymo Research (R1054) with on-column DNAse I treatment. For isolation of the polyA-RNA fraction, reagents from the TruSeq RNA sample preparation kit were used (Illumina RS-122-2001). Sequencing libraries were prepared from the polyA-RNA fraction using the TruSeq Stranded Total RNA sample preparation kit (RS-122-9007). For preparation of 4sU-RNAseq libraries from macrophages (BMDMs) or HeLa cells, 4-thiouridine (4sU, sc-204628A, Santa Cruz Biotechnology) was added to the medium at a final concentration of 300 μM for 45 min. before harvesting. The labeled RNA was isolated and processed as described24. The nascent 4sU-labelled RNA was extracted from 50 μg of total TRIZOL-isolated RNA. About 1-1,5 % of the total RNA was retrieved in the 4sU-fraction. 100-200 ng of the isolated nascent 4sU-labelled RNA was used for cDNA-library synthesis using the TruSeq Stranded Total RNA Sample Preparation kit (RS-122-9007) with no ribosomal depletion or polyA-selection.
ZC3H4 C-terminus over-expression
Hela cells were transfected with 2.5 μg of the pCDNA3.1-ZC3H4(804-1303) or with the empty vector using Lipofectamine 2000 (cat no. 11668-019 Thermo Fisher). 48 h post transfection, 4-thiouridine (4sU, sc-204628A, Santa Cruz Biotechnology) was added to the medium of the cells at a final concentration of 300 uM for 45 min. before harvesting.
ChIP-seq
For WDR82 and ZC3H4 ChIP we used a double-crosslinking procedure with disuccinimidyl glutarate (DSG, cat. no. A7822,0001, Applichem) followed by formaldehyde-mediated DNA-protein crosslinking. Briefly, 200×106 RAW264.7 cells (stimulated for 45 minutes with LPS at 10 ng/ml) were harvested and resuspended in 10 ml PBS to which DSG (dissolved in DMSO) was added to a final concentration of 2 mM. The crosslinking was performed at room temperature on a rolling wheel for 45 min, followed by two washes in ice-cold PBS. Cells were then resuspended in 10 ml PBS and formaldehyde was added to a final concentration of 1%. Formaldehyde-crosslinking was allowed to proceed for 10 min at room temperature on a rolling wheel. Then, formaldehyde was quenched using 125mM Tris pH 7,4 and cells were pelleted and frozen at −80C until further processing. Cells were lysed and sonicated for immunoprecipitation as previously described61. For 200 × 106 cells, a volume of 6 ml lysis buffer was used for immunoprecipitation with 10 μg of antibody. The following antibodies were used: anti-WDR82 (cat. no. 99751, clone D2I3B, Cell Signaling Technologies) and anti-ZC3H4 (cat. no. HPA040934, Sigma). Library preparation for Illumina sequencing on the NextSeq, was carried out using a described protocol63. The purified DNA libraries were quantified both with the 2100 Bioanalyzer (Agilent Technologies) or Tapestation (Agilent Technologies) and Qubit (LifeTechnologies) and diluted to a working concentration of 10 nM.
Co-immunoprecipitations
Total cell lysates (lysis buffer: 250 mM NaCl, 50 mM Tris-HCl pH 8.0, 0.5 mM EDTA, 0.5 mM EGTA and 0.2% NP-40) were obtained from: 1) wild type RAW264.7 cells; 2) RAW 264.7 cells infected with lentiviruses generated with the pScalp-Puro FLAG-ZC3H4 expression vector; 3) 293T cells transfected with pScalp-Puro FLAG-ZC3H4 expression vector; 4) 293T cells transfected with pCDNA3.1-based vectors encoding FLAG-ZC3H4 or its deletions mutants; 5) Hela cells transfected with pCDNA3.1-Flag-ZC3H4(804-1303) or with empty vector. Between 4 and 10 μg of anti-ZC3H4 antibody (#HPA040934, Sigma) or Rabbit IgG (#011-000-003, ChromPure) were pre-bound to 100 μl of G protein-coupled paramagnetic beads (Dynabeads) in PBS/BSA 0.5%. Beads were then added to the Raw 264.7 cell lysate. Flag-ZC3H4 was immunoprecipitated overnight using 100 μl of anti-Flag agarose beads (#A2220, Sigma). Immuno-precipitates were washed extensively, eluted in Laemmli buffer (Biorad #1610747), resolved by SDS-PAGE and immunoblotted with anti-Flag (#F1804, Sigma), anti-ZC3H4 (# HPA040934, Sigma), anti-WDR82 (#99715, clone D2I3B, Cell Signaling Technologies), anti-PNUTS (#A300-440A, Bethyl Laboratories) and anti-RBPP5 (#A300-109A, Sigma) antibodies.
Promoter inversion experiments
Inversion of a bidirectional promoter was obtained using CRISPR-Cas9 with two sgRNAs targeting the sense and the anti-sense promoter 30-50 nt downstream of each TSSs. This led in most cases to the deletion of the region in between the guides, but at some alleles the promoter was re-ligated in the inverted orientation. sgRNAs were designed using the Benchling software, and ordered from Invitrogen (TrueGuide Synthetic guideRNA). The sgRNAs were first hybridized to tracrRNA, and loaded onto the Cas9 protein according to manufacturer’s instructions (Invitrogen), and transfected into semi-confluent HeLa cells using Lipofectamine CRISPRMAX (Invitrogen). A few days after transfection, the targeted cells were plated at 0.5 cells/well in 96-well plates to obtain single cell clones. Clones were screened by genomic PCR for inversion of the promoter, and clones with one inverted allele were used in the experiments. Clones were transfected with 2.5 μg of the pCDNA3.1-ZC3H4(804-1303) expression vector or with the empty vector using Lipofectamine 2000 (#11668-019 Thermo Fisher). Transfected cells were harvested after 48 h and total RNA was extracted. Total RNA was treated with TURBO DNAse (# AM2238, Invitrogen) and reverse-transcribed with ImProm-II Reverse Transcription System and Random primers. qPCR reactions were assembled with Fast SYBR Green Master Mix using primers designed to specifically detect transcripts generated by the inverted or the wild type alleles. PCR primers were designed to specifically detect transcripts generated by either the wild type or the inverted allele (Supplemental Table 9).
First exon deletion experiments
The first exons of various lncRNAs (B4GALT1-AS1, PGGHG1-AS and PDXK-AS) or coding genes (COG2, FAM174A and RRP15) were deleted using CRISPR-Cas9. Two sgRNAs were designed, one annealing ca.30-50 bp downstream of the TSS, and the other 50-100 bp after the first exon 5’splice site. The TSS was determined based on annotations in the reference human genome hg38 or by CAGE-seq data. sgRNAs were designed using the Benchling software.
sgRNAs were ordered as sense and antisense DNA oligoes and cloned into the pX330-2x1_A or pX330_S plasmid by Golden Gate assembly64, with the two sgRNAs targeting the same locus cloned into the same plasmid. The pX330-plasmid containing the two sgRNAs for a specific region and the Cas9 coding sequence, was transfected into semi-confluent HeLa cells. 3-5 days after targeting, cells were split and treated with siRNAs for Wdr82, ZC3H4, or control siRNA on two consecutive days, and harvested the day after. Transcript levels were determined by RT-qPCR analysis.
Analysis of 4sU-RNAseq data sets
After quality filtering according to the Illumina pipeline, single end reads (51 bp or 76 bp) were aligned to the mm10 or the hg38 reference genomes (GENCODE, https://www.gencodegenes.org/mouse/release_M24.html and https://www.gencodegenes.org/human/release_33.html) using TopHat v2.1.165, allowing up to two mismatches and using the option --b2-very-sensitive --library-type fr-firststrand. Only uniquely mapping reads were retained (–g 1). Indels due to sequencing errors were identified using Bowtie2 v 2.666. Reads originating from the two strands were separated based on the XS:A:+/XS:A:-flag provided by TopHat265.
Identification of differentially expressed extragenic transcripts
We excluded all mapped reads that overlapped by more than 10nt with annotated protein-coding genes according to the GENCODE annotation. SICER v267 was used to detect the extragenic transcripts regulated in cells depleted of individual factors. The entire genome was partitioned into blocks of non-overlapping 500 bp windows with a gap size <1000 nt. An effective genome fraction of 1, a fragment size of 0 and a False Discovery Rate (FDR) cut-off <0.01 were used. In particular, the FDR was calculated using p-value adjusted for multiple testing, following the approach developed by Benjamini and Hochberg. In the SICER analysis, only clustered transcripts with more than 2-fold enrichment with respect to the control and at least 50 reads were retained. For each experiment, only transcripts up-regulated in at least two replicates (out of four in BMDM and three in HeLa) were retained, with a minimum acceptable overlap of 50% between different replicates using the intersecBed function from the BEDTools v2.29.2 suite: –sorted –e –f 0.5 –F 0.568.
Finally, each transcript was assigned to the nearest annotated macrophage enhancer based on available data sets31,69,70 (http://fantom.gsc.riken.jp/5/), or to the nearest TSS/TES proximal regions (https://www.gencodegenes.org/mouse/release_M1.html) using the ClosestBed tool from the BEDTools suite with the parameter -t first68. We indicated as promoter-antisense transcripts all transcripts in reverse orientation relative to the gene TSS, including transcripts arising inside the gene body and transcripts arising from an upstream antisense promoter.
In mouse macrophages, to compare the effects of WDR82 depletion with those of the depletion of other factors, we collected all extragenic transcripts that were upregulated in shRNA-transduced macrophages (shWdr82 n=2,870; shExosc3 n=1,427; shArs2 n=903; shInt11 n=1,135; shCpsf5 n=1,434; shXrn2 n=63). Using as reference the 2,870 extragenic transcripts upregulated in WDR82-depleted cells, we calculated in those regions the log2-transformed fold change (sh vs. scramble) for each depletion experiment.
Counts were collected using the featureCounts v1.6.471 function taking into account the strand specificity (-s 2) and normalizing according to the RPKM (Reads Per Kilobase Million). For each of the transcripts upregulated upon WDR82 depletion, we calculated the fold change relative to control measured upon depletion of the other transcription termination factors tested. We used the same strategy to detect all extragenic transcripts that were upregulated upon ZC3H4 depletion in macrophages (n=915). Using as reference the 915 extragenic transcripts upregulated in ZC3H4-depleted cells, we calculated in those regions the log2-transformed fold change (sh vs. scramble) for each depletion experiment and we represented the median of the fold changes in a boxplot. Statistical significance was assessed using the two-tailed Wilcoxon signed rank test; a p-value ≤ 0.01 was considered significant. A similar strategy was also used for the analysis of data sets from HeLa cells. To determine the proximity of extragenic upregulated transcripts with lncRNAs, we used the intersectBed function from the BEDTools suite, considering strand specificity (parameters: -s –u). For ncRNA annotations, we used the NONCODE v5.0 (http://www.noncode.org/download.php).
Expression of paired mRNAs/promoter-antisense lncRNAs in HeLa cells
4sU-seq data were used for this analysis. We evaluated read counts in sense-coding genes with the featureCounts71 function taking into account the strand specificity (-s 2) and using the GENCODE gene annotation file https://www.gencodegenes.org/human/release_33.html). Counts were normalized according to the Reads Per Kilobase Million (RPKM+1) and finally the fold change for the comparison sh vs scramble was calculated, log2-transformed and represented in a boxplot. Statistical significance was assessed using the two-tailed Wilcoxon signed rank test and a p-value ≤ 0.01 was considered significant.
Analysis of the effects of ZC3H4(804-1303) overexpression in HeLa cells
2,475 transcripts with more than 2-fold enrichment with respect to the control and an FDR <0.01 were retained. FDR was calculated using p-value adjusted for multiple testing, following the approach developed by Benjamini and Hochberg. For each experiment, only transcripts up-regulated in at least two replicates were retained. In correspondence of the 1,509 nascent transcripts upregulated upon WDR82 depletion, we evaluated the read counts in both conditions (transfection of empty vector and of ZC3H4(804-1303) expression vector). Read counts were obtained with the featureCounts71 function taking into account the strand specificity (-s 2). Counts were normalized according to the Fragments Per Kilobase Million (FPKM+1), log2-transformed and represented in a dotplot and a boxplot. Statistical significance was assessed using the two-tailed Wilcoxon signed rank test and a p-value ≤ 0.01 was considered significant.
Analysis of ChIP-seq data sets
Single end reads (76bp) were trimmed and clipped for quality control with Trimmomatic v0.27 (Bolger et al., 2014). Read quality was then checked using FastQC v0.11.8 (http://www.bioinformatics.babraham.ac.uk/projects/fastqc/). High-quality reads were mapped to the mm10 reference genome using Bowtie2 v 2.666. We used default parameters with the options --very-sensitive, --no-unal and with the pre-built bowtie2 index. Only uniquely mapping reads were retained. Peak calling was performed using SICER v267. We identified significantly enriched clusters using a redundancy threshold of 1, a window size of 200 bp, a gap size of 600 bp and a False Discovery Rate (FDR) cutoff of <0.01. FDR was calculated using p-value adjusted for multiple testing, following the approach developed by Benjamini and Hochberg. Fragment size was set to 150 nt and the effective genome fraction to 0.80. Each ChIP was compared to input DNA derived from RAW264.7 mouse macrophages. Regions that overlapped with the blacklists of the ENCODE and modENCODE consortia (https://github.com/Boyle-Lab/Blacklist/blob/master/lists/mm10-blacklist.v2.bed.gz)72 were filtered out. Tracks (*.bigWig files) were generated using bamCoverage from deepTools v.3.1.373.
WDR82 and ZC3H4 genomic occupancy
We considered SICER-blocks with a False Discovery Rate (FDR) cutoff of <0.01 in both replicates, obtaining 13,065 WDR82 peaks and 6,903 ZC3H4 peaks. The overlap of the ZC3H4 peaks vs. WDR82 peaks in relation to the nearest TSS, TES or enhancer is shown as a stacked bar chart.
WDR82 and RNA Pol II genomic occupancy at sites of ZC3H4 binding
We ordered ZC3H4 peaks according to their log2-transformed enrichment with respect to the input and we divided them into quartiles. We checked the occupancy of Pol II and WDR82 in correspondence of ZC3H4 peaks. The number of WDR82 and RNA Pol II peaks in each ZC3H4 quartile was represented as barplots. The total number of RNA Pol II and WDR82 peaks that bound in correspondence of ZC3H4 is represented as barplots. The enrichment of WDR82 and RNA Pol II signals with respect to the input was log2-transformed and represented in a boxplot. Read counts were evaluated using the coverage tool from the BEDTools suite and normalized according to the Reads Per Kilobase Million (RPKM).
Heatmaps of ZC3H4, WDR82 and RNA Pol II ChIP-seq peaks
We used plotHeatmap tools from deepTools v.3.1.373. ComputeMatrix was run in the reference-point mode using as inputs:
-
-
the bed file with the ZC3H4 ChIP-seq peaks ±1 bp from the middle point of the peak (option –R)
-
-
the bigWig format files related to ZC3H4, WDR82, Pol II ChIP-seq (option -S).
Other options that were specified included: -referencePoint center -b 10000 -a 10000 –missingDataAsZero.
For each of the ZC3H4 ChIP-seq regions we calculated the middle point ±1 bp of the peak and generated a bed file. Using as reference this file, we ran the computeMatrix function vs. the Pol II data. A matrix with all RNA Pol II scores associated with the ZC3H4 regions was generated and used as input for the plotHeatmap tool in order to generate the Pol II heatmap. Using the option --sortUsingSamples 1 and –outFileSortedRegions, we sorted the ZC3H4 regions according to the Pol II signal intensity of signal and created an RNA Pol II -sorted reference file that was used as input for generating two matrixes for ZC3H4 and Wdr82 with the computeMatrix function. In this way, all ZC3H4 and Wdr82 coverage values followed the order of Pol II intensity of signal. Then the Wdr82 and ZC3H4 heatmaps were plotted separately for each antibody with the plotHeatmap function (--sortRegions no).
ZC3H4, WDR82 and RNA Pol II occupancy at coding genes in macrophages
We considered 10,917 coding genes annotated in GENCODE and with a log2-transformed enrichment for RNA Pol II of at least two fold with respect to the input. We ordered these genes according to the quartiles of the intensity of the occupancy of RNA Pol II and we selected those belonging to the quartile with the lowest RNA Pol II signals (1st quartile: n=2,730) and those to the quartile with the highest RNA Pol II (4th quartile: n=2,729). The occupancy of ZC3H4 and WDR82 was evaluated in correspondence of the genes belonging to these quartiles.
We used plotHeatmap tools from deepTools v.3.1.373. ComputeMatrix was run in the scale-region mode using as inputs the bed file with the annotated of genes (option –R) and the bigWig format files related to ZC3H4, WDR82, Pol II ChIP-seq (option -S). Other options that were specified included: -b 10000 -a 10000 --regionBodyLength 20000 –missingDataAsZero --bs 100.
For each quartile of RNA Pol II occupancy, a matrix with all Pol II scores associated with each quartile was generated and used as input for the plotHeatmap tool in order to generate the Pol II heatmap. The RNA Pol II sorted reference file was used as input for generating two matrixes for ZC3H4 and Wdr82 with the computeMatrix function. In this way, for each quartile, ZC3H4 and Wdr82 coverage values followed the order of RNA Pol II signal intensity. Then the Wdr82 and ZC3H4 heatmaps were plotted separately for each antibody with the plotHeatmap function (--sortRegions no).
Analysis of PolyA-RNA-seq data sets
Strand specific paired end reads (76 or 51nt) were trimmed to remove the adapter sequences and low-quality bases were discarded using Trimmomatic v0.27 with PE option74. Read quality was then checked for each sample using FastQC v0.11.8. (http://www.bioinformatics.babraham.ac.uk/projects/fastqc/). High-quality reads were aligned to the mm10 (https://www.gencodegenes.org/mouse/release_M24.html) or hg38 (https://www.gencodegenes.org/human/release_33.html) reference genome with TopHatv2.1.1 (–very-sensitive --library-type fr-firststrand -r 200 --microexon-search --no-mixed --no-discordant -g 1 --coverage-search). Indels due to sequencing errors were identifies using Bowtie2 v.2.6.
Analysis of splice junctions in PolyA-RNA seq data
Starting from the junctions.bed file generated by TopHat v2.1.1, we added the left maximal overhang to the left coordinates and we substracted the right maximal overhang to the right coordinates. 291,482 junctions were identified using the mouse GENCODE annotations (https://www.gencodegenes.org/mouse/release_M24.html) and 304,486 using the human annotations (https://www.gencodegenes.org/human/release_33.html). Junctions in correspondence of protein-coding genes were named coding junctions and those with an overlap of 100% with respect to the coding gene were retained. Junctions that did not overlap with any stretch of RNA containing a protein-coding gene were considered non-coding junctions. Only noncoding junctions that overlapped with nascent transcripts up-regulated after WDR82 depletion were retained for the analysis. To measure the overlap between junctions and annotated protein-coding genes, we used the intersectBED function from the bedTool v2.29.2 with parameters -u –s. For the overlap of junctions in correspondence of protein-coding genes we also used the -f 1 parameter.
We measured the splicing ratio in exons of lncRNAs and mRNAs by calculating the average of reads number by centering on the 5’ splice site and considering 10 bases in the exon and 10 bases in the intron.
We used the computeMatrix function (-a 10 -b 10 --missingDataAsZero -bs 1) from deepTools v.3.1.373 using as input the +/− 10 nt extended 5’ss bed file. A matrix was created and used as input for the plotProfile function from deepTools v.3.1.3 (--averageType median).
The log2-transformed ratio between the reads inside the exon and inside the intron was also measured and represented as a boxplot. To evaluate statistical differences between the groups, the two-sided Wilcoxon rank-sum test was applied. A p-value ≤ 0.01 was considered significant. The maximum entropy score in correspondence of the donor (3 bases in the exon, 6 bases in the intron) and the acceptor splice sites (20 bases in the intron and 3 bases in the exon) was generated using MaxEntScan (http://genes.mit.edu/burgelab/maxent/Xmaxentscan_scoreseq.html)46. The sequence logos were generated using WebLogo v2.8.2 (https://weblogo.berkeley.edu/logo.cgi). We used the twoBitToFa v1 tool (https://genome.ucsc.edu/goldenpath/help/twoBit.html) to extract the FASTA format of the primary sequence in correspondence of the splice sites. The sequence of junctions annotated on the negative strand was reversed and complemented using the function fastx_reverse_complement from the fastx-toolkit v0.0.14 (http://hannonlab.cshl.edu/fastx_toolkit/index.html). Statistical differences between the classes were evaluated using the two-sided Wilcoxon rank-sum test. A p-value ≤ 0.01 was considered significant.
Overlap between extragenic transcripts upregulated upon Wdr82 depletion in 4sU-seq data sets and splice junction in polyA-RNA-seq data sets
In order to detect splicing events within transcripts regulated by WDR82 in mouse macrophages, we overlapped the 2,870 transcripts with the list of non-coding junctions (n=24,962). Extragenic transcripts with at least one junction were considered spliced (45%). We evaluated 4sU read counts in spliced and unspliced extragenic transcripts using the featureCounts71 function taking into account the strand specificity (-s 2). Counts were normalized according to the Reads Per Kilobase Million (RPKM) and the fold change was log2-transformed and represented in a boxplot. Statistical differences between the groups were evaluated using the two-sided Wilcoxon rank-sum test was applied. A p-value ≤ 0.01 was considered significant.
Identification of Exonic splice enhancers (ESEs)
Based on a published list of 29 SRSF motifs75, we obtained a total of 312 primary sequences. Starting from 5’splice sites, we extended 70 nt inside the upstream exon. We used twoBitToFa tool (https://genome.ucsc.edu/goldenpath/help/twoBit.html) to extract the FASTA format of the primary sequence in correspondence of those 70 nt. The sequence of junctions annotated on the negative strand was reversed and complemented using the function fastx_reverse_complement from the fastx-toolkit (http://hannonlab.cshl.edu/fastx_toolkit/index.html). Finally, we calculated the total number of ESEs with a perfect match in the region and their distance from the 5’splice sites
Effects of WDR82 depletion on splicing of pre-mRNAs in macrophages and HeLa cells
We selected 9,466 and 8,804 coding genes in BMDM and HeLa, respectively, based on GENCODE annotations and the expression in the scramble/siCTRL condition (FPKM >=0.2 in BMDM and >=0.5 in HeLa in all three replicates). We divided these genes into deciles based on their log2-fold change after WDR82 depletion in 4sU-seq data. We considered genes belonging to the 10th, 5th and 1st deciles and on their first exon we measured:
-
-
the reads ratio between fragments inside the intron (10 nt) / fragments inside the exon (10 nt)
-
-
the maximum entropy score of the splice donor site (including 3nt in the exon and 6 in the intron) using MaxEntScan46 (http://hollywood.mit.edu/burgelab/maxent/Xmaxentscan_scoreseq.html).
Invariant transcripts not affected by WDR82 depletion
A golden set of invariant nascent extragenic transcripts (n=884) in HeLa cells was identified based on their expression after WDR82 depletion (log2-fold change < +0.5 and >- 0.5 in all replicates) and statistical significance (FDR =1 in all replicates). 31% of these transcripts were spliced (n=274) and included 1,436 splice junctions. The log2-transformed ratio between the reads across splice sites (10 nt before the splice site / 10 nt after the the splice site) was also measured and represented as a boxplot. The maximum entropy score in correspondence of the splice donor was calculated using MaxEntScan and represented in a boxplot. The statistical significance was assessed using the two-tailed Wilcoxon rank-sum test and a p-value ≤ 0.01 was considered significant.
Analysis of spliced and unspliced lncRNAs suppressed by WDR82
Extragenic transcripts upregulated upon WDR82 depletion in mouse macrophages and in HeLa cells were first divided into spliced and unspliced RNA. Then within each of these two groups they were further divided based on their overlap with lncRNAs in the NONCODE v5 database of noncoding RNAs, classified into single exon and multi-exonic ncRNAs.
Track generation and visualization
Tracks were generated using bamCoverage (-bs 1 --normalizeUsing RPKM --outFileFormat bigwig) from deepTools v.3.1.373. To create strand-specific bigWig files the option --filterRNAstrand forward or --filterRNAstrand reverse was used. Tracks for the Integrative Genomics Viewer (IGV)76 were generated using the uniquely aligned reads.
Statistics and plots
R v3.6.1 was used to compute statistics and generate plots (https://www.r-project.org/). Each exact p-value of statistical tests are reported in the legends of the figures. In case of ties, an approximate p-value is reported.
Reporting Summary statement
Further information on experimental design is available in the Nature Research Reporting Summary linked to this article.
Extended Data
Extended Data Fig. 1. Extragenic transcription in cells depleted of WDR82 or other transcription terminators.
A) The effects of the depletion of known termination factors on extragenic transcription was measured by 4sU labeling and sequencing in mouse bone marrow-derived macrophages. We considered the n=2,870 extragenic regions whose transcription was increased in macrophages depleted of WDR82 at 45’ after LPS stimulation and measured their 4sU labeling in macrophages depleted of the indicated proteins. Each transcript was assigned to the nearest annotated enhancer, Transcription Start Site (TSS) or Transcription End Site (TES). The log2-transformed fold change (sh vs. scramble) for each depletion experiment is shown. Statistical significance was assessed using the two-tailed Wilcoxon signed rank test and a p-value ≤ 0.01 was considered significant. p-values for transcripts assigned to Enhancers: Exosc3 p-value= 2.2e-208, Ars2 p-value= 2.9e-206, Ints11 p-value= 1.4e-217, CFIm25 p-value= 4.4e-189, Xrn2 p-value= 9.2e-239. p-values for transcripts assigned to TSS: Exosc3 p-value= 4.6e-69, Ars2 p-value= 3.7e-73, Ints11 p-value= 1.6e-72, CFIm25 p-value= 7.1e-72, Xrn2 p-value= 7.8e-101. p-values for transcripts assigned to TES: Exosc3 p-value= 1.5e-14, Ars2 p-value= 5.8e-10, Ints11 p-value= 6.7e-26, CFIm25 p-value= 0.149775, Xrn2 p-value= 1.0e-81. *** = p-value <0.01. ns: not statistically significant. Inside the boxplot, the median value for each fold change is shown with a horizontal black line. Boxes show values between the first and the third quartile. The lower and upper whisker show the smallest and the highest value, respectively. Outliers are not shown. The notches correspond to ~95% confidence interval for the median.
B) Comparison of the effects of the depletion of WDR82 and INTS11 on transcription termination at snRNA genes.
C) A representative genomic region on mouse chromosome 11 containing multiple snRNA genes.
D) Snapshots of genomic regions showing the effects of the depletion of WDR82 and other termination factors on extragenic transcription.
Extended Data Fig. 2. Interaction of WDR82 with the zinc finger protein ZC3H4.
A-B) Immunoprecipitations were carried out either with an anti-Flag antibody on extracts of HEK-293 cells transduced with a Flag-mouse ZC3H4 expression vector (A) or with an anti-ZC3H4 rabbit polyclonal antibody on extracts from Raw264.7 mouse macrophages (B). Different parts of the western blot membrane were hybridized with the indicated antibodies. Data are representative of n=4 independent experiments. The position of molecular weight markers (kDa) is shown on the right. Uncropped images are available online as Source Data.
C) Upper panel: Schematic representation of (A) the full length human ZC3H4 protein and (B to E) its deletion mutants used in transfection and co-immunoprecipitation experiments. The ZC3H4 domains annotated in UniProt are shown. Bottom panel: lysates from HEK-293 cells, either untransfected (-) or transduced with the indicated Flag-ZC3H4 expression vectors (A-E) were used in co-immunoprecipitation experiments with an anti-Flag antibody. Inputs (left) and immunoprecipitates (right) were immunoblotted and probed with an anti-FLAG (top) or an anti-WDR82 (bottom) antibody as indicated. The position of molecular weight markers (kDa) is shown on the right. Uncropped images are available online as Source Data.
D) The Flag-tagged ZC3H4 C-terminal fragment (804-1303) was expressed in HeLa cells. Lysates were immunoprecipitated with an anti-ZC3H4 antibody directed against aa. 677-765 and blotted with anti-Flag or anti-WDR82 antibody. Inputs are shown on the left and molecular weight markers (kDa) on the right. Uncropped images are available online as Source Data.
Extended Data Fig. 3. Effects of WDR82 and ZC3H4 co-depletion on extragenic transcription in HeLa cells.
A) The effects of WDR82, ZC3H4 or their combined depletion by siRNA transfection were measured on selected extragenic transcripts, as indicated. In co-depletion experiments, a double amount of siRNA was used, as indicated. The bar plots show the mean SD of n=4 biological replicates. The data were normalized on the housekeeping gene CDC25b. Light grey columns: 30pmol siRNA, dark grey columns, 60pmol siRNA.
B) Depletion efficiency of WDR82 (left) and ZC3H4 mRNA (right) in individual and combined depletions. The bar plots show the mean SD of n=4 independent experiments.
Extended Data Fig. 4. Distribution of WDR82, ZC3H4 and RNA Pol II ChIP-seq peaks.
A) Classification of WDR82 and ZC3H4 ChIP-seq peaks based on their genomic location. TSS: Transcription Start Site; TES: Transcription End Site. Data are from n=2 independent experiments.
B) Transcribed protein-coding genes (n=10,917) were divided into quartiles of increasing RNA Pol II occupancy. The heatmaps show WDR82, ZC3H4 and RNA Pol II ChIP-seq signals at genes of the 1st and 4th quartiles.
Extended Data Fig. 5. Analysis of spliced and unspliced lncRNAs suppressed by WDR82.
Extragenic transcripts upregulated upon WDR82 depletion in mouse macrophages (n=2,870; top) or in HeLa cells (n=1,509; bottom) were first divided into spliced (left) and unspliced RNA species (right). Then within each of these two groups they were further divided based on their overlap with lncRNAs in the NONCODE v5 database of non-coding RNAs, classified into single exon and multi-exonic ncRNAs.
Extended Data Fig. 6. Analysis of splice efficiency and splice site sequences of lncRNAs suppressed by ZC3H4-WDR82 in HeLa cells.
A) Splicing efficiency at WDR82-suppressed lncRNA junctions (n=3,717) (top panel) and at a randomly selected set of premRNA junctions (n=4,000) (bottom panel) in HeLa cells. A window of +/− 10 nucleotides centered on the 5’ splice sites was used to measure read counts in polyA RNA-seq data.
B) log2-transformed ratio of polyA RNA-seq reads in a 20 nt window centered on the 5’ splice sites of WDR82-suppressed lncRNA or of randomly selected set of mRNAs with at least one splice junction.
C) Analysis of 5’ (left) and 3’ (right) splice site strength (measured as MaxEnt scores) at WDR82-suppressed lncRNAs. Statistical significance was assessed using the two-tailed Wilcoxon rank sum test in correspondence of both the 5’ (p-value=1.2e-21) and the 3’ (p-value=2.6e-06) splice sites. ***=p-value <0.01. Nucleotide frequencies at splice sites are shown as sequence logos. Donor and acceptor splice sites are indicated as black triangles.
D) Effects of the depletion of WDR82-ZC3H4 on transcription of protein coding genes in HeLa cells. Expressed protein-coding genes (n=8,804) were divided into deciles based on their sensitivity to the depletion of WDR82 in 4sU-seq data, with the 10th decile including the most upregulated genes.
Log2-transformed RNA fold changes (polyA and 4sU RNA-seq data) and log2-transformed reads ratio across the first exon-intron junction, as annotated in GENCODE, are shown for the 10th, 5th and 1st deciles. Statistical significance was assessed using the two-tailed Wilcoxon rank sum test (pvalue = 2.0e-21). ***=p-value<0.01. Data were from n=3 independent experiments.
In the boxplots in panels B, C, D the median value for each group is shown with a horizontal black line. Boxes show values between the first and the third quartile. The lower and upper whisker show the smallest and the highest value, respectively. Outliers are not shown. The notches correspond to ~95% confidence interval for the median.
Extended Data Fig. 7. Relationship between gene transcript expression and splicing efficiency.
A) Genes were ranked into deciles of decreasing expression based on 4sU-seq data in macrophages (left) and HeLa cells (right). In both panels, expression of the lncRNAs upregulated in WDR82-depleted cells is shown in the red boxes on the right. Data are from n=3 independent experiments.
B) Splicing efficiency of the 1st exon of the ranked genes was measured by dividing the sequencing reads in the 10nt upstream by those in the 10nt downstream of the 5’ splice junction in polyA RNA-seq data. Left: macrophages (n=6,280 junctions); right: HeLa (n=8,804 junctions). Data are from n=3 independent experiments.
Boxes show values between the first and the third quartile. The lower and upper whisker show the smallest and the highest value, respectively. Outliers are not shown. The notches correspond to ~95% confidence interval for the median.
Extended Data Fig. 8. Exonic splice enhancer (ESE) sequences in exons of WDR82-suppressed lncRNAs and in mRNAs.
A) Number of ESE per exon in lncRNAs and in mRNAs suppressed by WDR82 in macrophages. Data are from n=3 independent experiments.
B) Distance between ESEs and 5’ splice sites in lncRNAs and in mRNAs suppressed by WDR82. Data are from n=3 independent experiments.
C) Number of ESEs per exon recognized by individual SRSF proteins in lncRNAs and in mRNAs suppressed by WDR82.
Extended Data Fig. 9. Characterization of splicing efficiency and splice site quality of extragenic transcripts not affected by WDR82 depletion.
A) log2-transformed ratio of polyA RNA-seq reads upstream and downstream of the 5’ splice sites of WDR82-suppressed and WDR82-insensitive lncRNAs in HeLa cells. Statistical significance was assessed using the two-tailed Wilcoxon rank sum test (p-value= 1.8e-175 for the controls and p-value=1.3e-199 in Wdr82-depleted cells). ***p-value < 0.01. Data are from n=3 independent experiments.
B) Analysis of 5’ (left) and 3’ (right) splice site strength at WDR82-suppressed and WDR82-insensitive lncRNAs in HeLa cells. MaxEnt scores for both donor and acceptor splice sites were measured. Statistical significance was assessed using the two-tailed Wilcoxon rank sum test in correspondence of both the 5’ (p-value= 1.3e-20) and the 3’ (p-value= 3e-04) splice sites. *** p-value < 0.01. Data are from n=3 independent experiments.
Boxes show values between the first and the third quartile. The lower and upper whisker show the smallest and the highest value, respectively. Outliers are not shown. The notches correspond to ~95% confidence interval for the median.
Extended Data Fig. 10. First exon deletions in protein coding genes.
A) Schematic representation of the deletion of the first exons of protein coding genes. sgRNAs were designed to remove a genomic sequence that included the first exon from 30-50nt downstream of the TSS to the intronic sequences just downstream of the 5’ splice site.
B) Expression of the indicated gene mRNAs was measured by qRT-PCR in bulk populations of wild type or first exon-deleted HeLa cells after transduction of the indicated siRNAs. Primers used were specific for spliced mRNAs and were designed on downstream exons (Methods). The plot shows the mean s.d. of n=3 independent experiments. * P < 0.05; **P < 0.01, by two tailed t-test. The data were normalized on the housekeeping gene NRSN2. P-values for COG2: WT vs. DEL siCtl = 1.75E-07; DEL siCtl vs. siWdr82 = 0.78 (n.s.); DEL siCtl vs. siWdr82 = 0.80 (n.s.). P-values for FAM174a: WT vs. DEL siCtl = 0.0005; DEL siCtl vs. siWdr82 = 0.85 (n.s.); DEL siCtl vs. siWdr82 = 0.15 (n.s.). P-values for RRP15: WT vs. DEL siCtl = 0.013; DEL siCtl vs. siWdr82 = 0.70 (n.s.); DEL siCtl vs. siWdr82 = 0.65 (n.s.)
C) First exon deletion efficiency at the three genes tested was analyzed by genomic PCR. The quantification of the wild type allele gel band in wt cells and cells in which the first exon was deleted using sgRNAs+Cas9 is shown on the right. Uncropped images are available online as source data.
Supplementary Material
Acknowledgements
We thank Bruno Amati (IEO) and Silvia Monticelli (IRB, Bellinzona) for critical comments on the manuscript. This work was supported by the European Research Council (Advanced ERC grant #692789 to GN).
Footnotes
Author Contributions
Conceptualization: LMA, VP, MR, GN.
Data generation: LMA and MR generated all data with contributions from EP, DP, SG and GRD.
Data analysis: VP analyzed all data with contributions from IB. SP generated and processed sequencing libraries.
Writing: GN with contributions from all authors.
Supervision: GN.
Funding acquisition: GN.
Competing Interests Statement
The authors declare no competing interests.
Data Availability Statement
The complete list of data sets used in this study is reported in Supplemental Table 10. Data sets generated in this study are available in the Gene Expression Omnibus (GEO) database (http://www.ncbi.nlm.nih.gov/geo) under the accession number GSE133109. Source Data are available with the paper online.
References
- 1.Konarska MM, Padgett RA, Sharp PA. Recognition of cap structure in splicing in vitro of mRNA precursors. Cell. 1984;38:731–736. doi: 10.1016/0092-8674(84)90268-x. [DOI] [PubMed] [Google Scholar]
- 2.Izaurralde E, et al. A nuclear cap binding protein complex involved in pre-mRNA splicing. Cell. 1994;78:657–668. doi: 10.1016/0092-8674(94)90530-4. [DOI] [PubMed] [Google Scholar]
- 3.Herzel L, Ottoz DSM, Alpert T, Neugebauer KM. Splicing and transcription touch base: co-transcriptional spliceosome assembly and function. Nat Rev Mol Cell Biol. 2017;18:637–650. doi: 10.1038/nrm.2017.63. [DOI] [PMC free article] [PubMed] [Google Scholar]
- 4.Fong YW, Zhou Q. Stimulatory effect of splicing factors on transcriptional elongation. Nature. 2001;414:929–933. doi: 10.1038/414929a. [DOI] [PubMed] [Google Scholar]
- 5.Lin S, Coutinho-Mansfield G, Wang D, Pandit S, Fu XD. The splicing factor SC35 has an active role in transcriptional elongation. Nat Struct Mol Biol. 2008;15:819–826. doi: 10.1038/nsmb.1461. [DOI] [PMC free article] [PubMed] [Google Scholar]
- 6.Ji X, et al. SR proteins collaborate with 7SK and promoter-associated nascent RNA to release paused polymerase. Cell. 2013;153:855–868. doi: 10.1016/j.cell.2013.04.028. [DOI] [PMC free article] [PubMed] [Google Scholar]
- 7.Das R, et al. SR proteins function in coupling RNAP II transcription to pre-mRNA splicing. Mol Cell. 2007;26:867–881. doi: 10.1016/j.molcel.2007.05.036. [DOI] [PubMed] [Google Scholar]
- 8.Damgaard CK, et al. A 5' splice site enhances the recruitment of basal transcription initiation factors in vivo. Mol Cell. 2008;29:271–278. doi: 10.1016/j.molcel.2007.11.035. [DOI] [PubMed] [Google Scholar]
- 9.Sims RJ, 3rd, et al. Recognition of trimethylated histone H3 lysine 4 facilitates the recruitment of transcription postinitiation factors and pre-mRNA splicing. Mol Cell. 2007;28:665–676. doi: 10.1016/j.molcel.2007.11.010. [DOI] [PMC free article] [PubMed] [Google Scholar]
- 10.Tyagi A, Ryme J, Brodin D, Ostlund Farrants AK, Visa N. SWI/SNF associates with nascent pre-mRNPs and regulates alternative pre-mRNA processing. PLoS Genet. 2009;5 doi: 10.1371/journal.pgen.1000470. e1000470. [DOI] [PMC free article] [PubMed] [Google Scholar]
- 11.Heintzman N, et al. Distinct and predictive chromatin signatures of transcriptional promoters and enhancers in the human genome. Nat Genet. 2007;39:311–318. doi: 10.1038/ng1966. [DOI] [PubMed] [Google Scholar]
- 12.De Santa F, et al. A large fraction of extragenic RNA pol II transcription sites overlap enhancers. PLoS Biol. 2010;8 doi: 10.1371/journal.pbio.1000384. e1000384. [DOI] [PMC free article] [PubMed] [Google Scholar]
- 13.Kim TK, et al. Widespread transcription at neuronal activity-regulated enhancers. Nature. 2010;465:182–187. doi: 10.1038/nature09033. nature09033 [pii] [DOI] [PMC free article] [PubMed] [Google Scholar]
- 14.Natoli G, Andrau JC. Noncoding transcription at enhancers: general principles and functional models. Annu Rev Genet. 2012;46:1–19. doi: 10.1146/annurev-genet-110711-155459. [DOI] [PubMed] [Google Scholar]
- 15.Marques AC, et al. Chromatin signatures at transcriptional start sites separate two equally populated yet distinct classes of intergenic long noncoding RNAs. Genome Biology. 2013;14:R131. doi: 10.1186/gb-2013-14-11-r131. [DOI] [PMC free article] [PubMed] [Google Scholar]
- 16.Hon CC, et al. An atlas of human long non-coding RNAs with accurate 5' ends. Nature. 2017;543:199–204. doi: 10.1038/nature21374. [DOI] [PMC free article] [PubMed] [Google Scholar]
- 17.Engreitz JM, et al. Local regulation of gene expression by lncRNA promoters, transcription and splicing. Nature. 2016;539:452. doi: 10.1038/nature20149. [DOI] [PMC free article] [PubMed] [Google Scholar]
- 18.Gil N, Ulitsky I. Production of Spliced Long Noncoding RNAs Specifies Regions with Increased Enhancer Activity. Cell Syst. 2018;7:537–547 e533. doi: 10.1016/j.cels.2018.10.009. [DOI] [PMC free article] [PubMed] [Google Scholar]
- 19.Tan JY, Biasini A, Young RS, Marques AC. Splicing of enhancer-associated lincRNAs contributes to enhancer activity. Life Sci Alliance. 2020;3 doi: 10.26508/lsa.202000663. [DOI] [PMC free article] [PubMed] [Google Scholar]
- 20.Ponjavic J, Ponting CP, Lunter G. Functionality or transcriptional noise? Evidence for selection within long noncoding RNAs. Genome Res. 2007;17:556–565. doi: 10.1101/gr.6036807. [DOI] [PMC free article] [PubMed] [Google Scholar]
- 21.Schuler A, Ghanbarian AT, Hurst LD. Purifying selection on splice-related motifs, not expression level nor RNA folding, explains nearly all constraint on human lincRNAs. Mol Biol Evol. 2014;31:3164–3183. doi: 10.1093/molbev/msu249. [DOI] [PMC free article] [PubMed] [Google Scholar]
- 22.Koch F, et al. Transcription initiation platforms and GTF recruitment at tissue-specific enhancers and promoters. Nat Struct Mol Biol. 2011;18:956–963. doi: 10.1038/nsmb.2085. [DOI] [PubMed] [Google Scholar]
- 23.Lee JH, Skalnik DG. Wdr82 is a C-terminal domain-binding protein that recruits the Setd1A Histone H3-Lys4 methyltransferase complex to transcription start sites of transcribed human genes. Mol Cell Biol. 2008;28:609–618. doi: 10.1128/MCB.01356-07. MCB.01356-07 [pii] [DOI] [PMC free article] [PubMed] [Google Scholar]
- 24.Austenaa LM, et al. Transcription of Mammalian cis-Regulatory Elements Is Restrained by Actively Enforced Early Termination. Mol Cell. 2015;60:460–474. doi: 10.1016/j.molcel.2015.09.018. [DOI] [PubMed] [Google Scholar]
- 25.Wu M, et al. Molecular regulation of H3K4 trimethylation by Wdr82, a component of human Set1/COMPASS. Mol Cell Biol. 2008;28:7337–7344. doi: 10.1128/MCB.00976-08. MCB.00976-08 [pii] [DOI] [PMC free article] [PubMed] [Google Scholar]
- 26.Lee JH, You J, Dobrota E, Skalnik DG. Identification and characterization of a novel human PP1 phosphatase complex. J Biol Chem. 2010;285:24466–24476. doi: 10.1074/jbc.M110.109801. [DOI] [PMC free article] [PubMed] [Google Scholar]
- 27.Baillat D, et al. Integrator, a multiprotein mediator of small nuclear RNA processing, associates with the C-terminal repeat of RNA polymerase II. Cell. 2005;123:265–276. doi: 10.1016/j.cell.2005.08.019. [DOI] [PubMed] [Google Scholar]
- 28.Lai F, Gardini A, Zhang A, Shiekhattar R. Integrator mediates the biogenesis of enhancer RNAs. Nature. 2015;525:399–403. doi: 10.1038/nature14906. [DOI] [PMC free article] [PubMed] [Google Scholar]
- 29.Preker P, et al. RNA exosome depletion reveals transcription upstream of active human promoters. Science. 2008;322:1851–1854. doi: 10.1126/science.1164096. [DOI] [PubMed] [Google Scholar]
- 30.Andersen PR, et al. The human cap-binding complex is functionally connected to the nuclear RNA exosome. Nat Struct Mol Biol. 2013;20:1367–1376. doi: 10.1038/nsmb.2703. [DOI] [PMC free article] [PubMed] [Google Scholar]
- 31.Ostuni R, et al. Latent enhancers activated by stimulation in differentiated cells. Cell. 2013;152:157–171. doi: 10.1016/j.cell.2012.12.018. [DOI] [PubMed] [Google Scholar]
- 32.van Nuland R, et al. Quantitative dissection and stoichiometry determination of the human SET1/MLL histone methyltransferase complexes. Mol Cell Biol. 2013;33:2067–2077. doi: 10.1128/MCB.01742-12. [DOI] [PMC free article] [PubMed] [Google Scholar]
- 33.Searles LL, Ruth RS, Pret AM, Fridell RA, Ali AJ. Structure and transcription of the Drosophila melanogaster vermilion gene and several mutant alleles. Mol Cell Biol. 1990;10:1423–1431. doi: 10.1128/mcb.10.4.1423. [DOI] [PMC free article] [PubMed] [Google Scholar]
- 34.Fridell RA, Pret AM, Searles LL. A retrotransposon 412 insertion within an exon of the Drosophila melanogaster vermilion gene is spliced from the precursor RNA. Genes Dev. 1990;4:559–566. doi: 10.1101/gad.4.4.559. [DOI] [PubMed] [Google Scholar]
- 35.Brewer-Jensen P, et al. Suppressor of sable [Su(s)] and Wdr82 down-regulate RNA from heat-shock-inducible repetitive elements by a mechanism that involves transcription termination. RNA. 2016;22:139–154. doi: 10.1261/rna.048819.114. [DOI] [PMC free article] [PubMed] [Google Scholar]
- 36.Castello A, et al. Insights into RNA Biology from an Atlas of Mammalian mRNA-Binding Proteins. Cell. 2012;149:1393–1406. doi: 10.1016/j.cell.2012.04.031. [DOI] [PubMed] [Google Scholar]
- 37.Baltz AG, et al. The mRNA-bound proteome and its global occupancy profile on protein-coding transcripts. Mol Cell. 2012;46:674–690. doi: 10.1016/j.molcel.2012.05.021. [DOI] [PubMed] [Google Scholar]
- 38.Kwon SC, et al. The RNA-binding protein repertoire of embryonic stem cells. Nat Struct Mol Biol. 2013;20:1122–1130. doi: 10.1038/nsmb.2638. [DOI] [PubMed] [Google Scholar]
- 39.Fu M, Blackshear PJ. RNA-binding proteins in immune regulation: a focus on CCCH zinc finger proteins. Nat Rev Immunol. 2017;17:130–143. doi: 10.1038/nri.2016.129. [DOI] [PMC free article] [PubMed] [Google Scholar]
- 40.Godin KS, Varani G. How arginine-rich domains coordinate mRNA maturation events. RNA Biol. 2007;4:69–75. doi: 10.4161/rna.4.2.4869. [DOI] [PubMed] [Google Scholar]
- 41.Shi Y, et al. Molecular architecture of the human pre-mRNA 3' processing complex. Mol Cell. 2009;33:365–376. doi: 10.1016/j.molcel.2008.12.028. [DOI] [PMC free article] [PubMed] [Google Scholar]
- 42.Cortazar MA, et al. Control of RNA Pol II Speed by PNUTS-PP1 and Spt5 Dephosphorylation Facilitates Termination by a “Sitting Duck Torpedo” Mechanism. Mol Cell. 2019;76:896–908 e894. doi: 10.1016/j.molcel.2019.09.031. [DOI] [PMC free article] [PubMed] [Google Scholar]
- 43.Sigova AA, et al. Divergent transcription of long noncoding RNA/mRNA gene pairs in embryonic stem cells. Proc Natl Acad Sci U S A. 2013;110:2876–2881. doi: 10.1073/pnas.1221904110. [DOI] [PMC free article] [PubMed] [Google Scholar]
- 44.Deveson IW, et al. Universal Alternative Splicing of Noncoding Exons. Cell Syst. 2018;6:245–255 e245. doi: 10.1016/j.cels.2017.12.005. [DOI] [PubMed] [Google Scholar]
- 45.Mele M, et al. Chromatin environment, transcriptional regulation, and splicing distinguish lincRNAs and mRNAs. Genome Res. 2017;27:27–37. doi: 10.1101/gr.214205.116. [DOI] [PMC free article] [PubMed] [Google Scholar]
- 46.Yeo G, Burge CB. Maximum entropy modeling of short sequence motifs with applications to RNA splicing signals. J Comput Biol. 2004;11:377–394. doi: 10.1089/1066527041410418. [DOI] [PubMed] [Google Scholar]
- 47.Fairbrother WG, Yeh RF, Sharp PA, Burge CB. Predictive identification of exonic splicing enhancers in human genes. Science. 2002;297:1007–1013. doi: 10.1126/science.1073774. [DOI] [PubMed] [Google Scholar]
- 48.Caceres EF, Hurst LD. The evolution, impact and properties of exonic splice enhancers. Genome Biol. 2013;14:R143. doi: 10.1186/gb-2013-14-12-r143. [DOI] [PMC free article] [PubMed] [Google Scholar]
- 49.Andersson R, et al. Human Gene Promoters Are Intrinsically Bidirectional. Mol Cell. 2015;60:346–347. doi: 10.1016/j.molcel.2015.10.015. [DOI] [PMC free article] [PubMed] [Google Scholar]
- 50.Seila AC, et al. Divergent transcription from active promoters. Science. 2008;322:1849–1851. doi: 10.1126/science.1162253. [DOI] [PMC free article] [PubMed] [Google Scholar]
- 51.Kaida D, et al. U1 snRNP protects pre-mRNAs from premature cleavage and polyadenylation. Nature. 2010;468:664–668. doi: 10.1038/nature09479. [DOI] [PMC free article] [PubMed] [Google Scholar]
- 52.Almada AE, Wu X, Kriz AJ, Burge CB, Sharp PA. Promoter directionality is controlled by U1 snRNP and polyadenylation signals. Nature. 2013;499:360–363. doi: 10.1038/nature12349. [DOI] [PMC free article] [PubMed] [Google Scholar]
- 53.Ntini E, et al. Polyadenylation site-induced decay of upstream transcripts enforces promoter directionality. Nat Struct Mol Biol. 2013;20:923–928. doi: 10.1038/nsmb.2640. [DOI] [PubMed] [Google Scholar]
- 54.Murray MV, Turnage MA, Williamson KJ, Steinhauer WR, Searles LL. The Drosophila suppressor of sable protein binds to RNA and associates with a subset of polytene chromosome bands. Mol Cell Biol. 1997;17:2291–2300. doi: 10.1128/mcb.17.4.2291. [DOI] [PMC free article] [PubMed] [Google Scholar]
- 55.Nojima T, et al. Mammalian NET-Seq Reveals Genome-wide Nascent Transcription Coupled to RNA Processing. Cell. 2015;161:526–540. doi: 10.1016/j.cell.2015.03.027. [DOI] [PMC free article] [PubMed] [Google Scholar]
- 56.Nojima T, et al. RNA Polymerase II Phosphorylated on CTD Serine 5 Interacts with the Spliceosome during Co-transcriptional Splicing. Mol Cell. 2018;72:369–379 e364. doi: 10.1016/j.molcel.2018.09.004. [DOI] [PMC free article] [PubMed] [Google Scholar]
- 57.Wongpalee SP, et al. Large-scale remodeling of a repressed exon ribonucleoprotein to an exon definition complex active for splicing. Elife. 2016;5 doi: 10.7554/eLife.19743. [DOI] [PMC free article] [PubMed] [Google Scholar]
- 58.Attig J, Ule J. Genomic Accumulation of Retrotransposons Was Facilitated by Repressive RNA-Binding Proteins: A Hypothesis. Bioessays. 2019;41 doi: 10.1002/bies.201800132. e1800132. [DOI] [PubMed] [Google Scholar]
- 59.Kelley D, Rinn J. Transposable elements reveal a stem cell-specific class of long noncoding RNAs. Genome Biol. 2012;13:R107. doi: 10.1186/gb-2012-13-11-r107. [DOI] [PMC free article] [PubMed] [Google Scholar]
- 60.Cassa CA, et al. Estimating the selective effects of heterozygous protein-truncating variants from human exome data. Nat Genet. 2017;49:806–810. doi: 10.1038/ng.3831. [DOI] [PMC free article] [PubMed] [Google Scholar]
- 61.Austenaa L, et al. The histone methyltransferase Wbp7 controls macrophage function through GPI glycolipid anchor synthesis. Immunity. 2012;36:572–585. doi: 10.1016/j.immuni.2012.02.016. [DOI] [PubMed] [Google Scholar]
- 62.De Santa F, et al. The histone H3 lysine-27 demethylase Jmjd3 links inflammation to inhibition of polycomb-mediated gene silencing. Cell. 2007;130:1083–1094. doi: 10.1016/j.cell.2007.08.019. [DOI] [PubMed] [Google Scholar]
- 63.Balestrieri C, et al. Co-optation of Tandem DNA Repeats for the Maintenance of Mesenchymal Identity. Cell. 2018;173:1150–1164 e1114. doi: 10.1016/j.cell.2018.03.081. [DOI] [PubMed] [Google Scholar]
- 64.Sakuma T, Nishikawa A, Kume S, Chayama K, Yamamoto T. Multiplex genome engineering in human cells using all-in-one CRISPR/Cas9 vector system. Sci Rep. 2014;4 doi: 10.1038/srep05400. 5400. [DOI] [PMC free article] [PubMed] [Google Scholar]
- 65.Trapnell C, et al. Differential gene and transcript expression analysis of RNA-seq experiments with TopHat and Cufflinks. Nat Protoc. 2012;7:562–578. doi: 10.1038/nprot.2012.016. [DOI] [PMC free article] [PubMed] [Google Scholar]
- 66.Langmead B, Salzberg SL. Fast gapped-read alignment with Bowtie 2. Nat Methods. 2012;9:357–359. doi: 10.1038/nmeth.1923. [DOI] [PMC free article] [PubMed] [Google Scholar]
- 67.Zang C, et al. A clustering approach for identification of enriched domains from histone modification ChIP-Seq data. Bioinformatics. 2009;25:1952–1958. doi: 10.1093/bioinformatics/btp340. [DOI] [PMC free article] [PubMed] [Google Scholar]
- 68.Quinlan AR, Hall IM. BEDTools: a flexible suite of utilities for comparing genomic features. Bioinformatics. 2010;26:841–842. doi: 10.1093/bioinformatics/btq033. [DOI] [PMC free article] [PubMed] [Google Scholar]
- 69.Arner E, et al. Transcribed enhancers lead waves of coordinated transcription in transitioning mammalian cells. Science. 2015;347:1010–1014. doi: 10.1126/science.1259418. [DOI] [PMC free article] [PubMed] [Google Scholar]
- 70.Hnisz D, et al. Super-enhancers in the control of cell identity and disease. Cell. 2013;155:934–947. doi: 10.1016/j.cell.2013.09.053. [DOI] [PMC free article] [PubMed] [Google Scholar]
- 71.Liao Y, Smyth GK, Shi W. featureCounts: an efficient general purpose program for assigning sequence reads to genomic features. Bioinformatics. 2014;30:923–930. doi: 10.1093/bioinformatics/btt656. [DOI] [PubMed] [Google Scholar]
- 72.Amemiya HM, Kundaje A, Boyle AP. The ENCODE Blacklist: Identification of Problematic Regions of the Genome. Sci Rep. 2019;9 doi: 10.1038/s41598-019-45839-z. 9354. [DOI] [PMC free article] [PubMed] [Google Scholar]
- 73.Ramirez F, et al. deepTools2: a next generation web server for deep-sequencing data analysis. Nucleic Acids Res. 2016;44:W160–165. doi: 10.1093/nar/gkw257. [DOI] [PMC free article] [PubMed] [Google Scholar]
- 74.Bolger AM, Lohse M, Usadel B. Trimmomatic: a flexible trimmer for Illumina sequence data. Bioinformatics. 2014;30:2114–2120. doi: 10.1093/bioinformatics/btu170. [DOI] [PMC free article] [PubMed] [Google Scholar]
- 75.Krchnakova Z, et al. Splicing of long non-coding RNAs primarily depends on polypyrimidine tract and 5' splice-site sequences due to weak interactions with SR proteins. Nucleic Acids Res. 2019;47:911–928. doi: 10.1093/nar/gky1147. [DOI] [PMC free article] [PubMed] [Google Scholar]
- 76.Robinson JT, et al. Integrative genomics viewer. Nat Biotechnol. 2011;29:24–26. doi: 10.1038/nbt.1754. [DOI] [PMC free article] [PubMed] [Google Scholar]
Associated Data
This section collects any data citations, data availability statements, or supplementary materials included in this article.
Supplementary Materials
Data Availability Statement
The complete list of data sets used in this study is reported in Supplemental Table 10. Data sets generated in this study are available in the Gene Expression Omnibus (GEO) database (http://www.ncbi.nlm.nih.gov/geo) under the accession number GSE133109. Source Data are available with the paper online.


