Abstract
RNA polymerase III (Pol III) synthesises tRNAs and other short, essential RNAs. Human Pol III misregulation is linked to tumour transformation, neurodegenerative and developmental disorders, and increased sensitivity to viral infections. Here, we present cryo-EM structures at 2.8 to 3.3 Å resolution of transcribing and unbound human Pol III. We observe insertion of the TFIIS-like subunit RPC10 into the polymerase funnel, providing insights into how RPC10 triggers transcription termination. Our structures resolve elements absent from S. cerevisiae Pol III such as the winged-helix domains of RPC5 and an iron-sulphur cluster, which tethers the heterotrimer subcomplex to the core. The cancer-associated RPC7α isoform binds the polymerase clamp, potentially interfering with Pol III inhibition by tumour suppressor MAF1, which may explain why overexpressed RPC7α enhances tumour transformation. Finally, the human Pol III structure allows mapping of disease-related mutations and might contribute to developing inhibitors that selectively target Pol III for therapeutic interventions.
Introduction
Eukaryotes utilise Pol III to transcribe tRNAs, the spliceosomal U6 small nuclear RNA (U6 snRNA) and other short, abundant RNAs1. Thus, Pol III must be tightly regulated by oncogenes and tumour suppressors, including the Pol III-specific repressor MAF12. Consequently, expression levels of human Pol III transcripts are increased in tumour cells3, and targeting Pol III suppresses the viability of prostate cancer cells4. Furthermore, Pol III inhibition increases longevity in different animals5 but also promotes intracellular bacterial growth owing to its role in the immune system6,7. Mutations in human Pol III have been linked to neurodegenerative disorders like Hypomyelinating Leukodystrophy (HLD) affecting white matter of the central nervous system8–14, developmental disorders such as Wiedemann-Rautenstrauch Syndrome (WDRTS), a progeroid neonatal disorder15,16 and Treatcher Collins Syndrome (TCS) affecting craniofacial development10,17 and susceptibility to infections by Varicella Zoster Virus (VZV), which can lead to severe central nervous system disorders and pneumonitis18,19.
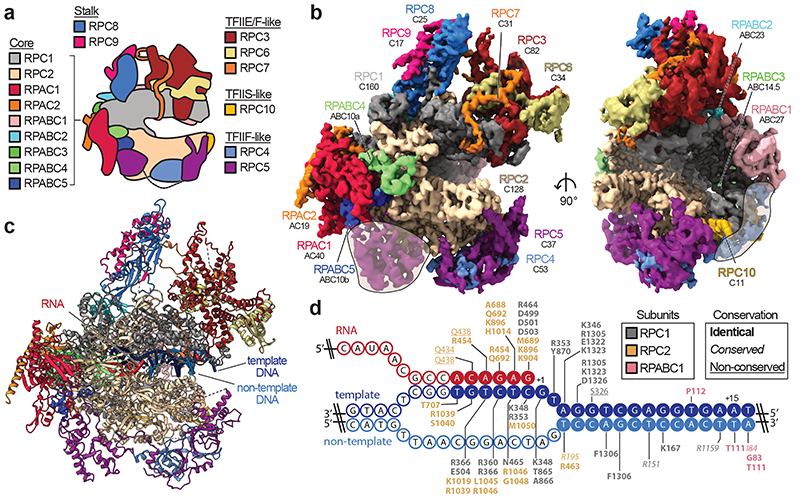
Pol III comprises 17 subunits that form a conserved catalytic core, the stalk domain and Pol III-specific subcomplexes, which are homologous to general transcription factors in the Pol II system20 (Fig. 1a). The TFIIE/F-like RPC3-RPC6-RPC7 heterotrimer functions in transcription initiation21–23 and the TFIIF-like RPC4-RPC5 heterodimer is required to initiate24,25 and terminate transcription26,27. Pol III also contains the TFIIS-like subunit RPC10 that is essential for termination and facilitates recycling of Pol III28,29, but its precise function in these processes is poorly understood.
Fig. 1. Cryo-EM structure of human RNA polymerase III.
a, Schematic of human Pol III and colour code of its subunits grouped by subcomplexes or homology to Pol II factors. b, Cryo-EM map of apo human Pol III shown from the side (left) and front (right) with human subunits coloured as in a and additionally labelled with their yeast counterparts below. Shadings mark superimposed features of a cryo-EM map derived from a pooled dataset of apo and elongating Pol III. c, Structural model of elongating human Pol III with bound nucleic acids. d, Schematic of the DNA/RNA transcription scaffold. Filled and unfilled circles represent modelled and non-modelled nucleotides, respectively, labelled with contacting residues within 4 Å distance. Boxes on the top-right show the subunit colour-code and used typography of the residues to mark their conservation between human and yeast Pol III.
In humans, the Pol III-specific subcomplexes harbour additional features that are absent in S. cerevisiae. RPC5 is twice as large as its yeast counterpart C3724, RPC6 comprises an iron-sulphur cluster30 of unknown function, and human Pol III can utilise different isoforms of RPC7 (also known as POLR3G and hRPC32)31. Whereas RPC7β is ubiquitously expressed, RPC7α is enriched in tumour cells and undifferentiated embryonic stem cells31. Ectopic expression of RPC7α also enhances tumour transformation31.
Cryo-electron microscopy (cryo-EM) studies on yeast Pol III revealed its architecture32 and shed light on the mechanisms of Pol III transcription initiation33–35 and Maf1-mediated repression36. However, a mechanistic understanding of Pol III function in human health and disease has been hampered due to the lack of an atomic human Pol III structure. Here, we present cryo-EM structures of human Pol III at 2.8 to 3.3 Å resolution in different functional states. Our results expand the overall knowledge of Pol III transcription and provide molecular insights into how higher eukaryote-specific features and disease-causative mutations modulate human Pol III activity.
Results
Structure of human Pol III
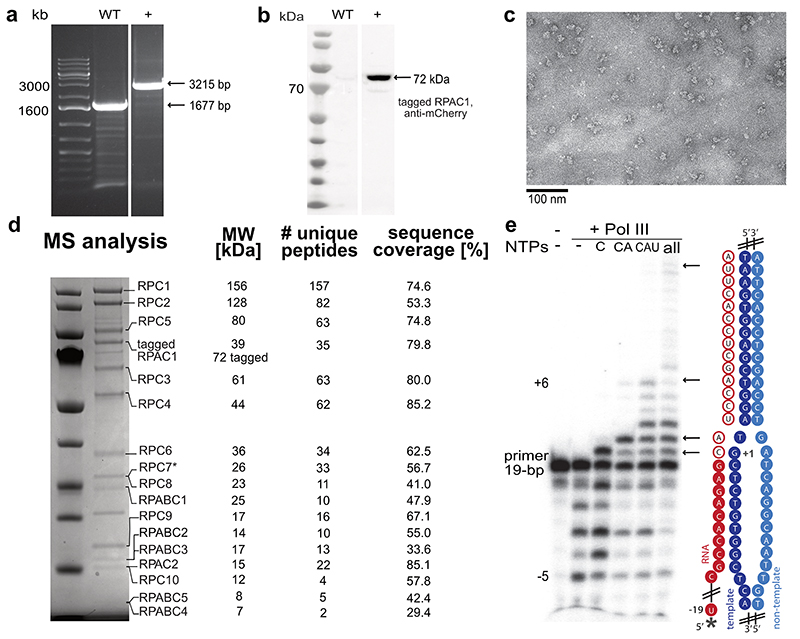
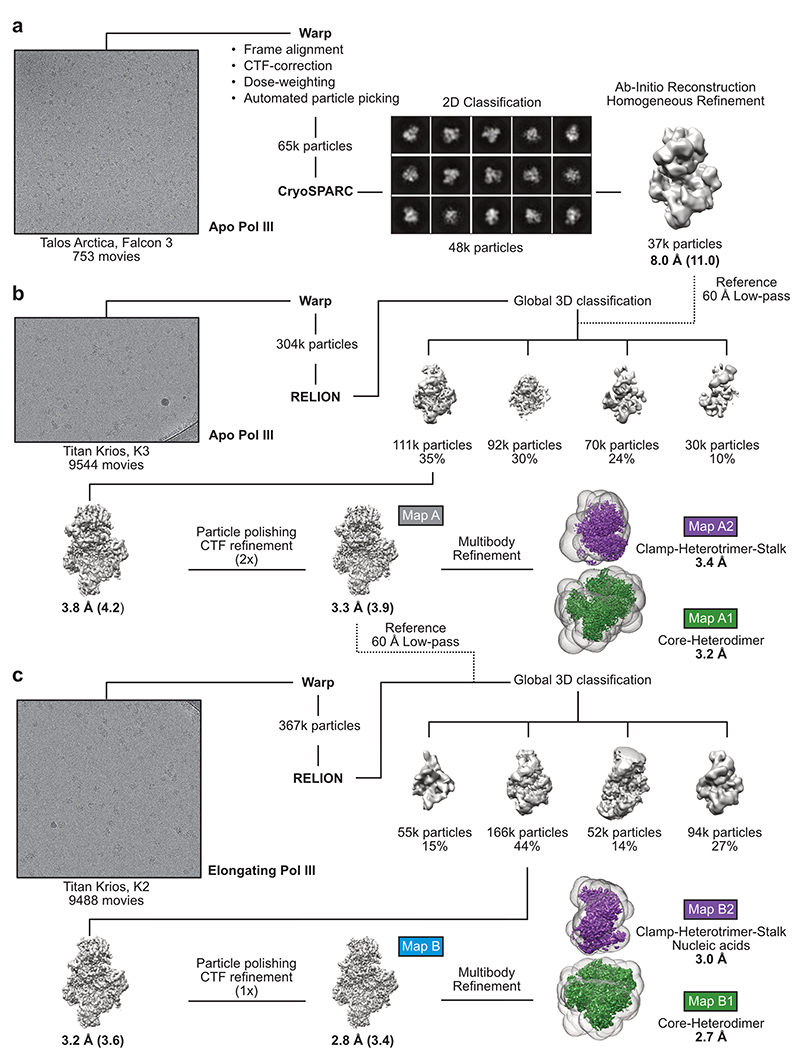
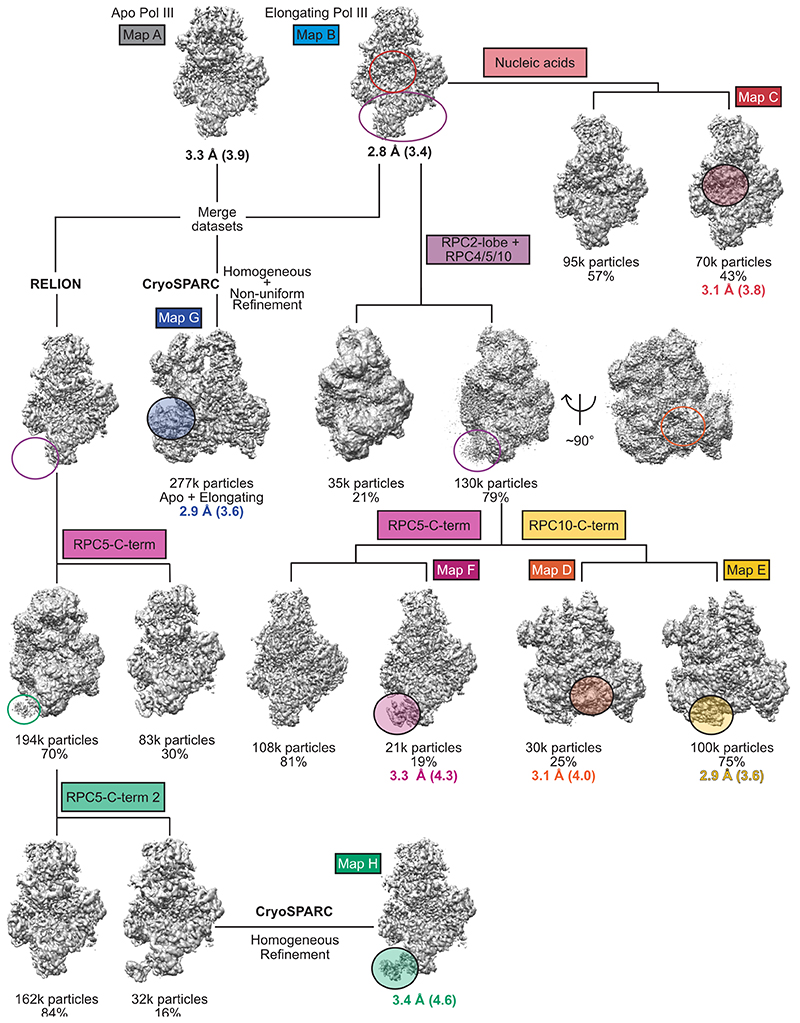
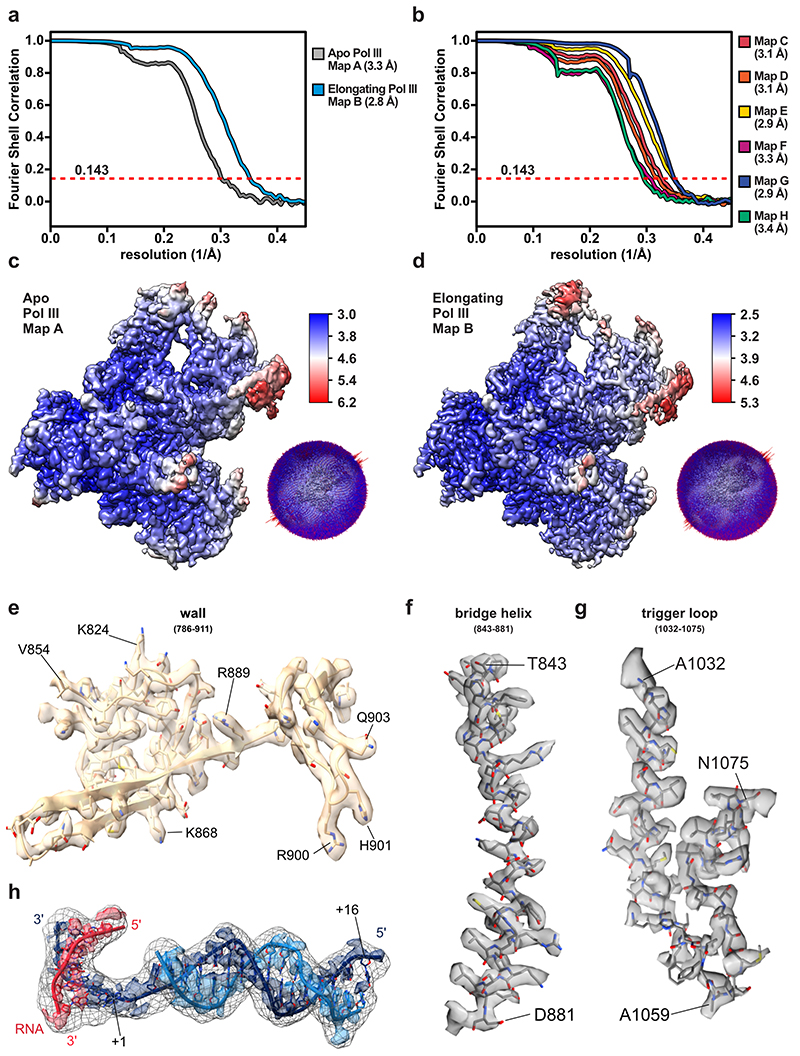
We used CRISPR-Cas9 to generate a homozygous HEK293 suspension cell line carrying a mCherry-StrepII-His-tag on the C-terminus of subunit RPAC1 (Extended Data Fig. 1a,b) to purify the endogenous 17-subunit Pol III complex. This yielded intact, homogenous and transcriptionally active human Pol III, which we confirmed by negative-stain EM, mass spectrometry and RNA primer extension experiments (Extended Data Fig. 1c-e). We acquired cryo-EM data for Pol III alone (apo Pol III) (Extended Data Fig. 2a,b) and bound to a DNA/RNA scaffold mimicking the transcription bubble, and, thus, resembling the elongating Pol III complex (EC Pol III) (Fig. 1d, Extended Data Fig. 2c). More flexible regions could be resolved by focused classification, which yielded, in total, eight partial cryo-EM maps (Extended Data Figs. 3, 4a,b) that were used to build the atomic models of human Pol III in four functional states: apo Pol III, EC-1 Pol III (RPC5 in conformation 1), EC-2 Pol III (RPC5 in conformation 2), and EC-3 Pol III (RPC10 ‘inside funnel’) (Table 1). Apo Pol III, was resolved at a nominal resolution of 3.3 Å with the core reaching up to 3 Å (Fig. 1b, Extended Data Fig. 2b, 4a,c). The cryo-EM map of EC Pol III could be refined to 2.8 Å nominal resolution and extended to 2.5 Å local resolution in the core (Extended Data Figs. 2c, 4a,d-g). We, hereafter, refer to the EC-1 Pol III structure when describing structural aspects of the elongating human Pol III complex. The structural models contain all 17 subunits forming the core (RPC1, RPC2, RPC10, RPAC1, RPAC2, RPABC1-5), the stalk (RPC8, RPC9), the heterotrimer (RPC3, RPC6, RPC7) and the heterodimer (RPC4, RPC5) (Fig. 1a,c). In elongating human Pol III, the downstream double-stranded DNA (dsDNA) that unwinds into the non-template and template strand in the active centre is well resolved. The template strand forms a hybrid with the transcribed RNA, of which six bases were built (Fig. 1d, Extended Data Fig. 4h). Nucleic acid-binding is mediated by the core subunits RPC1, RPC2 and RPABC1 (Fig. 1d). Most residues that bind the nucleic acids are identical or conserved between yeast and human Pol III (Fig. 1d), as it has also been observed for mammalian Pol II37. Interestingly, the strongest differences between the 3D reconstructions of yeast and human Pol III and additional cryo-EM densities can be assigned to the Pol III-specific heterotrimer and heterodimer subcomplexes (Extended Data Fig. 5a-c) and the TFIIS-like subunit RPC10 (Extended Data Fig. 6a-c).
Table 1. Cryo-EM data collection, refinement and validation statistics.
| Map A (EMDB-11673) Apo Pol III (PDB 7A6H) |
Map B (EMDB-11736) EC-1 Pol III (PDB 7AE1) | Map C (EMDB-11737) | Map D (EMDB-11738) EC-3 Pol III (PDB 7AE3) | |
|---|---|---|---|---|
| Data collection and processing | ||||
| Magnification | 105,000 | 130,000 | 130,000 | 130,000 |
| Voltage (kV) | 300 | 300 | 300 | 300 |
| Electron exposure (e–/Å2) | 38.11 | 40.35 | 40.35 | 40.35 |
| Defocus range (μm) | 0.75-2.25 | 0.75-2.00 | 0.75-2.00 | 0.75-2.00 |
| Pixel size (Å) | 0.822 | 1.05 | 1.05 | 1.05 |
| Symmetry imposed | C1 | C1 | C1 | C1 |
| Initial particle images (no.) | 304,683 | 367,717 | 367,717 | 367,717 |
| Final particle images (no.) | 111,289 | 166,071 | 70,492 | 30,525 |
| Map resolution (Å) | 3.3 | 2.8 | 3.1 | 3.1 |
| FSC threshold | 0.143 | 0.143 | 0.143 | 0.143 |
| Map resolution range (Å) | 3.0 – 8.3 | 2.5 – 7.8 | 2.8 – 8.3 | 2.9 – 6.9 |
| Refinement | ||||
| Initial model used (PDB code) | 3AYH,5AFQ,5F J8,5FJ9, 5FLM,5IY6, 6CND,6EU0, 6EU1,6EU2 |
3AYH,5AFQ,5F J8,5FJ9, 5FLM,5IY6, 6CND,6EU0, 6EU1,6EU2 |
3AYH,5AFQ,5F J8,5FJ9, 5FLM,5IY6, 6CND,6EU0, 6EU1,6EU2 |
|
| Model resolution (Å) | 3.4 | 3.0 | 3.2 | |
| Map sharpening B factor (Å2) | -80.1 | -55.2 | -49.6 | |
| Model composition | ||||
| Non-hydrogen atoms | 40217 | 42609 | 42526 | |
| Protein / Nucleotide residues | 5072 / - | 5258 / 44 | 5247 / 44 | |
| Ligands | 1x SF4, 7x Zn, 1x Mg | 1x SF4, 7x Zn, 1x Mg | 1x SF4, 7x Zn, 1x Mg | |
| B factors (Å2) | ||||
| Protein | 105.65 | 84.75 | 126.86 | |
| Ligand | 105.80 | 93.50 | 132.15 | |
| Nucleotide | 155.90 | 180.37 | ||
| R.m.s. deviations | ||||
| Bond lengths (Å) | 0.010 | 0.008 | 0.008 | |
| Bond angles (°) | 1.271 | 1.315 | 1.208 | |
| Validation | ||||
| MolProbity score | 1.54 | 1.28 | 1.43 | |
| Clashscore | 3.91 | 2.20 | 3.46 | |
| Poor rotamers (%) | 0.25 | 0.43 | 0.32 | |
| Ramachandran plot | ||||
| Favored (%) | 94.71 | 95.90 | 95.71 | |
| Allowed (%) | 5.23 | 3.99 | 4.23 | |
| Disallowed (%) | 0.06 | 0.12 | 0.06 | |
| Map E (EMDB-11739) | Map F (EMDB-11740) | Map G1 (EMDB-11741) | Map H1 (EMDB-11742) EC-2 Pol III (PDB 7AEA) | |
|---|---|---|---|---|
| Data collection and processing | ||||
| Magnification | 130,000 | 130,000 | 105,000/130,000 | 105,000/130,000 |
| Voltage (kV) | 300 | 300 | 300 | 300 |
| Electron exposure (e–/Å2) | 40.35 | 40.35 | 38.11/40.35 | 38.11/40.35 |
| Defocus range (μm) | 0.75-2.00 | 0.75-2.00 | 0.75-2.25/0.75-2.00 | 0.75-2.25/0.75-2.00 |
| Pixel size (Å) | 1.05 | 1.05 | 1.05 | 1.05 |
| Symmetry imposed | C1 | C1 | C1 | C1 |
| Initial particle images (no.) | 367,717 | 367,717 | 277,360 | 277,360 |
| Final particle images (no.) | 100,152 | 21,861 | 277,360 | 31,737 |
| Map resolution (Å) | 2.9 | 3.3 | 2.9 | 3.3 |
| FSC threshold | 0.143 | 0.143 | 0.143 | 0.143 |
| Map resolution range (Å) | 2.6 – 7.6 | 3.0 – 8.9 | 2.8 – 7.1 | 3.2 – 10.0 |
| Refinement | ||||
| Initial model used (PDB code) | 3AYH,5AFQ,5F J8,5FJ9, 5FLM,5IY6, 6CND,6EU0, 6EU1,6EU2 |
|||
| Model resolution (Å) | 3.4 | |||
| Map sharpening B factor (Å2) | -43.6 | |||
| Model composition | ||||
| Non-hydrogen atoms | 42423 | |||
| Protein / Nucleotide residues | 5218 / 44 | |||
| Ligands | 1x SF4, 7x Zn, 1x Mg | |||
| B factors (Å2) | ||||
| Protein | 117.34 | |||
| Ligand | 143.32 | |||
| Nucleotide | 222.81 | |||
| R.m.s. deviations | ||||
| Bond lengths (Å) | 0.006 | |||
| Bond angles (°) | 1.156 | |||
| Validation | ||||
| MolProbity score | 1.44 | |||
| Clashscore | 3.48 | |||
| Poor rotamers (%) | 0.28 | |||
| Ramachandran plot | ||||
| Favored (%) | 95.64 | |||
| Allowed (%) | 4.30 | |||
| Disallowed (%) | 0.06 | |||
Map G and map H derived from a combined data set of apo and elongating Pol III by merging final particle images of map A and map B. Data collection and processing values for both data sets are given.
RPC10 swings into the active site
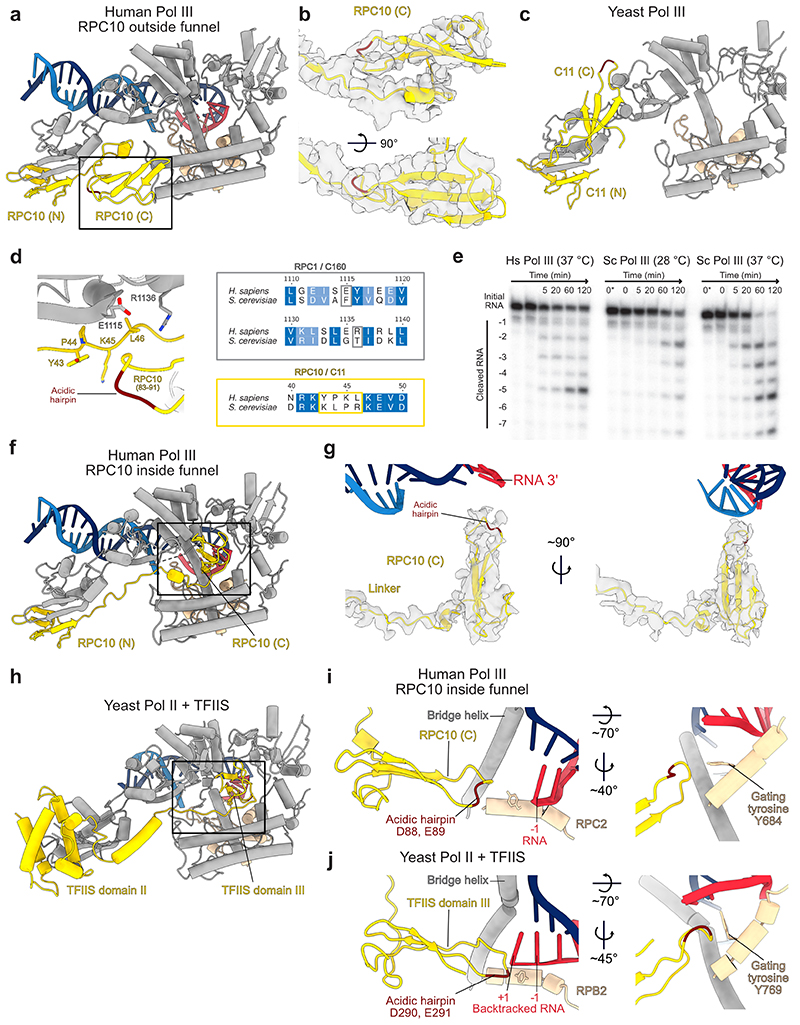
Our cryo-EM maps capture different conformations of the mobile domain of the TFIIS-like subunit RPC10, and of the RPC4-RPC5 heterodimer. Pol III utilises both elements to autonomously terminate transcription on poly-thymidine DNA sequences26,27. This termination mechanism is unique to Pol III and is critical for its function. RPC10 is anchored to the polymerase core via an N-terminal zinc ribbon domain32 (N-ribbon), followed by a flexible linker and a C-terminal zinc ribbon domain (C-ribbon) that is homologues to the Pol II elongation factor TFIIS (Fig. 2a). Similarly to TFIIS, RPC10 uses an acidic hairpin (D88, E89) for hydrolytic 3’ RNA cleavage. Such RNA-cleavage activity is necessary to reactivate backtracked RNA polymerase. In S. pombe 28, deleting the acidic hairpin of C11, the ortholog to RPC10, is lethal. Our cryo-EM reconstruction of elongating human Pol III reveals that the C-ribbon of RPC10 can adopt two conformations – outside and inside the polymerase funnel (Fig. 2b, Extended Data Figs. 6a,f). In the ‘outside funnel’ conformation, the flexible linker adopts a kink whereby the C-ribbon folds back and contacts the central part of the linker and the RPC1 jaw via its tip (Fig. 2b, Extended Data Fig. 6a,b,d). The contacted residues are not conserved between yeast and human, explaining why this conformation has not been observed in the yeast Pol III structures32,33 (Extended Data Fig. 6c) and suggesting a species-specific adaption to RNA cleavage (Extended Data Fig. 6d). In agreement to this, RNA-cleavage activities of human and yeast Pol III are comparable at 37 °C and 28 °C, respectively (Extended Data Fig. 6e). In contrast, the yeast enzyme cleaves RNA faster than human Pol III at 37 °C. The linker extends when adopting the ‘inside funnel’ conformation (EC-3 Pol III), which is accompanied by a ~110° rotation and a ~57 Å movement of the acidic hairpin (Fig. 2b, Extended Data Fig. 6f,g). Consequently, the C-ribbon inserts into the polymerase pore and funnel, and its position resembles that of the C-ribbon in previous TFIIS-Pol II structures38–40 (Extended Data Fig. 6h). In contrast to the structure of backtracked Pol II bound to TFIIS40, the acidic hairpin does not reach the 3’ RNA end (Extended Data Fig. 6i,j). This raises the question, which functional state of human Pol III the ‘inside conformation’ reflects. The TFIIS-Pol II structure represents a reactivation intermediate, in which the acidic hairpin extends and reaches the +1 RNA base of the backtracked RNA40. The same study described a ‘gating’ function of residue Y769 in yeast RPB2. In the human Pol III ‘inside funnel’ structure, the 3’-end of the RNA occupies the position -1, indicating that human Pol III does not adopt an arrested or backtracked state. Compared to the gating tyrosine Y769 in the Pol II-TFIIS structure, the homologous tyrosine in human Pol III (Y684 in RPC2) is flipped and shields the 3’-end of the RNA (Extended Data Fig. 6i,j). Consequently, the acidic hairpin does not insert as far into the Pol III funnel and adopts an inflected conformation, whereby it cannot reach the 3’-end of the -1 RNA base. Hence, the human Pol III ‘inside funnel’ conformation, most likely, resembles an active transcription elongation state, during which RPC10 intrinsically monitors the active site.
Fig. 2. Conformational dynamics of RPC10.
a, Schematic domain organisation of subunit RPC10 and its position in the elongating human Pol III complex. Coloured bars indicate modelled regions and are labelled as ‘built’. N – N-terminal zinc ribbon; C – C-terminal zinc ribbon. b, Conformational switch of RPC10. The Pol III core is shown as transparent surface and RPC10 as cartoon in two conformations of its C-terminal zinc ribbon domain (C): outside (yellow) and inside (light red) the Pol III funnel. The black arrow illustrates the movement of the acidic hairpin (D88, E89), shown as dark red spheres, to engage the active site. c, Elongating human Pol III in two superimposed conformations derived from 3D Variability Analysis (3DVA) with RPC10 outside (yellow map) and inside (light red map). Positions of the C-ribbon are boxed. Conformational rearrangements are highlighted with white arrows and indicate the partial opening of the clamp domain. The framed close-up view shows the appearance of the connection between heterotrimer and stalk in the ‘open clamp’ conformation.
To further explore the conformational dynamics of the RPC10 C-ribbon, we subjected our cryo-EM reconstructions to 3D variability analysis (3DVA)41. 3DVA of elongating human Pol III reveals that the insertion of the RPC10 C-ribbon into the funnel is accompanied by an ‘open clamp’ conformation (Fig. 2c, Supplementary Video 1). Multiple studies reported that Pol III requires RPC10 (C11 in yeast) to terminate transcription, but that its 3’ RNA cleavage activity is not essential for this process27–29,42,43. We propose that the insertion of RPC10 C-ribbon induces partial opening of the mobile clamp domain and, thereby, supports the release of transcribed RNA from a paused pre-termination complex previously reported26. Our structure of human Pol III does not resemble a pre-termination complex26 because the DNA does not contain a termination signal. However, the proposed intrinsic ‘active-centre monitoring’ activity of RPC10 would be in line with a model, in which RPC10 constantly monitors the active in a dynamic fashion and only triggers termination once Pol III reaches its termination signal. RPC10-induced clamp opening could also explain why in yeast this subunit is critical for facilitated re-initiation of transcription27,44 since an open clamp has been suggested to be required for binding the closed dsDNA of the promoter33,36. In that regard, the release of RPC10 from the active site could potentially also assist promoter DNA melting during the transition from an open to a closed clamp conformation.
Extended structure of human RPC4-RPC5
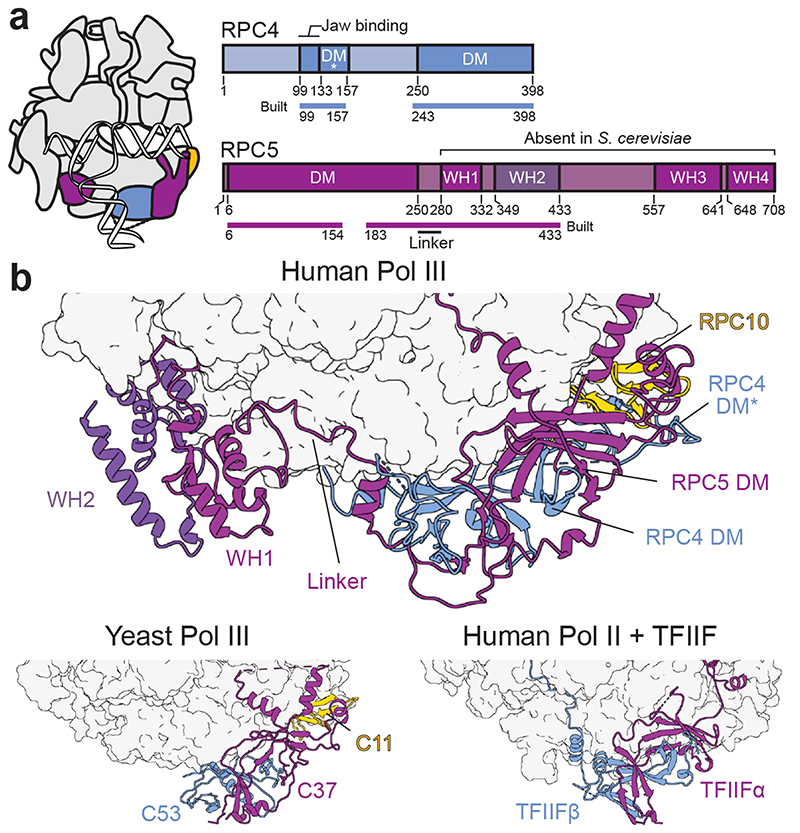
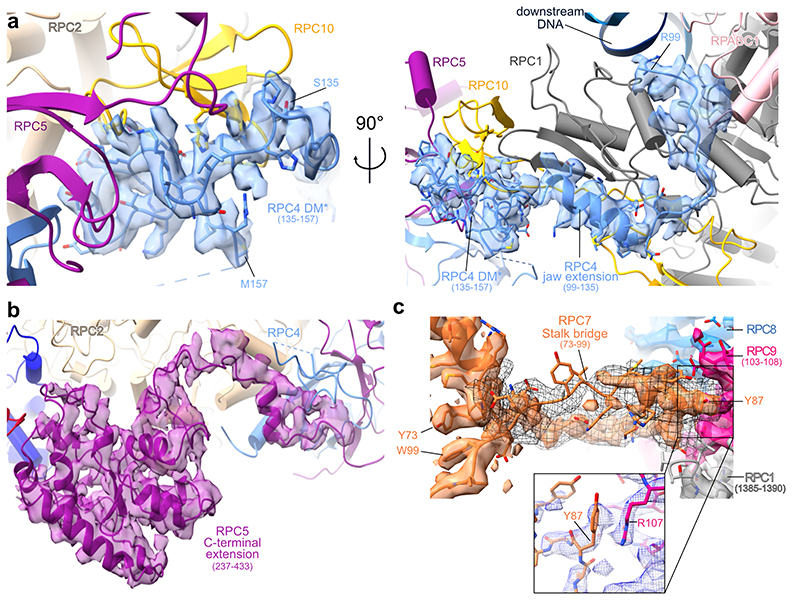
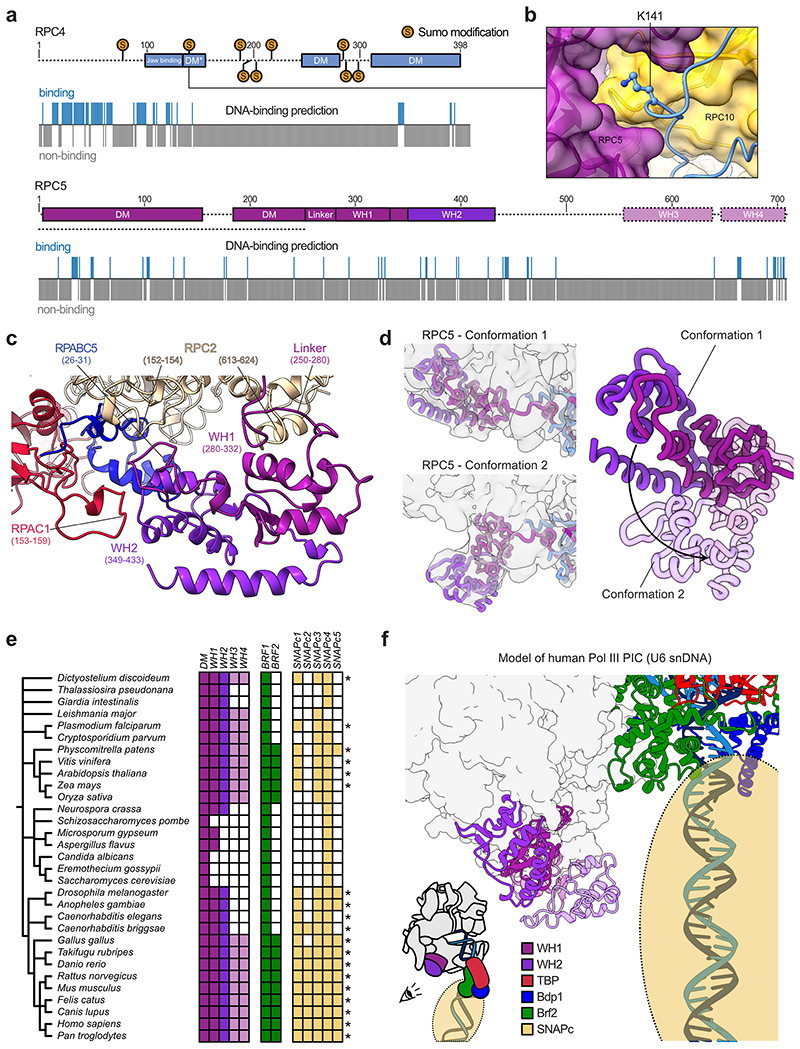
RPC4 and RPC5 (C53 and C37 in S. cerevisiae) assemble via a dimerization module (DM) and bind the polymerase core in a similar fashion as C53-C37 in yeast Pol III32 and TFIIFα/β in the human Pol II pre-initiation complex (PIC)45 (Fig. 3a,b). Human RPC4 contains an extended DM (termed DM*, 133-157) that further runs along the RPC1 jaw domain and enters the DNA binding cleft (Extended Data Fig. 5a). Although not visible in our 3D reconstruction, the RPC4 N-terminal part (1-99) is predicted to bind DNA (Extended Data Fig. 7a), raising the possibility that it binds the downstream DNA in the context of another functional state such as the human Pol III PIC. The yeast orthologue C53 is a major target for post-translational modification by the small ubiquitin-like modifier (SUMO) pathway, which represses Pol III activity46. Similarly to yeast C53, human RPC4 also has been shown to be sumoylated (Extended Data Fig. 7a). Whereas most of the reported SUMO-modified residues lie in a flexible region (158-249) that is not visible in our structure, we could map one of these residues (K141) onto the newly built DM* region. This lysine is buried inside the RPC4 DM* - RPC5 DM - RPC10 (N-ribbon) interface (Extended Data Fig. 7b) and, thus, can only be targeted for sumoylation if the RPC4-RPC5 dimer unfolds. This could serve as a signal to mark misfolded human Pol III for proteasomal degradation.
Fig. 3. Extended structure of human RPC4-RPC5.
a, Schematic domain organisation of subunits RPC4 and RPC5 in the elongating human Pol III complex. Coloured bars indicate modelled regions and are labelled as ‘built’. DM – dimerization module; DM* – RPC4 dimerization module extension; WH – winged-helix domain. Coloured bars indicate modelled regions and are labelled as ‘built’. b, Position of the RPC5 WH1 and WH2 domains, which are connected by a flexible linker to the DM of RPC4-RPC5 in the human Pol III EC (top). RPC4-RPC5 binds polymerase core via its DM domain in a similar fashion as C53-C37 in yeast Pol III (bottom left, PDB 5fj8) and TFIIF in the human Pol II PIC (bottom right, PDB 5iy6). Labelled subunits are shown as cartoons and polymerase cores as surfaces.
RPC5 is the least conserved Pol III subunit, and its size largely varies across species. The C-terminal extension region spanning residues 280-708 is predicted to harbour four winged-helix (WH) domains that are absent in S. cerevisiae C37 (Fig. 3a, Extended Data Fig. 7a,e). The cryo-EM density reveals that the WH1 and WH2 domains of RPC5 are closely intertwined and bind the Pol III core between subunits RPC2, RPAC1, and RPABC5 (Fig. 3b, Extended Data Fig. 7c). The two WH domains are connected to the RPC5 DM domain via a flexible linker. As revealed by masked 3D classification, the WH1-2 domains can also adopt a second conformation (EC-2 Pol III) and can point towards the downstream promoter DNA in the modelled human PIC (Extended Data Fig. 7d,f). The WH3 and WH4 domains are not visible in the cryo-EM reconstructions, indicating that they are mobile and suggesting a function in transcription initiation. Similar functions are reported for the WH domains of yeast Pol I (A49 subunit)47, human Pol II (RAP30 subunit of human TFIIF)45 and yeast Pol III (C34 subunit)33–35. The majority of residues in RPC5 are not predicted to bind DNA (Extended Data Fig. 7a), suggesting that the RPC5 WH domains interact with basal transcription factors instead. The absence of the RPC5 WH domains in S. cerevisiae C37 prompted us to ask if these domains co-evolved with a set of basal transcription factors that are also missing in yeast: TFIIIB subunit Brf2 and the SNAP complex (SNAPc), which are both required for U6 snRNA transcription in humans48. A comprehensive phylogenomic analysis of RPC5, Brf2 and SNAPc subunits reveals that WH1-4, Brf2 and functional SNAPc are mostly absent in fungi whereas nematodes and flies harbour both WH1-2 and SNAPc but lack WH3-4 and Brf2 (Extended Data Fig. 7e, Supplementary Table 1). In contrast, vertebrates and plants encode all of these genetic elements, possibly suggesting a co-evolution and cooperative action of the RPC5 WH domains with Brf2 and the SNAPc. In agreement to this, modelling of the human Pol III PIC indicates that the WH domains are positioned in a way that would allow interactions with Brf2 and SNAPc (Extended Data Fig. 7f). However, the phylogenomic analysis also shows that this proposed function would not hold true for some species like the parasite Leishmania major (Extended Data Fig. 7e) suggesting another or additional function, such as contribution to complex assembly or stability.
The FeS domain ties heterotrimer and core
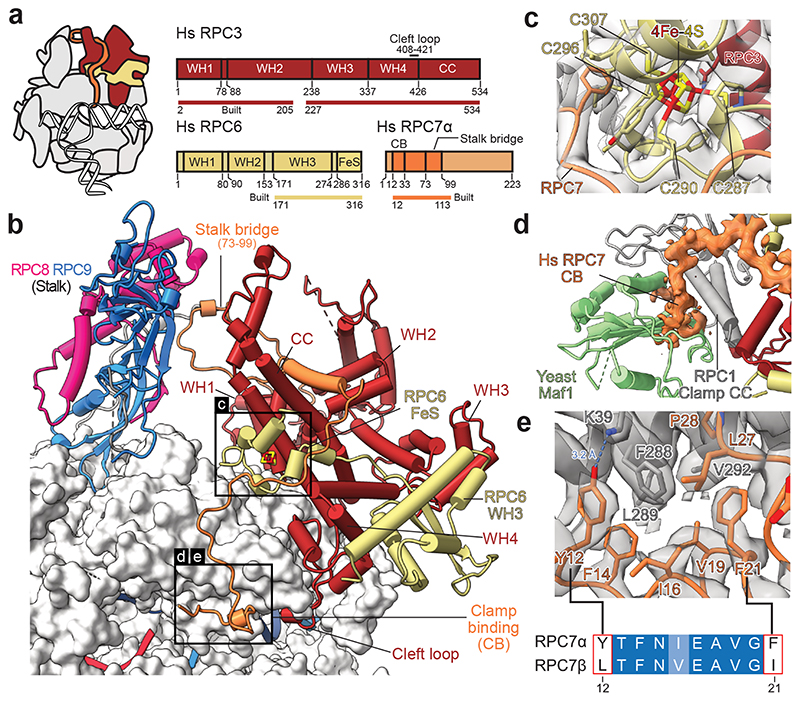
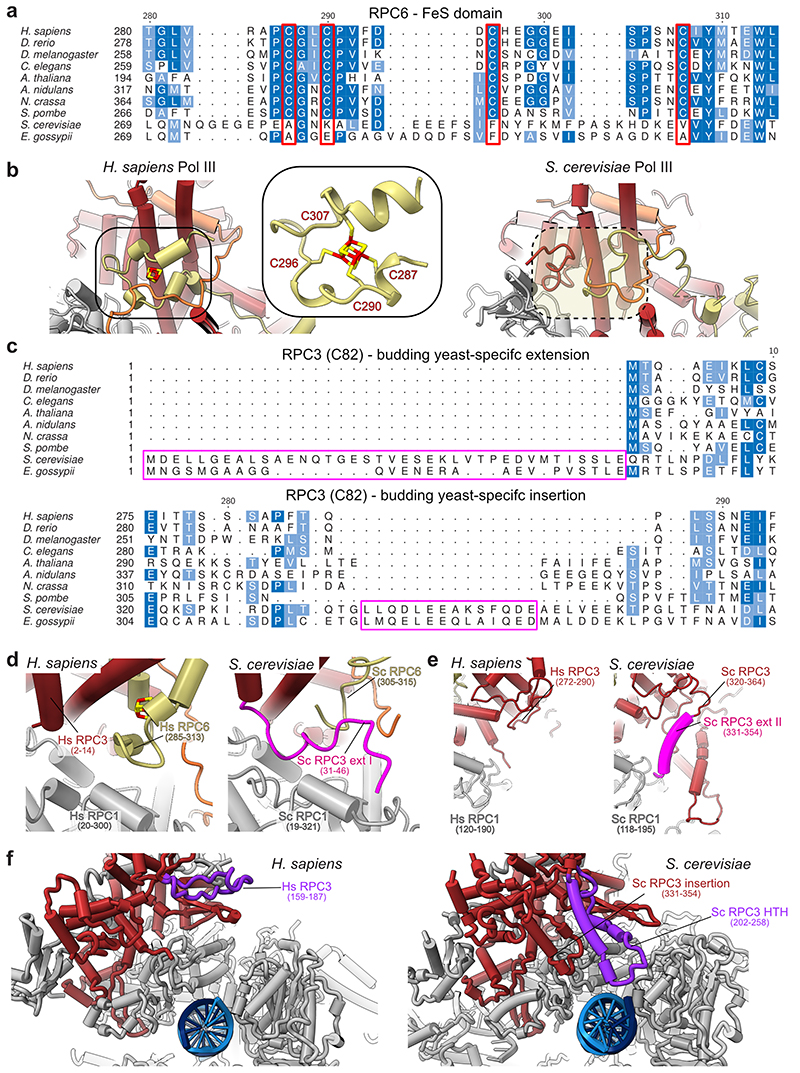
The heterotrimer RPC3-RPC6-RPC7 subcomplex (C82-C34-C31 in S. cerevisiae) sits on top of the polymerase clamp and functions in transcription initiation, for which it utilises multiple conserved WH domains of RPC3 and RPC632 (Fig. 4a). Our cryo-EM structure shows that the human- and yeast heterotrimer bind the polymerase clamp in a similar fashion (Fig. 4b, Extended Data Fig. 8b). In addition, human RPC6 coordinates a previously described cubane 4Fe-4S cluster30 involving four cysteines in its C-terminal region that forms a globular domain (FeS domain) and binds the RPC1 clamp (Fig. 4b,c, Extended Data Fig. 8b,d). The FeS domain is sandwiched between RPC3, RPC7 and the RPC1 clamp and, thereby, serves as an additional interaction hub that interconnects the heterotrimer subunits and ties them to the polymerase core. In agreement with this observation, the 4Fe-4S cluster has been shown to facilitate dimerization and polymerase clamp engagement of the archaeal TFEα/β transcription factor, which is homologous to TFIIE and RPC3-RPC630. Interestingly, the FeS domain is missing in S. cerevisiae and most, except four, budding yeast species, but is otherwise widely conserved (Extended Data Fig. 8a). To answer how budding yeasts compensate for the loss of the FeS domain, we compared the human heterotrimer structure with the one from S. cerevisiae. The comparison reveals that S. cerevisiae RPC3 (C82) features two extensions that bind the polymerase core and are missing in the other analysed model organisms (Extended Data Fig. 8c). The visible part of the N-terminal extension (31-46) overlaps with the position of the RPC6 FeS domain (Extended Data Fig. 8d). The central insertion (331-354) is sandwiched between the clamp and a second helix-turn-helix extension (202-258) of S. cerevisiae RPC3 (C82) that binds the downstream DNA and is also absent in the human heterotrimer (Extended Data Fig. 8e,f). Thus, budding yeast and other species utilise different elements to tightly tether the Pol III heterotrimer to the polymerase core so that Pol III initiates transcription efficiently.
Fig. 4. Architecture of human RPC3-RPC6-RPC7 heterotrimer.
a, Schematic domain organisation of subunits RPC3, RPC6, and RPC7 in the elongating human Pol III complex. Coloured bars indicate modelled regions and are labelled as ‘built’. WH – winged helix, CC – coiled-coil, FeS – Iron-sulphur (4Fe-4S) binding, CB – clamp binding. b, Heterotrimer (RPC3-RPC6-RPC7) and stalk (RPC8-RPC9) are shown as cartoons and bind the Pol III core shown as surface. Boxed regions highlight features that are not visible in yeast Cryo-EM structures. c, Structure of the RPC6 FeS domain binding the cubane 4Fe-4S cluster. Residues within 6 Å of the FeS cluster are shown as sticks, and the four coordinating cysteines are labelled. Cryo-EM density is shown as a transparent surface. d, Superimposition of the apo human Pol III structure with the yeast Pol III-Maf1 structure (PDB 6tut). Only Maf1 is shown and is coloured light green. Cryo-EM density of RPC7 is shown as an orange surface. e, Interface between the RPC1 clamp coiled-coils (CC, grey) and RPC7 (orange). RPC1 F288 is surrounded by aromatic residues of RPC7, of which Y12 and F21 are exclusive to the tumour-associated RPC7α isoform as shown by the sequence alignment between RPC7α (UniProt: O15318) and RPC7β (UniProt: Q9BT43) placed below. Corresponding Cryo-EM density is shown as a grey transparent surface. The blue dashed line indicates a putative hydrogen bond between Y12 (RPC7) and K39 (RPC1).
RPC7 bridges heterotrimer and stalk
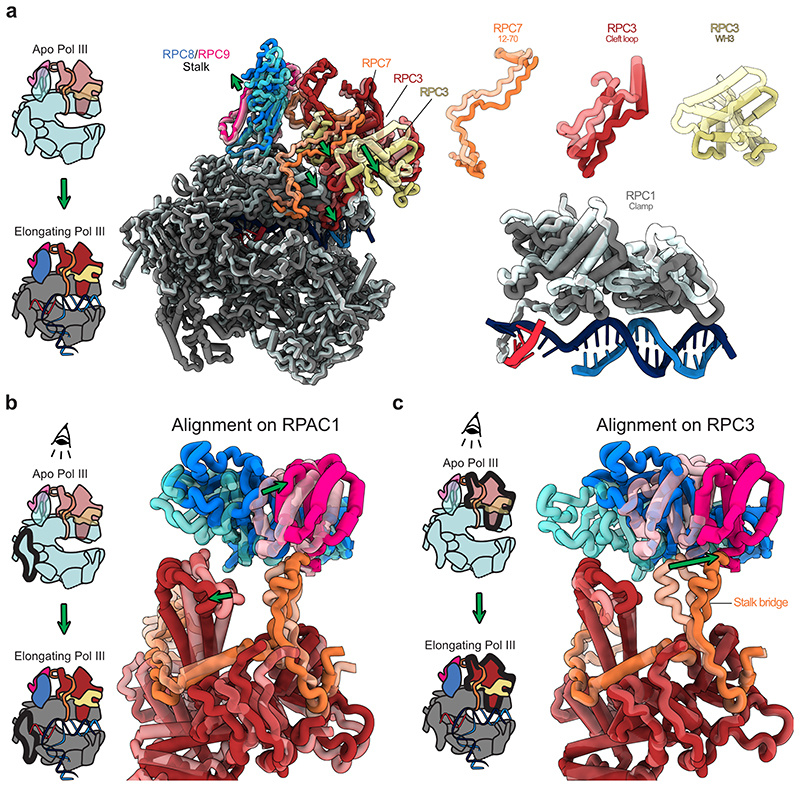
The structures of human Pol III further provide new insights into the function of RPC7 (C31 in S. cerevisiae), which is the third subunit of the heterotrimer and has been proposed to bridge the heterotrimer and the mobile stalk element of Pol III32,33. Improved densities for RPC7, compared to the yeast cryo-EM maps, allowed us to assign the connection between heterotrimer and stalk with high confidence (Extended Data Fig. 5c). The RPC7 stalk bridge comprises residues Y73-W99 and protrudes from a central helix that is tightly enclosed by the RPC3 coiled-coil (CC) domain and the RPC3 WH2 domain (Fig. 4b). RPC7 is anchored to the Pol III stalk with a conserved tyrosine (Y87) that forms a cation-π interaction with R107 of RPC8 and then folds back to bind the RPC3 WH2 domain (Fig. 4b, Extended Data Fig. 5c). While in yeast, the bridge was reported to only form in the process of transcription initiation33, we observe that human RPC7 bridges heterotrimer and stalk in both apo and elongating Pol III (Extended Data Fig. 9). The RPC7 stalk bridge moves together with the stalk upon transition from apo to elongating Pol III, despite an overall movement of the heterotrimer and stalk in opposite directions (Extended Data Fig. 9). Thus, RPC7 ensures that the connection between stalk and heterotrimer is maintained, and the main function of the RPC3 CC and WH2 domains, most likely, is to tether RPC7 to the heterotrimer.
Tumour-associated RPC7α binds the clamp
A better understanding of RPC7 is of biomedical relevance as this subunit occurs in two isoforms: RPC7α (also known as RPC32α and POLR3G) and RPC7β (also known as RPC32β and POLR3GL). RPC7α is enriched in embryonic stem cells and cancer cells4,31,49,50, and its overexpression augments tumour transformation31. Depleting RPC7α also suppresses viability of prostate cancer cells4. Our cryo-EM structures show that the N-terminus of RPC7 (residue 10-33) runs along the RPC1 clamp domain and docks onto the RPC1 clamp coiled-coil (CC) helices (Fig. 4b,d,e). Thereby, this clamp-binding (CB) region would overlap with the Pol III repressor Maf1 in the recently reported cryo-EM structure of S. cerevisiae Pol III bound by Maf136 (Fig. 4d). Thus, RPC7, most likely, must be replaced to enable Pol III repression by the tumour suppressor MAF1 (the homolog to yeast Maf1). In the Pol III-Maf1 structure, the interaction between Maf1 and Pol III is stabilised by an aromatic stacking between W319 (S. cerevisiae Maf1) and W294 (S. cerevisiae RPC1/C160). Importantly, we observe that RPC7 associates with human RPC1 at the same interface via a hydrophobic surface that encloses F288, the human counterpart to W294 in S. cerevisiae RPC1/C160 (Fig. 4e). In our structure, RPC1 F288 is juxtaposed by RPC7α Y12 and potentially forms an aromatic stacking interaction and a hydrogen bond to RPC1 K39. Neither the aromatic stacking nor the hydrogen bond are possible with the corresponding RPC7β residue (L12) (Fig. 4e) suggesting that RPC7α could bind the clamp more tightly than RPC7β. In support of this hypothesis, the corresponding first 25 N-terminal residues in S. cerevisiae RPC7/C31 are more similar to RPC7β then to RPC7α (Supplementary Table 2) and do not bind the clamp in all available S. cerevisiae Pol III structures32–36. We hypothesise that the RPC7α subunit specifically protects against Maf1-mediated Pol III inhibition in tumour cells, providing a potential link between RPC7 isoform selection and tumour transformation. Interestingly, methylation of arginines R5 and R9 in S. cerevisiae RPC7/C31 by Hmt1 increases the affinity of Maf1 to Pol III and represses Pol III activity51. In humans, RPC7β but not RPC7α is a substrate to Hmt151, reinforcing the idea that incorporation of RPC7α results in a Pol III isoform that is resistant to Pol III inhibition by Maf1.
Disease-associated mutations of Pol III
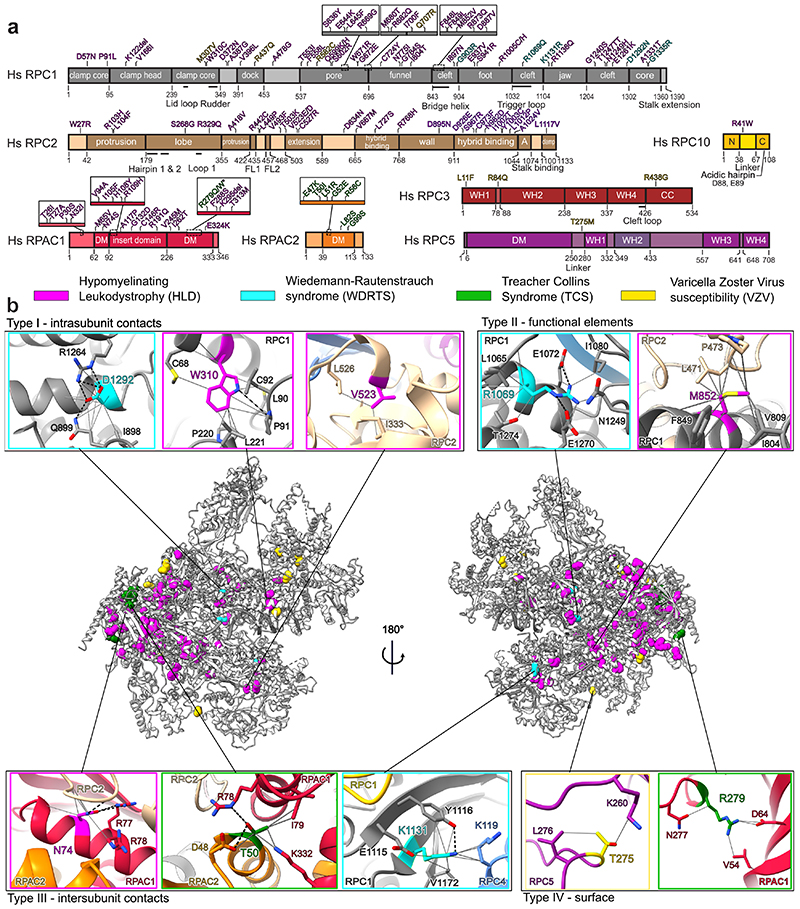
We used 110 point mutations found through genetic studies of patients (Fig. 5a, Supplementary Table 3 and references therein) and mapped them to the cryo-EM structure of human Pol III (Fig. 5b). Side-chain densities for all, except one, of disease-associated mutated residues (Supplementary Table 4) allows us to confidently map and investigate these mutations on a molecular level. Point mutations are found mainly in three clusters: in the core of the complex close to the active site, in subunits RPAC1 and RPAC2 shared with Pol I and in the vicinity of RPC10 where they might affect termination or re-initiation14 (Fig. 5b). On the contrary, the majority of VZV-causing mutations are found on the Pol III surface (Fig. 5a,b). Interestingly, VZV-related mutations have no phenotype in the absence of a viral infection18. Therefore, the identified mutations in RPC3 and RPC5 presumably have little effect on canonical nuclear Pol III transcription, but specifically impair cytosolic transcription of viral AT-rich DNA by Pol III to induce interferon pathways18 and exert control over viral replication19. We speculate that, in the nucleus, where transcription factor TFIIIB interacts extensively with RPC3 and RPC5 to facilitate specific transcription initiation, the effect of these mutations might be buffered, whereas in the cytosol, where transcription initiates unspecifically, the identified mutations impair Pol III activity.
Fig. 5. Disease-associated mutations of Pol III.
a, Schematic representation of Pol III subunits affected by disease-associated mutations mapped onto the domains. R279Q/W mutations (starred) associated with TCS17 was also reported in individuals with HLD10. A – anchor; N – N-terminal domain; C – C-terminal domain; DM – dimerization domain; WH – winged-helix; CC – coiled-coil. b, Disease-associated mutations (coloured spheres associated with each disease) mapped on a cartoon representation of human Pol III. Close up views of representative mutations belonging to one of 4 identified types (see Methods): I – intrasubunit contacts, II – functional elements, III – intersubunit contacts and IV – surface are shown. Grey solid lines - contacts between residues, black dotted lines - hydrogen bonds.
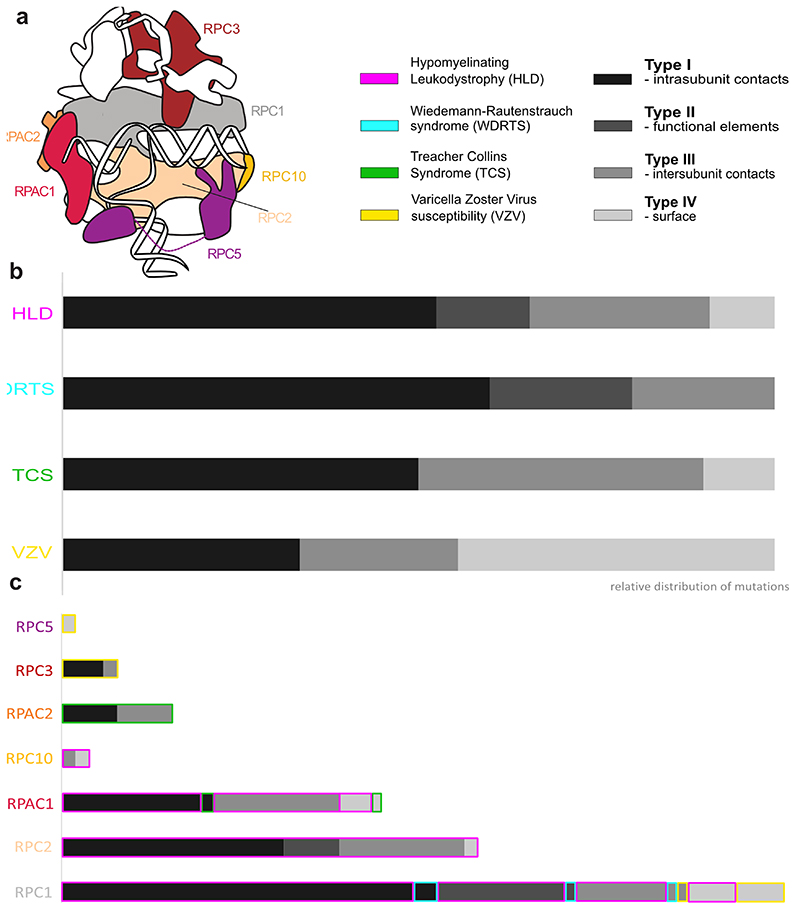
We classified the disease-associated mutations of Pol III into four types explaining their likely mode of function on a molecular level (Supplementary Table 3). Type I mutations disturb the core of a given subunit (Fig. 5b, Supplementary Table 3). Type II mutations affect functional elements such as the bridge helix (F848L, F849L, M852V, R873Q and D887V mutations linked to HLD) or the trigger loop (R1069Q mutation linked to WDRTS) (Fig. 5a,b). Type III mutations are located at the interface between subunits and can impair the assembly of the complex, as observed in the case of the N32I and N74S mutations (Fig. 5b) linked to HLD10. Type IV mutations comprise residues making few contacts and being surface exposed, and we could observe that the majority of them link to VZV (Extended Data Fig. 10). This classification can help to explain the severity of disease phenotypes linked to a given mutation. In case of TCS, mutations found in RPAC2 are dominant (and thus need to be highly deleterious)17 and are all classified as type I or III, while the only recessive TCS mutation R279Q/W found in RPAC110,17, which we assigned to both type I and IV, is associated with less severe structure disturbance (Fig. 5b, Extended Data Fig. 10a,b). In the case of HLD, the subunit in which the mutation is found often correlates with the severity of a disorder. HLD patients having mutations mapping to RPAC1 experience the most severe symptoms, followed by those with mutations in RPC112,13. Many of the type III mutations map to RPAC1 impairing biogenesis of Pol III10, while the majority of the type II mutations map to RPC1 (Extended Data Fig. 10c).
Additional parameters to assess the impact of pathogenic mutations are the calculated solvent accessible surface area (SASA) and the residue degree, which quantifies the number of its contacts to other residues (Supplementary Table 3). We find that higher SASA and a lower degree of mutated residues link to a less severe clinical phenotype. For instance, the WDRTS mutation K1131R (SASA: 19.8 Å2, degree: 17) is considered to be less deleterious than R1069Q (SASA: 10.5 Å2, degree: 23) and D1292N (SASA: 8.4 Å2, degree: 21)15. Accordingly, the human Pol III structure is a useful resource for investigating the molecular environment of mutations and together with a comprehensive point mutation report (Supplementary Table 3) will advance the understanding of the genotype-phenotype relationship in various diseases.
Discussion
Here, we report structures of apo and elongating human Pol III. With a nominal resolution of 2.8 Å, the elongating human Pol III structure corresponds to one of the best-resolved eukaryotic RNA polymerase structures. Notably, most other elongating RNA polymerase structures contain an 8- or 9 base pair modelled DNA-RNA hybrid, whereas in the human Pol III EC structure, we could only model a 6-base pair DNA-RNA hybrid with sufficient certainty. This suggests that human Pol III interacts with the DNA-RNA hybrid less tightly than other polymerases. Indeed, when we compared the cryo-EM densities of the bovine Pol II37 and human Pol III EC structures, we noticed that the DNA-RNA hybrid is less-well resolved in the human Pol III EC cryo-EM map. This observation is in agreement with the finding from our previous study that yeast Pol III binds the DNA-RNA hybrid more weakly than yeast Pol II32. The weak association of the DNA-RNA hybrid reinforces the model that a loose grip on the nucleic acids scaffold in the active centre of Pol III assists transcription termination on poly-thymine termination sequences, which is a key specialisation of Pol III52.
The cryo-EM structures of human Pol III promote our understanding of the Pol III transcription machinery and provide molecular insights into how Pol III misregulation is linked to human pathogenesis. Accordingly, we provide structure-based explanations of how subunit RPC10 functions in transcription termination and how cancer cells may specifically utilise isoform RPC7α to uncouple Pol III activity from repression by the tumour suppressor MAF1. The structure determination of human Pol III was facilitated by CRISPR-Cas9 mediated gene-editing of human suspension cells that enabled purification of homogenous and intact protein sample. The possibility to produce human Pol III in sufficient amounts for functional analysis and high-resolution structure determination may also facilitate the development, characterisation and structure-guided optimisation of inhibitors specifically targeting upregulated Pol III in human cancer cells. We also envision that CRISPR-Cas9 approaches will be increasingly used to produce other challenging human protein complexes to gain structural, functional and biomedical insights.
Methods
Generation of a cell line with endogenously tagged Pol III
CRISPR-Cas9 methodology was used to generate a stable, homozygous cell line with tagged Pol III. Human HEK293T cells (Thermo Fisher Scientific) were engineered based on a modified general protocol53. A 20 bp gRNA (5’-ACTGAGCTTGGATGCTTCTG-3’) was designed using the online tool crispor.tefor.net and cloned into the BpiI site of pSpCas9(BB)-2A-GFP (PX458), a gift from Feng Zhang (Addgene plasmid # 48138)54. The donor sequence with 700 bp homology arms on each side of the insert site was designed based on the HEK293 reference genome55 and synthesised by GenScript into pUC57-Mini plasmid. A tag with mCherry, Strep II, 6xHis and P2A peptide56 followed by a blasticidin resistance gene and the SV40 termination signal was introduced to the C-terminus of the RPAC1 subunit. HEK293T cells cultured in DMEM medium supplemented with 10% FBS and 1% L-glutamine were transfected with the donor plasmid and the plasmid pSpCas9(BB)-2A-GFP (PX458) containing the gRNA, using polyethylenimine reagent in Opti-MEM I Reduced Serum Medium (Gibco). 5 days post-transfection cells were selected with 5 μg/mL blasticidin (Thermo Fisher Scientific). When the survival rate of the cells improved, they were sparsely seeded to form colonies from single cells. 48 hours after seeding, single clone colonies were picked by pipetting into 96 well plates and genotyped. To check for the insertion of the tag one primer annealing within the insert and one annealing within a homology arm were used for PCR. Clones homozygous for the insert were selected and expanded. Correct insertion was validated by Western blotting against mCherry (antibody ab167453; Abcam) and PCR on extracted DNA (GenElute Mammalian Genomic DNA Miniprep Kit; Sigma-Aldrich). Selected clones were finally adapted to growth in suspension in Expi293 Expression Medium (Thermo Fisher Scientific). All cell lines were tested negative for mycoplasma contamination. No cell-line authentication method was used.
Protein purification
Cells were grown up to 7 x 10⁶ cells/mL in Expi293 medium, harvested by centrifugation, washed in PBS and flash-frozen in liquid nitrogen for storage before protein purification. Cell pellets were resuspended in lysis buffer containing 25 mM HEPES pH 7.5, 150 mM (NH4)2SO4, 5 mM MgCl2, 5% glycerol, 20 mM imidazole, 0.5% Triton-X100, 2 mM β-mercaptoethanol in the presence of EDTA-free protease inhibitor cocktail (Roche) and benzonase (Sigma-Aldrich). Cells were sonicated and centrifuged at 235,000 g for 1 h at 4 °C. After filtration, the lysate was loaded on a 5 mL HisTrap HP column (GE Healthcare) washed with Ni wash buffer (25 mM HEPES pH 7.5, 150 mM (NH4)2SO4, 5 mM MgCl2, 5% glycerol, 20 mM imidazole, 2 mM β-mercaptoethanol) and eluted with buffer containing 500 mM imidazole. The elute was then incubated for 1 h at 4 °C with Strep-Tactin beads (IBA Lifesciences) before application to a gravity column. After washing with Strep wash buffer (25 mM HEPES pH 7.5, 150 mM (NH4)2SO4, 5 mM MgCl2, 5% glycerol, 2 mM β-mercaptoethanol), the protein was eluted with buffer containing 100 mM (NH4)2SO4 and 20 mM biotin. The recovered complex was subsequently purified by ion exchange on a MonoQ column (GE Healthcare). Pol III eluted at about 700 mM (NH4)2SO4. It was concentrated on 100K spin concentrators (Merck Millipore) to about 3 mg/mL and then buffer exchanged to EM buffer (15 mM HEPES, pH 7.5, 150 mM (NH4)2SO4, 5 mM MgCl2 and 10 mM DTT). The purity of the sample was assessed by SDS-PAGE and Coomassie blue staining, and the identity of subunits was confirmed by mass spectrometry. The concentrated sample was either flash-frozen in liquid nitrogen and stored at -80 °C for RNA extension assays or used directly for cryo-EM sample preparation. Yeast RNA Pol III was purified as previously described57.
Transcription scaffold preparation
The following nucleic acid oligonucleotides (Sigma-Aldrich, HPLC-grade) were used for the transcription scaffold containing a 12-nt mismatch that was freshly assembled prior to cryo-EM sample preparation of elongating Pol III (see below). Template DNA: 5’-GTTTTAAGTGGAGCTGGATGCTCTGTGGCTCATGGCAACGACCACG-3’, non-template DNA: 5’-CGTGGTCGTTGCCATGTTAACGGACTAGTCCAGCTCCA CTTAAAAC-3’, RNA: 5’-UAUGCAUAACGCCACAGAG-3’. Single-stranded template- and non-template DNA at 100 μM were mixed, incubated at 95 °C in a thermocycler (Bio-Rad) for 3 min, and the temperature was incrementally decreased to 25 °C at a rate of 1 °C/min. The double-stranded DNA (2 μL) was supplemented with 3 μL of hybridisation buffer (40 mM HEPES pH 7.5, 24 mM MgCl2, 200 mM NaCl, 20 mM DTT) and mixed with 1 μL of RNA (100 μM), which was pre-heated in a thermoblock for 3 min at 55 °C. The DNA-RNA mixture was incubated at 45 °C for 3 minutes, cooled down to 20 °C at a rate of 0.7 °C/min, and the annealed DNA-RNA transcription scaffold was kept on ice until usage.
RNA extension and cleavage assays
For RNA extension assays, the RNA primer (see above) was first labelled at its 5’ end using [γ-32P]ATP and T4 PNK. After PAGE purification, the radioactive RNA primer was assembled together with template and non-template strands (see above) in 20 mM HEPES pH 7.5, 100 mM NaCl and 6 mM MgCl2 and 10 mM DTT as indicated above. To assemble the reaction mixture, 2 pmol of the DNA/RNA-32P were incubated with 4 pmol of human or yeast RNA Pol III for 10 min at room temperature, before addition of 0.2 mM of NTPs as indicated in 20 mM HEPES pH 7.5, 60 mM (NH4)2SO4, 10 mM MgSO4 and 10 mM DTT, and further incubated for 45 min at 37 °C. The reaction was stopped by addition of 8M Urea/20% saccharose. The samples were heated for 3 min at 95 °C before loading on denaturing 17% PAGE. The radioactive products were recorded using phosphor-imaging screens (Fujifilm) for capturing digital images. For RNA cleavage assays, the procedure was the same except that no NTPs were added. The incubation times were 0, 5 min, 20 min, 60 min and 120 min.
Negative stain EM
Negative stain EM was used to assess sample quality of purified human Pol III. For the preparation of negative stain grids, human Pol III was diluted to a concentration of 50 nM using EM buffer, and 3.5 μL sample were applied to carbon-coated 400 mesh copper grids (Plano) that were glow discharged using a Pelco EasyGlow instrument. After 60 s incubation, grids were washed twice with EM buffer, stained with 1% (w/v) uranyl acetate staining solution and air dried. Negative stain EM data were acquired on a Tecnai T12 transmission electron microscope (TEM) operated at 120 keV (FEI) with a 4k x 4k CCD camera. Images were recorded at -1 μm defocus and at a magnification of 68,000x corresponding to a pixel size of 1.6 Å/pixels. A dose rate of 40 e/Å2 was used during image acquisition.
Cryo-EM sample preparation
Freshly purified human RNA Pol III was used for cryo-EM sample preparation. Grids were prepared using a Vitrobot Mark IV (Thermo Fisher Scientific), which was set to 100% humidity and 4 °C. The following blotting parameters were used for both copper and gold grids: wait time 10 s, blot force 4, blot time 4 s. For apo RNA Pol III, 3 μL of protein at 1.2 mg/mL in EM buffer was supplemented with 4 mM CHAPSO (final concentration), applied to plasma-cleaned 200-mesh Cu R2/1 or 300-mesh Au R1.2/1.3 grids (both Quantifoil) and plunge-frozen in liquid ethane. For elongating Pol III, the complex at 2 mg/mL in EM buffer was mixed with an equimolar amount of the transcription scaffold, incubated for 60 min on ice, supplemented with 4 mM CHAPSO (final concentration), applied to 200-mesh Cu R2/1 grids and plunge-frozen in liquid ethane as described above. The cryo-EM grids were plasma-cleaned for 30 s using a NanoClean plasma cleaner (Fischione Instruments, Model 1070) and a mixture of 75% argon and 25% oxygen before usage. Cryo-EM data collection and processing and structural model building are described in Supplementary Note 1.
Phylogenomic analysis of Pol III RPC5 subunits and basal transcription factors
The phylogenetic tree of Eukaryotic species was obtained from the NCBI Taxonomy Database58. Reference proteomes for selected species were downloaded from the UniProt website59 and are listed in Supplementary Table 1. In Zea mays, the RPC5 homolog in the representative proteome (UniProt: A0A1D6LJU7) was a partial 340 residue protein with part of the N-terminal missing and was replaced by the UniParc protein UPI0002207C81, a full 677 residue version of the RPC5 protein. Homologs for proteins of interest in this study were retrieved using the HMMER tool60, using Pfam61 domain definitions whenever possible to improve the reliability of the hits. The following UniProt and Pfam identifiers were used for homology searches: SNAPc5 (UniProt: O75971, Pfam: PF15497), SNAPc2 (UniProt: Q13487, Pfam: PF11035), SNAPc4 (UniProt: Q5SXM2), SNAPc3 (UniProt: Q92966, Pfam: PF12251), SNAPc1 (UniProt: Q16533, Pfam: PF09808), Brf1 (UniProt: Q92994, Pfam: PF07741), RPC6 (UniProt: Q9H1D9, Pfam PF05158), Brf2 (UniProt: Q9HAW0), RPC5 (UniProt: Q9NVU0, Pfam PF04801). Furthermore, Pfam family Sin_N has been renamed to RPC5, TFIIB has been improved to cover domains in Brf2, and SNAPc19 family has been iterated to include further remote homologs. Individual domains of RPC5 protein (DM and WH1-4) were assigned based on a multiple sequence alignment of all the RPC5 homologs. The Interactive Tree of Life (iTOL) online tool62 was used to create the final annotated phylogenetic tree.
Analysis of Pol III mutations
Residues found to be affected by point mutations in human genetic studies were visualised using ChimeraX. Contacts and hydrogen bonds at 0.4 Å were considered. Contacts were also inspected using Protein Contacts Atlas63, and it was used to create Cytoscape64 complex network. Degree of each residue was calculated using igraph65 using the degree function. Solvent accessible surface area (SASA) was calculated with FreeSASA66. The type of mutation was assigned based on visual inspection, location within the structural elements (for type II), contacts to residues from other subunits (for type III) and SASA (above average for type IV). Residue degree was used to access the potential severity of mutation with higher degree giving a likely more deleterious outcome of a mutation.
Extended Data
Extended Data Fig. 1. Endogenous tagging of RPAC1 and analysis of purified Pol III.
Zygosity PCR with purified genomic DNA from WT cells HEK293T and produced RPAC1-Strep II-mCherry tagged cell line. The experiment was performed twice. b, Western blot of cell lysates from WT cells and positive for the insert cell line probed with anti-mCherry antibody (Abcam). The experiment was performed once. c, Representative negative stain micrograph showing homogenous sample. d, Coomassie-stained SDS-PAGE of purified Pol III complex. Identities of the labelled bands were confirmed by mass spectrometry with the highest scoring hit shown. For RPC7 (starred) the α isoform was detected as most abundant, while β isoform was also present in the sample. e, Primer extension assay confirming the activity of the purified complex. 5’ radioactively tagged RNA primer (starred) assembled with the DNA scaffold (cartoon representation) was used. Arrows indicate the extended primer products. For experimental details, see Methods. Uncropped images for all panels are shown in the Source Data.
Extended Data Fig. 2. Global Cryo-EM data processing strategy of apo and elongating human Pol III.
a, Talos Arctica screening dataset, from which a low-resolution 3D reconstruction of apo human Pol III at 8 Å was obtained. b, Processing pipeline of the Titan Krios data set of apo human Pol III. For global 3D classification, the low-resolution Apo Pol III map (filtered to 60 Å) was used as a reference model. c, Processing pipeline of the Titan Krios data set of elongating human Pol III. For global 3D classification, the high-resolution Apo Pol III map (filtered to 60 Å) was used as a reference model. High-resolution cryo-EM maps were further subjected to RELION multi-body refinement67 with applied masks (transparent surfaces) covering the core and heterodimer (green maps A1, B1) and the clamp, heterotrimer and stalk domains (purple maps A2, B2). Representative micrographs of the three datasets are shown on the left. Shown are the unsharpened cryo-EM maps whereas reported resolution values correspond to automatically B-factor sharpened maps obtained via RELION post-processing. Resolution values of the unsharpened maps are added with parenthesis. Shown particle numbers were rounded down. All maps, marked with coloured boxes, were used for structural model building.
Extended Data Fig. 3. Refined cryo-EM data processing strategy to improve signals of flexible regions.
Conformation heterogeneity was resolved using masked classification in RELION. Coloured unfilled circles mark regions with applied masks. Filled, transparent circles highlight elements with improved cryo-EM density. Threshold levels of the shown maps were individually adjusted to visualise flexible elements. Maps labelled with coloured boxes were used for structural model building. Map G and H derived from a merged dataset of apo and elongating human Pol III. Both RELION68 and CryoSPARC69 were used for data processing, as indicated.
Extended Data Fig. 4. Cryo-EM data quality assessment.
a, FSC curves of the apo and elongating Pol III showing final average resolutions of 3.3Å and 2.8Å, respectively (FSC = 0.143). b, FSC curves of cryo-EM maps with resolved flexible regions seen in Extended Data Fig. 3. Nominal resolution values for are given in brackets (FSC = 0.143). Local resolution estimation of c, apo Pol III and d, elongating Pol III as implemented in RELION. Corresponding angular distribution plots of all particles contributing to apo and elongating Pol III structures given on the right-hand side of c, and d, panels respectively. Fit of the modelled representative active site elements (stick representation): e, wall, f, bridge helix and g, trigger loop into its corresponding cryo-EM densities (surface representation). h, Fit of the nucleic acids into its corresponding cryo-EM density (coloured surface representation). Low-pass filtered by Gaussian filter = 1.5 density shown in mesh representation.
Extended Data Fig. 5. Cryo-EM density around newly built regions of human RPC4, RPC5 and RPC7.
a, Newly built RPC4 dimerization domain shown in molecular context (cartoon). b, RPC5 C-terminal domain, built into map F, is anchored to RPC2 and RPC4. c, Stalk bridge connecting the heterotrimer. Black mesh representation shows a 5 Å low-pass filtered cryo-EM density. Key interacting residues Y87 of RPC7 and R107 of RPC9 are shown in a close-up. The corresponding cryo-EM density is shown as blue mesh and belongs to map B2 (RELION multi-body refinement on elongating Pol III) sharpened by density modification.
Extended Data Fig. 6. Structures of human RPC10 in different conformations.
Shown are cartoon representations of human RPC10 or its homologues in yeast, of nucleic acids and of the polymerase regions that form the pore and funnel domains and the jaw domain. Acidic hairpins of RPC10, C11 and TFIIS are coloured dark red. a, RPC10 C-ribbon (C) adopting the ‘outside funnel’ conformation in the elongating Pol III structure. b, Cryo-EM density (map E) is depicted as transparent grey surface and shows the fit of the C-ribbon of RPC10 in the ‘outside funnel’ conformation. c, C11 (the yeast homolog to RPC10) shows a different conformation of its C-ribbon domain, whereas the position of the N-ribbon (N) is similar in both species. Shown is the yeast apo Pol III structure (PDB 5fja) because the C-ribbon is not visible other conformational states. d, The RPC10 C-ribbon in the ‘outside funnel’ conformation folds back and bind its linker and the RPC1 jaw. RPC10 from residues 83 to 91 are shown as ribbon, and interacting residues within 4 Å distance are shown as sticks (left). Sequence alignments of H. sapiens RPC1 and S. cerevisiae C160 and of H. sapiens RPC10 and S. cerevisiae C11 covering the respective regions (right) shows that the contacting residues are not conserved. e, RNA cleavage assay of the 32P-labelled RNA annealed to the same transcription scaffold as used for structure determination of elongating Pol III. Shown is a time course from 0 to 120 minutes. Lane 0* contains RNA in the absence of polymerase. Hs – H. sapiens; Sc – S. cerevisiae. Uncropped image is shown in the Source Data. f, RPC10 (C) adopting the ‘inside funnel’ conformation (EC-3 Pol III) upon straightening of the linker. g, Cryo-EM density (map D) is depicted as transparent grey surface and shows the fit of the C-ribbon of RPC10 in the ‘inside funnel’ conformation. h, Structure of yeast TFIIS bound to Pol II in its ‘reactivation intermediate’ conformation (PDB 3PO3). i, j, Comparison between the structures of i, human Pol III RPC10 in the ‘inside funnel’ conformation and j, yeast Pol II bound to TFIIS (PDB 3PO3). Close-up views of RPC10 and TFIIS reaching into the active are shown on the right. RPC10 doesn’t reach as far into the polymerase active site as TFIIS. The acidic hairpin is inflected in RPC10 and is extended in TFIIS. Gating tyrosines of human Pol III RPC2 (Y684) and yeast Pol II RPB2 (Y769) are shown as sticks and adopt different conformations.
Extended Data Fig. 7. Structural and computational analysis of RPC4-RPC5 extensions.
Schematic domain organisation of human RPC4 and RPC5 with DNA binding predictions below as predicted by DP-Bind70. Sumo-modifications of human RPC4 (K78, K141, K190, K199, K206, K220, K285, K288, K302) are marked on the sequence and were obtained from the PhosphoSitePlus database71. Dashed lines indicate regions that were not visible in the human Pol III cryo-EM maps. Human RPC5 contains, according to sequence homology prediction72, four WH domains that are absent in S. cerevisiae. b, Close-up view onto K141 of RPC4 being buried within the interface of RPC4 DM* (shown as cartoon), RPC5 and RPC10 (shown as transparent surfaces). c, Structural model of newly built RPC5 WH1 and WH2 domains binding the Pol III core subunits RPC2, RPAC1, and RPABC5. Corresponding contact points are labelled. d, Conformational dynamics of the WH1-WH2 domains. Left: Cryo-EM maps of human Pol III, in which RPC5 WH domains adopt conformation 1 (map F, top) and conformation 2 (map H, bottom). Cryo-EM maps were low-pass filtered to 6 Å and are shown as transparent surfaces. RPC4 and RPC5 are shown as thick ribbons. Right: Superimposition of the WH domains in the two conformations. The black arrow illustrates their movement. The WH domains in conformation 2 are shown as transparent cartoons e, Phylogenetic analysis of RPC5 and its WH domains, of TFIIIB components Brf1 and Brf2, as well as of the SNAPc genes. The colour code for RPC5 is the same as in a. Coloured and white squares indicate identified and not-identified homologues, respectively. The stars mark species, in which all the SNAPc building blocks were found that are likely required to form a functional SNAPc complex (SNAPc1, SNAPc3, SNAPc4) For further details of phylogenetic analysis see Methods. f, Model of the human Pol III PIC assembled onto the U6 snDNA promoter. Pol III core is shown as surface and RPC5 WH domains, Brf2, Bdp1, TBP and DNA are represented as cartoons. SNAPc is illustrated as transparent sphere. The model was generated using Chimera and Coot by: i) superimposing human TBP from PDB 5n9g onto yeast TBP in PDB 6f42, ii) extending the upstream DNA in 5n9g manually with ideal B-DNA carrying the human U6 snDNA sequence in Coot, iii) superimposing the elongating human Pol III model onto the model of yeast Pol III with Chain C (RPAC1) being used for alignment. SNAPc was placed onto the modelled downstream DNA according to information retrieved from the literature48,73.
Extended Data Fig. 8. Structure, function and evolution the RPC6 FeS domain and RPC3 extensions.
a, Multiple sequence alignment (MSA) of the RPC6 C-terminal FeS domain from model organisms. MSA was generated via T-Coffee74 implemented into the EMBL-EBI bioinformatic tools web service75. The four cysteine residues required for coordination of the FeS cluster are highlighted in red. b, Comparison of the RPC3-RPC6-RPC7 heterotrimer from H. sapiens (left, elongating Pol III) and S. cerevisiae (right, PDB 6eu3). The cubane FeS cluster is coloured in red and yellow. The position of the FeS cluster is framed, and a close-up view shows the four cysteines coordinating the FeS cluster. The equivalent position in S. cerevisiae Pol III structure, which lacks the FeS cluster, is marked with a dashed oval. c, MSA of the RPC3 (C82 in S. cerevisiae) N-terminus and of region 275-294 (H. sapiens) generated with T-Coffee. The MSA of the RPC3 N-terminus was manually adjusted, based on the available structural information (see panel d), so that the N-terminus of budding yeasts becomes apparent as an N-terminal extension instead of an insertion. The budding yeast specific N-terminal extension and central insertion (331-354 in S. cerevisiae) are highlighted with pink frames. d-f, Close-up comparisons between H. sapiens (elongating Pol III) and S. cerevisiae (PDB 6eu3 in d, e and 6f41 in f) Pol III structural elements that contribute to heterotrimer integrity and anchoring to the RPC1 (C160 in S. cerevisiae) core subunit. d, Budding yeast-specific N-terminal extension is positioned similarly as the FeS cluster in H. sapiens Pol III. Notably, only 16 residues (31-46) of the extension are visible, whereas the remaining amino acids are flexible. e, The central insertion (331-354) binds the polymerase core, whereas this contact point is missing in H. sapiens. f, S. cerevisiae Pol III contains a helix-turn-helix (HTH) insertion (202-258) that binds the downstream DNA in the S. cerevisiae PIC (PDB 6f41). The HTH insertion further binds and stabilises the central insertion (331-354) and, thereby, likely contributes to the anchoring of the heterotrimer to the polymerase core. Both elements are absent in H. sapiens although the counterpart region (159-187 in H. sapiens) has a similar shape (albeit without α-helical elements) that points into a different direction. Hs – H. sapiens; Sc – S. cerevisiae. Sc RPC1, Sc RPC3, Sc RPC6 relate to Sc C160, Sc C82, Sc C34, respectively, according to the commonly used nomenclature of S. cerevisiae Pol III subunits.
Extended Data Fig. 9. RPC7 tethers heterotrimer and stalk that move in opposite directions.
Protein elements are shown as thick ribbon to better visualize conformational changes. a, Left: Schematic showing the transition from DNA-unbound Apo Pol III to DNA/RNA-bound elongating Pol III. Middle: Side view showing the superimposition of apo and elongating human Pol III with RPAC1 being used for aligning the two structures. Apo Pol and elongating human Pol III are shown as transparent and solid ribbons, respectively. Green arrows illustrate movements of Pol III heterotrimer and clamp and the polymerase stalk domain. Right: Close-up views on selected moving elements showing that heterotrimer and clamp move towards the bound downstream DNA upon transition from apo to elongating Pol III. b, c, Top views onto the heterotrimer and stalk domains with two different subunits (RPAC1 in b and RPC3 in c) used to align apo and elongating human Pol III structures. Aligned subunits are outlined in bold in the associated schematics shown on the left. b, The RPC7 stalk bridge tethers heterotrimer and stalk although they the two domains move in opposite directions. c, The tip of the RPC7 stalk bridge is anchored to the stalk domain and moves in the same direction.
Extended Data Fig. 10. Outlined types of point mutations in Pol III correlate with diseases.
a, Cartoon representation of Pol III showing affected subunits (in colour). Diseases correlated with mutations and types they have been assigned to. b, Relative distribution of types of mutations in each considered disease. c, Relative distribution of types of mutations in each subunit. Coloured outlines reference diseases. Size of bars corresponds to the number of mutations within each subunit. For the type assignment, see Methods. For details of individual mutations, see Supplementary Table 2.
Supplementary Material
Reporting Summary.
Further information on experimental design is available in the Nature Research Reporting Summary linked to this article.
Acknowledgements
We thank F. Dossin for giving valuable advice on CRISPR-Cas9 and sharing a plasmid used in gene editing, F. Weis and W.J.H. Hagen (EMBL Cryo-Electron Microscopy Service Platform) for EM support, P. Haberkant and M. Rettel (EMBL Proteomics Core Facility) for carrying out MS analysis, T. Hoffmann and J. Pecar for setting-up and maintaining the high-performance computing environment and current members of the Müller lab and S. Eustermann for discussions. M.G. was supported by a Boehringer Ingelheim Fonds PhD fellowship. M.G, A.D.M and A.L. acknowledge support by the EMBL International PhD program.
Footnotes
Author Contributions
C.W.M. initiated and supervised the project. M.G. initiated the project, carried out EM grid preparation, data collection and processing, model building and interpreted the structures. A.D.M. generated HEK293F cell lines via CRISPR-Cas9 mediated gene-editing, purified proteins and analysed Pol III mutations, M.K.V. assisted with structural model building, interpretation of the structures and advices with EM data processing. A.L. and A.B. performed the phylogenomic analysis. F.B. did RNA extension and cleavage assays. H.G. performed cell culture work, advised and assisted with CRISPR-Cas9 mediated gene-editing and protein purification. M.G., A.D.M. and C.W.M. wrote the manuscript with input from the other authors.
Competing Interests
The authors declare no competing interests.
Data Availability
Cryo-EM maps of human Pol III (map A to map G) have been deposited at the Electron Microscopy Data Base (EMDB) under accession codes EMD-11673 (map A) and EMD-11736 to EMD-11742 (map B to H). Atomic models of human Pol III have been deposited at the Protein Data Bank under accession codes: 7A6H (apo Pol III), 7AE1 (EC-1 Pol III), 7AEA (EC-2 Pol III) and 7AE3 (EC-3 Pol III).
References
- 1.Arimbasseri AG, Maraia RJ. RNA Polymerase III Advances: Structural and tRNA Functional Views. Trends Biochem Sci. 2016;41:546–559. doi: 10.1016/j.tibs.2016.03.003. [DOI] [PMC free article] [PubMed] [Google Scholar]
- 2.Willis IM, Moir RD. Signaling to and from the RNA Polymerase III Transcription and Processing Machinery. Annu Rev Biochem. 2018;87:75–100. doi: 10.1146/annurev-biochem-062917-012624. [DOI] [PMC free article] [PubMed] [Google Scholar]
- 3.Lei J, Chen S, Zhong S. Abnormal expression of TFIIIB subunits and RNA Pol III genes is associated with hepatocellular carcinoma. Liver Res. 2017;1:112–120. doi: 10.1016/j.livres.2017.08.005. [DOI] [PMC free article] [PubMed] [Google Scholar]
- 4.Petrie JL, et al. Effects on prostate cancer cells of targeting RNA polymerase III. Nucleic Acids Res. 2019;47:3937–3956. doi: 10.1093/nar/gkz128. [DOI] [PMC free article] [PubMed] [Google Scholar]
- 5.Filer D, et al. RNA polymerase III limits longevity downstream of TORC1. Nature. 2017;552:263–267. doi: 10.1038/nature25007. [DOI] [PMC free article] [PubMed] [Google Scholar]
- 6.Ablasser A, et al. RIG-I-dependent sensing of poly(dA:dT) through the induction of an RNA polymerase III-transcribed RNA intermediate. Nat Immunol. 2009;10:1065–1072. doi: 10.1038/ni.1779. [DOI] [PMC free article] [PubMed] [Google Scholar]
- 7.Chiu Y-H, MacMillan JB, Chen ZJ. RNA Polymerase III Detects Cytosolic DNA and Induces Type I Interferons through the RIG-I Pathway. Cell. 2009;138:576–591. doi: 10.1016/j.cell.2009.06.015. [DOI] [PMC free article] [PubMed] [Google Scholar]
- 8.Bernard G, et al. Mutations of POLR3A encoding a catalytic subunit of RNA polymerase pol III cause a recessive hypomyelinating leukodystrophy. Am J Hum Genet. 2011;89:415–423. doi: 10.1016/j.ajhg.2011.07.014. [DOI] [PMC free article] [PubMed] [Google Scholar]
- 9.Tétreault M, et al. Recessive mutations in POLR3B, encoding the second largest subunit of Pol III, cause a rare hypomyelinating leukodystrophy. Am J Hum Genet. 2011;89:652–655. doi: 10.1016/j.ajhg.2011.10.006. [DOI] [PMC free article] [PubMed] [Google Scholar]
- 10.Thiffault I, et al. Recessive mutations in POLR1C cause a leukodystrophy by impairing biogenesis of RNA polymerase III. Nat Commun. 2015;6 doi: 10.1038/ncomms8623. 7623. [DOI] [PMC free article] [PubMed] [Google Scholar]
- 11.Saitsu H, et al. Mutations in POLR3A and POLR3B encoding RNA polymerase III subunits cause an autosomal-recessive hypomyelinating leukoencephalopathy. Am J Hum Genet. 2011;89:644–651. doi: 10.1016/j.ajhg.2011.10.003. [DOI] [PMC free article] [PubMed] [Google Scholar]
- 12.Gauquelin L, et al. Clinical spectrum of POLR3-related leukodystrophy caused by biallelic POLR1C pathogenic variants. Neurol Genet. 2019;5:e369. doi: 10.1212/NXG.0000000000000369. [DOI] [PMC free article] [PubMed] [Google Scholar]
- 13.Wolf NI, et al. Clinical spectrum of 4H leukodystrophy caused by POLR3A and POLR3B mutations. Neurology. 2014;83:1898–1905. doi: 10.1212/WNL.0000000000001002. [DOI] [PMC free article] [PubMed] [Google Scholar]
- 14.Dorboz I, et al. Mutation in POLR3K causes hypomyelinating leukodystrophy and abnormal ribosomal RNA regulation. Neurol Genet. 2018;4:e289. doi: 10.1212/NXG.0000000000000289. [DOI] [PMC free article] [PubMed] [Google Scholar]
- 15.Paolacci S, et al. Specific combinations of biallelic POLR3A variants cause Wiedemann-Rautenstrauch syndrome. J Med Genet. 2018;55:837–846. doi: 10.1136/jmedgenet-2018-105528. [DOI] [PubMed] [Google Scholar]
- 16.Wambach JA, et al. Bi-allelic POLR3A Loss-of-Function Variants Cause Autosomal-Recessive Wiedemann-Rautenstrauch Syndrome. Am J Hum Genet. 2018;103:968–975. doi: 10.1016/j.ajhg.2018.10.010. [DOI] [PMC free article] [PubMed] [Google Scholar]
- 17.Dauwerse JG, et al. Mutations in genes encoding subunits of RNA polymerases I and III cause Treacher Collins syndrome. Nat Genet. 2011;43:20–22. doi: 10.1038/ng.724. [DOI] [PubMed] [Google Scholar]
- 18.Ogunjimi B, et al. Inborn errors in RNA polymerase III underlie severe varicella zoster virus infections. J Clin Invest. 2017;127:3543–3556. doi: 10.1172/JCI92280. [DOI] [PMC free article] [PubMed] [Google Scholar]
- 19.Carter-Timofte ME, et al. Mutations in RNA Polymerase III genes and defective DNA sensing in adults with varicella-zoster virus CNS infection. Genes Immun. 2017;127:3543–3556. doi: 10.1038/s41435-018-0027-y. [DOI] [PubMed] [Google Scholar]
- 20.Vannini A, Cramer P. Conservation between the RNA Polymerase I, II, and III Transcription Initiation Machineries. Mol Cell. 2012;45:439–446. doi: 10.1016/j.molcel.2012.01.023. [DOI] [PubMed] [Google Scholar]
- 21.Brun I, Sentenac A, Werner M. Dual role of the C34 subunit of RNA polymerase III in transcription initiation. EMBO J. 1997;16:5730–41. doi: 10.1093/emboj/16.18.5730. [DOI] [PMC free article] [PubMed] [Google Scholar]
- 22.Wang Z, Roeder RG. Three human RNA polymerase III-specific subunits form a subcomplex with a selective function in specific transcription initiation. Genes Dev. 1997;11:1315–1326. doi: 10.1101/gad.11.10.1315. [DOI] [PubMed] [Google Scholar]
- 23.Lefèvre S, et al. Structure-function analysis of hRPC62 provides insights into RNA polymerase III transcription initiation. Nat Struct Mol Biol. 2011;18:352–358. doi: 10.1038/nsmb.1996. [DOI] [PubMed] [Google Scholar]
- 24.Hu P, et al. Characterization of Human RNA Polymerase III Identifies Orthologues for Saccharomyces cerevisiae RNA Polymerase III Subunits. Mol Cell Biol. 2002;22:8044–8055. doi: 10.1128/MCB.22.22.8044-8055.2002. [DOI] [PMC free article] [PubMed] [Google Scholar]
- 25.Kassavetis GA, Prakash P, Shim E. The C53/C37 Subcomplex of RNA Polymerase III Lies Near the Active Site and Participates in Promoter Opening. J Biol Chem. 2010;285:2695–2706. doi: 10.1074/jbc.M109.074013. [DOI] [PMC free article] [PubMed] [Google Scholar]
- 26.Arimbasseri AG, Maraia RJ. Mechanism of Transcription Termination by RNA Polymerase III Utilizes a Non-template Strand Sequence-Specific Signal Element. Mol Cell. 2015;58:1124–1132. doi: 10.1016/j.molcel.2015.04.002. [DOI] [PMC free article] [PubMed] [Google Scholar]
- 27.Landrieux E, et al. A subcomplex of RNA polymerase III subunits involved in transcription termination and reinitiation. EMBO J. 2006;25:118–128. doi: 10.1038/sj.emboj.7600915. [DOI] [PMC free article] [PubMed] [Google Scholar]
- 28.Chédin S, Riva M, Schultz P, Sentenac A, Caries C. The RNA cleavage activity of RNA polymerase III is mediated by an essential TFIIS-like subunit and is important for transcription termination. Genes Dev. 1998;12:3857–3871. doi: 10.1101/gad.12.24.3857. [DOI] [PMC free article] [PubMed] [Google Scholar]
- 29.Iben JR, et al. Point mutations in the Rpb9-homologous domain of Rpc11 that impair transcription termination by RNA polymerase III. Nucleic Acids Res. 2011;39:6100–6113. doi: 10.1093/nar/gkr182. [DOI] [PMC free article] [PubMed] [Google Scholar]
- 30.Blombach F, et al. Archaeal TFEα/β is a hybrid of TFIIE and the RNA polymerase III subcomplex hRPC62/39. Elife. 2015;4:e08378. doi: 10.7554/eLife.08378. [DOI] [PMC free article] [PubMed] [Google Scholar]
- 31.Haurie V, et al. Two isoforms of human RNA polymerase III with specific functions in cell growth and transformation. Proc Natl Acad Sci. 2010;107:4176–4181. doi: 10.1073/pnas.0914980107. [DOI] [PMC free article] [PubMed] [Google Scholar]
- 32.Hoffmann NA, et al. Molecular structures of unbound and transcribing RNA polymerase III. Nature. 2015;528:231–236. doi: 10.1038/nature16143. [DOI] [PMC free article] [PubMed] [Google Scholar]
- 33.Abascal-Palacios G, Ramsay EP, Beuron F, Morris E, Vannini A. Structural basis of RNA polymerase III transcription initiation. Nature. 2018;553:301–306. doi: 10.1038/nature25441. [DOI] [PubMed] [Google Scholar]
- 34.Vorländer MK, Khatter H, Wetzel R, Hagen WJH, Müller CW. Molecular mechanism of promoter opening by RNA polymerase III. Nature. 2018;553:295–300. doi: 10.1038/nature25440. [DOI] [PMC free article] [PubMed] [Google Scholar]
- 35.Han Y, Yan C, Fishbain S, Ivanov I, He Y. Structural visualization of RNA polymerase III transcription machineries. Cell Discov. 2018;4:40. doi: 10.1038/s41421-018-0044-z. [DOI] [PMC free article] [PubMed] [Google Scholar]
- 36.Vorländer MK, et al. Structural basis for RNA polymerase III transcription repression by Maf1. Nat Struct Mol Biol. 2020;27:229–232. doi: 10.1038/s41594-020-0383-y. [DOI] [PMC free article] [PubMed] [Google Scholar]
- 37.Bernecky C, Herzog F, Baumeister W, Plitzko JM, Cramer P. Structure of transcribing mammalian RNA polymerase II. Nature. 2016;529:551–554. doi: 10.1038/nature16482. [DOI] [PubMed] [Google Scholar]
- 38.Kettenberger H, Armache KJ, Cramer P. Complete RNA polymerase II elongation complex structure and its interactions with NTP and TFIIS. Mol Cell. 2004;16:955–965. doi: 10.1016/j.molcel.2004.11.040. [DOI] [PubMed] [Google Scholar]
- 39.Wang D, et al. Structural basis of transcription: Backtracked RNA Polymerase II at 3.4 Angstrom Resolution. Science. 2009;324:1203–1206. doi: 10.1126/science.1168729. [DOI] [PMC free article] [PubMed] [Google Scholar]
- 40.Cheung ACM, Cramer P. Structural basis of RNA polymerase II backtracking, arrest and reactivation. Nature. 2011;471:249–253. doi: 10.1038/nature09785. [DOI] [PubMed] [Google Scholar]
- 41.Punjani A, Fleet DJ. 3D Variability Analysis: Resolving continuous flexibility and discrete heterogeneity from single particle cryo-EM. bioRxiv. 2020:2020.04.08.032466. doi: 10.1016/j.jsb.2021.107702. [DOI] [PubMed] [Google Scholar]
- 42.Huang Y, Intine RV, Mozlin A, Hasson S, Maraia RJ. Mutations in the RNA Polymerase III Subunit Rpc11p That Decrease RNA 3 Ј Cleavage Activity Increase 3 Ј -Terminal Oligo (U) Length and La-Dependent tRNA Processing. Mol Cell Biol. 2005;25:621–636. doi: 10.1128/MCB.25.2.621-636.2005. [DOI] [PMC free article] [PubMed] [Google Scholar]
- 43.Mishra S, Maraia RJ. RNA polymerase III subunits C37/53 modulate rU:dA hybrid 3′ end dynamics during transcription termination. Nucleic Acids Res. 2019;47:310–327. doi: 10.1093/nar/gky1109. [DOI] [PMC free article] [PubMed] [Google Scholar]
- 44.Dieci G, Sentenac A. Facilitated recycling pathway for RNA polymerase III. Cell. 1996;84:245–252. doi: 10.1016/s0092-8674(00)80979-4. [DOI] [PubMed] [Google Scholar]
- 45.He Y, et al. Near-atomic resolution visualization of human transcription promoter opening. Nature. 2016;533:359–365. doi: 10.1038/nature17970. [DOI] [PMC free article] [PubMed] [Google Scholar]
- 46.Wang Z, Wu C, Aslanian A, Yates JR, Hunter T. Defective RNA polymerase III is negatively regulated by the SUMO-Ubiquitin-Cdc48 pathway. Elife. 2018;7:1–26. doi: 10.7554/eLife.35447. [DOI] [PMC free article] [PubMed] [Google Scholar]
- 47.Sadian Y, et al. Molecular insight into RNA polymerase I promoter recognition and promoter melting. Nat Commun. 2019;10:5543. doi: 10.1038/s41467-019-13510-w. [DOI] [PMC free article] [PubMed] [Google Scholar]
- 48.Dergai O, Hernandez N. How to Recruit the Correct RNA Polymerase? Lessons from snRNA Genes. Trends Genet. 2019;35:457–469. doi: 10.1016/j.tig.2019.04.001. [DOI] [PubMed] [Google Scholar]
- 49.Renaud M, et al. Gene duplication and neofunctionalization: POLR3G and POLR3GL. Genome Res. 2014;24:37–51. doi: 10.1101/gr.161570.113. [DOI] [PMC free article] [PubMed] [Google Scholar]
- 50.Durrieu-Gaillard S, et al. Regulation of RNA polymerase III transcription during transformation of human IMR90 fibroblasts with defined genetic elements. Cell Cycle. 2018;17:605–615. doi: 10.1080/15384101.2017.1405881. [DOI] [PMC free article] [PubMed] [Google Scholar]
- 51.Davis RB, Likhite N, Jackson CA, Liu T, Yu MC. Robust repression of tRNA gene transcription during stress requires protein arginine methylation. Life Sci Alliance. 2019;2:e201800261. doi: 10.26508/lsa.201800261. [DOI] [PMC free article] [PubMed] [Google Scholar]
- 52.Maraia RJ, Rijal K. A transcriptional specialist resolved. Nature. 2015;528:204–205. doi: 10.1038/nature16317. [DOI] [PMC free article] [PubMed] [Google Scholar]
- 53.Koch B, et al. Generation and validation of homozygous fluorescent knock-in cells using CRISPR-Cas9 genome editing. Nat Protoc. 2018;13:1465–1487. doi: 10.1038/nprot.2018.042. [DOI] [PMC free article] [PubMed] [Google Scholar]
- 54.Ran FA, et al. Genome engineering using the CRISPR-Cas9 system. Nat Protoc. 2013;8:2281–2308. doi: 10.1038/nprot.2013.143. [DOI] [PMC free article] [PubMed] [Google Scholar]
- 55.Lin YC, et al. Genome dynamics of the human embryonic kidney 293 lineage in response to cell biology manipulations. Nat Commun. 2014;5:4767. doi: 10.1038/ncomms5767. [DOI] [PMC free article] [PubMed] [Google Scholar]
- 56.Kim JH, et al. High Cleavage Efficiency of a 2A Peptide Derived from Porcine Teschovirus-1 in Human Cell Lines, Zebrafish and Mice. PLoS One. 2011;6:e18556. doi: 10.1371/journal.pone.0018556. [DOI] [PMC free article] [PubMed] [Google Scholar]
- 57.Moreno-Morcillo M, et al. Solving the RNA polymerase I structural puzzle. Acta Crystallogr Sect D Biol Crystallogr. 2014;70:2570–2582. doi: 10.1107/S1399004714015788. [DOI] [PMC free article] [PubMed] [Google Scholar]
- 58.Federhen S. The NCBI Taxonomy database. Nucleic Acids Res. 2012;40:D136–D143. doi: 10.1093/nar/gkr1178. [DOI] [PMC free article] [PubMed] [Google Scholar]
- 59.The UniProt Consortium. UniProt: a worldwide hub of protein knowledge. Nucleic Acids Res. 2019;47:D506–D515. doi: 10.1093/nar/gky1049. [DOI] [PMC free article] [PubMed] [Google Scholar]
- 60.Eddy SR. Accelerated Profile HMM Searches. PLoS Comput Biol. 2011;7:e1002195. doi: 10.1371/journal.pcbi.1002195. [DOI] [PMC free article] [PubMed] [Google Scholar]
- 61.El-Gebali S, et al. The Pfam protein families database in 2019. Nucleic Acids Res. 2019;47:D427–D432. doi: 10.1093/nar/gky995. [DOI] [PMC free article] [PubMed] [Google Scholar]
- 62.Letunic I, Bork P. Interactive Tree Of Life (iTOL) v4: recent updates and new developments. Nucleic Acids Res. 2019;47:W256–W259. doi: 10.1093/nar/gkz239. [DOI] [PMC free article] [PubMed] [Google Scholar]
- 63.Kayikci M, et al. Visualization and analysis of non-covalent contacts using the Protein Contacts Atlas. Nat Struct Mol Biol. 2018;25:185–194. doi: 10.1038/s41594-017-0019-z. [DOI] [PMC free article] [PubMed] [Google Scholar]
- 64.Shannon P, et al. Cytoscape: A software Environment for integrated models of biomolecular interaction networks. Genome Res. 2003;13:2498–2504. doi: 10.1101/gr.1239303. [DOI] [PMC free article] [PubMed] [Google Scholar]
- 65.Csárdi G, Nepusz T. The igraph software package for complex network research. Inter J Comp Syst. 2006;1695:1–9. [Google Scholar]
- 66.Mitternacht S. FreeSASA: An open source C library for solvent accessible surface area calculations. F1000Research. 2016;5:189. doi: 10.12688/f1000research.7931.1. [DOI] [PMC free article] [PubMed] [Google Scholar]
Associated Data
This section collects any data citations, data availability statements, or supplementary materials included in this article.
Supplementary Materials
Data Availability Statement
Cryo-EM maps of human Pol III (map A to map G) have been deposited at the Electron Microscopy Data Base (EMDB) under accession codes EMD-11673 (map A) and EMD-11736 to EMD-11742 (map B to H). Atomic models of human Pol III have been deposited at the Protein Data Bank under accession codes: 7A6H (apo Pol III), 7AE1 (EC-1 Pol III), 7AEA (EC-2 Pol III) and 7AE3 (EC-3 Pol III).


