The quality and reliability of much animal research is in question. Unreliable or low-quality research represents an unacceptable waste of animals and research resources. In the US alone, the cost of irreproducible research has been estimated at $28 billion annually, and issues with research design and reporting are estimated to account for half of that waste1. To address these issues, the National Centre for the Replacement, Refinement and Reduction of Animals in Research (NC3Rs) developed the ARRIVE guidelines to improve the reporting of in vivo research2,3. We now present the Experimental Design Assistant (EDA; https://eda.nc3rs.org.uk), a freely accessible web-based tool, which was launched to help researchers improve the design, conduct, analysis and reporting of animal experiments. The system was developed by progressive interaction between an expert group experienced in providing advice on experimental design to researchers and a software development team. It includes a computer-aided design tool through which the user develops a diagram that embodies the experimental plan. The diagram offers a new standard notation for describing experiments in which methodological details and analysis plans are explicit (Fig. 1). This facilitates communication between collaborators, funding bodies, ethical review committees, journal editors and peer reviewers; it also allows detailed record keeping and may serve as an ex ante registered protocol4. The structure of EDA diagrams is based on a series of relationships between the different components of the experiment. This allows the use of computer-based logical reasoning to provide feedback and advice on the experimental plans5. The feedback helps researchers improve their experimental design by, for instance, highlighting missing information or problems with internal consistency. It also provides assistance with identifying and characterizing the independent variables and outcome measures to be included in the analysis. Advice about common nuisance variables, which threaten the internal validity of many animal experiments, is also provided, along with practical suggestions to account for such variables in randomization and data analysis. The feedback does not restrict researchers to using a particular design type, but it promotes a better understanding of the implications of common design pitfalls so that researchers can make informed decisions. The feedback also suggests methods of statistical analysis that are appropriate for a given design, along with advice on any data requirements (‘assumptions’) for a given test as well as possible data transformations. Other features of the EDA include support for randomization, blinding and power calculations, and procedures which are still underused in animal research6. Based on the diagram, the system generates a randomization sequence for the study, taking into account any blocking factors. The sequence can be sent directly to a third party nominated by the investigator, thus allowing the investigator to remain unaware of the animals’ group allocation until the data have been collected and analyzed. Animal experiments are often too small to yield meaningful results7; the EDA’s power calculation tool—along with extensive guidance on how to choose the appropriate calculation and identify the parameters required—will help researchers determine optimal sample sizes for each experiment.In conclusion, the EDA is a new resource to help improve the quality of animal research. It can help researchers design robust and reliable experiments in two ways. First, it ensures that the experimental plans are explicit and transparent, thus allowing detailed scrutiny before and after data are collected. Second, it encourages improvements by providing researchers with critical feedback, targeted information and access to randomization and power analysis tools. We will continue to incorporate user input in planned future developments to ensure that the EDA evolves in line with the needs of the research community.
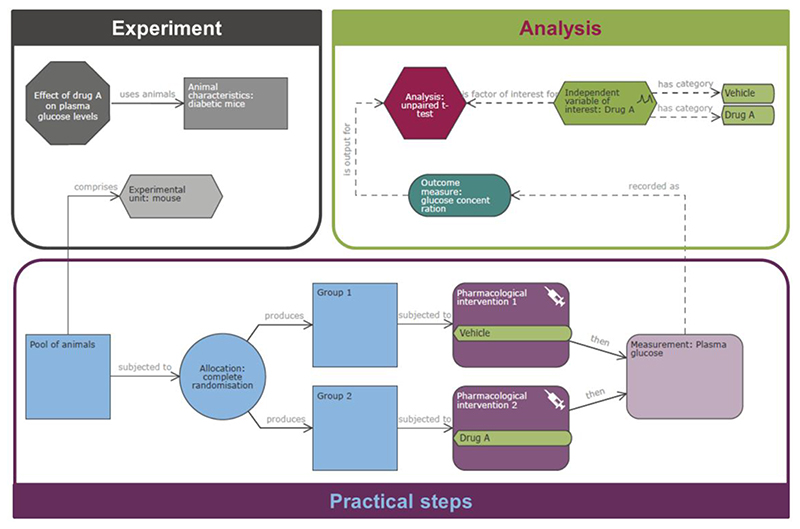
Figure 1. Example of an EDA diagram.
EDA diagram representing a two-group comparison in which each cage contains mice randomized to either of two treatments. Diagrams are composed of nodes and links to represent an entire experimental plan. The gray nodes contain high-level information about the experiment such as the null and alternative hypotheses, the effect of interest, the experimental unit and the animal characteristics. The blue and purple nodes represent the practical steps carried out in the laboratory such as the allocation to groups, the group sizes and role in the experiment, the treatments and the measurements taken. The green and red nodes represent the analysis, the outcome measures and the independent variables of interest and nuisance variables (e.g., blocking factors). For more details, see https://eda.nc3rs.org.uk.
Acknowledgments
We thank all researchers who participated in user testing.
Footnotes
Author Contributions
All authors were part of an NC3Rs working group (WG). N.P.d.S. initiated the project and convened the WG. I.B. developed the conceptual design. The standard notation of the EDA was agreed within the WG and formalized by I.B. and B.L. The development of the rules behind the logical reasoning was led by N.P.d.S. and B.L., with input from the WG, and formalized by B.L. All authors wrote the manuscript.
Competing Financial Interests
The authors declare no competing financial interests.
References
- 1.Freedman LP, Cockburn IM, Simcoe TS. PLoS Biol. 2015;13:e1002165. doi: 10.1371/journal.pbio.1002165. [DOI] [PMC free article] [PubMed] [Google Scholar]
- 2.Cressey D. Nature. 2016 http://www.nature.com/news/surge-in-support-for-animal-research-guidelines-1.19274.
- 3.Kilkenny C, Browne WJ, Cuthill IC, Emerson M, Altman DG. PLoS Biol. 2010;8:e1000412. doi: 10.1371/journal.pbio.1000412. [DOI] [PMC free article] [PubMed] [Google Scholar]
- 4.Nosek BA, Ebersole CR, DeHaven AC, Mellor DT. 2017 doi: 10.17605/OSF.IO/2DXU5. Preprint at. [DOI] [Google Scholar]
- 5.Percie du Sert N, et al. PLoS Biol. 2017;15:e2003779. doi: 10.1371/journal.pbio.2003779. [DOI] [PMC free article] [PubMed] [Google Scholar]
- 6.Macleod MR, et al. PLoS Biol. 2015;13:e1002273. doi: 10.1371/journal.pbio.1002273. [DOI] [PMC free article] [PubMed] [Google Scholar]
- 7.Button KS, et al. Nat Rev Neurosci. 2013;14:365–376. doi: 10.1038/nrn3475. [DOI] [PubMed] [Google Scholar]


