Summary
Objective
To investigate the relationship between meniscus magnetic resonance (MR) relaxation parameters and meniscus degradation through quantitative imaging of ex vivo posterior horns of menisci from subjects with and without knee osteoarthritis (OA).
Design
We sampled medial and lateral menisci from ten medial compartment knee OA patients (mean age 63 years) undergoing total knee replacement and from ten deceased donors (references, mean age 51 years). MR relaxation parameters T2*, T2 and T1 of the posterior horn were measured at a 9.4 T scanner. Comparisons were made between OA patients and references (with adjustment for age) as well as between medial and lateral menisci from the same knees.
Results
Mean values (standard deviation) of mean T2* were 13 (3.8), 6.9 (2.3), 7.2 (1.9) and 7.2 (1.7) ms for the medial and lateral patient menisci and the medial and lateral reference menisci, respectively. Corresponding values were 17 (3.7), 9.0 (2.2), 12 (4) and 9.0 (1.3) ms for T2 and 1810 (150), 1630 (30), 1580 (90) and 1560 (50) ms for T1. All three relaxation times were significantly longer in medial OA menisci compared to the other groups. Among medial reference menisci, relaxation times (mainly T1) tended to increase with age.
Conclusions
MR relaxation times T2*, T2 and T1 in the posterior horn are longer in the medial menisci of patients with end-stage medial compartment knee OA compared to the corresponding lateral menisci and to reference menisci. The meniscus seems to undergo intrasubstance alterations related to both OA and ageing.
Introduction
Meniscal damage is strongly associated with both the development and progression of knee osteoarthritis (OA), although its role is not fully elucidated1,2. Meniscal damage most frequently occurs in the posterior horn of the medial meniscus3, and although such damage can arise from acute knee trauma, it seems more commonly to be the result of slow degeneration4,5. There is currently a lack of knowledge of these degenerative processes, which likely start long before a meniscus tear becomes apparent5. To gain better understanding of early OA pathogenesis, we need imaging techniques that enable detection and monitoring of compositional changes early on in the degenerative process. In general, magnetic resonance imaging (MRI) is a suitable technique for imaging of soft tissues and for detection of meniscal pathologies. Quantitative MRI (qMRI) offers promising tools to also monitor early disease processes.
Quantitative MR parameters such as relaxation times (e.g., T1 and T2) are affected by the molecular environment in the tissue. During degeneration of meniscus tissue the content of proteoglycans and water as well as the organization of collagen fibers may be altered6. Molecular and structural changes related to the degeneration process could thus potentially affect the relaxation times and it is plausible that estimation of these parameters could reveal information about tissue composition not available in ordinary MR images.
In articular cartilage, these MR relaxation parameters have been extensively studied and suggested to be related to e.g., glycosaminoglycan, collagen and water content. For example, T2 has been reported to depend on glycosaminoglycan and collagen concentration in suspensions and in cartilage tissue. In tissue, matrix orientation was also reported to be of importance7,8. Promising results have been seen for the use of relaxation times as biomarkers for meniscus degeneration and damage. For example, in patients with OA, unspecific knee pain or anterior cruciate ligament injury, comparisons of meniscus relaxation times have been made in vivo to healthy volunteers and ex vivo with histology grading9, 10,11, 12. However, further work is needed to evaluate the possible use of relaxation times as indicators of meniscus degeneration related to OA.
In the meniscus, the highly ordered collagen structure results in a very short T2 relaxation time. Quantification of T2 in the meniscus is therefore challenging. An ultrashort echo time (UTE) pulse sequence enables echo times short enough to capture the rapidly decaying signal from short T2 tissues. However, an attempt to measure T2 with this type of sequence will instead result in the quantification of T2* that also includes signal decay due to local magnetic field inhomogeneity.
To investigate the potential use of MR relaxation parameters for monitoring early degenerative changes in meniscus tissue related to OA, it is important to chart the relaxation times in both healthy and diseased meniscus tissue. Thus, in this human ex vivo study our aim was to estimate the meniscus MR relaxation parameters T2*, T2 and T1 in the posterior horn. Quantitative comparisons were made between both medial and lateral posterior horns of menisci from patients with medial compartment knee OA as well as from deceased donors without known knee OA.
Methods
Tissue samples
We used human meniscus samples from a local biobank at Skåne University Hospital, Region Skåne, Sweden (principal investigator Englund). The biobank includes menisci from knee OA patients undergoing total knee joint replacement (TKR) at Trelleborg Hospital, Sweden. The biobank also includes menisci from deceased adult donors without known knee OA, obtained within 48 h of death at Skåne University Hospital. All samples were frozen within 2 h from extraction and stored at −80°C.
For the purpose of this study, both medial and lateral menisci were sampled from ten patients with medial compartment knee OA undergoing bilateral TKR. We used the surgeon's Outerbridge classification of joint cartilage13 and required a medial grade of IV and a lateral grade of 0 or I for inclusion in the study. Further, the surgeon's sketch of menisci should indicate that some of the posterior horns remained. We further required that after thawing, upon final visual inspection, the menisci needed to have at least two thirds of the substance of the posterior horn remaining (the inner one third was typically missing). One knee from each of five male and five female patients, aged 50–75 years, were selected. We also sampled medial and lateral menisci from the right knee of ten deceased human donors (five men and five women, aged 18–77 years), without known knee OA, to be used as references. The donor menisci were visually inspected and were required to be macroscopically intact (some minor calcification was allowed). Two of the lateral donor menisci were excluded because of a horizontal cleavage tear. The individual patients' and donors' characteristics are detailed in Table I.
Table I. Age, sex and body mass index (BMI) of the knee osteoarthritis (OA) patients and deceased donors (references) included in the study.
| Medial compartment knee OA patients | Donors (without known knee OA) | |||||||||||||||||||
|---|---|---|---|---|---|---|---|---|---|---|---|---|---|---|---|---|---|---|---|---|
| P1 | P2 | P3 | P4 | P5 | P6 | P7 | P8 | P9 | P10 | D1 | D2 | D3 | D4 | D5 | D6 | D7 | D8 | D9 | D10 | |
| Sex | M | F | F | M | F | M | M | F | M | F | M | F | M | F | F | M | F | F | M | M |
| Age [years] | 72 | 53 | 60 | 65 | 60 | 61 | 67 | 61 | 75 | 50 | 49 | 18 | 52 | 32 | 61 | 58 | 74 | 77 | 43 | 50 |
| BMI [kg m-2] | 28.7 | 22.5 | 25.9 | 27.5 | 29.4 | 30.4 | 26.5 | 30.5 | 28.7 | 37.4 | 33 | 16.4 | 26.8 | 22.8 | 23.3 | 33.2 | 25.5 | 22.3 | 42.4 | 34.2 |
M = male; F = female.
We will refer to these four groups of menisci as medial and lateral “OA menisci” (i.e., menisci from TKR due to medial compartment OA) and medial and lateral “reference menisci” (i.e., menisci from deceased donors without known knee OA).
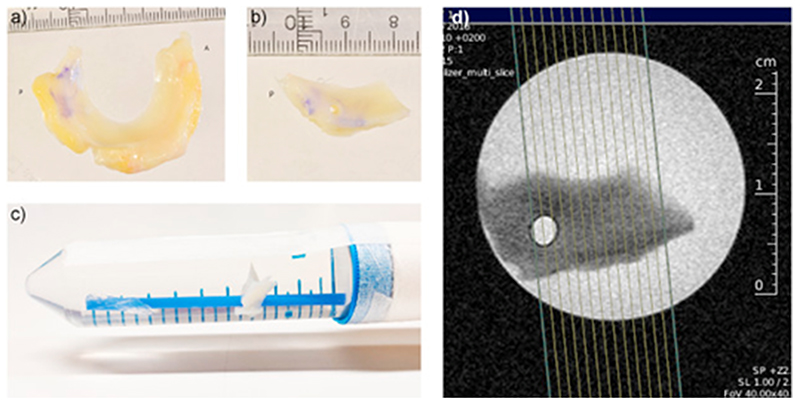
The menisci were thawed in phosphate buffered saline (PBS) and then divided into two parts. The part that we used in this experiment was the posterior horn, with some part of the body remaining. A hole, 3 mm in diameter, was punched through the meniscus sample to be able to thread it onto a thin plastic straw which was fixated inside a 50 ml plastic tube. The tube (containing the meniscus sample) was then filled with PBS (Fig. 1). In the scanner, the tube was positioned to ensure that the orientation of the meniscus with respect to the main magnetic field was as similar as possible to what would be expected in an in vivo knee MRI examination.
Fig. 1. From the whole meniscus.
(a) the posterior horn was cut out and dissected free of synovium and fat (b). The posterior horn was then threaded upon a straw inside a 50-ml plastic tube filled with PBS (c). The tube was placed in the MRI scanner with its axis parallel to the main magnetic field, resulting in an orientation of the meniscus similar to what would be the case for in vivo scanning. d) The planning of the MRI slices.
MRI measurements
MRI measurements were made using a 9.4 T preclinical scanner, an Agilent magnet (Agilent, Santa Clara, USA) equipped with Bruker BioSpec AVIII electronics (Bruker, Ettlingen, Germany), and a 1H quadrature volume coil (Bruker, Ettlingen, Germany).
For mapping of T2*, we used a single echo 2D radial UTE sequence. Eight measurements were made with echo times (TEs) of 0.5, 1, 2, 4, 6, 8, 10 and 12 ms. Other imaging parameters were: repetition time (TR) = 17.5 ms, flip angle = 10°, bandwidth (BW) = 391 Hz/pixel, field of view (FOV) = 58 × 58 mm2, number of slices = 7 and voxel size = 0.23 × 0.23 × 1 mm3. T2 mapping was made using 7 acquisitions with a single echo 2D Rapid Acquisition with Relaxation Enhancement (RARE) sequence with TE = 4.7, 7, 9, 11, 13, 15 and 17 ms, TR = 1500 ms, flip angle = 90°, BW = 385 Hz/pixel, FOV = 35 × 35 mm2, number of slices = 7 or 12, voxel size = 0.14 × 0.14 × 0.12 mm3 and echo train length (ETL) = 4. Mapping of T1 was made with a RARE Variable TR (RAREVTR) sequence with TR = 6000, 3000, 1500, 800, 400 and 200 ms, TE = 6 ms, flip angle = 90°, BW = 637 Hz/pixel, FOV = 58 × 58 mm2, number of slices = 7, voxel size = 0.45 × 0.45 × 2 mm3 and ETL = 2.
Using the UTE sequence, we also acquired a T2*-weighted image with higher spatial resolution (voxel size = 0.11 × 0.11 × 1 mm3, FOV = 58 × 58 mm2, BW = 195 Hz/pixel, TE = 3 ms and TR = 12 ms).
Data analysis
The calculation of T2* and T2 was done using an in-house developed Matlab script (MATLAB R2016a, Mathworks, Natick, USA) fitting the signal S at different TEs to the equation S=S0⋅e−TE/T2(*). T1 was calculated at the MR scanner using a built-in algorithm from the vendor. The calculations of relaxation times were made voxel by voxel and a mean value was calculated for all voxels within a region of interest (ROI).
For each meniscus, one observer (EO) manually drew ROIs in one centrally positioned slice of the sample as free as possible from imaging artifacts (e.g., susceptibility artifacts from air bubbles and calcifications). For T2* the observer used the 4 ms TE image as reference when drawing the ROIs. For T2 the corresponding reference was the 4.7 ms TE image and for T1 the 6000 ms TR image (with guidance from the high resolution UTE image and from the UTE images with longer TEs). For the medial OA menisci, the ROI covered the entire cross-section except for a small margin towards the PBS. Small air bubbles and calcifications, if present, were avoided. For the lateral OA and reference menisci the observer drew three ROIs in the selected slice of each meniscus, each covering approximately one third of the meniscus width (i.e., the red zone, the red-white zone, and the white zone, approximately corresponding to the variation in vascularization for healthy menisci). The ROIs were summed together to cover either the whole meniscus width or only the red and the red-white zones (i.e., the outer two-thirds). The ROIs covering only two-thirds of the meniscus width were used for comparisons with the medial OA menisci, where most of the inner third (white zone) was typically missing. The reason for this was to ensure that the comparison would be made as much as possible between the same type of tissue across samples. An example image of the ROIs drawn in a reference meniscus and in a medial OA meniscus can be found in the supplemental material (Supplemental material Fig. 1).
Statistical analysis
Descriptive data for continuous variables are given as means and standard deviations (SD).
Potential associations of age, sex and body mass index (BMI) with relaxation times were investigated within the medial reference group using simple linear regression.
For the unpaired data (comparisons of OA menisci with references), the difference in means with 95 % confidence intervals (CI) were estimated both with and without adjustment for age using multiple linear regression. The normality and homoscedasticity of regression residuals were checked using residual plots.
For comparison of medial and lateral menisci within the same knee we calculated the mean of within-person differences with its 95 % CI (i.e., mean and CIs corresponding to a paired Student's t-test) without the need for adjustment. For the reference menisci, to be able to do a paired analysis, the two medial menisci corresponding to the excluded damaged lateral menisci were also excluded for this comparison.
Results
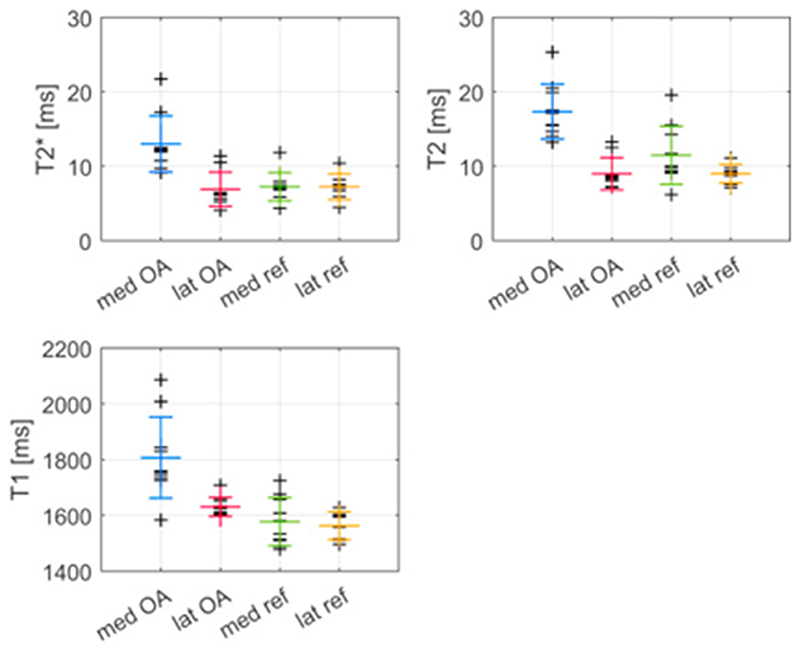
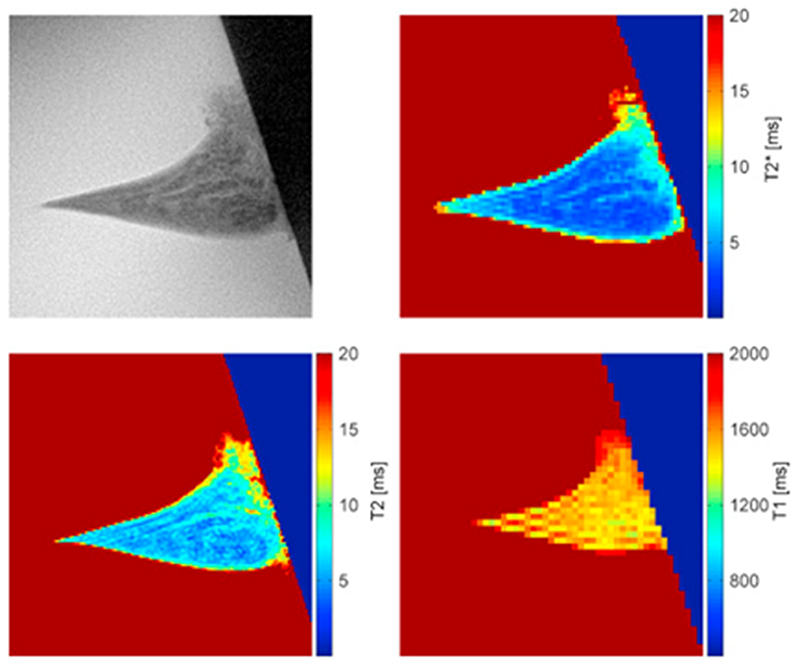
The mean values and SD of mean T2* were 13 (4) ms, 6.9 (2.3) ms, 7.2 (1.9) ms and 7.2 (1.7) ms for the posterior horn of medial OA, lateral OA and the medial and lateral reference menisci, respectively (Fig. 2). These values were calculated for ROIs covering the whole meniscus cross-section for the degenerated medial OA menisci and the outer two-thirds of the intact menisci (lateral OA and reference menisci). Corresponding values for T2 were 17 (4) ms, 9.0 (2.2) ms, 12 (4) ms and 9.0 (1.3) ms and for T1, 1810 (150) ms, 1630 (30) ms, 1580 (90) ms and 1560 (50) ms, respectively. An example of a high resolution UTE image, as well as a T2*, a T2 and a T1 map for one of the medial reference menisci is presented in Fig. 3.
Fig. 2.
Relaxation times within each meniscus of the four groups, medial OA, lateral OA, medial reference and lateral reference menisci (shortened to med OA, lat OA, med ref and lat ref). The larger markers indicate mean and standard deviation within each group.
Fig. 3.
Example of a high resolution UTE image together with a T2*, a T2 and a T1 map of a medial reference meniscus. The boundary with the dark blue/black background seen in the right of the images is the edge of the tube.
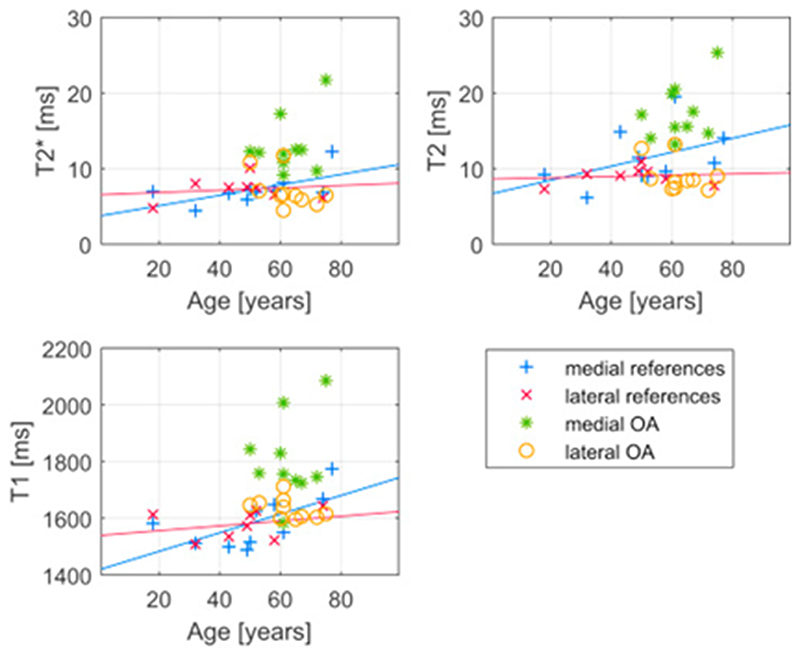
Within the medial reference group, the estimated difference in relaxation times per year of age with 95% CI was 0.069 (−0.0032, 0.14) ms/year for T2*, 0.093 (−0.065, 0.25) ms/year for T2 and 3.3 (0.0, 6.5) ms/year for T1, indicating that higher age could be associated with longer relaxation times in the medial meniscus. However, the same tendency is not seen among lateral reference menisci (Fig. 4). Sex and BMI of the donor did not substantially associate with the relaxation parameters among reference menisci. The mean difference in relaxation times between the posterior horn of female and male medial menisci was 0.96 (−2.0, 4.0) ms for T2*, 1.1 (−4.7, 7.0) ms for T2 and 62 (−71.8, 196) ms for T1. For BMI, the mean differences in T2*, T2 and T1 per kg m−2 were −0.055 (−0.26, 0.16) ms kg−1m2, 0.058 (−0.35, 0.46) ms kg−1m2 and -4.9 (−14, 4.1) ms kg−1m2, respectively.
Fig. 4.
Mean relaxation times for each meniscus presented as a function of subject age. Linear functions are fitted to the medial and lateral reference menisci data.
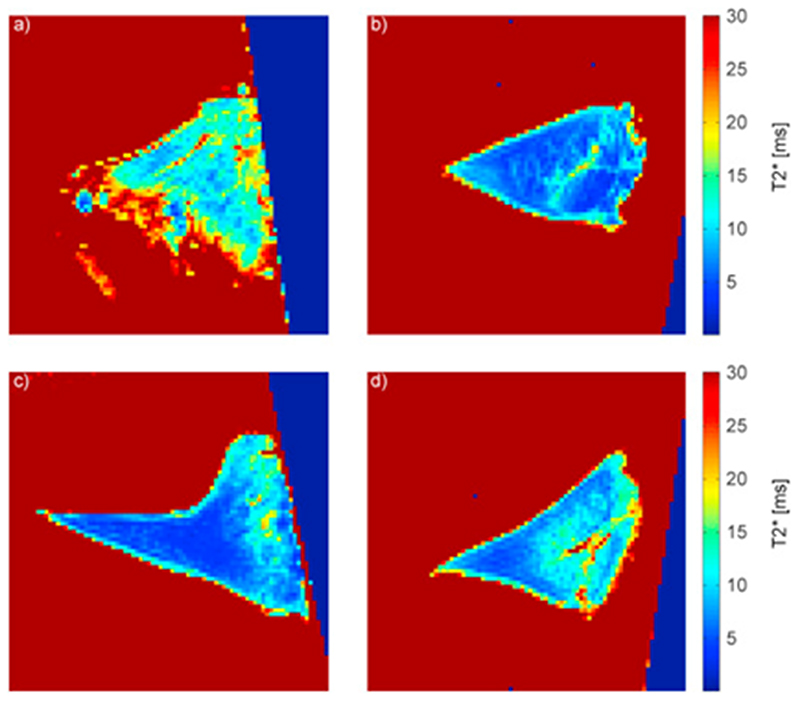
Visual inspection of the parameter maps generally indicated longer relaxation times in the posterior horn of medial OA menisci than in the other three groups (example T2* maps in Fig. 5). For T2* the difference in mean with 95 % CI was 5.8 (3.0, 8.6) ms when comparing medial OA menisci with medial reference menisci. The mean difference was about the same when comparing T2* values of medial menisci with lateral menisci from the same knees (6.1 (2.9, 9.3) ms). The mean difference in relaxation time was very small when comparing medial and lateral menisci from references, 0.74 (−2.34, 0.86) ms for T2*. Similar results were seen for T2 and T1 (Table II).
Fig. 5.
A T2* map of a) a medial OA meniscus, b) the lateral meniscus from the same OA patient as in a, c) a medial reference meniscus and d) the lateral meniscus from the same donor as in c.
Table II.
Difference in mean, both crude and adjusted for age differences (with 95 % CI for the adjusted data) for comparisons of relaxation times of the medial OA, lateral OA and the medial and lateral reference menisci (shortened to med OA, lat OA, med ref and lat ref)
| T2* [ms] | T2 [ms] | T1 [ms] | |||||||
|---|---|---|---|---|---|---|---|---|---|
| Crude | Adjusted | 95 % CI | Crude | Adjusted | 95 % CI | Crude | Adjusted | 95 % CI | |
| med OA–med ref | 5.6 | 4.8 | (1.9, 7.8) | 5.9 | 4.7 | (1.0, 8.5) | 230 | 195 | (77.3, 312) |
| med OA – lat OA | 6.1 | 6.1 | (2.9, 9.3) | 8.4 | 8.4 | (5.8, 11) | 176 | 176 | (76.5, 275) |
| lat OA – med ref | –0.14 | –0.53 | (–2.8, 1.7) | –2.3 | –3.0 | (–6.1, 0.17) | 47.4 | 20.5 | (–44.9, 85.8) |
| lat OA – lat ref | 0.14 | 0.16 | (–2.3, 2.7) | 0.025 | 0.31 | (–1.9, 2.5) | 54.8 | 51.7 | (–3.07, 107) |
| med ref – lat ref | 0.74 | 0.74 | (–2.3, 0.86) | 1 | 1 | (–1.4, 3.4) | 11,6 | 11.6 | (–69.9, 46,6) |
95 % CI = 95 % confidence interval; ms = milliseconds.
The relaxation times of the posterior horn from lateral OA menisci and references were more similar compared to each other than compared to the medial OA menisci, especially for T2*, where the difference in mean was very small and the 95 % CI was almost symmetric around zero. The results remained essentially the same after adjustment for age (Table II).
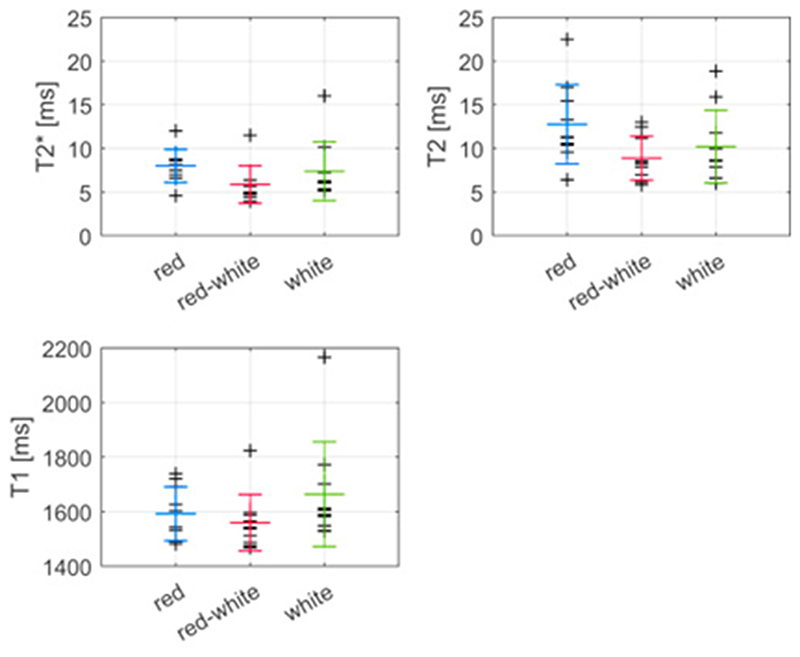
The comparison of mean relaxation times between the red, the red-white and the white zones of the reference menisci suggested no obvious relationships between relaxation values and zone (Fig. 6). Mean (SD) T2* values for the red, the red-white and the white zone in medial reference menisci were 8.0 (1.9) ms, 5.9 (2.1) ms and 7.4 (3.4) ms, respectively. The corresponding T2 values were 13 (5) ms, 8.9 (2.5) ms and 10 (4) ms, and the T1 values were 1590 (100) ms, 1560 (100) ms and 1660 (190) ms, respectively. Similar results were found for the lateral OA and lateral reference menisci (see Supplemental material Table 1).
Fig. 6. Mean values of mean T2*, T2 and T1 calculated for the red, the red-white and the white zones of medial reference menisci. The larger markers indicate mean and standard deviation within each zone.
Discussion
We evaluated MR relaxation parameters in the posterior horn of ex vivo human menisci using an ultra-high field MRI system. In general, we found longer relaxation times in medial menisci from medial compartment knee OA patients compared to reference medial menisci as well as to the contralateral (lateral) menisci from the same OA knees. We also noted a tendency of increasing relaxation times with increasing age in our medial reference menisci.
Compared to relaxation times of ex vivo normal menisci reported by others, our UTE-T2* values were somewhat higher, 7 ms compared to about 5 ms in previous studies10, 14, 15, while our T2 values were lower (10 compared to 20 ms). T1 values were substantially higher in our study, which was expected as a result of the higher field strength, 9.4 T, compared to most previous studies conducted at 3 T. The higher field strength and the variation in imaging protocols (that could especially affect T2*) makes comparisons between studies difficult. A reason for the longer T2* could for example be a more effective shimming (more homogeneous magnetic field) of the small sample in a preclinical scanner compared to a human scanner. It could also be due to the higher spatial resolution, because inhomogeneity within a voxel will be smaller when the voxel size decreases. The difference in measured T2 in our study compared to earlier ex vivo studies of the meniscus could be due to the shorter first echo time of the T2 mapping sequence we used (4.7 ms compared to 10.4 ms or 13.6 ms in previous studies). This illustrates the possible unreliability of the classic T2 mapping approach for the meniscus.
The donors of the reference menisci examined in this study had a larger age distribution, including both younger and older subjects, compared to the TKR patients. In the former group, we noted a tendency for an age dependence of relaxation times in the medial meniscus, mainly for T1 (Fig. 4). Others have also reported changes in meniscus relaxation times with age16. It seems reasonable that there are age-related changes that can be considered normal, and it is important to recognize those potential changes as distinct from disease. That an age dependence was observed only in the medial menisci and not in the lateral is in agreement with an earlier publication reporting the medial meniscus to be more prone to degeneration than the lateral3. The difference between medial OA menisci and medial references remained after adjustment for age, although somewhat attenuated, and we therefore find it plausible that both ageing and disease are responsible for the observed difference in relaxation times.
Meniscus relaxation parameters have also been reported to be dependent on BMI17 and sex16,18. However, in our study we did not detect any such association.
Both in this and in earlier studies, increasing relaxation values with increased tissue degeneration have been reported. We observed an increase in relaxation time for all three parameters in the posterior horn of the medial OA menisci compared to the lateral OA and the reference menisci. This could indicate that the increase is due to an increase in water content, which would affect both T1 and T2, rather than a change in e.g., glycosaminoglycan or collagen content which would be expected to mainly affect T2. This would be in agreement with findings of Son et al. and Chang et al. who investigated the dependence of ex vivo meniscus T2 and T1ρ on glycosaminoglycan, collagen and water content1,19.
The rather large CIs of the differences in means between the meniscus groups probably reflect both the actual distribution of relaxation values due to different stages of degeneration (among references as well as patients), and uncertainty of the measurements, e.g., the orientation of the sample in the main magnetic field (for T2 and T2*). Also, only a single slice within the posterior horn of each meniscus was chosen for the evaluation of relaxation times. Since degeneration might vary between different parts of the meniscus, variation in the position of the slice analyzed (further posterior or closer to the body) may add to the variation within the groups. We chose to do our measurements in the posterior horn since it has been reported to be prone to degeneration3.
Still, our results suggest that there are differences in relaxation times between medial menisci from medial compartment knee OA patients and donors without knee OA, and that the lateral OA meniscus is more similar to both medial and lateral reference menisci than to the degenerated medial meniscus of the same knee. The lateral meniscus may thus potentially be considered an alternative to use as a within knee reference for in vivo studies of medial compartment OA patients. Using the lateral meniscus as reference would eliminate differences in knee and subject-related variables, e.g., knee alignment, age, BMI and sex, that otherwise might influence the results. Additionally, since in vivo medial and lateral menisci are imaged at the same occasion and with the same measurement parameters and set-up, using lateral menisci as a reference would also reduce bias from measurement-related variables on the resulting relaxation times.
Our findings also provide new important clues to the pathogenesis of meniscus degradation. All patients were selected on the basis of having bilateral knee joint replacements, this to increase the likelihood of systemic contributions to their OA. The hyaline cartilage in the lateral compartment was virtually visually unaffected (Outerbridge classification grade 0 or I). Also, the rather clear difference in relaxation times seen between medial and lateral OA menisci was not at all seen for the references. The difference hence seems to be primarily related to OA and it is likely that biomechanics is a strong catalyst for meniscal degradation.
Studies of relaxation parameters within different zones of in vivo normal meniscus have yielded conflicting results. In some studies, results have suggested increasing T2 values from the inner white zone to the outer red zone16,18 but there are also studies suggesting the opposite, that T2 values decrease from the white to the red zone20. Similar to our findings, Nebelung et al. reported no significant differences between the zones for T2* in ex vivo menisci10. Importantly, due to the lack of blood supply, an ex vivo study is clearly not optimal to investigate potential differences due to varying vascularity. Also, the values from the white zones could be less reliable than values from the other zones due to the more diffuse boundary of the inner part of the meniscus towards the PBS, making drawing of the ROI more challenging.
No histological analysis was made in this study. Comparisons with histology grading would have been useful to determine whether relaxation times can also differentiate between different levels of meniscus degradation and to investigate the association between relaxation times and different histological features.
Another important limitation is that freezing of meniscus tissue could result in destruction of cells and alteration of the collagen structure21,22, possibly leading to increased relaxation times due to a larger amount of free water in the tissue. In this study both the reference and OA menisci were stored at −80°C prior to analysis. Although this could have an impact on the absolute tissue relaxation times, we expect that freezing would affect all menisci to a similar extent. Thus, any relative difference in relaxation times between the groups should probably represent underlying biological differences rather than effects of freezing.
In conclusion, T2*, T2 and T1 relaxation times in the posterior horn of medial menisci from medial compartment knee OA patients were longer compared to their ipsilateral (lateral) menisci as well as to medial and lateral reference menisci from donors without known knee OA. These parameters could thus be candidate imaging biomarkers of meniscus degeneration. However, it remains to be investigated whether the same association can be observed in vivo. Importantly, the lateral OA menisci were more similar to our reference menisci than to their respective ipsilateral counterpart. The lateral meniscus could thus potentially serve as a reference in future in vivo studies of meniscal degeneration for patients at high risk of medial compartment knee OA. We also observed a tendency towards longer meniscus relaxation times in the posterior horn with increasing donor age among our medial reference menisci.
Supplementary Material
Acknowledgments
We would like to acknowledge all the involved staff at Trelleborg Hospital and the Tissue Donor Bank/Department of Forensic Medicine at Skåne University Hospital for their contributions to the biobank. We would also like to thank the staff at the Lund University Bioimaging Center for their support in MR protocol preparation.
Funding sources
This project has received funding from the European Research Council (ERC) under the European Union's Horizon 2020 research and innovation programme (grant agreement No 771121) (ME). This work was also supported by the Foundation for Research in Rheumatology (FOREUM), the Swedish Research Council, the Greta and Johan Kock Foundations, the Swedish Rheumatism Association, the Österlund Foundation, the Governmental Funding of Clinical Research program within the National Health Service (ALF), and the Faculty of Medicine, Lund University, Sweden. The funders had no role in study design, data collection and analysis, decision to publish, or preparation of the manuscript.
Footnotes
Author contributions
EO participated in the design of the study, prepared the menisci for imaging, acquired the MR images, analysed the data, interpreted results, and drafted the manuscript.
EF and VH prepared the menisci for imaging, interpreted results, and revised the manuscript.
PÖ interpreted results, and revised the manuscript.
JT recruited consenting OA patients, collected the OA menisci, supervised the retrieval of menisci of the deceased, interpreted results, and revised the manuscript.
PP designed the study, interpreted results, and revised the manuscript.
JS designed the study, acquired the MR images, interpreted results, and revised the manuscript.
ME designed the study, selected the sample, dissected the menisci, interpreted results, and revised the manuscript.
All authors have approved the final version of manuscript for submission.
Conflict of interest
The authors have no conflict of interests to declare.
References
- 1.Chang A, Moisio K, Chmiel JS, Eckstein F, Guermazi A, Almagor O, et al. Subregional effects of meniscal tears on cartilage loss over 2 years in knee osteoarthritis. Ann Rheum Dis. 2011;70:74–79. doi: 10.1136/ard.2010.130278. [DOI] [PMC free article] [PubMed] [Google Scholar]
- 2.Englund M, Guermazi A, Roemer FW, Aliabadi P, Yang M, Lewis CE, et al. Meniscal tear in knees without surgery and the development of radiographic osteoarthritis among middle-aged and elderly persons: The Multicenter Osteoarthritis Study. Arthritis Rheum. 2009;60:831–839. doi: 10.1002/art.24383. [DOI] [PMC free article] [PubMed] [Google Scholar]
- 3.Englund M, Guermazi A, Gale D, Hunter DJ, Aliabadi P, Clancy M, et al. Incidental meniscal findings on knee MRI in middle-aged and elderly persons. N Engl J Med. 2008;359:1108–1115. doi: 10.1056/NEJMoa0800777. [DOI] [PMC free article] [PubMed] [Google Scholar]
- 4.Poehling GG, Ruch DS, Chabon SJ. The landscape of meniscal injuries. Clin Sports Med. 1990;9:539–549. [PubMed] [Google Scholar]
- 5.Kumm J, Roemer FW, Guermazi A, Turkiewicz A, Englund M. Natural History of Intrameniscal Signal Intensity on Knee MR Images: Six Years of Data from the Osteoarthritis Initiative. Radiology. 2016;278:164–171. doi: 10.1148/radiol.2015142905. [DOI] [PMC free article] [PubMed] [Google Scholar]
- 6.Herwig J, Egner E, Buddecke E. Chemical changes of human knee joint menisci in various stages of degeneration. Ann Rheum Dis. 1984;43:635–640. doi: 10.1136/ard.43.4.635. [DOI] [PMC free article] [PubMed] [Google Scholar]
- 7.Menezes NM, Gray ML, Hartke JR, Burstein D. T2 and T1rho MRI in articular cartilage systems. Magn Reson Med. 2004;51:503–509. doi: 10.1002/mrm.10710. [DOI] [PubMed] [Google Scholar]
- 8.Watrin-Pinzano A, Ruaud JP, Olivier P, Grossin L, Gonord P, Blum A, et al. Effect of proteoglycan depletion on T2 mapping in rat patellar cartilage. Radiology. 2005;234:162–170. doi: 10.1148/radiol.2341030394. [DOI] [PubMed] [Google Scholar]
- 9.Chu CR, Williams AA, West RV, Qian Y, Fu FH, Do BH, et al. Quantitative Magnetic Resonance Imaging UTE-T2* Mapping of Cartilage and Meniscus Healing After Anatomic Anterior Cruciate Ligament Reconstruction. Am J Sports Med. 2014;42:1847–1856. doi: 10.1177/0363546514532227. [DOI] [PMC free article] [PubMed] [Google Scholar]
- 10.Nebelung S, Tingart M, Pufe T, Kuhl C, Jahr H, Truhn D. Ex vivo quantitative multiparametric MRI mapping of human meniscus degeneration. Skeletal Radiol. 2016;45:1649–1660. doi: 10.1007/s00256-016-2480-x. [DOI] [PubMed] [Google Scholar]
- 11.Williams A, Qian Y, Golla S, Chu CR. UTE-T2 * mapping detects sub-clinical meniscus injury after anterior cruciate ligament tear. Osteoarthritis Cartilage. 2012;20:486–494. doi: 10.1016/j.joca.2012.01.009. [DOI] [PMC free article] [PubMed] [Google Scholar]
- 12.Juras V, Apprich S, Zbyn S, Zak L, Deligianni X, Szomolanyi P, et al. Quantitative MRI analysis of menisci using biexponential T2* fitting with a variable echo time sequence. Magn Reson Med. 2014;71:1015–1023. doi: 10.1002/mrm.24760. [DOI] [PMC free article] [PubMed] [Google Scholar]
- 13.Outerbridge RE. The etiology of chondromalacia patellae. J Bone Joint Surg Br. 1961;43-b:752–757. doi: 10.1302/0301-620X.43B4.752. [DOI] [PubMed] [Google Scholar]
- 14.Choi JY, Biswas R, Bae WC, Healey R, Im M, Statum S, et al. Thickness of the Meniscal Lamellar Layer: Correlation with Indentation Stiffness and Comparison of Normal and Abnormally Thick Layers by Using Multiparametric Ultrashort Echo Time MR Imaging. Radiology. 2016;280:161–168. doi: 10.1148/radiol.2016150633. [DOI] [PMC free article] [PubMed] [Google Scholar]
- 15.Du J, Takahashi AM, Chung CB. Ultrashort TE spectroscopic imaging (UTESI): application to the imaging of short T2 relaxation tissues in the musculoskeletal system. J Magn Reson Imaging. 2009;29:412–421. doi: 10.1002/jmri.21465. [DOI] [PubMed] [Google Scholar]
- 16.Chiang SW, Tsai PH, Chang YC, Wang CY, Chung HW, Lee HS, et al. T2 values of posterior horns of knee menisci in asymptomatic subjects. PLoS One. 2013;8:e59769. doi: 10.1371/journal.pone.0059769. [DOI] [PMC free article] [PubMed] [Google Scholar]
- 17.Koff MF, Amrami KK, Kaufman KR. Clinical evaluation of T2 values of patellar cartilage in patients with osteoarthritis. Osteoarthritis Cartilage. 2007;15:198–204. doi: 10.1016/j.joca.2006.07.007. [DOI] [PubMed] [Google Scholar]
- 18.Tsai PH, Chou MC, Lee HS, Lee CH, Chung HW, Chang YC, et al. MR T2 values of the knee menisci in the healthy young population: zonal and sex differences. Osteoarthritis Cartilage. 2009;17:988–994. doi: 10.1016/j.joca.2009.03.009. [DOI] [PubMed] [Google Scholar]
- 19.Son M, Goodman SB, Chen W, Hargreaves BA, Gold GE, Levenston ME. Regional variation in T1rho and T2 times in osteoarthritic human menisci: correlation with mechanical properties and matrix composition. Osteoarthritis Cartilage. 2013;21:796–805. doi: 10.1016/j.joca.2013.03.002. [DOI] [PMC free article] [PubMed] [Google Scholar]
- 20.Takao S, Nguyen TB, Yu HJ, Hagiwara S, Kaneko Y, Nozaki T, et al. T1rho and T2 relaxation times of the normal adult knee meniscus at 3T: analysis of zonal differences. BMC Musculoskelet Disord. 2017;18:202. doi: 10.1186/s12891-017-1560-y. [DOI] [PMC free article] [PubMed] [Google Scholar]
- 21.Gelber PE, Gonzalez G, Lloreta JL, Reina F, Caceres E, Monllau JC. Freezing causes changes in the meniscus collagen net: a new ultrastructural meniscus disarray scale. Knee Surg Sports Traumatol Arthrosc. 2008;16:353–359. doi: 10.1007/s00167-007-0457-y. [DOI] [PubMed] [Google Scholar]
- 22.Salai M, Givon U, Messer Y, von Versen R. Electron microscopic study on the effects of different preservation methods for meniscal cartilage. Ann Transplant. 1997;2:52–54. [PubMed] [Google Scholar]
Associated Data
This section collects any data citations, data availability statements, or supplementary materials included in this article.


