Fig. 6.

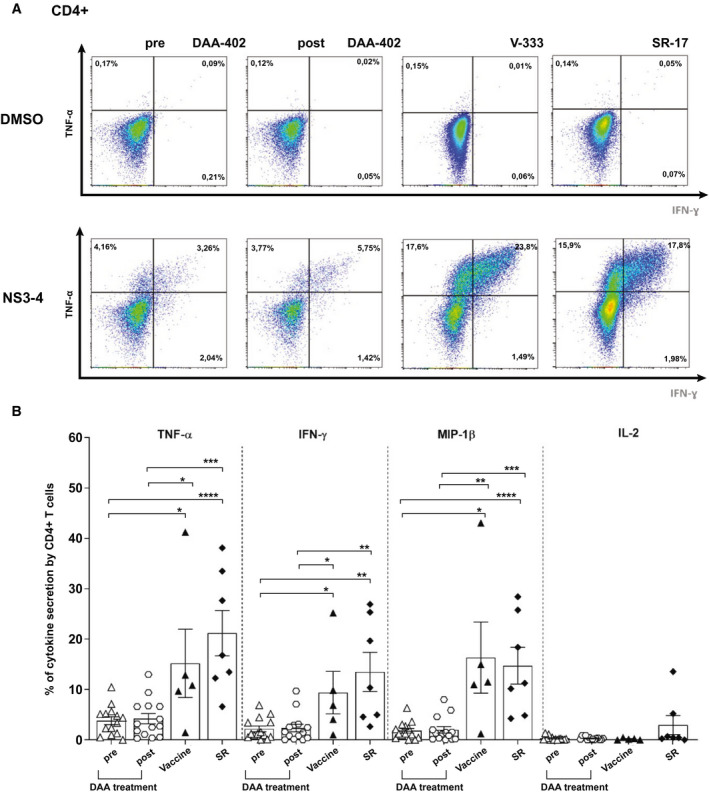
Functional capacity of CD4+ T cells in pre‐DAA– and post‐DAA–treated patients, vaccinated, and SR volunteers. (A) Example FACS plots showing TNFα/IFN‐γ after intracellular cytokine staining are shown for CD4+ T cells stimulated with NS3‐4 or DMSO control in DAA patients pretreatment and posttreatment, vaccine volunteers (after boost vaccination), and SR. (B) Comparison of cytokine production by CD4+ T cells pre‐DAA (n = 14) and post‐DAA treatment (n = 14), after ChAd3/MVA vaccination (n = 5), and in SR (n = 7). PBMCs were cultured for 14 days with peptide matching NS3‐4 (pools F+G+H), rested, and restimulated with the same peptides overnight. Staining in DMSO wells was subtracted. Error bars represent the SEM. Only statistical differences are shown.
