

Summary
Background
Serum inhibition of allergen‐specific IgE has been associated with competing IgG4 and non‐specific polyclonal IgE. In allergen immunotherapy, beneficial responses have been associated with high IgG4/IgE ratios. Helminths potentiate antibody class switching to IgG4 and stimulate polyclonal IgE synthesis; therefore, we hypothesized a role for helminth‐associated IgG4 and total IgE in protection against atopic sensitization and clinical allergy (asthma) in tropical low‐income countries.
Methods
Among community residents of Ugandan rural Schistosoma mansoni (Sm)–endemic islands and a mainland urban setting with lower helminth exposure, and among urban asthmatic schoolchildren and non‐asthmatic controls, we measured total, Schistosoma adult worm antigen (SWA)–specific, Schistosoma egg antigen (SEA)–specific and allergen (house dust mite [HDM] and German cockroach)–specific IgE and IgG4 by ImmunoCAP® and/or ELISA. We assessed associations between these antibody profiles and current Sm infection, the rural‐urban environment, HDM and cockroach skin prick test (SPT) reactivity, and asthma.
Results
Total IgE, total IgG4 and SWA‐, SEA‐ and allergen‐specific IgE and IgG4 levels were significantly higher in the rural, compared to the urban setting. In both community settings, both Sm infection and SPT reactivity were positively associated with allergen‐specific and total IgE responses. SPT reactivity was inversely associated with Schistosoma‐specific IgG4, allergen‐specific IgG4/IgE ratios and total IgE/allergen‐specific IgE ratios. Asthmatic schoolchildren, compared with non‐asthmatic controls, had significantly higher levels of total and allergen‐specific IgE, but lower ratios of allergen‐specific IgG4/IgE and total IgE/allergen‐specific IgE.
Conclusions and clinical relevance
Our immuno‐epidemiological data support the hypothesis that the IgG4–IgE balance and the total IgE–allergen‐specific IgE balance are more important than absolute total, helminth‐ or allergen‐specific antibody levels in inhibition of allergies in the tropics.
Keywords: allergen, asthma, IgE, IgG4, Schistosoma, skin prick test
1. INTRODUCTION
Several immuno‐epidemiological studies have shown that helminth infections are associated with protection against allergy‐related conditions, 1 , 2 , 3 , 4 , 5 , 6 , 7 , 8 , 9 and highlighted the potential role of helminths in rural‐urban differences in prevalence of allergy‐related diseases in the tropics. 10 , 11 We have previously shown that maternal hookworm infection modifies risk factors for childhood eczema, implying that early‐life exposure to helminths may also establish protection against allergy‐related diseases. 12 Experimental human and animal studies have demonstrated that the mechanisms through which helminths may down‐modulate allergic responses are extensive, 13 , 14 covering almost the entire range of the allergy‐related immunological pathway. Antibody‐mediated immune mechanisms of protection are less understood compared with cell‐mediated mechanisms: current theories involve helminth‐induced immunoglobulin (Ig) G4 and polyclonally stimulated IgE.
By inducing high levels of interleukin (IL)‐10, helminths can promote immunoglobulin class switching to IgG4. Moreover, chronic helminth infection is associated with elevated serum IgG4 levels, 15 and serum inhibition of helminth‐specific IgE has been associated with competing IgG4 in a Schistosoma mansoni (Sm)–endemic setting. 16 Several human studies have suggested that helminth‐induced IgG4 is important in protection against allergy: among school‐age children in rural Ecuador, Ascaris‐specific IgG4 was inversely associated with allergen skin prick test (SPT) reactivity 2 ; in a Sm‐endemic Ugandan rural setting, we observed an inverse association between house dust mite–specific IgG4/IgE ratios and reported recent wheeze. 17
Studies conducted four decades ago 18 , 19 provided initial evidence that parasitic helminths mediate production of high levels of IgE that is not specific to the parasite, or to inhalant allergens. Non‐specific polyclonally stimulated IgE has been proposed to inhibit allergic responses by competing with allergen‐specific IgE to saturate IgE receptors, 20 reducing the chances that an allergen will result in cross‐linking of FcεRI‐bound IgE and hence effector cell degranulation. 14 , 21 However, there is little evidence for polyclonal IgE‐mediated protection against allergic inflammation, and high IgE titres have previously been linked to increased expression of IgE receptors on human basophils, 22 signifying potential for polyclonally stimulated IgE in increased effector cell degranulation. Therefore, the question of whether polyclonal IgE mitigates allergic responses remains unresolved.
Large, well‐defined immuno‐epidemiological studies in helminth‐endemic settings are required to better understand population‐level interactions between allergy‐related disease and helminth‐ and allergen‐associated IgG4 and polyclonal IgE profiles. This will contribute to bridging the gap between understanding basic antibody mechanisms and clinical applications. We used the opportunity presented by studies designed to assess the epidemiology of allergy‐related disease in (1) Sm‐endemic Ugandan rural fishing villages, 17 , 23 , 24 , 25 (2) proximate urban communities with lower helminth exposure 11 and (3) urban asthmatic schoolchildren and non‐asthmatic controls. 26 , 27 Samples collected enabled us to measure total IgE (as a proxy for polyclonally stimulated IgE), total IgG4 and Sm‐ and allergen‐specific IgE and IgG4 profiles, and to analyse their associations with current Sm infection, the rural‐urban environment, allergic sensitization and asthma.
2. METHODS
2.1. Study design and population
The current investigation was conducted using samples from participants of cross‐sectional community surveys in rural 24 and urban 11 Uganda, and from a case‐control study investigating asthma risk factors among 5‐ to 17‐year‐old schoolchildren in urban Uganda. 26
The rural survey was the three‐year outcome survey (September 2015–August 2016) of the Lake Victoria Island Intervention Study on Worms and Allergy‐related diseases (LaVIISWA; ISRCTN47196031). 23 , 24 , 25 The LaVIISWA trial was conducted in 26 Sm‐endemic rural fishing villages of Koome islands, Lake Victoria. It was an open cluster‐randomized trial of community‐wide standard versus intensive anthelminthic mass drug administration (MDA).
The urban survey (September 2016–September 2017) was designed to collect data for comparison with the rural survey. 11 It was conducted in Entebbe municipality, a lower helminth exposure, urban setting situated on the northern shores of Lake Victoria (approximately 35 km from Koome islands and 40 km from Uganda's capital, Kampala). 11 Procedures in the urban survey mirrored those in the rural survey; however, urban survey participants were not randomized to standard versus intensive MDA.
The asthma case‐control study (May 2015–July 2017) 26 enrolled children with doctor‐diagnosed asthma (“cases”) and non‐asthmatic controls from primary and secondary schools in Entebbe municipality and Katabi sub‐county in Wakiso, Uganda. The International Study on Allergy and Asthma in Children (ISAAC) questionnaire 28 was used for screening, to identify participants who reported wheezing in the previous 12 months. These children then underwent a comprehensive clinical evaluation of medical and treatment history, and examination for asthma signs and symptoms by study clinicians in order to make an asthma diagnosis. Lung function tests and asthma control tests 26 , 27 were conducted to assess asthma control. As reported elsewhere, 27 only three cases had abnormal lung function tests, 85% had well‐ or partly controlled asthma and 15% had poorly controlled asthma. All cases were seen at one time‐point, started on recommended treatment and referred for further management; therefore, asthma severity or response to treatment could not be assessed. 27 Non‐asthmatic controls were children in the same class as cases, with no history of wheezing or any asthma symptoms, randomly selected using a Stata program (StataCorp, College Station, TX, USA) to obtain a control/case ratio of 2:1.
2.2. Parasitological examinations
In all studies, we used the stool Kato‐Katz (KK) technique 29 for diagnosis of Sm, hookworm (Necator americanus), Ascaris lumbricoides and Trichuris trichiura infections. For each participant, one stool sample (prepared on two slides) was examined under a microscope by two laboratory technologists blinded to each other's result. In the rural and urban surveys, stool was further suspended in 70% ethanol, stored at −80°C and later examined for Sm, Strongyloides stercoralis and hookworm infections using multiplex real‐time PCR. 30 , 31 Infection with Schistosoma haematobium has not been documented in our study areas. 32 Plasma samples were assessed for Schistosoma adult worm antigen (SWA)‐ and Schistosoma egg antigen (SEA)–specific IgE and IgG4 by ELISA (details in Appendix S1).
2.3. Assessment of allergy‐related outcomes
Wheezing in the previous 12 months was also assessed in the rural and urban surveys using interviewer‐administered standardized paper and video ISAAC questionnaires. Skin prick test (SPT) reactivity to crude extracts from Dermatophagoides mix (D. pteronyssinus and D. farinae), Blomia tropicalis and Blattella germanica (ALK‐Abelló; supplied by Laboratory Specialities [Pty] Ltd., SA) was assessed using standard methods. 33 These allergens are common in the study settings. 34 We used an in‐house ELISA to quantify crude house dust mite (D. pteronyssinus, HDM) and German cockroach (B. germanica) extract–specific plasma IgG4 and total IgG4. Total IgE and allergen extract–specific IgE were measured using the ImmunoCAP® IgE test (Thermo Fisher Scientific, Uppsala, Sweden). 35 Allergen extract–specific IgE was additionally measured using an in‐house ELISA, to facilitate determination of IgG4/IgE ratios, since, for logistical reasons, we could not measure allergen‐specific IgG4 by ImmunoCAP®. The in‐house assays are described in this article's supplementary information Appendix S1.
2.4. Statistical methods
Statistical analyses were conducted using Stata 15.0 (StataCorp). Graphs were drawn using GraphPad Prism (version 8.2.1; Fay Avenue, CA, USA). We accounted for study design in all analyses involving the rural and urban community surveys: Stata “svy” commands were used to allow for the non–self‐weighting clustering by village in the rural survey and for clustering by sub‐ward in the urban survey. 11 Initial analyses in the rural survey assessed the impact of intensive versus standard MDA on IgE and IgG4 profiles. For this, we used a cluster‐level approach 36 (previously described in other analyses for this study 24 ) that involved comparing cluster‐specific means of antibody concentrations between trial arms, with 95% confidence intervals and p‐values calculated using the t distribution. For all subsequent analyses, standard and intensive trial arm participants in the rural survey were grouped together.
Next, participant characteristics were tabulated and compared between urban and rural settings separately, between asthma cases and controls, using logistic and linear regression for categorical and continuous variables, respectively.
Independently for each of the three studies, we conducted crude and age‐ and sex‐adjusted cross‐sectional analyses to investigate the direction and the strength of association between antibody concentrations or ratios (total, Schistosoma‐specific and allergen‐specific IgE and IgG4 concentrations; allergen‐specific IgG4/IgE, total IgE/allergen‐specific IgE, total IgG4/total IgE ratios) and Sm infection or SPT reactivity. In the asthma case‐control study, we additionally investigated associations between asthma and antibody concentrations and ratios. Rural‐urban comparisons of antibody profiles were conducted using data from the rural and urban surveys. Most raw antibody concentrations and ratios were skewed, so for all analyses, linear regression models of log‐transformed data were used. ImmunoCAP® allergen–specific IgE concentrations were log10 (+0.001)‐transformed, while all other antibody data were log10 (+1)‐transformed. The results were then back‐transformed to obtain geometric mean ratios (GMRs) and 95% confidence intervals (CIs).
2.5. Ethics statement
Our studies were approved by research ethics committees of Uganda Virus Research Institute (reference numbers: GC/127/12/05/03, GC/127/16/02/547 and GC/127/14/09/481) and London School of Hygiene and Tropical Medicine (reference numbers: 6187 and 10709), and the Uganda National Council for Science and Technology (reference numbers: HS1183, HS2036 and HS1707). We obtained written informed consent from all participants and/or their legal guardians. Informed assent was obtained from children ≥8 years.
3. RESULTS
3.1. Characteristics of study participants
Flow charts of the three studies are shown in Figure 1. Plasma samples were available for 2961, 1356 and 1685 participants of the rural survey, urban survey and asthma case‐control study, respectively. Antibody measurements were conducted in a subset of randomly selected samples per study: 791, 1320 and 406 plasma samples from the rural survey, urban survey and asthma case‐control study, respectively, were included in assessment of at least one of total, Schistosoma‐ or allergen‐specific IgE or IgG4. There was no effect of intensive versus standard anthelminthic MDA on antibody profiles (Table S1), hence data from both trial arms in the rural survey were combined for all subsequent analyses.
FIGURE 1.

Study flow chart
Table 1 shows characteristics of participants for whom we obtained data on total, Schistosoma‐ or allergen‐specific IgE or IgG4. Participant characteristics were compared between the rural and urban surveys, and between asthma cases and controls. We have previously reported related comparisons in these studies, albeit in somewhat different subsets of participants. 37 Rural participants, compared with urban participants, were more likely to be older (p = .001) and male (p = 0.003). Prevalence of SPT reactivity to Dermatophagoides mix and B. tropicalis was higher among urban participants (p = .001). However, rural participants had higher median total IgE levels (p < .001), and higher prevalence of IgE sensitization to crude German cockroach (ImmunoCAP® concentration ≥0.35 kU/L) [p = .001], ELISA‐detectable cockroach‐specific IgE (≥312.5 ng/ml) [p = .001], and infection with Sm (p < .001) and at least one nematode (p < .001). Reported wheeze was rare in both settings.
TABLE 1.
Characteristics of study participants
| Characteristics | Rural survey | Urban survey | p b | Case‐control study on asthma in schoolchildren n/N (%) | p | |
|---|---|---|---|---|---|---|
| n/N (%) a | n/N (%) a | Controls | Asthma cases | |||
| Socio‐demographic | ||||||
| Age in years, median (IQR) | 28 (21, 36) | 21 (9, 32) | .001 | 10 (8, 13) | 11 (10, 14) | .023 |
| Male sex | 382/788 (46.4) | 510/1315 (38.8) | .003 | 93/200 (46.7) | 92/200 (46.0) | .847 |
| Allergy‐related outcomes | ||||||
| Skin prick test reactivity | ||||||
| Dermatophagoides mix | 89/788 (10.2) | 223/1270 (17.6) | .001 | 49/200 (24.5) | 91/198 (45.9) | <.001 |
| Blomia tropicalis | 55/788 (6.9) | 180/1270 (14.2) | .001 | 46/200 (23.0) | 90/198 (45.4) | <.001 |
| Blattella germanica | 100/787 (14.1) | 182/1273 (14.3) | .913 | 33/200 (16.5) | 48/198 (24.2) | .056 |
| asIgE sensitization (≥0.35 kU/L, ImmunoCAP) | ||||||
| D. pteronyssinus | 264/780 (33.2) | 104/345 (30.1) | .421 | 72/200 (36.0) | 117/200 (58.5) | <0.001 |
| Blattella germanica | 393/780 (49.8) | 118/345 (34.2) | <.001 | 90/200 (45.0) | 112/199 (56.3) | 0.025 |
| Detectable asIgE (≥312.5 ng/ml, ELISA) c | ||||||
| D. pteronyssinus | 312/766 (39.9) | 496/1313 (37.8) | .452 | 71/190 (37.4) | 105/191 (54.0) | .001 |
| Blattella germanica | 349/766 (45.4) | 492/1313 (37.5) | .001 | 69/190 (36.3) | 96/191 (50.3) | .006 |
| Total IgE (kU/L, ImmunoCAP), median (IQR) | 672 (250, 1942) | 159 (57, 523) | <.001 | 279 (98, 648) | 487 (115, 1248) | .018 |
| Wheeze in last 12 months | 25/781 (2.8) | 24/1157 (2.1) | .377 | 0/200 (0.0) | 200/200 (100.0) | |
| Helminth infections | ||||||
| S. mansoni (KK) | 188/686 (29.4) | 79/1079 (7.3) | <.001 | 8/196 (4.1) | 12/184 (6.5) | 0.291 |
| S. mansoni intensity (KK) | ||||||
| Uninfected | 498/686 (70.6) | 1000/1079 (92.7) | 188/196 (95.9) | 172/184 (93.5) | ||
| Low | 95/686 (14.7) | 38/1079 (3.5) | 4/196 (2.0) | 7/184 (3.8) | ||
| Moderate | 53/686 (8.9) | 27/1079 (2.5) | 3/196 (1.5) | 3/184 (1.6) | ||
| Heavy | 40/686 (5.8) | 14/1079 (1.3) | <.001 | 1/196 (0.5) | 2/184 (1.1) | .272 |
| S. mansoni (PCR) d | 313/686 (47.4) | 190/1073 (17.7) | <.001 | |||
| Any nematode e | 160/688 (21.2) | 110/1086 (10.1) | <.001 | 14/202 (6.9) | 22/201 (10.9) | .161 |
Table shows characteristics for individuals with data on total, Schistosoma‐ or allergen‐specific IgE and IgG4. p‐values are shown for differences in characteristics between rural and urban survey participants and between asthmatic schoolchildren and non‐asthmatic controls.
Abbreviations: asIgE, allergen‐specific IgE; CCA, circulating cathodic antigen; IQR, interquartile range; KK, Kato‐Katz; PCR, polymerase chain reaction; SEA, Schistosoma egg antigen; SWA, Schistosoma adult worm antigen.
Percentages were adjusted for survey design. Percentages / medians that were significantly higher in one group compared with the other (p ≤ .05) are highlighted in bold. Adjusting for age and sex had little impact on these differences.
p‐values obtained from survey design‐based logistic or linear regression.
Lower detection limit was 15.625 ng/ml. 20‐fold diluted plasma samples were used; hence, the lower detection limit in undiluted plasma was calculated as 312.5 ng/ml.
Information not collected in the asthma case‐control study.
Rural survey and urban survey: infection with any of A. lumbricoides (KK), N. americanus (PCR), T. trichiura (KK) or S. stercoralis (PCR). Asthma case‐control study: infection with any of A. lumbricoides (KK), N. americanus (KK) or T. trichiura (KK). Data on S. stercoralis infection not collected in the asthma case‐control study.
Compared to non‐asthmatic controls, asthma cases were on average older, and more likely to be SPT positive, and to have higher total and allergen‐specific IgE levels. Helminth infection prevalence was low in the asthma case‐control study and comparable between cases and controls (Table 1).
3.2. Associations between antibody (IgE and IgG4) concentrations and current S. mansoni infection and allergen skin prick test reactivity
In the rural survey (Table 2), Sm infection was positively associated with total and SWA‐ and SEA‐specific IgE and IgG4 (p < .001), and cockroach‐specific IgG4 concentrations (p = .002). Cockroach SPT reactivity was positively associated with ImmunoCAP®‐determined cockroach‐specific IgE (adjusted GMR [95% CI]: 8.30 [5.16, 13.35], p < .001) and total IgE concentrations (1.70 [1.21, 2.39], p = .003). Dermatophagoides (hereinafter HDM) SPT reactivity was positively associated with HDM‐specific IgE (ImmunoCAP®: 30.7 [17.43, 54.25], p < .001; ELISA: 8.47 [3.52, 20.40], p < .001), but inversely associated with SWA‐specific IgG4 (0.48 [0.27, 0.86], p = .016).
TABLE 2.
Rural survey: associations between antibody (IgE and IgG4) concentrations and current S. mansoni infection and skin prick test reactivity
| Antigen | Antibody | Geometric mean | aGMR (95% CI) d , e | p value | |
|---|---|---|---|---|---|
| Sm− a | Sm+ | ||||
| SWA | IgE c | 3806 | 5263 | 1.33 (1.19, 1.49) | <.001 |
| IgG4 c | 43,417 | 147,139 | 2.98 (1.87, 4.74) | <.001 | |
| SEA | IgEc | 3645 | 5206 | 1.43 (1.25, 1.64) | <.001 |
| IgG4 c | 31,284 | 256,465 | 6.13 (2.84, 13.24) | <.001 | |
| House dust mite | IgE b | 0.13 | 0.18 | 1.34 (0.85, 2.12) | .193 |
| IgE c | 24.25 | 27.16 | 1.29 (0.78, 2.11) | .305 | |
| IgG4 c | 11.31 | 14.26 | 1.35 (0.98, 1.85) | .065 | |
| German cockroach | IgE b | 0.31 | 0.33 | 0.93 (0.58, 1.49) | .748 |
| IgE c | 30.79 | 37.04 | 1.07 (0.55, 2.08) | .848 | |
| IgG4 c | 8.73 | 21.43 | 1.98 (1.12, 3.49) | .020 | |
| Total IgE b | 487.06 | 983.74 | 1.75 (1.37, 2.23) | <.001 | |
| Total IgG4 c | 14,015.76 | 29,461.26 | 2.30 (1.47, 3.60) | .001 | |
| Cockroach SPT‐ a | Cockroach SPT+ | ||||
|---|---|---|---|---|---|
| SWA | IgE c | 4481 | 4316 | 1.04 (0.86, 1.27) | .671 |
| IgG4 c | 86,035 | 58,160 | 0.87 (0.37, 2.01) | .727 | |
| SEA | IgE c | 4348 | 4327 | 0.99 (0.88, 1.14) | .990 |
| IgG4 c | 90,368 | 93,691 | 1.22 (0.49, 2.99) | .655 | |
| German cockroach | IgE b | 0.241 | 1.982 | 8.30 (5.16, 13.35) | <.001 |
| IgE c | 32.87 | 73.13 | 1.33 (0.46, 3.87) | .584 | |
| IgG4 c | 13.31 | 19.16 | 1.26 (0.61, 2.60) | .516 | |
| Total IgE b | 652.99 | 934.25 | 1.70 (1.21, 2.39) | .003 | |
| Total IgG4 c | 18,804.52 | 27,183.94 | 1.27 (0.74, 2.19) | .371 |
| Dust mite SPT‐ a | Dust mite SPT a | ||||
|---|---|---|---|---|---|
| SWA | IgE c | 4520 | 3969 | 0.94 (0.83, 1.08) | .383 |
| IgG4 c | 90,655 | 36,677 | 0.48 (0.27, 0.86) | .016 | |
| SEA | IgE c | 4389 | 4005 | 0.97 (0.85, 1.11) | .623 |
| IgG4 c | 89,975 | 96,456 | 1.40 (0.72, 2.73) | .309 | |
| House dust mite | IgE b | 0.10 | 2.27 | 30.7 (17.43, 54.25) | <.001 |
| IgE c | 20.14 | 123.69 | 8.47 (3.52, 20.40) | <.001 | |
| IgG4 c | 12.99 | 12.39 | 1.28 (0.66, 2.51) | .454 | |
| Total IgE b | 675.19 | 744.28 | 1.23 (0.89, 1.70) | .201 | |
| Total IgG4 c | 20,461.92 | 14,578.97 | 0.55 (0.28, 1.08) | .082 |
Significant associations (p ≤ .05) are highlighted in bold.
Abbreviations: aGMR, adjusted geometric mean ratio; 95% CI, 95% confidence interval; SEA, Schistosoma egg antigen; Sm+, positive Kato‐Katz and/or PCR test for diagnosis of current infection with S. mansoni; Sm−, negative Kato‐Katz and PCR test for diagnosis of current infection with S. mansoni; SWA, Schistosoma adult worm antigen.
Reference category,
Antibody levels detected by ImmunoCAP®. Concentrations are in kU/L.
Antibody levels detected by ELISA. Concentrations are in ng/ml.
All geometric mean ratios and 95% confidence intervals adjusted for survey design, age and sex.
Geometric mean ratios and 95% confidence intervals for associations between antibody levels and SPT reactivity were additionally adjusted for Sm result.
In the urban survey (Table 3), Sm infection was positively associated with total and SWA‐ and SEA‐specific IgE and IgG4 (p < .001), and ELISA‐determined HDM‐specific IgE (p = .037), cockroach‐specific IgE (p = .040) and cockroach‐specific IgG4 concentrations (p = .005). Cockroach SPT reactivity was positively associated with cockroach‐specific IgE (ImmunoCAP®: 13.49 [7.19, 25.32], p < .001; ELISA: 4.64 [2.00, 10.78], p = .001), cockroach‐specific IgG4 (3.45 [1.76, 6.77], p = .001) and total IgE concentrations (4.19 [2.80, 6.28], p < .001). Despite a positive association with SEA‐specific IgE (1.13 [1.03, 1.23], p = .012), cockroach SPT reactivity was inversely associated with SEA‐specific IgG4 (0.48 [0.27, 0.86], p = .016). HDM SPT reactivity was positively associated with HDM‐specific IgE (ImmunoCAP®: 47.48 [24.1, 93.68], p < .001; ELISA: 24.69 [12.9, 47.39], p < .001), HDM‐specific IgG4 (2.10 [1.53, 2.87], p < .001) and total IgE concentrations (2.46 [1.65, 3.67], p < .001).
TABLE 3.
Urban survey: associations between antibody (IgE and IgG4) concentrations and current S. mansoni infection and skin prick test reactivity
| Antigen | Antibody | Geometric mean | aGMR (95% CI) d , e | p value | |
|---|---|---|---|---|---|
| Sm‐ a | Sm+ | ||||
| SWA | IgE c | 2188 | 3949 | 1.75 (1.58, 1.94) | <.001 |
| IgG4 c | 12,134 | 80,715 | 5.93 (3.76, 9.38) | <.001 | |
| SEA | IgE c | 2434 | 4660 | 1.88 (1.63, 2.16) | <.001 |
| IgG4 c | 981 | 83,098 | 65.9 (41.4, 104.8) | <.001 | |
| House dust mite | IgE b | 0.18 | 0.25 | 1.39 (0.65, 3.00) | .379 |
| IgE c | 16.57 | 38.20 | 2.08 (1.05, 4.12) | .037 | |
| IgG4 c | 19.56 | 29.02 | 1.62 (0.99, 2.66) | .056 | |
| German cockroach | IgE b | 0.18 | 0.22 | 1.09 (0.63, 1.88) | .745 |
| IgE c | 18.04 | 38.12 | 1.91 (1.03, 3.53) | .040 | |
| IgG4 c | 8.78 | 24.28 | 2.54 (1.37, 4.71) | .005 | |
| Total IgE b | 143.21 | 360.22 | 2.62 (1.81, 3.79) | <.001 | |
| Total IgG4 c | 12,196.94 | 25,104.18 | 1.96 (1.45, 2.64) | <.001 | |
| Cockroach SPT‐ a | Cockroach SPT+ | ||||
|---|---|---|---|---|---|
| SWA | IgE c | 2367 | 2551 | 1.08 (0.99, 1.16) | .057 |
| IgG4 c | 15,174 | 21,505 | 1.41 (0.87, 2.30) | .152 | |
| SEA | IgE c | 2645 | 3187 | 1.13 (1.03, 1.23) | .012 |
| IgG4 c | 2131 | 1171 | 0.28 (0.12, 0.63) | .004 | |
| German cockroach | IgE b | 0.13 | 1.70 | 13.49 (7.19, 25.32) | <.001 |
| IgE c | 16.39 | 79.46 | 4.64 (2.00, 10.78) | .001 | |
| IgG4 c | 9.08 | 23.59 | 3.45 (1.76, 6.77) | .001 | |
| Total IgE b | 140.72 | 505.65 | 4.19 (2.80, 6.28) | <.001 | |
| Total IgG4 c | 12,517.24 | 17,417.20 | 1.32 (0.83, 2.12) | .223 |
| Dust mite SPT− a | Dust mite SPT+ | ||||
|---|---|---|---|---|---|
| SWA | IgE c | 2365 | 2526 | 0.99 (0.91, 1.09) | .915 |
| IgG4 c | 15,601 | 19,133 | 0.88 (0.44, 1.75) | .707 | |
| SEA | IgE c | 2655 | 3018 | 1.02 (0.86, 1.19) | .835 |
| IgG4 c | 1884 | 2337 | 0.55 (0.26, 1.17) | .113 | |
| House dust mite | IgE b | 0.09 | 4.86 | 47.48 (24.1, 93.68) | <.001 |
| IgE c | 10.34 | 297.85 | 24.69 (12.9, 47.39) | <.001 | |
| IgG4 c | 20.05 | 32.33 | 2.10 (1.53, 2.87) | <.001 | |
| Total IgE b | 141.85 | 346.98 | 2.46 (1.65, 3.67) | <.001 | |
| Total IgG4 c | 12,526.67 | 16,210.02 | 1.26 (0.85, 1.87) | .233 |
Significant associations (p ≤ .05) are highlighted in bold.
Abbreviations: aGMR, adjusted geometric mean ratio; 95% CI, 95% confidence interval; SEA, Schistosoma egg antigen; Sm+, positive Kato‐Katz and/or PCR test for diagnosis of current infection with S. mansoni; Sm−, negative Kato‐Katz and PCR test for diagnosis of current infection with S. mansoni; SWA, Schistosoma adult worm antigen.
reference category
Antibody levels detected by ImmunoCAP®. Concentrations are in kU/L.
Antibody levels detected by ELISA. Concentrations are in ng/ml.
All geometric mean ratios and 95% confidence intervals adjusted for survey design, age and sex.
Geometric mean ratios and 95% confidence intervals for associations between antibody levels and SPT reactivity were additionally adjusted for Sm result.
Akin to observations in the rural and urban surveys, cockroach and HDM SPT reactivity were generally positively associated with total and with cockroach‐ and HDM‐specific IgE concentrations, respectively, among both asthma cases and non‐asthmatic controls (Table S2).
3.3. Associations between antibody ratios and current S. mansoni infection and skin prick test reactivity
Schistosoma mansoni infection was positively associated with total IgE/cockroach‐specific IgE ratios in both community surveys (rural: 1.76 [1.31, 2.34], p < .001; urban: 2.39 [1.56, 3.66], p < .001), and with cockroach‐specific IgG4/IgE ratios in the rural survey (1.97 [1.33, 2.91], p = .002) [Figure 2A]. There were no significant associations between Sm infection and antibody ratios in the asthma case‐control study.
FIGURE 2.

Associations between antibody ratios and Schistosoma mansoni infection and skin prick test reactivity. Forest plots show geometric mean ratios (GMRs) and 95% confidence intervals (95% CIs) for associations between antibody ratios and (A) current S. mansoni infection and (B, C) allergen skin prick test reactivity. Raw antibody responses were skewed, so log10‐transformed antibody data were used in our linear regression models; we back‐transformed the results to obtain GMRs and 95% CIs. All GMRs and 95% CIs were adjusted for age and sex, and additionally for survey design in the rural and urban surveys. GMRs and 95% CIs for associations with skin prick test reactivity were additionally adjusted for S. mansoni infection status. Red colour denotes associations where GMR and 95% CI >1; blue colour denotes associations where GMR and 95% CI <1, and black colour denotes lack of a significant association. *Antibody levels detected by ELISA. Concentrations are in ng/ml. **Antibody levels detected by ImmunoCAP®. Concentrations are in kU/L
In all three studies, cockroach SPT reactivity was inversely associated with total IgE/cockroach‐specific IgE ratios (rural: 0.23 [0.16, 0.32], p < .001; urban: 0.31 [0.15, 0.64], p = .003; asthma study: 0.23 [0.17, 0.33], p < .001) [Figure 2B]. Cockroach SPT reactivity was also inversely associated with total IgG4/total IgE ratios in the urban survey (0.41 [0.24, 0.70], p = .002) and in the asthma case‐control study (0.42 [0.25, 0.73], p = .002), and with cockroach‐specific IgG4/IgE ratios in the asthma case‐control study (0.42 [0.19, 0.94], p = .034) [Figure 2B].
In all three studies, HDM SPT reactivity was inversely associated with total IgE/HDM‐specific IgE ratios (rural: 0.05 [0.03, 0.08], p < .001; urban: 0.05 [0.03, 0.10], p < .001; asthma study: 0.03 [0.02, 0.04], p < .001), and HDM‐specific IgG4/IgE ratios (rural: 0.32 [0.19, 0.55], p < .001; urban: 0.17 [0.11, 0.28], p < .001; asthma study: 0.04 [0.02, 0.09], p < .001) [Figure 2C]. HDM SPT reactivity was also inversely associated with total IgG4/total IgE ratios in the asthma case‐control study (0.34 [0.22, 0.52], p < .001) [Figure 2C].
Assessment of associations between antibody ratios and skin prick test reactivity, independently among asthma cases and non‐asthmatic controls, showed observations akin to the above: cockroach and HDM SPT reactivity were inversely associated with allergen‐specific IgG4/IgE ratios, total IgE/allergen‐specific IgE ratios and total IgG4/total IgE ratios (Table S3).
3.4. Rural‐urban comparison of plasma IgE and IgG4 levels
Urban participants, compared with rural survey participants, had lower geometric mean concentrations of SEA‐ and SWA‐specific IgE, IgG and IgG4 (p < .001), cockroach‐specific IgE (ImmunoCAP®: p = .041; ELISA: p = 0.017) and IgG4 (p = .038), total IgE (p < .001), total IgG4 (p = .011), total IgE/cockroach‐specific IgE ratios (p < .001) and total IgE/HDM‐specific IgE ratios (p < .001) [Table 4]. However, HDM‐specific IgE (ImmunoCAP®, p = .038) and IgG4 (p = .001), and HDM‐specific IgG4/IgE ratios (p = .011), were higher in the urban survey.
TABLE 4.
Rural‐urban comparison of IgE and IgG4 levels
| Antigen | Antibody / antibody ratio | Geometric mean | aGMR (95% CI) d | p value | |
|---|---|---|---|---|---|
| Rural a | Urban | ||||
| SWA | IgE c | 4452.34 | 2386.55 | 0.56 (0.52, 0.61) | <.001 |
| IgG4 c | 82,045.65 | 16,091.34 | 0.24 (0.16, 0.35) | <.001 | |
| SEA | IgE c | 4340.73 | 2714.94 | 0.63 (0.56, 0.71) | <.001 |
| IgG4c | 90,796.70 | 1957.08 | 0.03 (0.02, 0.06) | <.001 | |
| German cockroach | IgE b | 0.31 | 0.19 | 0.71 (0.50, 0.99) | .041 |
| IgE c | 35.81 | 20.65 | 0.62 (0.42, 0.91) | .017 | |
| IgG4 c | 13.97 | 10.31 | 0.74 (0.56, 0.98) | .038 | |
| IgG4/IgE ratio c | 5.40 | 5.58 | 1.00 (0.70, 1.44) | .984 | |
| House dust mite | IgE b | 0.14 | 0.19 | 1.63 (1.03, 2.60) | .038 |
| IgE c | 24.49 | 18.91 | 0.86 (0.60, 1.24) | .419 | |
| IgG4 c | 12.89 | 21.91 | 1.54 (1.20, 1.96) | .001 | |
| IgG4/IgE ratio c | 11.86 | 21.44 | 1.58 (1.12, 2.24) | .011 | |
| Total IgEb | 682.57 | 166.23 | 0.29 (0.22, 0.39) | <.001 | |
| Total IgG4 c | 19,689.40 | 13,254.08 | 0.71 (0.55, 0.92) | .011 | |
| Total IgG4/total IgE ratio | 37.58 | 98.93 | 2.54 (1.98, 3.27) | <.001 | |
| Total IgE/cockroach IgE ratio b | 2025.34 | 895.46 | 0.45 (0.34, 0.60) | <.001 | |
| Total IgE/dust mite IgE ratio b | 3948.87 | 898.91 | 0.23 (0.16, 0.33) | <.001 | |
Significant associations (p ≤ .05) are highlighted in bold.
Abbreviations: aGMR, adjusted geometric mean ratio; 95% CI, 95% confidence interval; SEA, Schistosoma egg antigen; SWA, Schistosoma adult worm antigen.
Reference category.
Antibody levels detected by ImmunoCAP®. Concentrations are in kU/L.
Antibody levels detected by ELISA. Concentrations are in ng/ml.
All geometric mean ratios and 95% confidence intervals adjusted for survey design, age and sex.
3.5. Associations between antibody profiles and asthma
Asthma was positively associated with total IgE (1.53 [1.13, 2.05], p = .005), cockroach‐specific IgE (ELISA: 2.65 [1.31, 5.34], p = .007; ImmunoCAP®: 2.03 [1.39, 2.97], p < .001) and HDM‐specific IgE (ELISA: 4.99 [2.33, 10.72], p < .001; ImmunoCAP®: 4.79 [2.72, 8.44], p < .001) [Figure 3A]. Conversely, there were inverse associations between asthma and total IgE/HDM‐specific IgE ratios (0.33 [0.21, 0.50], p < .001), total IgE/cockroach‐specific IgE ratios (0.75 [0.57, 0.99], p = .047) and HDM‐specific IgG4/IgE ratios (0.24 [0.12, 0.48], p < 0.001) [Figure 3B].
FIGURE 3.
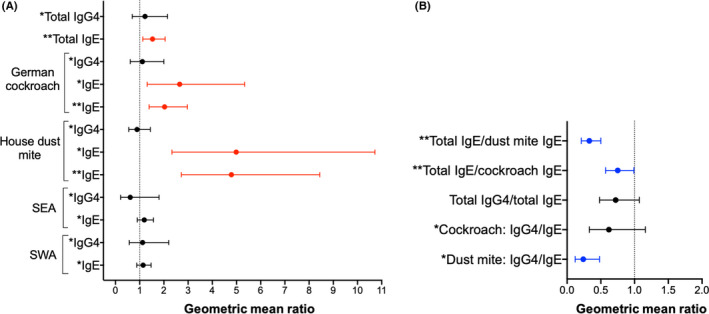
Asthma case‐control study: associations between asthma and antibody concentrations and ratios. Forest plots show geometric mean ratios (GMRs) and 95% confidence intervals (95% CIs) for associations between asthma and antibody concentrations (A) and ratios (B). Raw antibody responses were skewed, so log10‐transformed antibody data were used in our linear regression models; we back‐transformed the results to obtain GMRs and 95% CIs. All GMRs and 95% CIs were adjusted for age and sex. Red colour denotes associations where GMR and 95% CI >1; blue colour denotes associations where GMR and 95% CI <1, and black colour denotes lack of a significant association. *Antibody levels detected by ELISA. Concentrations are in ng/ml. **Antibody levels detected by ImmunoCAP®. Concentrations are in kU/L. SEA, Schistosoma egg antigen; SWA, Schistosoma adult worm antigen
Asthma is a syndrome of different phenotypes 38 and is sometimes broadly grouped into “allergic” and “non‐allergic” phenotypes based on atopic sensitization. In our case‐control study, “allergic” (SPT positive) asthma cases had lower HDM‐specific IgG4/IgE, total IgG4/total IgE and total IgE/allergen‐specific IgE ratios, compared with “non‐allergic” (SPT negative) asthma cases (Table S3 and Figure S1A and S1B ). Furthermore, HDM SPT–positive asthma cases had lower HDM‐specific IgG4/IgE, total IgG4/total IgE and total IgE/HDM‐specific IgE ratios, compared with both SPT‐negative and SPT‐positive controls (Table S3 and Figure S1A ). The same trend was observed for comparisons between cockroach SPT‐positive asthma cases and both SPT‐negative and SPT‐positive controls, albeit without statistical significance (Figure S1B). Interestingly, HDM and cockroach SPT‐negative asthma cases had lower geometric means of allergen‐specific IgG4/IgE and total IgE/allergen‐specific IgE ratios than SPT‐negative controls, but higher levels compared with SPT‐positive controls (Table S3).
4. DISCUSSION
We assessed total, Schistosoma‐ and allergen‐specific IgE and IgG4 concentrations among participants of three large population‐based studies in Uganda and found strong inverse associations between allergen SPT reactivity and Schistosoma‐specific IgG4, allergen‐specific IgG4/IgE ratios and total IgE/allergen‐specific IgE ratios. Importantly, doctor‐diagnosed asthma cases also had significantly lower allergen‐specific IgG4/IgE ratios and total IgE/allergen‐specific IgE ratios compared with non‐asthmatic controls. Sm infection and the rural (vs. urban) environment were positively associated with total, Schistosoma‐ and allergen‐specific IgE and IgG4, and with allergen‐specific IgG4/IgE ratios and total IgE/allergen‐specific IgE ratios.
Host responses to helminths exhibit significant similarities with responses to common allergens, owing to related molecular targets. 39 , 40 , 41 , 42 This probably explains observed positive associations between Sm infection and allergen‐specific IgG4 and IgE among participants of our rural and urban community surveys. Strong positive associations between Sm infection and total IgE are consistent with observations of helminth‐induced polyclonal stimulation of non‐specific IgE. 18 It is plausible that helminths potentiate synthesis of this seemingly superfluous IgE primarily as an immune evasion mechanism: disproportionately elevated levels of non–helminth‐specific IgE saturate available IgE receptors (FcεRIs) on effector cells, inhibiting specific mediator release. 43 This is expected to have benefits for the helminth, but also inadvertent bystander effects on allergic responses, as allergens will be outcompeted and less likely to cross‐link FcεRI‐bound IgE. 14 , 20 , 21
Mitre et al. 44 initially found that a high total IgE/allergen‐specific IgE ratio did not inhibit basophil degranulation, but further experiments suggested that inhibition could occur at ratios exceeding 500:1. In the current analysis, we show that total IgE/allergen‐specific IgE ratios were strongly inversely associated with allergen SPT reactivity (irrespective of study setting), and with asthma, providing strong support for the above hypotheses. Moreover, geometric means of total IgE/allergen‐specific IgE ratios exceeded 700 among non‐asthmatic controls in the case‐control study, and 1000 among our Sm‐infected and SPT‐negative participants irrespective of study setting—in excess of Mitre's threshold for inhibition.
Our observations of inverse associations between allergen‐specific IgG4/IgE ratios and SPT reactivity and asthma strengthen the argument that the IgG4‐IgE balance is also important in protection against allergies. In addition, SWA‐ and SEA‐specific IgG4 concentrations were significantly lower among HDM SPT‐reactive rural survey participants and cockroach SPT‐reactive urban survey participants, respectively. Although IgG4 has been implicated in IgG4‐related disease, 45 it appears to have a more prominent role in immune regulation 16 and tolerance. 46 Besides, IgG4 does not activate the complement system or lead to formation of immune complexes, and is not associated with mast cell or basophil degranulation. 47 Its major mode of action against allergic inflammation seems to be blockage of allergen recognition by IgE, because both antibodies have similar antigenic specificity. 16 , 48 , 49 Furthermore, concurrent binding of the FcεRI and the inhibitory IgG receptor (FcγRIIB) by IgE and IgG4, respectively, may result in a FcγRIIB‐dependent inhibition of IgE‐mediated effector cell activation. 49 , 50 , 51 It is worth noting that other IgG classes have also been associated with IgE blocking; however, IgG4 seems to play the bigger role. 52
There is a counter‐argument that IgG4 might not have a direct mechanistic role in protection against allergy‐related outcomes. Instead, the inverse association between IgG4 levels and IgE effector function may represent an ‘epiphenomenon’, merely reflective of parallel phenomena, such as abundance of IL‐10 (and/or TGF‐β)–producing T regulatory and B regulatory cells. 53 However, the latter hypothesis remains to be confirmed by experimental studies.
We measured allergen extract–specific IgE using the standard ImmunoCAP® test, and later, using an in‐house ELISA assay. The latter technique was used to facilitate determination of IgG4/IgE ratios, since, for logistical reasons, we could not measure allergen‐specific IgG4 by ImmunoCAP®. However, patterns of associations with ImmunoCAP®‐ and ELISA‐determined IgE were comparable (except for cockroach‐specific IgE in a few instances). We did not formally adjust for multiple statistical testing. However, our interpretations rely on patterns and magnitude of associations, and consistency and biological credibility of our findings based on other published works. It is noteworthy that our studies were cross‐sectional; therefore, it was not possible to demonstrate causal relationships between antibody profiles and Sm infection, the rural‐urban environment, allergic sensitization and asthma.
In conclusion, we underline the potential role of the total IgE‐allergen‐specific IgE balance and the IgG4‐IgE balance in mitigation of allergic responses, providing correlative evidence from three cross‐sectional population‐based studies. These results build upon previous findings that apportion high IgG4/IgE ratios an important role in allergen‐specific immunotherapy. 46 Further studies in animal models would advance understanding of a potential role of IgG4 (and polyclonally stimulated IgE) in mitigation of allergy‐related disease; however, they are hindered by the lack of IgG4 in mice. Therefore, future work should focus on in vitro experiments using human samples. For example, a microarray screening platform could be utilized to identify helminth antigens that provoke robust serum IgG4 and little or no IgE response. Such antigens may be valuable for therapeutic approaches against allergic conditions.
CONFLICT OF INTERESTS
The authors declare no conflict of interest.
AUTHOR CONTRIBUTIONS
AME, GN, HM and ELW contributed to the conception and experimental design of the studies. GN, JN and JK performed the laboratory experiments. AME, HM, RES and MN led and participated in field and clinic procedures. GN analysed the results with significant input from ELW. GN wrote the manuscript, with all authors contributing to the interpretation of the results, and revision and approval of the final manuscript.
Supporting information
Appendix S1
ACKNOWLEDGEMENTS
We thank Koome sub‐county and Entebbe municipality community members for participating in the rural (LaVIISWA) study and the urban survey, respectively. We are grateful to schoolchildren in Entebbe municipality and the surrounding areas in Wakiso District who took part in the asthma case‐control study. We also thank all study staff.
Funding information
This work was funded by the Wellcome Trust (grant 095778 awarded to AME for the urban and rural surveys, and grants 102512/Z/13/Z and 204928/Z/16/Z awarded to HM for the asthma study). GN was supported by a fellowship from the African Partnership for Chronic Disease Research (APCDR). RES was supported by a PhD fellowship from the Makerere University—Uganda Virus Research Institute Centre of Excellence for Infection and Immunity Research and Training (MUII‐plus). MUII‐plus is funded under the DELTAS Africa Initiative. The DELTAS Africa Initiative is an independent funding scheme of the African Academy of Sciences (AAS), Alliance for Accelerating Excellence in Science in Africa (AESA) and supported by the New Partnership for Africa's Development Planning and Coordinating Agency (NEPAD Agency) with funding from the Wellcome Trust (grant 107743) and the UK Government. The MRC/UVRI and LSHTM Uganda Research Unit is jointly funded by the UK Medical Research Council (MRC) and the UK Department for International Development (DFID) under the MRC/DFID Concordat agreement.
DATA AVAILABILITY STATEMENT
Data are available on request via https://doi.org/10.17037/DATA.00001804. To obtain access to the data, complete the application process on the website. Requests will be reviewed and assessed by the corresponding author, in consultation with the LSHTM’s Research Data Manager and relevant LSHTM staff members responsible for research governance and data protection. Applications will be evaluated on the basis of their compatibility with the study's research objectives and the ability to provide de‐identified data sufficient to meet the intended purpose, without breaching participant confidentiality or the study's ethical and legal commitments. Successful applicants will be asked to sign a Data Transfer Agreement prior to being provided with the data.
REFERENCES
- 1. Leonardi‐Bee J, Pritchard D, Britton J. Asthma and current intestinal parasite infection: systematic review and meta‐analysis. Am J Respir Crit Care Med. 2006;174(5):514‐523. [DOI] [PubMed] [Google Scholar]
- 2. Cooper PJ, Chico ME, Rodrigues LC, et al. Reduced risk of atopy among school‐age children infected with geohelminth parasites in a rural area of the tropics. J Allergy Clin Immunol. 2003;111(5):995‐1000. [DOI] [PubMed] [Google Scholar]
- 3. Mpairwe H, Webb EL, Muhangi L, et al. Anthelminthic treatment during pregnancy is associated with increased risk of infantile eczema: randomised‐controlled trial results. Pediatr Allergy Immunol. 2011;22(3):305‐312. [DOI] [PMC free article] [PubMed] [Google Scholar]
- 4. Cooper PJ, Chico ME, Bland M, Griffin GE, Nutman TB. Allergic symptoms, atopy, and geohelminth infections in a rural area of Ecuador. Am J Respir Crit Care Med. 2003;168(3):313‐317. [DOI] [PubMed] [Google Scholar]
- 5. van den Biggelaar AH, Lopuhaa C, van Ree R, et al. The prevalence of parasite infestation and house dust mite sensitization in Gabonese schoolchildren. Int Arch Allergy Immunol. 2001;126(3):231‐238. [DOI] [PubMed] [Google Scholar]
- 6. Medeiros M Jr, Figueiredo JP, Almeida MC, et al. Schistosoma mansoni infection is associated with a reduced course of asthma. J Allergy Clin Immunol. 2003;111(5):947‐951. [DOI] [PubMed] [Google Scholar]
- 7. Nyan OA, Walraven GE, Banya WA, et al. Atopy, intestinal helminth infection and total serum IgE in rural and urban adult Gambian communities. Clin Exp Allergy. 2001;31(11):1672‐1678. [DOI] [PubMed] [Google Scholar]
- 8. Oliveira SM, Bezerra FS, Carneiro TR, Pinheiro MC, Queiroz JA. Association between allergic responses and Schistosoma mansoni infection in residents in a low‐endemic setting in Brazil. Rev Soc Bras Med Trop. 2014;47(6):770‐774. [DOI] [PubMed] [Google Scholar]
- 9. van den Biggelaar AH, van Ree R, Rodrigues LC, et al. Decreased atopy in children infected with Schistosoma haematobium: a role for parasite‐induced interleukin‐10. Lancet. 2000;356(9243):1723‐1727. [DOI] [PubMed] [Google Scholar]
- 10. Platts‐Mills TA, Cooper PJ. Differences in asthma between rural and urban communities in South Africa and other developing countries. J Allergy Clin Immunol. 2010;125(1):106‐107. [DOI] [PubMed] [Google Scholar]
- 11. Nkurunungi G, Lubyayi L, Versteeg SA, et al. Do helminth infections underpin urban‐rural differences in risk factors for allergy‐related outcomes? Clin Exp Allergy. 2019;49(5):663‐676. [DOI] [PMC free article] [PubMed] [Google Scholar]
- 12. Mpairwe H, Ndibazza J, Webb EL, et al. Maternal hookworm modifies risk factors for childhood eczema: results from a birth cohort in Uganda. Pediatr Allergy Immunol. 2014;25(5):481‐488. [DOI] [PMC free article] [PubMed] [Google Scholar]
- 13. Maizels RM, Smits HH, McSorley HJ. Modulation of host immunity by helminths: the expanding repertoire of parasite effector molecules. Immunity. 2018;49(5):801‐818. [DOI] [PMC free article] [PubMed] [Google Scholar]
- 14. Hamid F, Amoah AS, van Ree R, Yazdanbakhsh M. Helminth‐induced IgE and protection against allergic disorders. Curr Top Microbiol Immunol. 2015;388:91‐108. [DOI] [PubMed] [Google Scholar]
- 15. Figueiredo CA, Barreto ML, Rodrigues LC, et al. Chronic intestinal helminth infections are associated with immune hyporesponsiveness and induction of a regulatory network. Infect Immun. 2010;78(7):3160‐3167. [DOI] [PMC free article] [PubMed] [Google Scholar]
- 16. Rihet P, Demeure CE, Dessein AJ, Bourgois A. Strong serum inhibition of specific IgE correlated to competing IgG4, revealed by a new methodology in subjects from a S. mansoni endemic area. Eur J Immunol. 1992;22(8):2063‐2070. [DOI] [PubMed] [Google Scholar]
- 17. Nkurunungi G, Kabagenyi J, Nampijja M, et al. Schistosoma mansoni‐specific immune responses and allergy in Uganda. Parasite Immunol. 2018;40(1):e12506. [DOI] [PMC free article] [PubMed] [Google Scholar]
- 18. Turner KJ, Feddema L, Quinn EH. Non‐specific potentiation of IgE by parasitic infections in man. Int Arch Allergy Appl Immunol. 1979;58(2):232‐236. [DOI] [PubMed] [Google Scholar]
- 19. Jarrett EE, Miller HR. Production and activities of IgE in helminth infection. Prog Allergy. 1982;31:178‐233. [PubMed] [Google Scholar]
- 20. Godfrey RC, Gradidge CF. Allergic sensitisation of human lung fragments prevented by saturation of IgE binding sites. Nature. 1976;259(5543):484‐486. [DOI] [PubMed] [Google Scholar]
- 21. Lynch NR, Hagel IA, Palenque ME, et al. Relationship between helminthic infection and IgE response in atopic and nonatopic children in a tropical environment. J Allergy Clin Immunol. 1998;101(2 Pt 1):217‐221. [DOI] [PubMed] [Google Scholar]
- 22. MacGlashan DW Jr, Bochner BS, Adelman DC, et al. Down‐regulation of Fc(epsilon)RI expression on human basophils during in vivo treatment of atopic patients with anti‐IgE antibody. J Immunol. 1997;158(3):1438‐1445. [PubMed] [Google Scholar]
- 23. Nampijja M, Webb EL, Kaweesa J, et al. The Lake Victoria island intervention study on worms and allergy‐related diseases (LaVIISWA): study protocol for a randomised controlled trial. Trials. 2015;16(1):187. [DOI] [PMC free article] [PubMed] [Google Scholar]
- 24. Sanya RE, Nkurunungi G, Hoek Spaans R, et al. The impact of intensive versus standard anthelminthic treatment on allergy‐related outcomes, helminth infection intensity, and helminth‐related morbidity in Lake Victoria Fishing Communities, Uganda: results from the LaVIISWA Cluster‐randomized Trial. Clin Infect Dis. 2019;68(10):1665‐1674. [DOI] [PMC free article] [PubMed] [Google Scholar]
- 25. Webb EL, Nampijja M, Kaweesa J, et al. Helminths are positively associated with atopy and wheeze in Ugandan fishing communities: results from a cross‐sectional survey. Allergy. 2016;71(8):1156‐1169. [DOI] [PMC free article] [PubMed] [Google Scholar]
- 26. Mpairwe H, Namutebi M, Nkurunungi G, et al. Risk factors for asthma among schoolchildren who participated in a case‐control study in urban Uganda. Elife. 2019;8:e49496. [DOI] [PMC free article] [PubMed] [Google Scholar]
- 27. Mpairwe H, Tumwesige P, Namutebi M, et al. Asthma control and management among schoolchildren in urban Uganda: results from a cross‐sectional study [version 1; peer review: 1 approved with reservations]. Wellcome Open Res. 2019;4:168. [DOI] [PMC free article] [PubMed] [Google Scholar]
- 28. Ellwood P, Asher MI, Beasley R, Clayton TO, Stewart AW. ISAAC Phase Three Manual. Auckland, New Zealand: ISAAC International Data Centre; 2000. [Google Scholar]
- 29. Katz N, Chaves A, Pellegrino J. A simple device for quantitative stool thick‐smear technique in Schistosomiasis mansoni. Rev Inst Med Trop Sao Paulo. 1972;14(6):397‐400. [PubMed] [Google Scholar]
- 30. Verweij JJ, Brienen EA, Ziem J, Yelifari L, Polderman AM, Van Lieshout L. Simultaneous detection and quantification of Ancylostoma duodenale, Necator americanus, and Oesophagostomum bifurcum in fecal samples using multiplex real‐time PCR. Am J Trop Med Hyg. 2007;77(4):685‐690. [PubMed] [Google Scholar]
- 31. Verweij JJ, Canales M, Polman K, et al. Molecular diagnosis of Strongyloides stercoralis in faecal samples using real‐time PCR. Trans R Soc Trop Med Hyg. 2009;103(4):342‐346. [DOI] [PubMed] [Google Scholar]
- 32. Emmanuel IOA, Ekkehard D. Epidemiology, of bilharzias (schistosomiasis) in Uganda from 1902 until 2005. Afr Health Sci. 2008;8(4):239‐243. [PMC free article] [PubMed] [Google Scholar]
- 33. Heinzerling L, Mari A, Bergmann KC, et al. The skin prick test ‐ European standards. Clin Transl Allergy. 2013;3(1):3. [DOI] [PMC free article] [PubMed] [Google Scholar]
- 34. Mpairwe H, Muhangi L, Ndibazza J, et al. Skin prick test reactivity to common allergens among women in Entebbe, Uganda. Trans R Soc Trop Med Hyg. 2008;102(4):367‐373. [DOI] [PMC free article] [PubMed] [Google Scholar]
- 35. ImmunoCAP Specific IgE. http://www.phadia.com/da/Products/Allergy‐testing‐products/ImmunoCAP‐Lab‐Tests/sIgE/. Accessed 5 July 2020.
- 36. Cheung YB, Jeffries D, Thomson A, Milligan P. A simple approach to test for interaction between intervention and an individual‐level variable in community randomized trials. Trop Med Int Health. 2008;13(2):247‐255. [DOI] [PubMed] [Google Scholar]
- 37. Nkurunungi G, Mpairwe H, Versteeg SA, et al. Cross‐reactive carbohydrate determinant‐specific IgE obscures true atopy and exhibits alpha‐1,3‐fucose epitope‐specific inverse associations with asthma. Allergy. 2020;76(1):233‐246. [DOI] [PMC free article] [PubMed] [Google Scholar]
- 38. Ozdemir C, Kucuksezer UC, Akdis M, Akdis CA. The concepts of asthma endotypes and phenotypes to guide current and novel treatment strategies. Expert Rev Respir Med. 2018;12(9):733‐743. [DOI] [PubMed] [Google Scholar]
- 39. Tyagi N, Farnell EJ, Fitzsimmons CM, et al. Comparisons of allergenic and metazoan parasite proteins: allergy the price of immunity. PLoS Comput Biol. 2015;11(10):e1004546. [DOI] [PMC free article] [PubMed] [Google Scholar]
- 40. Santiago HC, Bennuru S, Boyd A, Eberhard M, Nutman TB. Structural and immunologic cross‐reactivity among filarial and mite tropomyosin: implications for the hygiene hypothesis. J Allergy Clin Immunol. 2011;127(2):479‐486. [DOI] [PMC free article] [PubMed] [Google Scholar]
- 41. Farias LP, Rodrigues D, Cunna V, Rofatto HK, Faquim‐Mauro EL, Leite LC. Schistosoma mansoni venom allergen like proteins present differential allergic responses in a murine model of airway inflammation. PLoS Negl Trop Dis. 2012;6(2):e1510. [DOI] [PMC free article] [PubMed] [Google Scholar]
- 42. Wan D, Ludolf F, Alanine DG, et al. Use of humanised rat basophilic leukaemia cell line RS‐ATL8 for the assessment of allergenicity of Schistosoma mansoni proteins. PLoS Negl Trop Dis. 2014;8(9):e3124. [DOI] [PMC free article] [PubMed] [Google Scholar]
- 43. Pritchard DI. Immunity to helminths: is too much IgE parasite–rather than host‐protective? Parasite Immunol. 1993;15(1):5‐9. [DOI] [PubMed] [Google Scholar]
- 44. Mitre E, Norwood S, Nutman TB. Saturation of immunoglobulin E (IgE) binding sites by polyclonal IgE does not explain the protective effect of helminth infections against atopy. Infect Immun. 2005;73(7):4106‐4111. [DOI] [PMC free article] [PubMed] [Google Scholar]
- 45. Bledsoe JR, Della‐Torre E, Rovati L, Deshpande V. IgG4‐related disease: review of the histopathologic features, differential diagnosis, and therapeutic approach. APMIS. 2018;126(6):459‐476. [DOI] [PubMed] [Google Scholar]
- 46. Tseng SH, Fu LS, Nong BR, Weng JD, Shyur SD. Changes in serum specific IgG4 and IgG4/ IgE ratio in mite‐sensitized Taiwanese children with allergic rhinitis receiving short‐term sublingual‐swallow immunotherapy: a multicenter, randomized, placebo‐controlled trial. Asian Pac J Allergy Immunol. 2008;26(2–3):105‐112. [PubMed] [Google Scholar]
- 47. Aalberse RC, Schuurman J. IgG4 breaking the rules. Immunology. 2002;105(1):9‐19. [DOI] [PMC free article] [PubMed] [Google Scholar]
- 48. van Neerven RJ, Wikborg T, Lund G, et al. Blocking antibodies induced by specific allergy vaccination prevent the activation of CD4+ T cells by inhibiting serum‐IgE‐facilitated allergen presentation. J Immunol. 1999;163(5):2944‐2952. [PubMed] [Google Scholar]
- 49. James LK, Till SJ. Potential mechanisms for IgG4 inhibition of immediate hypersensitivity reactions. Curr Allergy Asthma Rep. 2016;16(3):23. [DOI] [PMC free article] [PubMed] [Google Scholar]
- 50. Cassard L, Jonsson F, Arnaud S, Daeron M. Fcgamma receptors inhibit mouse and human basophil activation. J Immunol. 2012;189(6):2995‐3006. [DOI] [PubMed] [Google Scholar]
- 51. Strait RT, Morris SC, Finkelman FD. IgG‐blocking antibodies inhibit IgE‐mediated anaphylaxis in vivo through both antigen interception and Fc gamma RIIb cross‐linking. J Clin Investig. 2006;116(3):833‐841. [DOI] [PMC free article] [PubMed] [Google Scholar]
- 52. Hussain R, Poindexter RW, Ottesen EA. Control of allergic reactivity in human filariasis. Predominant localization of blocking antibody to the IgG4 subclass. J Immunol. 1992;148(9):2731‐2737. [PubMed] [Google Scholar]
- 53. Aalberse R. The role of IgG antibodies in allergy and immunotherapy. Allergy. 2011;66(Suppl 95):28‐30. [DOI] [PubMed] [Google Scholar]
Associated Data
This section collects any data citations, data availability statements, or supplementary materials included in this article.
Supplementary Materials
Appendix S1
Data Availability Statement
Data are available on request via https://doi.org/10.17037/DATA.00001804. To obtain access to the data, complete the application process on the website. Requests will be reviewed and assessed by the corresponding author, in consultation with the LSHTM’s Research Data Manager and relevant LSHTM staff members responsible for research governance and data protection. Applications will be evaluated on the basis of their compatibility with the study's research objectives and the ability to provide de‐identified data sufficient to meet the intended purpose, without breaching participant confidentiality or the study's ethical and legal commitments. Successful applicants will be asked to sign a Data Transfer Agreement prior to being provided with the data.