Abstract
Studying the function of common genetic variants in primary human tissues and during development is challenging. To address this, we use an efficient multiplexing strategy to differentiate 215 human induced pluripotent stem cell (iPSC) lines towards a midbrain neural fate, including dopaminergic neurons, and use single-cell RNA sequencing (scRNA-seq) to profile over 1 million cells across three differentiation time points. The proportion of neurons produced by each cell line is highly reproducible, and is predictable by robust molecular markers expressed in pluripotent cells. Expression quantitative trait loci (eQTL) were characterized at different stages of neuronal development, and in response to rotenone-induced oxidative stress. Of these, 1,284 colocalize with known neurological trait risk loci, and 46% are not found in the GTEx catalog. Our study illustrates how coupling scRNA-seq with long-term iPSC differentiation enables mechanistic studies of human trait-associated genetic variants in otherwise inaccessible cell states.
Introduction
Human iPSCs are a promising model for assessing the cellular consequences of human genetic variation across different lineages, developmental states and cell types. In particular, human iPSCs facilitate the study of developmental states and stimulation conditions that would be challenging or even impossible to obtain in vivo. The creation of cell banks containing hundreds of iPSC lines1 provides an opportunity to perform population-scale studies in vitro 2–5. However, differentiating iPSCs is expensive and labor-intensive, with experiments being difficult to compare due to substantial batch variation. Thus, studies of more than a handful of lines remain a significant challenge. Furthermore, most iPSC differentiation protocols produce heterogeneous cell populations with the target cell type representing only a subset6–8. This variability in differentiation outcomes hinders efforts to dissect genetic contributions to cellular phenotypes.
scRNA-seq enables multiplexed experimental designs, where cells from multiple donors are pooled together2,9,10. Multiplexing improves throughput and allows experimental variability between differentiation batches to be rigorously controlled, enabling discrimination of pool effects from differences between lines. However, multiplexed experimental designs have largely been applied to short differentiation protocols and have not captured developmental progression toward a mature cell fate.
Here, we apply a multiplexing strategy to profile the differentiation and maturation of 215 iPSC lines derived from the Human Induced Pluripotent Stem Cell Initiative (HipSci) towards a midbrain neural fate, including dopaminergic neurons (DA). DA are involved in motor function and other cognitive processes and play key roles in neurological disorders, including Parkinson’s disease11,12 (PD). Using an established protocol13, we collected cells at three maturation stages (progenitor-like, young neurons, and more mature neurons), covering 52 days of differentiation. We additionally exposed cells to a chemical stressor on day 51 to explore how genetic variation shapes stress response. Using this system, we create an eQTL map at multiple stages of human neuronal differentiation, and identify over 500 novel trait/eQTL colocalizations. Using estimates of cell population composition based on scRNA-seq, we identify a strong cell-intrinsic differentiation bias and identify molecular signatures that can predict which iPSC lines fail to efficiently produce neuronal cells.
Results
High-throughput differentiation of midbrain dopaminergic neurons
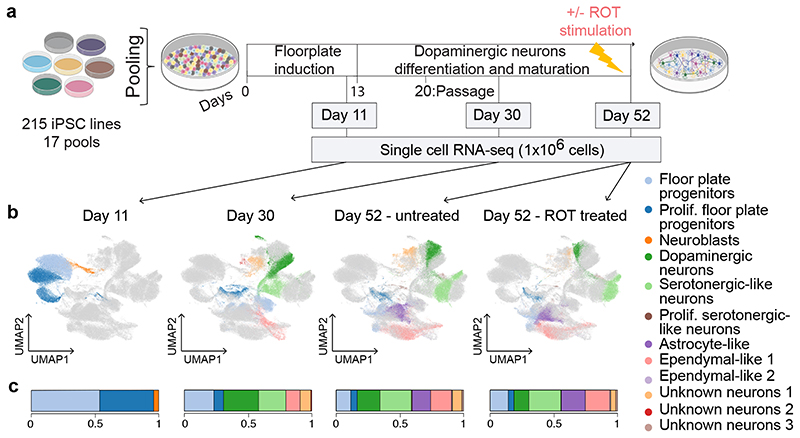
We selected 215 iPSC lines from the HipSci project1, each derived from a single healthy donor, for differentiation towards a midbrain cell fate, including DA13. Differentiation experiments were multiplexed in pools containing between 7 and 24 lines per experiment, with 35 lines being contained in multiple pools (Supplementary Fig. 1, Supplementary Table 1). Immunochemistry confirmed that cells differentiated in pools or individually both expressed protein markers associated with patterning of DA (LMX1A, FOXA2 and TH) (Supplementary Fig. 2). To capture transcriptional changes during neurogenesis and neuronal maturation, we performed scRNA-seq of cells captured at day 11 (D11, midbrain floorplate progenitors), day 30 (D30, young post-mitotic midbrain neurons) and day 52 (D52, more mature midbrain neurons). To mimic an oxidative stress condition, we also profiled day 52 neurons 24 hours after exposure to a sub-lethal dose of rotenone (ROT, 0.1 μM; 24 h), a chemical stressor that preferentially leads to DA death in models of PD (Fig. 1a)14.
Fig. 1. Experimental design and cell type heterogeneity in pooled differentiations of iPSCs to a midbrain cell fate.
(a) Experimental workflow for scRNA-seq analysis of iPSC-derived dopaminergic neurons. Time points at which cells were collected for scRNA-seq profiling (day 11, day 30, day 52) are indicated. On day 51, half of the cells were stimulated with rotenone (ROT) for 24 h to induce oxidative stress. (b) UMAP plot of all 1,027,401 cells assayed, colored by annotated cell type identity (Methods). Cells that were not collected at a given condition (time point, stimulus) are displayed in light grey. Prolif: Proliferating. (c) Bar plot showing, for each condition, the fraction of cells assigned to each cell type.
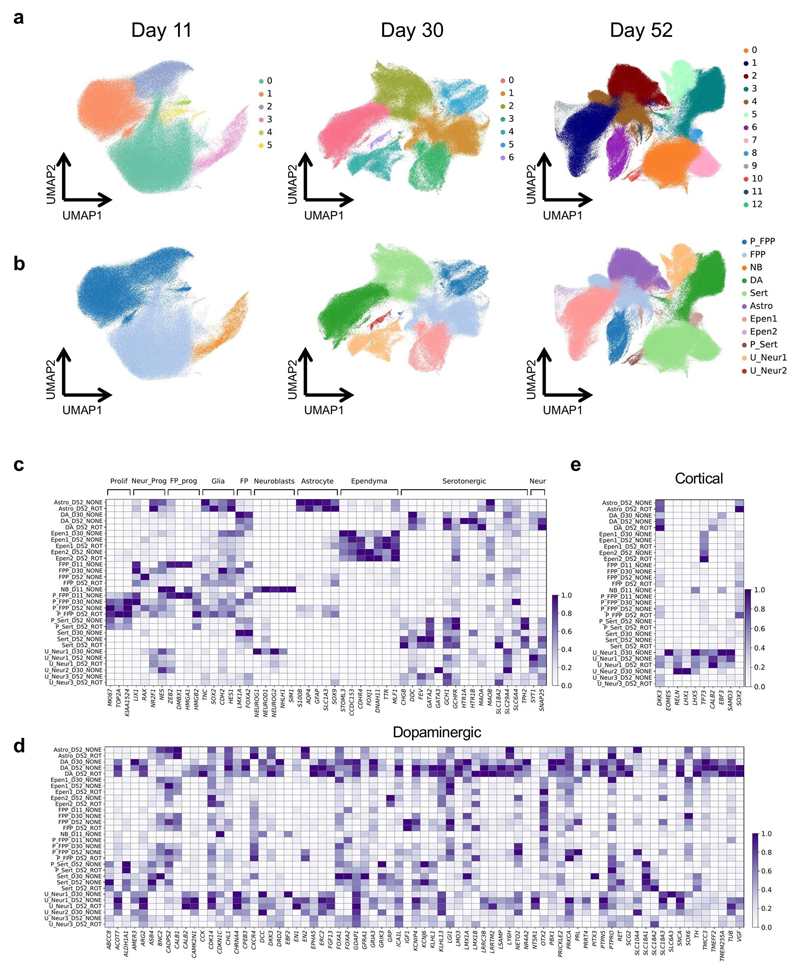
After quality control (Methods), we obtained a total of 1,027,401 cells across 17 pools15 and four conditions (Fig. 1a, Supplementary Table 1). The line of origin for each cell in a given pool was inferred from scRNA-seq read information using genotype data from the HipSci consortium (using demuxlet16). Adjustment for experimental batch effects using Harmony17 followed by Louvain clustering15 identified 26 clusters (6, 7 and 13 clusters respectively at D11, D30, D52, Extended Data Fig. 1a). These clusters were assigned putative cell type labels based on the expression profiles of literature-curated marker genes (Fig. 1b, Extended Data Fig. 1; Supplementary Methods).
We identified a total of 12 distinct cell types, including six dominant cell types that contained at least 10% of cells in one of the four conditions (Fig. 1, Extended Data Fig. 1). These included two cell type populations at day 11: proliferating and non-proliferating midbrain floorplate progenitors (both expressing LMX1A, FOXA2 and expressing MIK67, TOP2A when proliferating18). At days 30 and 52, four additional dominant cell types were identified, two of which appeared to be neuronal, and two non-neuronal (characterized by expression and lack of the pan-neuronal markers SNAP25 and SYT1, respectively). The first neuronal population was annotated as midbrain DA using a comprehensive panel of 75 literature-derived DA marker genes including TH, NR4A2, PBX1 and TMCC3 18–21 (Extended Data Fig. 1d). Moreover, we performed transcriptome-wide alignment of this cell population to existing single-cell atlases of human iPSC-derived DA18, and human fetal18 or adult human midbrain samples22, further supporting their DA identity with mapping rates to reference DA populations of 85-99% (Supplementary Methods). We annotated the second neuronal population as serotonergic-like neurons (Sert), since these cells were enriched TPH2 and GATA2 markers which are also observed in serotonergic neurons in vivo23. The two non-neuronal cell types consisted of ependymal-like cells detected at days 30 and 52 (Ependymal 124), and astrocyte-like cells detected at day 52 (Astrocyte-like25,26). We also identified a neuroblast population specific to day 11 (4% of cells) expressing pro-neuronal genes (NEUROD1, NEUROG2, NHLH1 27,28), and an additional neuronal population (expressing SNAP25 and SYT1) that expressed some midbrain markers but that could not be assigned a specific identity (Unknown neurons 1, present at day 30 and day 52 at around 7%, Extended Data Fig. 1c–e). Finally, we identified four rare cell types (<2% of cells sampled at any time point), including a second ependymal-like population (Ependymal 2), a cell population of proliferating progenitors and serotonergic-like neurons (prolif. serotonergic-like neurons), and two additional neuronal populations, which could not be annotated unambiguously (Unknown neurons 2&3, Fig. 1b, Extended Data Fig. 1c–e).
UMAP projection of cells collected across all time points, stimuli, and lines revealed broad co-clustering of cell types, but with noticeable differences between time points and stimuli (Fig. 1b–c, Supplementary Fig. 1). For example, the proportion of DA upon ROT stimulation was significantly reduced (30% reduction upon stimulation, Fisher’s exact test, P = 2.2 × 10⁻¹⁶), consistent with previous observations that dopaminergic neurons are most affected by apoptosis due to oxidative stress29–31. In line with this observation, a variance component analysis of gene expression identified treatment as the second most important driver of expression variation after cell type (Supplementary Fig. 1).
Collectively, our population-scale scRNA-seq analysis revealed a diverse repertoire of cell types, enabling the study of both cell line differentiation propensity, and the identification of genetic effects on gene expression with cell type resolution.
Intrinsic variation in neuronal differentiation efficiency between iPSC lines
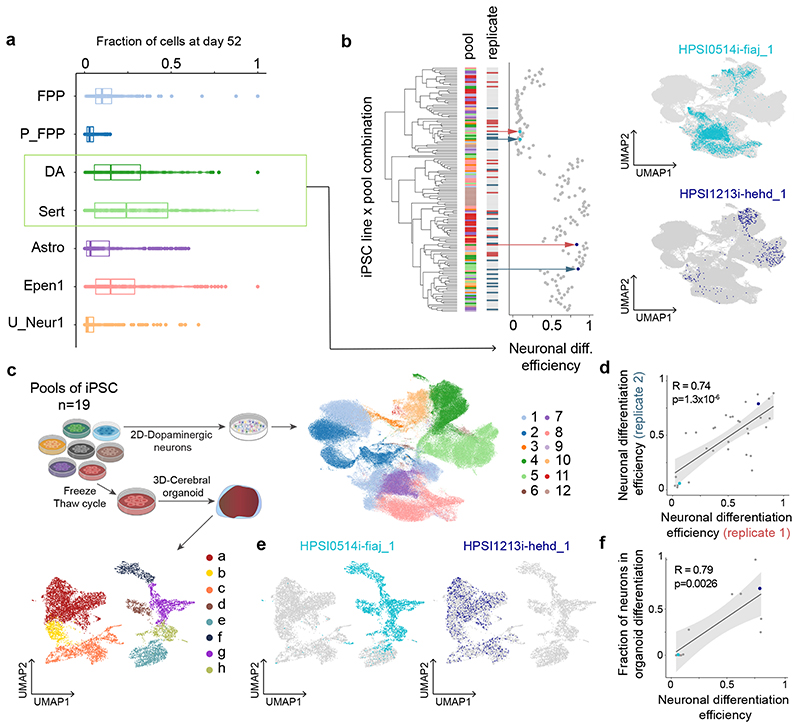
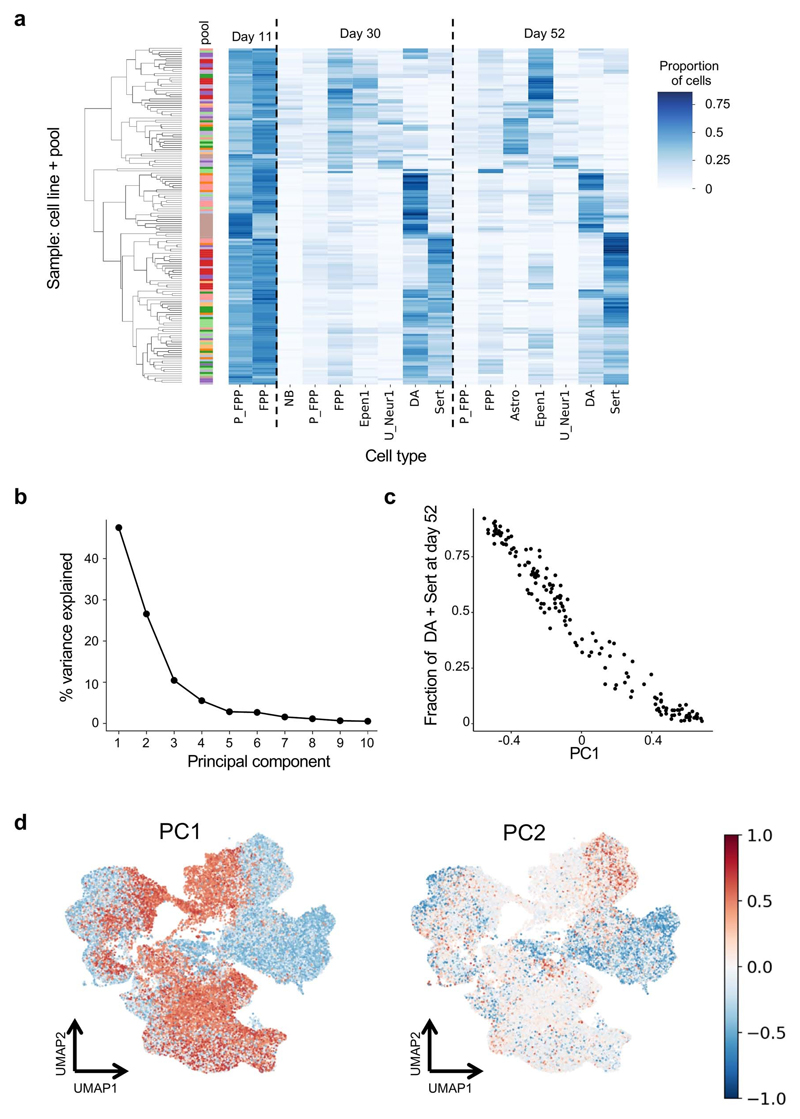
iPSC differentiation protocols often face highly variable results across cell lines, but the reason for this remains obscure, hindering efforts to select cell lines for specific applications32,33. We observed substantial variation in the proportions of cell types produced by different iPSC lines at each time point (Fig. 2a, Extended Data Fig. 2a, Supplementary Table 2). Principal component analysis of cell type fractions per line and pool identified the proportion of DA and Sert on day 52 as the largest axis of variation (PC1, 47% variance, Extended Data Fig. 2b–d). Since DA and Sert cells are derived from similar progenitor populations in vivo 34, we considered the combined proportion of these cell types on day 52 as a measure of “neuronal differentiation efficiency” for each iPSC line (Fig. 2b). Using 32 lines that were represented in two different pools, we confirmed the reproducibility of this measure of neuronal differentiation efficiency (Pearson R = 0.75; P = 2 × 10⁻⁶; Fig. 2d), and we assessed its robustness when excluding rotenone-treated cells (Supplementary Fig. 3). Neuronal differentiation efficiency was not associated with the number of lines per pool (R2 = 0.04, P = 0.46, t-test), but was positively correlated with neuronal maturation35 (Supplementary Fig. 3, Extended Data Fig. 1c). Finally, we considered data from 6 lines that were both differentiated individually and in one pool, finding that pooling neither affected neuronal differentiation efficiency (Extended Data Fig. 3b), nor led to obvious transcriptional differences (Supplementary Fig. 4).
Fig. 2. Reproducible variation in differentiation trajectories.
(a) Box plots display the proportions of each cell type at day 52 across cell lines. The sum of the proportions of DA and Sert cells at day 52 is defined as neuronal differentiation efficiency. In the box plots, the middle line is the median and the lower and upper edges of the box denote the first and third quartiles. (b) Left: hierarchical clustering of (cell line, pool) combinations by neuronal differentiation efficiency. Displayed are data from 10 pools with at least 10 scRNA-seq profiles across all time points (138 lines). First bar indicates a line’s pool of origin; second bar the replicate status. Right: UMAPs, highlighting the distributions of cells on day 52 for two selected cell lines with low (HPSI0514i-fiaj_1; seagreen) and high (HPSI1213i-hehd_1; dark blue) neuronal differentiation efficiencies. (c) Workflow for scRNA-seq analysis of iPSC-derived cerebral organoids. UMAPs summarize the resulting cell populations (1: Floor Plate Progenitors (FPP), 2: Proliferating FPP 3: Neuroblasts, 4: Dopaminergic Neurons, 5: Serotonergic-like neurons (Sert), 6: Proliferating Sert, 7: Astrocyte-like, 8: Ependymal-like (Epen) 1, 9: Epen2, 10: Unknown_Neur1, 11: Unknown_Neur2, 12: Unknown_Neur3; a: Neurons, b: Intermediate progenitors, c: Radial glial progenitors, d: Satellite cells, e: Mesenchymal cells, f: Myotube, g: PAX7+ cells, h: Wnt+ cells). (d) Scatter plot of neuronal differentiation efficiency between replicate pools (n = 32 cell lines differentiated in two different pools). Highlighted are the two cell lines from b. (e) UMAPs of the two cell lines selected in b, making non-brain and brain cell types in the organoid study. (f) Scatter plot of midbrain dopaminergic neuronal differentiation (x-axis) versus neuronal differentiation efficiency measured in organoid differentiation (y-axis), for a common subset of 12 iPSC lines. Highlighted are the two cell lines from b. In panels d and f, LOESS curves and 95% confidence intervals alongside Pearson’s R and the P value from a two-sided t-test.
We next investigated if these observations were generalizable to other neuronal differentiation approaches by differentiating a pool of 18 lines (pool 4) into cerebral organoids for 113 days36 followed by profiling using scRNA-seq (11,445 cells, Fig. 2c, Methods). We found that the proportion of neurons (Supplementary Fig. 5) produced by each line in the cerebral organoids was also correlated with neuronal differentiation efficiency as estimated from the dopaminergic differentiation (Fig. 2e,f, R = 0.79; P = 3 × 10⁻³; n = 12, t-test).
The reproducibility of differentiation outcomes in different settings and protocols suggests that variation in iPSC neuronal differentiation efficiencies arise primarily due to cell-intrinsic factors. Furthermore, the consistency of differentiation efficiency suggests that these properties extend to neuronal differentiation more generally.
An iPSC gene expression signature predicts neuronal differentiation efficiency
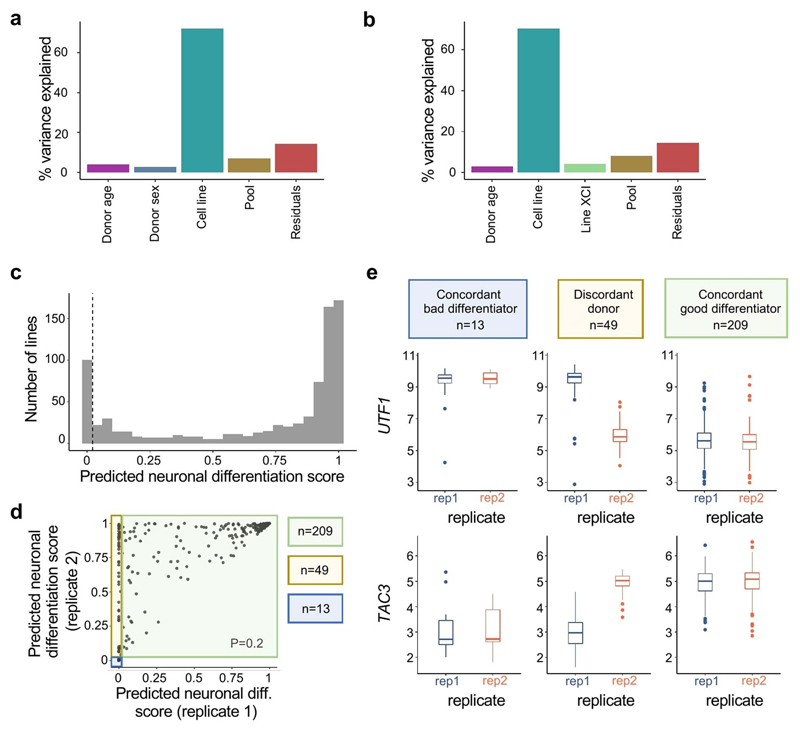
Motivated by the reproducibility of differentiation outcomes across multiple independent pools, we tested for associations between neuronal differentiation efficiency and experimental and biological factors (Supplementary Table 3). We found no or weak associations with passage number (P = 0.77; F-test), sex (P = 0.008; t-test), chromosome X activation status (P = 0.01, F-test, Supplementary Methods), or PluriTest scores37 (P = 0.01, F-test, Supplementary Methods) of the corresponding lines. Using variance component analysis we assessed the relevance of additional factors, in particular enabling comparison of line versus pool effects. This identified line effects as the dominant driver of variability in neuronal differentiation efficiency (Extended Data Fig. 4a,b), although our design does not enable discrimination of line and donor effects.
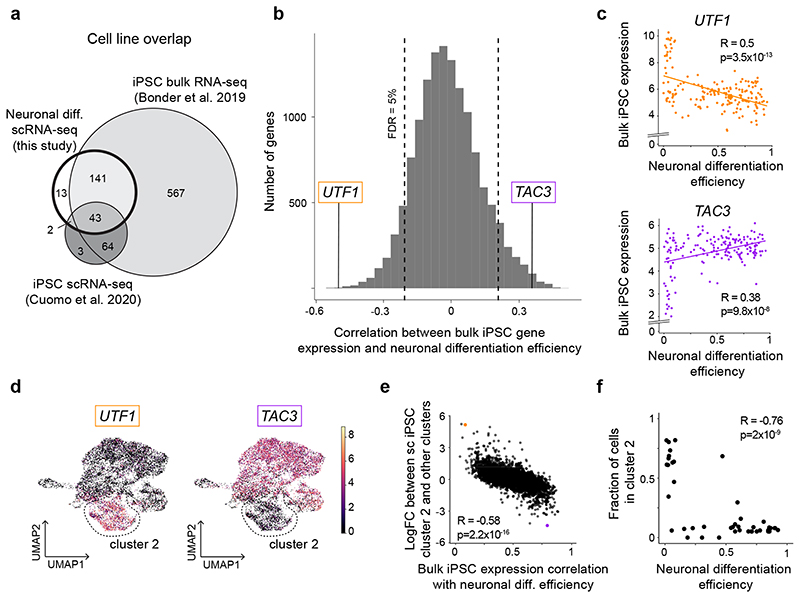
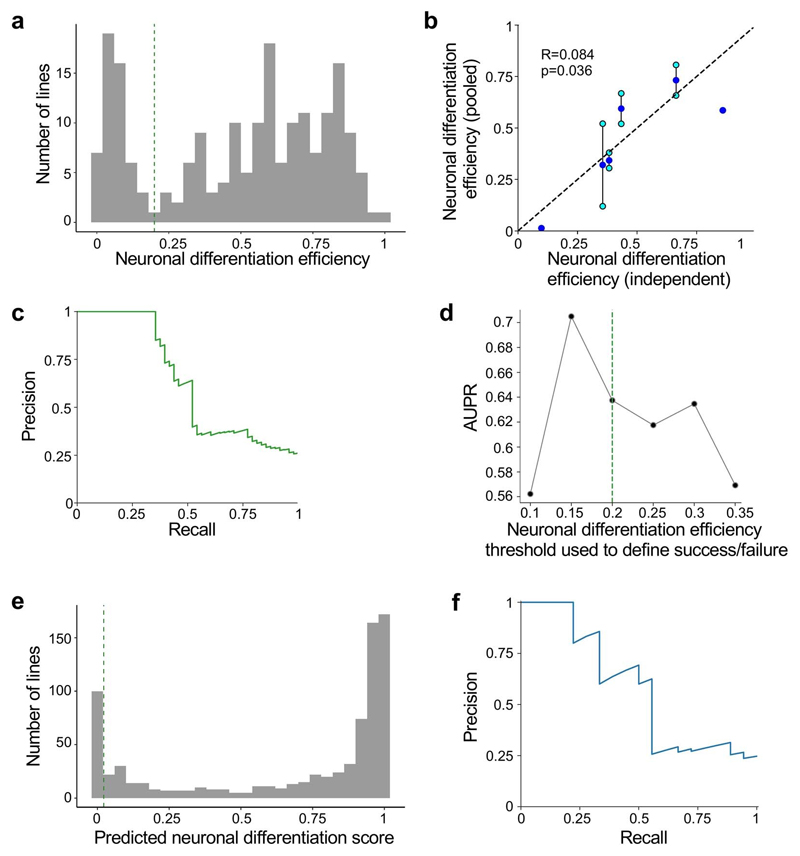
Next, we assessed whether neuronal differentiation efficiency was associated with gene expression in undifferentiated iPSCs. Using independent bulk RNA-seq data for 184 iPSC lines included in this study1,38, we identified associations between neuronal differentiation efficiency and gene expression level for 2,045 genes (983 positive and 1,062 negative associations; F-test, FDR <5%; Fig. 3b,c; Supplementary Table 4, Methods). When defining poor differentiation as a binary outcome (neuronal differentiation efficiency <0.2), iPSC gene expression could be used to train a classifier of poor differentiation (logistic regression; 100% precision at 35% recall assessed using leave-one-out cross-validation; Methods), which we validated in alternative training/test regimes and using independent hold out lines (Extended Data Fig. 4, Methods). Using this model, we obtained predicted differentiation scores for 812 HipSci lines with bulk RNA-seq data (Supplementary Table 5), finding that a substantial fraction of HipSci lines (13%) are likely to result in poor differentiation outcomes. We also tested whether the same experimental and biological factors previously associated with neuronal differentiation efficiency were replicated in this larger sample, finding consistent results (Supplementary Table 3; Methods). Finally, to assess the possibility of a genetic or other donor-specific component of neuronal differentiation efficiency, we assessed the consistency of predicted differentiation outcome for lines from the same donor, observing poor concordance (Extended Data Fig. 4b). Moreover, we found no association between germline variants and predicted neuronal differentiation efficiency when performing a genome-wide association study (all P > 5 × 10⁻⁸, n = 540, MAF <0.05; Methods), although the available sample size is insufficient to rule out weaker effects.
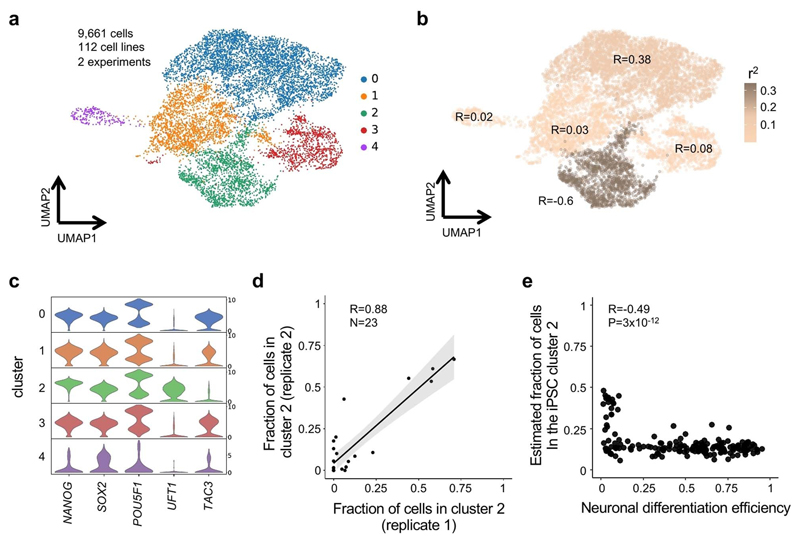
Fig. 3. A gene expression signature in iPSCs is associated with neuronal differentiation efficiency.
(a) Venn diagram indicating the overlap of cell lines included in this study and two recent iPSC studies, a bulk RNA-seq study38 and a single-cell RNA-seq study2. (b) Histogram of Pearson correlation coefficients between variation in gene expression of individual genes (from bulk RNA-seq38) and neuronal differentiation efficiency. Two representative genes with positive (TAC3) and negative (UTF1) association are highlighted. Scatter plot of neuronal differentiation efficiency (x-axis) versus bulk iPSC gene expression (y-axis) for UTF1 and TAC3. (d) UMAPs of single-cell RNA-seq profiles in iPSCs from 112 donors2. Colors denote the expression level of the two selected genes from b,c: UTF1 and TAC3. Cluster 2 is shown by the dashed lines. (e) Comparison of marker gene association results with expression markers of the cluster 2. Shown is, for each gene, a scatterplot of the Pearson correlation coefficient of association between iPSC gene expression and neuronal differentiation efficiency (x-axis, based on bulk gene expression) versus its log fold-change between cluster 2 and all other clusters (y-axis, based on scRNA-seq). The genes UTF1 and TAC3 are highlighted. (f) Scatter plot between neuronal differentiation efficiency (x-axis) and the proportion of cells assigned to cluster 2 (y-axis) across 45 cell lines that were included in both sets of experiments. Where multiple measurements were available for a given cell line, average values are shown. In panels c, e and f, the Pearson’s R and the P value from a two-sided t-test are indicated. Diff. = differentiation.
Since iPSC cultures are heterogeneous, we hypothesized that the predictive gene signatures might originate from varying proportions of iPSC subpopulations. To test this, we re-analyzed scRNA-seq data from 112 iPSC lines that were assayed previously2, 45 of which were also included in this study (Methods, Fig. 3a). We identified 5 clusters, with all but one (cluster 4) expressing high levels of core pluripotency markers (NANOG, SOX2, POU5F1, Extended Data Fig. 5c; Methods). Cluster 2 overexpressed genes associated with inefficient neuronal differentiation (e.g. UTF1), and downregulated genes associated with efficient neuronal differentiation (e.g. TAC3; Fig. 3d,e, Extended Data Fig. 5). None of the remaining clusters displayed such an enrichment (Extended Data Fig. 5b, Supplementary Table 6). To more directly assess the relevance of cluster 2 to neuronal differentiation efficiency, we tested for and confirmed an association between the fraction of cells in cluster 2 and neuronal differentiation efficiency for each cell line (Pearson R = -0.76, P = 2.05 × 10⁻⁹; Fig. 3f; Extended Data Fig. 5d). Using the known relationship between iPSC bulk RNA-seq and the proportion of cluster 2 cells, we predicted this proportion for 182 cell lines included in our differentiation experiments, confirming the negative correlation with neuronal differentiation efficiency (Pearson R = -0.49; P = 3 × 10-12, Extended Data Fig. 5e; Methods).
Finally, we analyzed an additional scRNA-seq dataset from iPSCs derived from lymphoblastoid cell lines39 (LCLs). Using our single-cell analysis workflow, we identified a cluster of cells with a concordant expression profile to cluster 2 (Methods, Supplementary Fig. 6). Taken together, these results suggest that a subpopulation of iPSCs with poor neuronal differentiation capability is consistently detected across different human iPSC banks, and that this bias can be robustly predicted using expression markers at the iPSC stage.
eQTL discovery and comparison with in vivo eQTL maps
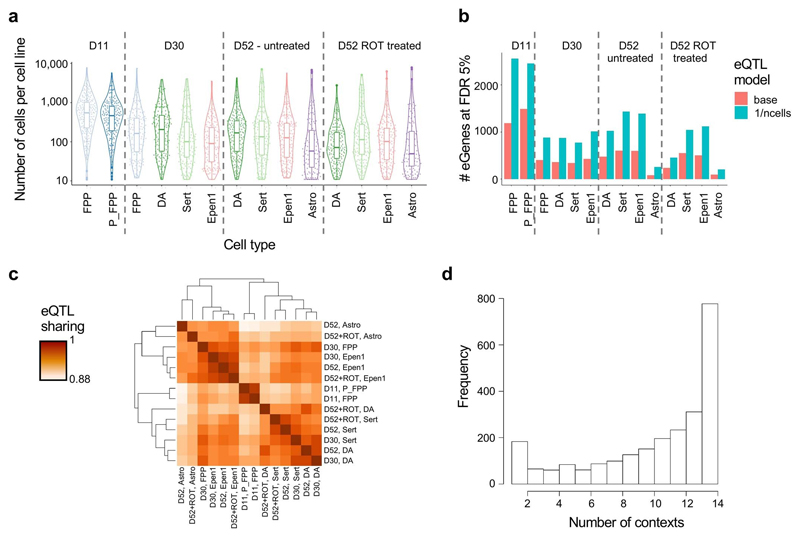
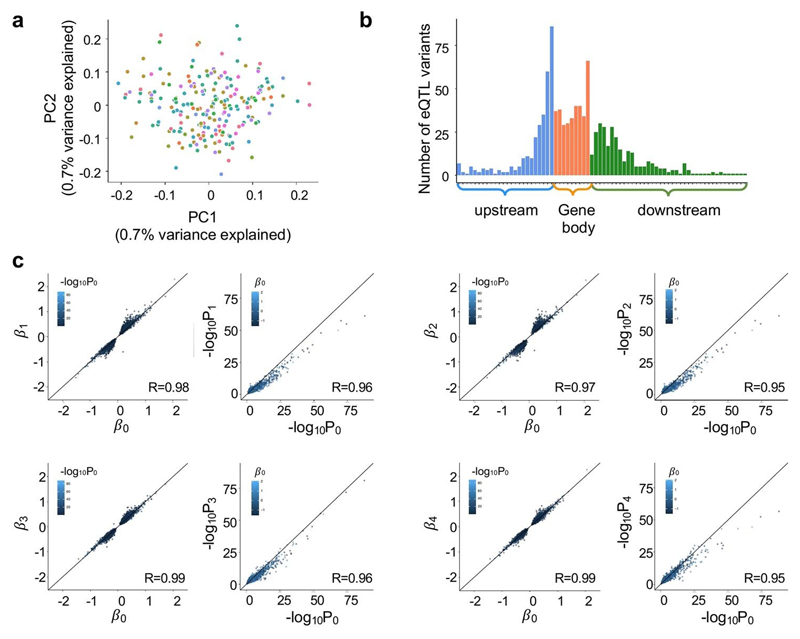
We next focused on understanding how individual-to-individual genetic variation influenced gene expression across differentiation and in response to stimulation. Specifically, we mapped cis eQTL separately for each of the 14 distinct cell populations that correspond to the profiled “cell type”-”condition” contexts of the dominant cell types. eQTL were mapped using aggregate expression levels for each donor, considering common gene-proximal variants (MAF >0.05, plus or minus 250 kb around genes; Methods). Variability in neuronal differentiation efficiency between lines resulted in substantial differences in the number of cells from each donor, generating variation in the total number of cells assayed for each context (Extended Fig. 6a), and in turn affecting accuracy of the estimates of aggregated expression. To account for this, we adapted commonly used eQTL mapping strategies2 based on linear mixed models by incorporating an additional variance component into the model (Methods). This increased the number of eQTL discoveries, resulting in 4,828 genes with at least one eQTL in at least one of the contexts (hereafter “eGene”, FDR <5%, Fig. 4a, Extended Data Fig. 6b, Supplementary Table 7), with expected enrichment of eQTL variants in the vicinity of gene promoters (Extended Data Fig. 7b).
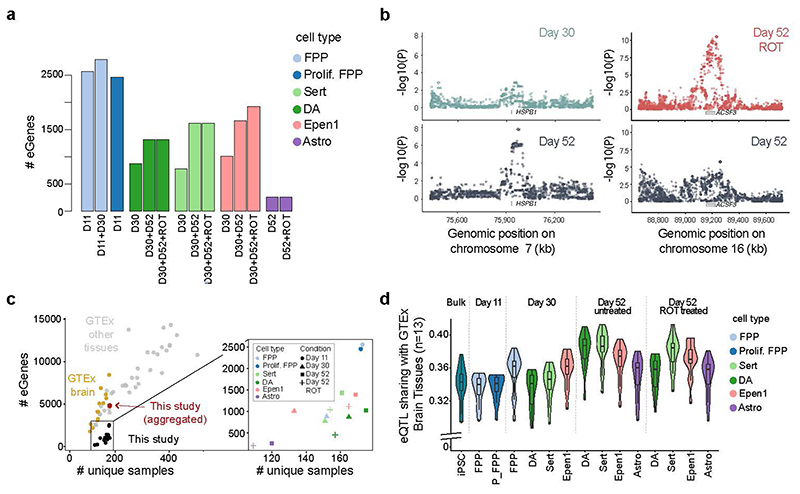
Fig. 4. Mapping of cis eQTL in 14 distinct cell contexts (“cell types”-”conditions”) for 6 dominant cell types identified across midbrain differentiation.
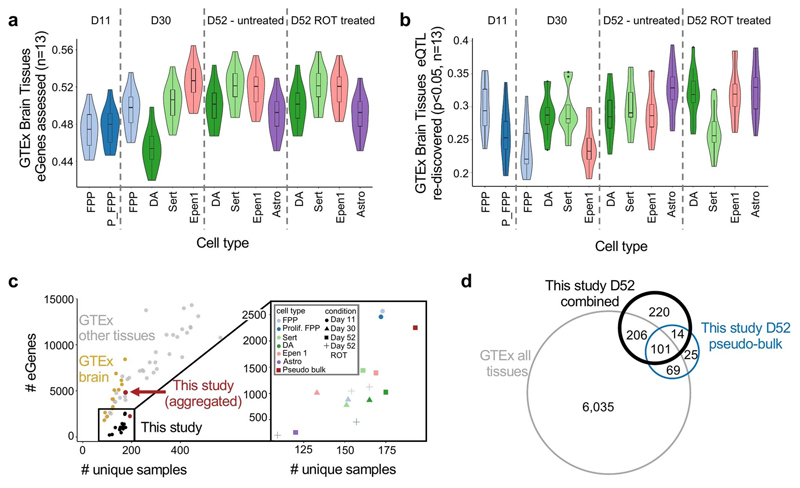
(a) Cumulative number of genes with at least one eQTL (eGenes) for each cell type and condition (D11 = day 11; D30 = day 30; D52 = day 52; ROT = Rotenone stimulation). (b) Left: day 52-specific eQTL for HSPB1 in DA (rs6465098; FDR <5%, Methods). Shown are Manhattan plots for DA at day 30 (top) and unstimulated DA at day 52 (bottom). Right: a rotenone stimulus-specific eQTL for ACSF3 in Sert (rs12597281, right). Shown are Manhattan plots for rotenone-stimulated Sert at day 52 (top) and unstimulated day 52 Sert (bottom). (c) Comparison of the number of eGenes for individual eQTL maps (FDR <5%; y-axis) as a function of the effective sample size (number of unique donors; x-axis) across studies and cell types. Left: results from overlapping eQTL results in this study with in vivo eQTL maps from GTEx, divided into brain tissues (yellow) and non-brain tissues (grey). In red, the result from this study when aggregating across all 14 eQTL maps. Right panel shows a magnified view of results from our study colored by cell type and shaped by condition. (d) Sharing of eQTL signals discovered across 14 cell contexts in this study, as well as using bulk RNA-seq in iPSCs2,38, with in vivo brain eQTL maps (from GTEx). Violin plots show the extent of eQTL sharing (Methods), with each of 13 GTEx brain eQTL maps. In the box plots, the middle line is the median and the lower and upper edges of the box denote the first and third quartiles, while the violin plots show the distribution. Astro: Astrocyte-like; DA: Dopaminergic neurons, Epen1: Ependymal-like1, FPP: Floor Plate Progenitors, P_FPP: Proliferating FPP, Sert: Serotonergic-like neurons, U_Neur1,2,3: Unknown neurons 1,2,3.
The largest number of eQTL were detected in progenitor cell populations, likely reflecting increased detection power due to the larger number of cells per line assayed (Extended Data Fig. 6a,b). Notably, the cumulative number of genes with an eQTL in each cell type increased when considering contexts further progressed along the differentiation axis, as well as upon stimulation (Fig. 4a). For example, eQTL mapping in matured DA (day 52) identified an additional set of 441 eGenes compared to these cells at day 30. One such timepoint-specific eGene was HSPB1, which encodes a heat shock protein that plays a key role in neuronal differentiation41, and for which SNP rs6465098:T>C was an eQTL only in D52 cells (Fig. 4b). Changes in HSPB1 expression have been observed in neurons after ischemia42 and associated with toxic protein accumulation in Alzheimer’s disease43,44.
Similarly, we detected 248 additional eGenes in DA and Sert neurons following rotenone treatment. For example, rs12597281:A>G is an eQTL for ACSF3 in rotenone stimulated serotonergic neurons at day 52, but not in unstimulated cells (Fig. 4b). ACSF3 encodes an acyl-CoA synthetase localized in the mitochondria and inherited mutations have been associated with a metabolic disorder, combined malonic and methylmalonic aciduria (CMAMMA), where patients exhibit a wide range of neurological symptoms including memory loss, psychiatric problems and/or cognitive decline45. We also compared eQTL across the 14 contexts at the level of individual variants (using MASHR40; Methods), finding distinct clustering of contexts consistent with the underlying lineages as well as context-specific effects (Extended Data Fig. 6c–d).
To test how our eGene discovery relates to previous studies, we compared the number of eGenes identified in this study with bulk eQTL maps from in vivo tissues from the GTEx consortium46 (Methods). Although for cell populations of individual contexts we observed fewer eQTL than detected in GTEx tissues of similar sample size, the aggregate number of eGenes identified across contexts were similar to eQTL maps from primary tissue of the same sample size (Fig. 4c, Extended Data Fig. 8c).
A key question of eQTL maps from in vitro iPSC-based models is how closely they resemble eQTL maps from primary tissues that differ in cell composition. To explore this, we tested the extent to which regulatory variants were shared between eQTL maps in three resources: 1) the current study, 2) GTEx brain tissues (n = 13 tissues), and 3) bulk RNA-seq profiles of HipSci iPSC lines2,38, as measured by genome-wide consistency of eQTL effect sizes (using MASHR40; Methods). We observed that as iPSCs were differentiated to increasingly mature neuronal cell types, the extent of eQTL sharing tended to increase (Fig. 4d), although this trend could in part be explained by increasing fractions of GTEx brain eGenes that are expressed in different condition-cell type contexts (Extended Data Fig. 8a). Interestingly, while globally iPSC-derived eQTL maps mimic in vivo GTEx Brain eQTL maps, we also identified 2,366 eQTL that could not be detected in GTEx brain tissues (q-value >0.05 in any of 13 tissues), demonstrating the ability of our approach to discover novel regulatory relationships.
Colocalization of eQTL with disease risk variants
The identified cell-type specific eQTL maps across different differentiation contexts provide an opportunity to understand human disease traits and their genetic risk factors as identified by genome-wide association studies (GWAS). To test for such colocalization events, we applied COLOC47 (Methods) to the summary statistics from 25 neurological traits, eQTL discovered in our study, as well as eQTL obtained from GTEx (Methods, Supplementary Table 8,9).
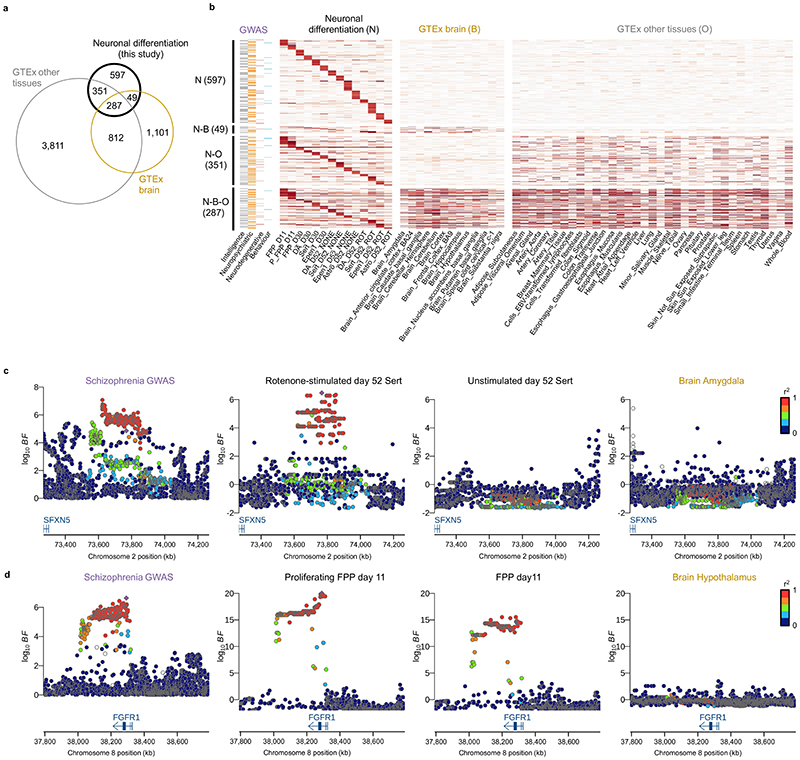
We identified 1,284 eQTL in our study with evidence of colocalization with at least one disease trait (Fig. 5a,b). Of these, 597 were found only in our data set, corresponding to an additional >10% of colocalization events of GWAS variants compared to eQTL across all GTEx tissues (5,028 across 48 tissues, Fig. 5b). Notably, the majority of these genes (98%) were expressed in GTEx tissues, but either had no eQTL (65%) or had an eQTL that did not give rise to a significant colocalization (34%, PP3 <0.5 for all GTEx brain tissues). Furthermore, when considering the relevance of different cell-type contexts for explaining these specific colocalization events, we observed that 401 (67%) of the colocalizations in our data were associated with eQTL detected in later differentiation stages (D52) or upon stimulation (D52 ROT, Supplementary Fig. 7). Finally, we considered a colocalization analysis when using aggregate pseudo-bulk results across all cell types in our data at day 52 (untreated cells), which yielded a markedly lower number of colocalizations, suggesting that the cell-type specificity of our approach is a key factor in explaining the additional colocalizations (Extended Data Fig. 8d).
Fig. 5. Colocalization analysis of eQTL with 25 neuro-related GWAS traits.
(a) Venn diagram showing the number and the overlap of colocalization events discovered using eQTL maps from this study, GTEx brain and other GTEx tissues. (b) Heatmap showing the posterior probability of colocalization (PP4 from COLOC; Methods) for eQTL that colocalized with one or more GWAS traits. N: Neuronal differentiation (this study), B: GTEx Brain, O: Other GTEx tissues. (c) Locus zoom plots around the SFXN5 gene. The schizophrenia GWAS association (left) is colocalized with the eQTL in rotenone-stimulated serotonergic-like neurons at D52 (second panel from the left). No colocalization signal was detected in unstimulated serotonergic neurons at D52 (third panel from the left) or any other brain GTEx tissues as illustrated here with GTEx brain amygdala (rightmost panel). The lead variant is indicated with a purple diamond and other points were colored according to the LD index (r2 value) with the lead variant. (d) A midbrain progenitor-specific eQTL for FGR1 associated with schizophrenia. We identified a colocalization event with this eQTL in both proliferating (second panel from the left) and non-proliferating floor plate progenitors (third panel from the left) at day 11. No colocalization was found in any other cell type profiled in this study (not shown) nor in any brain GTEx tissues (shown with GTEx brain hypothalamus, rightmost panel). Astro: Astrocyte-like; DA: Dopaminergic neurons, Epen1: Ependymal-like1, FPP: Floor Plate Progenitors, P_FPP: Proliferating FPP, Sert: Serotonergic-like neurons, U_Neur1,2,3: Unknown neurons 1,2,3.
One notable colocalization event was an eQTL for SFXN5, a mitochondrial amino-acid transporter48, which was specific to the rotenone-stimulated serotonergic neurons at day 52, and which colocalized with a schizophrenia hit (PP4 = 0.78, Fig. 5c, Supplementary Fig. 7). Exposure to rotenone is known to induce oxidative stress by inhibiting the mitochondrial respiratory chain complex49,50, suggesting that the specific genetic signal observed for the mitochondrial gene SFXN5 in serotonergic neurons might modulate environmental stress response.
Another example that colocalized with a schizophrenia GWAS variant was an eQTL for FGFR1, detected both in proliferating and -non-proliferating floor plate progenitors at D11 (PP4 = 0.93 and 0.88 respectively, Fig. 5d). Previous studies have shown that nuclear FGFR1 plays a key role in regulating neural stem cell proliferation and central nervous system development, in part by binding to the promoters of genes that control the transition from proliferation to cell differentiation51. Additionally, it was shown that altered FGFR1 signaling was linked to the progression of the cortical malformation observed in schizophrenia52.
These examples suggest that a combination of genetic and environmental factors during early development might contribute to schizophrenia pathology and illustrate how these data represent a valuable resource for understanding the molecular basis of complex neurological disease.
Discussion
Characterizing the function of human trait-associated genetic variation requires large-scale studies performed in disease-relevant cell types and states. Here, we demonstrate how human iPSCs can be efficiently profiled at scale throughout a long-term differentiation to a midbrain cell fate. We uncover a highly reproducible, cell-intrinsic neuronal differentiation bias and show how this bias can be predicted from gene expression profiling of the pluripotent cell state. This sets the stage for optimized design of future large-scale iPSC experiments, where cell lines can be rationally selected a priori without laborious testing of differentiation capacity.
Despite a modest sample size, our study identified a large number of novel disease-eQTL colocalizations compared with GTEx tissues of equivalent sample size. For example, the number of novel disease-eQTL colocalizations added by GTEx liver or cerebellar hemisphere (n = 208, 215 respectively) are 80 and 107, respectively, compared to 597 in this study. This does not necessarily indicate that the eQTL we have discovered here are disproportionately more likely to be disease-relevant, since it is challenging to account for differences in the number of comparisons: individual GTEx tissues constitute a single eQTL map, whereas our data comprises multiple maps. As a result, there is an implicit multiple testing burden that is not accounted for in existing methods for colocalization analysis (e.g. 20,201 tests in GTEx liver versus 153,350 tests across all our maps). A biological explanation for additional colocalization events is that our experiment profiled expression states that are hard to capture using post-mortem tissue, including timepoints during neuronal differentiation and following rotenone exposure. Additionally, we detected many eQTL that were specific to individual cell types, enabled by the single-cell resolution of our study. These signals, while present, are challenging to detect in bulk tissue because the relevant cell types are often rare. The relevance of cell-type specific colocalization events is also supported by our colocalization analysis using pseudo-bulk profiles at day 52, which identified a considerably lower number of colocalizations (Extended Data Fig. 8d). Taken together, these results suggest that many “missing” but disease-relevant eQTL likely remain to be discovered using single-cell sequencing of both primary tissue and in vitro cell models.
A second implication of our study is that, despite growth competition between cell lines, multiplexing experiments retain sufficient cells per donor to perform robust genetic analysis, even following extended periods in culture (Extended Data Fig. 6a, Supplementary Table 2). Nevertheless, although cell lines were pooled at similar numbers, we observed extensive variation throughout our experiment in the numbers of cells produced by different lines (Fig. 2a). Future technical improvements, such as better differentiation methods, more precise matching of growth rates of cell lines within pools, or line selection based on predicted differentiation capacity using markers in the iPSC state, may further increase the utility of multiplexed iPSC differentiation.
The “quality” of human iPSCs has previously been carefully examined using both genetic and functional genomic data37,53–56. Despite these efforts, differentiation bias among cell lines has been widely appreciated but poorly understood. The underlying mechanisms have been hypothesized to involve epigenetic factors, environmental factors such as culture conditions, changes acquired by cells over time in culture, or cell type of origin. Our work systematically surveys differentiation biases at the scale of an entire cell bank. The results cannot arise due to differences in the cell type of origin57 because all HipSci lines were skin-derived. We observed weak relationships between neuronal differentiation efficiency and other biological factors, including X chromosome inactivation status, which has been described as relevant for other lineages2. However, our results clearly demonstrate that variability in differentiation outcomes is due to cell-intrinsic factors that are maintained over multiple freeze/thaw cycles. We found that this was unlikely to be the result of donor-specific effects, as there was poor correspondence in predicted differentiation outcomes between lines derived from the same individual (Extended Data Fig. 4). Additionally, we did not detect significant effects in a genome-wide association analysis with predicted differentiation outcomes. Given these results, we suggest the two most likely candidates for future investigation are somatic genetic changes or persistent epigenetic changes that arise early in cellular reprogramming or under sub-optimal culture conditions.
Our analysis identified a negative association between neuronal differentiation efficiency at day 52 and the proportion of cells stemming from a specific subpopulation (cluster 2) of pluripotent cells that express the transcription factor UTF1 and other genes at elevated levels. Counterintuitively, the abundance of cluster 2 cells was positively correlated with the proportion of neuroblast cells on day 11. One possible explanation is that cell lines that commit earlier to a neuronal fate disproportionately lose neurons upon passaging at day 20. We speculate that culture methods that reduce iPSC heterogeneity may reduce the fraction of iPSC lines that resist efficient neuronal differentiation. We note that our findings do not explain all of the variance in neuronal differentiation capacity, and future studies will be required to better understand the biological basis of the differentiation bias observed here.
Based on molecular markers that predict differentiation bias, we estimate that 13% of iPSC lines in the HipSci resource produce very few neuronal cell types under the conditions tested. Importantly, these predictions generalize to previously untested lines. While the production of neuronal cells was intrinsically limited in these cell lines, the fact that this effect was associated with particular cell lines but not with particular donors suggests that cell banks that contain multiple lines per donor can be most effectively utilized for applications involving neural differentiation by the rational selection of cell clones. This a priori selection is enabled by gene expression profiling data from the pluripotent state that is easily obtainable and often already available.
In summary, our study demonstrates how iPSC differentiation combined with scRNA-seq unlocks population-level studies in complex, dynamic and biologically realistic cellular models. We anticipate that future uses of this model system will focus on experimental settings that are challenging or impossible with primary cells. These could include high-resolution sampling along extended differentiation times to more complex differentiation trajectories or systems, such as organoids, or involve large panels of disease relevant-stimuli and drug exposures.
Methods
Human iPSC lines
Human iPSCs were obtained from the HipSci project1 (http://www.hipsci.org, Supplementary Table 10). Briefly, primary fibroblasts from skin biopsies were collected from consented research volunteers recruited from the NIHR Cambridge BioResource. iPSC derivation was performed either using the Sendai reprogramming kit or, for two lines (HPSI0213i-nawk_55, HPSI0813i-ffdc_1), episomal plasmids. Following transfer to feeder-free culture and expansion, each line was submitted to quality control and the criteria for line selection were: (i) level of pluripotency, as determined by the PluriTest assay37; (ii) number of copy number abnormalities; and (iii) ability to differentiate into each of the three germ layers (see Kilpinen et al. 20171). All lines selected are healthy and of European descent.
Human iPSC culture
Lines were thawed onto tissue culture treated plates (Corning, 3516) coated with 10 μg/ml VitronectinXF (StemCell Technologies, 07180) using complete Essential 8 (E8) medium (Thermo Fisher, A1517001) and 10 μM Rock inhibitor (Sigma, Y0503). After thawing, cells were expanded in E8 medium for at least 2 passages using 0.5 μM EDTA pH 8.0 (Thermo Fisher, 15575-020) for cell dissociation. The last passage was always 3–4 days before plating for differentiation. Cell line synchronization was performed by adjusting the splitting ratio of each line, aiming to reach 60-80% of confluence on the pooling day.
Pooling and differentiation of midbrain dopaminergic neurons
iPSC colonies were dissociated into a single-cell suspension using Accutase (Thermo Fisher, A11105-01) and resuspended in E8 medium containing 10 μM Rock inhibitor. Cells were counted using an automated cell counter (Chemometec NC-200) and a cell suspension containing an equal amount of each iPSC line was prepared in E8 medium containing 10 μM Rock inhibitor and seeded at 2 × 10⁵ cells per cm2 on 1% Geltrex- (Thermo Fisher, A1413202) coated plates. Each pool of lines contained between 7 to 24 donors. 24 h after plating, neuronal differentiation of the pooled lines to a midbrain lineage was performed as described by13 with minor modifications: 1. SHH C25II was replaced by 100 nM SAG (Tocris, 6390) in the neuronal induction phase. 2. On day 20, the cells were passaged with Accutase containing 20 units/ml of papain (Worthington, LK00031765) and plated at 3.5 × 10⁵ cells per cm2 on 1% Geltrex-coated plates for final maturation. A link to the step-by-step protocol can be found in the URL section.
Rotenone stimulation
On day 51 of differentiation, cells were exposed for 24 h to freshly prepared 0.1 μM rotenone (Sigma, R8875, purity HPLC ≥95%) diluted in neuronal maturation medium13. The final DMSO concentration was 0.01% in all exposure conditions. Unstimulated control samples (i.e. DMSO only) were taken concurrently.
Generation of cerebral organoids
Cerebral organoids were generated according to the enCOR method as previously described36. Briefly, one pool of 18 iPSC lines was thawed and expanded for 1 passage before seeding 18,000 cells onto PLGA microfilaments prepared from Vicryl sutures. STEMdiff Cerebral Organoid kit (Stem Cell Technologies, 08570) was used for organoid culture with timing according to manufacturer’s suggestion and Matrigel embedding as previously described58. From day 35 the medium was supplemented with 2% dissolved Matrigel basement membrane (Corning, 354234), and processed for scRNA-seq after 113 days of culture.
Generation of single-cell suspensions for sequencing
On harvesting days, the cells were washed once with 1× DPBS (Thermo Fisher, 14190-144) before adding either Accutase (day 11) or Accutase containing 20 units/ml of papain (days 30 and 52). The cells were incubated at 37°C for up to 20 min (day 11) or up to 35 min (days 30 and 52) before adding DMEM:F12 (Thermo Fisher Scientific, 10565-018) supplemented with 10 μM Rock inhibitor and 33 μg/ml DNase I (Worthington, LK003170, only for days 30 and 52). The cells were dissociated using a P1000 and collected in a 15-ml tube capped with a 40 μm cell strainer. After centrifugation, the cells were resuspended in 1× DPBS containing 0.04% BSA (Sigma, A0281) and washed 3 additional times in 1× DPBS containing 0.04% BSA. Single-cell suspensions were counted using an automated cell counter (Chemometec NC-200) and concentrations adjusted to 5 × 10⁵ cells/ml.
Organoids were washed twice in 1× DPBS before adding EBSS (Worthington, LK003188) dissociation buffer containing 19 U/ml of papain, 50 μg/ml of DNase I and 22.5× of Accutase. Organoids were incubated in a shaking block (750 rpm) at 37°C for 30 min. Every 10 min, the organoids were triturated using a P1000 and BSA-coated pipette tips until large clumps were dissociated. Dissociated organoids were transferred into a new tube capped with a 40-μm cell strainer and pelleted for 4 min at 300g. After centrifugation, the cells were resuspended in EBSS containing 50 μg/ml of DNase I and 2 mg/ml ovomucoid (Worthington, LK003150). 0.5 volume of EBSS, followed by 0.5 volume of 20 mg/ml ovomucoid were added to the top of the cell suspension and the cells were mixed by flicking the tube. After centrifugation, the cells were resuspended in 1× DPBS containing 0.04% BSA. Single-cell suspensions were counted using an automated cell counter and concentrations adjusted to 5 × 10⁵ cells/ml. A link to the step by step protocol can be found in the URL section
Immunohistochemistry
Cells were fixed in 4% paraformaldehyde (Thermo Fisher Scientific, 28908) for 15 min, rinsed 3 times with 1× PBS (Sigma, D8662) and blocked with 5% normal donkey serum (NDS; AbD Serotec, C06SBZ) in PBST (1× PBS + 0.1% Triton X-100, Sigma, 93420) for 2 h at room temperature. Primary antibodies were diluted in PBST containing 1% NDS and incubated overnight at 4°C. Cells were washed 5 times with 1× PBS and incubated with secondary antibodies diluted in 1× PBS for 45 min at room temperature. Cells were washed 3 more times with 1× PBS and Hoechst (Thermo Fisher Scientific, H3569) was used to visualize cell nuclei. Image acquisition was performed using Cellomics array scan VTI (Thermo Fisher Scientific).
The following antibodies were used:
FOXA2 (Santa Cruz, sc101060 - 1/100)
LMX1A (Millipore, AB10533 - 1/500)
TH (Santa Cruz, sc-25269 - 1/200)
MAP2 (Abcam, 5392 - 1/2000)
Donkey anti-chicken AF647 (Thermo Fisher Scientific, A21449)
Donkey anti-mouse AF488 (Thermo Fisher Scientific, A11008)
Donkey anti-mouse AF555 (Thermo Fisher Scientific, A31570)
Donkey anti-rabbit AF488 (Thermo Fisher Scientific, A21206)
Donkey anti-rabbit AF555 (Thermo Fisher Scientific, A27039)
Chromium 10x Genomics library and sequencing
Single-cell suspensions were processed by the Chromium Controller (10x Genomics) using Chromium Single Cell 3’ Reagent Kit v2 (PN-120237). On average, 15,000 cells from each 10x reaction were directly loaded into one inlet of the 10x Genomics chip (Supplementary Table 1). All steps were performed according to the manufacturer’s specifications. Barcoded libraries were sequenced using HiSeq4000 (Illumina, one lane per 10x chip position) with 50 bp or 75 bp paired-end reads to an average depth of 40,000-60,000 reads per cell.
Single-cell data pre-processing
Sequencing data generated from the Chromium 10x Genomics libraries (see above) were processed using the CellRanger software (version 2.1.0) and aligned to the GRCh37/hg19 reference genome. Counts were quantified using the CellRanger “count” command, using the Ensembl 84 reference transcriptome (32,738 genes) with default parameters.
For each of 17 pooled experiments, donors (i.e. cell lines) were demultiplexed using demuxlet16, using genotypes of common (MAF >1%) exonic variants available from the HipSci bank, and a prior doublet rate of 0.05. Only cells with successful donor identification were retained for further analysis.
Further quality control steps led to the exclusion of seven 10x samples, where a 10x sample is defined as the cells sequenced from one inlet of a 10x chip. In particular: samples for pool 10 on day 11 were excluded because of an issue in the library preparation. Samples for pool 12 on day 52 were excluded on the basis of low cell viability (72.1% in the rotenone-stimulated sample), and outlying gene expression (with the first principal component in gene expression separating this sample from others at the same time point). One 10x reaction for pool 1 on day 30 was excluded on the basis of low quality, with <30% of cells successfully mapped to a cell line. Finally, cells from an outlier cell line (HPSI0913i-gedo_33) were excluded. This cell line contributed 91% of cells to pool 14 and had outlying gene expression, suggestive of a large-effect somatic mutation (Supplementary Table 1).
Normalization, dimensionality reduction, and clustering
Two sets of analyses were performed: i) analysis of each time point independently, ii) a combined analysis of a subsample of 20% of cells from all time points (used only for visualization purposes; Fig. 1).
First, independent analysis of time points allowed efficient batch effect correction (as all samples from the same time point contain similar mixtures of cell types), as well as reducing computational demands. Counts were normalized to the total number of counts per cell using the Scanpy function pp.normalize_per_cell and only genes with non-zero counts in at least 0.5% of cells were retained. The top 3,000 most variable genes were then selected, after controlling for mean-variance dependence in expression data using the Scanpy function pp.filter_genes_dispersion. The first 50 principal components (PCs) were calculated. Batch correction was applied on the level of PCs using Harmony17, with each 10x sample treated as a distinct batch. UMAP and clustering was performed using these transformed PCs. Clustering was performed using Louvain clustering with 10 nearest neighbors, identifying 26 clusters across time points (6, 7 and 13 clusters respectively at D11, D30, D52, Extended Data Fig. 1). Analysis steps besides batch correction were carried out using the Scanpy package (version 1.4)59. Cell type annotation was performed using a literature-curated set of relevant marker genes (Supplementary Methods).
For the combined analysis of all time points (for visualization purposes only), the same steps were applied, except that only a random subsample of 20% of cells were included in the analysis (following filtering for cells with donor assignment), and the definition of batches for the Harmony batch correction step. In particular, in order for each batch to have a similar mixture of cell types, each pool (rather than each 10x sample) was considered as a distinct batch.
Batch correction and clustering of the organoid dataset
The same steps described above were applied to the cerebral organoid data. This identified eight clusters that were mapped to different cell types (neurons, intermediate progenitor cells, radial glial progenitor cells, satellite cells, mesenchymal cells, myotube and Wnt and PAX7 positive cells) using 24 marker genes (Supplementary Fig. 5).
Batch correction and clustering of the two single-cell iPSC datasets
The same dimensionality reduction, batch correction and clustering steps described above were applied to the two single-cell iPSC datasets analyzed2,39 (Extended Data Fig. 5, Supplementary Fig. 6). For the Cuomo et al. dataset2, normalized (by CPM) and log-scaled data were taken from the original publication and no further normalization was performed. For the Sarkar et al. dataset39, count data were normalized and log-scaled as described above for our data (normalized to total counts per cell). Note that in both cases only QC-passing cells (as defined in the original publications) from these datasets were included. This analysis identified five and four clusters in the two different datasets, respectively.
Definition of neuronal differentiation efficiency
We computed cell type proportions for each cell line in each pool (i.e. all (cell line, pool) combinations) at each time point. Based on these proportions, (cell line, pool) combinations were clustered, based on Euclidean distance (Fig. 3b, Extended Data Fig. 3). Only (cell line, pool) combinations for which at least 10 cells were present at all time points were included in the heatmap in Extended Data Figure 3a and in the PCA analysis shown in Extended Data Figure 3b–d.
Neuronal differentiation efficiency was defined as the sum of the proportion of serotonergic-like and dopaminergic neurons present on day 52. The neuronal differentiation efficiency of iPSC lines was calculated as the average of the efficiencies across all pools in which that cell line was included.
Predictive model of neuronal differentiation efficiency from iPSC gene expression
A logistic regression classifier was trained to predict midbrain neuron differentiation failure (neuronal differentiation efficiency <0.2, from above definition) of iPSC lines from their gene expression at the iPSC stage (using independent bulk RNA-seq38). For cell lines that were differentiated multiple times, average values of neuronal differentiation efficiency across replicate experiments were used. Gene expression data were available from independent bulk. The feature set was all expressed genes (i.e. genes with mean log2(TPM+1) >2, n = 13,475) and the model was trained using the scikit-learn (v0.21.3) Python package (sklearn.linear_model.LogisticRegression). L1 regularization was used, with default parameter settings (inverse regulation strength=1.0). Precision-recall was evaluated using leave-one-out cross validation. We also considered the same model trained on the first half of the dataset (pools 1-8) and assessed its performance on the second half of the dataset (pools 9-17), which were generated sequentially over the course of the study (Extended Data Fig. 3e). This approach yielded similar results.
When using the trained model for making predictions, we used the predicted score that corresponds to recall = 35%, precision = 100% (Extended Data Fig. 3c,d). When predicted scores for two lines from the same donor were present, we classified donors into concordant good differentiators when both lines had positive differentiation scores (>0.02231; n = 209), and concordant when they both were predicted to be bad differentiators (<0.02231; n = 13). Finally, “discordant” donors were donors for which one line was predicted to be a bad differentiator, and the other was not (n = 49). Bulk RNA-seq expression of UTF1 and TAC3 for these lines was consistent with these predictions (Extended Data Fig. 4).
Finally, we considered data from two additional pools (pools 20 & 21), which were not considered in the main analysis. These pools include data from 16 lines in total, 11 of which were not contained in any other pool. We applied the predictor trained on the main dataset to obtain predicted scores of neuronal differentiation capacity for these lines and compared the predicted scores to the observed neuronal differentiation efficiency. For 10 out of 11 lines, the predicted differentiation score indicated potent differentiation (score >0.02231), and all but 1 (10/11) demonstrated positive neuronal differentiation (neuronal differentiation efficiency >0.2). One line was predicted to be a poor differentiator (score <0.02231) and indeed performed poorly (neuronal differentiation efficiency <0.2). Overall, this corresponds to 100% precision at 50% recall, which is within expected ranges based on the chosen thresholds.
Differential expression and gene set enrichment analysis
Differentiation expression analysis between each cluster and the others in the single-cell iPSC datasets was performed using scanpy’s function “tl.rank_genes_groups”, grouping by each cluster at a time59. Multiple testing correction was performed using the approach of Benjamini-Hochberg with an FDR threshold of 5% (Supplementary Table 6). We used gprofiler74 (https://biit.cs.ut.ee/gprofiler/gost) to perform biological process enrichment analysis using all upregulated genes with a log fold change greater or equal to 1 as an input. The top 20 hits are presented in Supplementary Table 11.
cis eQTL mapping
For cis eQTL mapping, we followed Cuomo et al.2, and adopted a strategy similar to approaches commonly applied in conventional bulk eQTL analyses1. We considered common variants (minor allele frequency (MAF) >5%) within a cis-region spanning 250 kb up- and downstream of the gene body for cis QTL analysis. Association tests were performed using a linear mixed model (LMM), adapting the approach in2. Specifically, We considered an additional random effect term to account for varying numbers of cells per donor. Briefly, for each donor we introduced a variance term 1/n, accounting for the varying numbers of cells used to estimate mean expression level for each donor. All models were fitted using LIMIX71,72, using likelihood ratio tests to assess significance. To adjust for experimental batch effects across samples, we included the first 15 principal components calculated on the expression values in the model as fixed effect covariates. To adjust for multiple testing, we employed an approximate permutation scheme, analogous to the approach proposed in75. Briefly, for each gene, we generated 1,000 permutations of the genotypes while retaining the relationship between covariates, random effect terms, and expression values. We then adjusted for multiple testing using this empirical null distribution. To control for multiple testing across genes, we applied the Storey’s Q value procedure75,76. Genes with significant eQTL were reported at FDR <5%.
We performed eQTL mapping as described above for 14 contexts (cell type, time point and stimulus status), considering 6 major cell types (top 4 cell type per condition with at least 20% cells); Supplementary Table 7. Gene expression for each donor was calculated as the mean of log-transformed counts-per-cell-normalized expression across cells (including cells from different pools, where applicable). A line was considered in the eQTL analysis of given context (cell type, condition) if at least 10 cells were captured from the corresponding context. Genes were considered for eQTL analysis if expressed (UMI count >0) in at least 1% of cells across all lines (10,993 to 12,789 genes tested across contexts). Lead associations per eGene and context are reported in Supplementary Table 7. The robustness of this eQTL analysis approach was confirmed by comparison to alternative eQTL mapping strategies (Supplementary Methods; Extended Data Fig. 7).
Sharing of eQTL signal between cell types and with GTEx brain tissues
To quantify the extent of sharing between eQTL maps, we used the MASHR software40. For all MASHR analyses, we considered lead eQTL SNPs per gene and context. Four random SNPs per gene were selected as a background for the calculation of the data-driven covariance; we also included a canonical covariance matrix as recommended40. Next, we extracted the posterior beta values, using MASHR, and estimated pairwise sharing between conditions/tissues. Effects were defined as shared if the effect direction and effect size were within a factor 0.5 of each other, when considering SNP-gene pairs passing a significance threshold (local false sign rate, lfsr <0.05) in at least one of the two conditions considered.
We applied this workflow to perform the following three comparisons:
eQTL maps from our cell types and conditions (n = 14 eQTL maps): 9,641 genes assessed (Extended Data Fig. 6c).
eQTL maps from all cell types and conditions (n = 14 eQTL maps), as well as bulk RNA-seq derived eQTL in iPSCs, as well as all of the GTEx brain tissues (n = 13 eQTL maps): 7,975 genes assessed (Fig. 4d, Supplementary Fig. 7b).
all of our cell types and conditions (n = 14 eQTL maps), as well as all of the GTEx tissues (n = 49 eQTL maps): 7,586 genes assessed (Supplementary Fig. 7a).
As an alternative strategy to assess the sharing of eQTL, we assessed the fraction of GTEx brain eQTL that are recapitulated in our eQTL maps. Briefly, we considered a nominal definitions of eQTL replication, based on nominal significance of lead eQTL variants discovered in each of the 13 GTEx brain tissue eQTL maps, in each of our 14 eQTL maps (Extended Data Fig. 8a, b). Notably, this comparison allows for teasing apart lack of replication versus lack of assessment of an eGene because of difference in expression. Among eGenes identified at FDR <5% in each of the GTEx maps, approximately 50% were tested in the eQTL contexts in this study. For the shared fraction of genes assessed, 20-40% eQTL were nominally significant (P < 0.05) across the 14 maps. Cumulatively, this means that 10-20% of the eQTL from a GTEx brain map could be re-discovered in our single-cell maps.
Colocalization analysis between neuro-related GWAS traits
We collected summary statistics for 25 GWAS traits that were either neurodegenerative/ neuropsychiatric diseases or related to behavior and intelligence, and that have at least 5 genome-wide significant loci (P = 5.0 × 10⁻⁸); Supplementary Table 8. We then defined GWAS subthreshold loci as 1-Mb-wide genomic windows with at least one SNP at P < 10-6, centering the window around the index variant (variant with minimum P value in the window). If there were multiple subthreshold loci within a 1-Mb window, we merged them and took the index variant with the minimum P value overall. Statistical colocalization analysis between 14 eQTL maps from our study and 48 eQTL maps from GTEx (v7) and those GWAS loci was performed using the COLOC package47, implemented in R with default hyperparameter setting. We tested any gene whose transcription start site (TSS) and eQTL lead variant (minimum P value SNP for the gene) were both within the 1Mb window centered at each GWAS index variant. We tested all SNPs located between the GWAS index variant and the top eQTL (within the window) variant with 500-kb extensions either side. We matched SNPs between eQTL and GWAS based on chromosomal position and reference/alternative alleles. Genes with the posterior probability of colocalization (PP4) greater than 0.5 were defined as GWAS colocalization.
Extended Data
Ext Fig 1.
Ext Fig 2.
Ext Fig 3.
Ext Fig 4.
Ext Fig 5.
Ext Fig 6.
Ext Fig 7.
Ext Fig 8.
Supplementary Material
Acknowledgements
All data for this study were generated under Open targets project OTAR039. J.J. was supported by a postdoctoral fellowship from OpenTargets, A.S.E.C. was supported by a PhD fellowship from the EMBL International PhD Programme (EIPP) and D.D.S. was supported by a postdoctoral fellowship from EMBL Interdisciplinary Postdoc (EIPOD) programme. M.A.L. was funded by the Medical Research Council (MC_UP_1201/9). N.K. and D.J.G. were funded by the Wellcome Trust grant WT206194. F.T.M. is a New York Stem Cell Foundation - Robertson Investigator and is supported by The New York Stem Cell Foundation [NYSCF-R-156], the Wellcome Trust and Royal Society [211221/Z/18/Z], and the Chan Zuckerberg Initiative [191942]. J.C.M. acknowledges core support from EMBL and Cancer Research UK. Research in the Stegle laboratory is supported by the BMBF, the Volkswagen Foundation and the EU (ERC project DECODE). We thank the MRC Metabolic Diseases Unit Imaging Core Facility for assistance with imaging. We thank the staff in the Cellular Generation and Phenotyping and Sequencing core facilities at the Wellcome Sanger Institute and the imaging core facility of the Wellcome-MRC Institute of Metabolic Science. We thank Helena Kilpinen and Pau Puigdevall Costa for the very useful discussions regarding data analysis.
Footnotes
Author contributions
The main analyses and data preparations were performed by J.J., D.D.S. and A.S.E.C. N.K. performed the colocalization analysis. Cell culture experiments were performed by J.J., J.H., J.S., D.P. and M.A. and M.A.L. performed the experimental work on the organoid dataset. J.J. and M.P. oversaw the cell culture experiments. E.M. and M.G. processed GWAS summary statistics for colocalization analysis. J.J., D.D.S., A.S.E.C., J.C.M., F.T.M., O.S. and D.J.G. wrote the manuscript; N.K. assisted in editing the manuscript; J.J., F.T.M., O.S. and D.J.G. conceived and oversaw the study.
Conflicts of interest
D.J.G. and E.M. were employees of Genomics PLC and D.D.S. was an employee of GSK at the time the manuscript was submitted.
URLs
HipSci: http://www.hipsci.org.
GTEx: https://www.gtexportal.org/home/datasets.
Ensembl: https://grch37.ensembl.org/.
MASHR eQTL analysis pipeline: https://stephenslab.github.io/mashr/articles/eQTL_outline.html.
Step by step experimental protocol:
https://www.protocols.io/view/generation-of-ipsc-derived-dopaminergic-neurons-bjpgkmjw Generation of midbrain dopaminergic neurons
https://www.protocols.io/view/generation-of-ipsc-derived-dopaminergic-neurons-bjpgkmjw
https://www.protocols.io/view/dissociation-of-neuronal-culture-to-single-cells-f-bh32j8qeGeneration of single cell suspension for sequencing
https://www.protocols.io/view/dissociation-of-neuronal-culture-to-single-cells-f-bh32j8qe
Data availability
Managed access data from single-cell RNA sequencing are accessible in the European Genome-phenome Archive (EGA, https://www.dev.ebi.ac.uk/ega/) under the study number EGAS00001002885 (dataset: EGAD00001006157).
Open access single-cell RNA sequencing data are available in the European Nucleotide Archive (ENA) under the study ERP121676 (https://www.ebi.ac.uk/ena/browser/view/PRJEB38269).
Processed single-cell count data and eQTL and colocalization summary statistics are available from Zenodo: https://zenodo.org/record/4333872.
The two iPSC single-cell datasets are available from Zenodo (https://zenodo.org/record/3625024) and GEO (GSE118723: https://www.ncbi.nlm.nih.gov/geo/query/acc.cgi?acc=GSE118723) for the datasets described in Cuomo et al., 2020 and Sarkar et al., 2019 respectively.
iPSC bulk RNA-seq data from Bonder et al., 2021 are available on EGA (study ID: EGAS00001000593: https://www.ebi.ac.uk/ega/studies/EGAS00001000593) and ENA (ERP007111: https://www.ebi.ac.uk/ena/browser/view/PRJEB7388).
Chip genotypes for HipSci lines were available from EGA (EGAS00001000866: https://www.ebi.ac.uk/ega/studies/EGAS00001000866) and NCBI (PRJEB11750: https://www.ncbi.nlm.nih.gov/bioproject/?term=PRJEB11750).
Code availability
All scripts are available in the following github repository: https://github.com/single-cell-genetics/singlecell_neuroseq_paper/.
Stand-alone predictor for neuronal differentiation capacity:
The eQTL mapping pipeline is available here: https://github.com/single-cell-genetics/limix_qtl/.
References
- 1.Kilpinen H, et al. Common genetic variation drives molecular heterogeneity in human iPSCs. Nature. 2017;546:370–375. doi: 10.1038/nature22403. [DOI] [PMC free article] [PubMed] [Google Scholar]
- 2.Cuomo ASE, et al. Single-cell RNA-sequencing of differentiating iPS cells reveals dynamic genetic effects on gene expression. Nat Commun. 2020;11:810. doi: 10.1038/s41467-020-14457-z. [DOI] [PMC free article] [PubMed] [Google Scholar]
- 3.Strober BJ, et al. Dynamic genetic regulation of gene expression during cellular differentiation. Science. 2019;364:1287–1290. doi: 10.1126/science.aaw0040. [DOI] [PMC free article] [PubMed] [Google Scholar]
- 4.Schwartzentruber J, et al. Molecular and functional variation in iPSC-derived sensory neurons. Nat Genet. 2018;50:54–61. doi: 10.1038/s41588-017-0005-8. [DOI] [PMC free article] [PubMed] [Google Scholar]
- 5.Alasoo K, et al. Shared genetic effects on chromatin and gene expression indicate a role for enhancer priming in immune response. Nat Genet. 2018;50:424–431. doi: 10.1038/s41588-018-0046-7. [DOI] [PMC free article] [PubMed] [Google Scholar]
- 6.D’Antonio-Chronowska A, D’Antonio M, Frazer K. In vitro Differentiation of Human iPSC-derived Retinal Pigment Epithelium Cells (iPSC-RPE) BIO-PROTOCOL. 2019;9 doi: 10.21769/BioProtoc.3469. [DOI] [PMC free article] [PubMed] [Google Scholar]
- 7.Banovich NE, et al. Impact of regulatory variation across human iPSCs and differentiated cells. Genome Res. 2018;28:122–131. doi: 10.1101/gr.224436.117. [DOI] [PMC free article] [PubMed] [Google Scholar]
- 8.Volpato V, et al. Reproducibility of Molecular Phenotypes after Long-Term Differentiation to Human iPSC-Derived Neurons: A Multi-Site Omics Study. Stem Cell Reports. 2018;11:897–911. doi: 10.1016/j.stemcr.2018.08.013. [DOI] [PMC free article] [PubMed] [Google Scholar]
- 9.Nguyen QH, et al. Single-cell RNA-seq of human induced pluripotent stem cells reveals cellular heterogeneity and cell state transitions between subpopulations. Genome Res. 2018;28:1053–1066. doi: 10.1101/gr.223925.117. [DOI] [PMC free article] [PubMed] [Google Scholar]
- 10.Mitchell JM, et al. Mapping genetic effects on cellular phenotypes with ‘cell villages’. bioRxiv. 2020 [Google Scholar]
- 11.Osborn T, Hallett PJ. Seq-ing Markers of Midbrain Dopamine Neurons. Cell stem cell. 2017;20:11–12. doi: 10.1016/j.stem.2016.12.014. [DOI] [PubMed] [Google Scholar]
- 12.Stoddard-Bennett T, Pera RR. Stem cell therapy for Parkinson’s disease: safety and modeling. Neural Regeneration Res. 2020;15:36–40. doi: 10.4103/1673-5374.264446. [DOI] [PMC free article] [PubMed] [Google Scholar]
- 13.Kriks S, et al. Dopamine neurons derived from human ES cells efficiently engraft in animal models of Parkinson’s disease. Nature. 2011;480:547–551. doi: 10.1038/nature10648. [DOI] [PMC free article] [PubMed] [Google Scholar]
- 14.Xiong N, et al. Mitochondrial complex I inhibitor rotenone-induced toxicity and its potential mechanisms in Parkinson’s disease models. Crit Rev Toxicol. 2012;42:613–632. doi: 10.3109/10408444.2012.680431. [DOI] [PubMed] [Google Scholar]
- 15.Blondel VD, Guillaume J-L, Lambiotte R, Lefebvre E. Fast unfolding of communities in large networks. Journal of Statistical Mechanics: Theory and Experiment. 2008;2008:P10008 [Google Scholar]
- 16.Kang HM, et al. Multiplexed droplet single-cell RNA-sequencing using natural genetic variation. Nat Biotechnol. 2018;36:89–94. doi: 10.1038/nbt.4042. [DOI] [PMC free article] [PubMed] [Google Scholar]
- 17.Korsunsky I, et al. Fast, sensitive and accurate integration of single-cell data with Harmony. Nat Methods. 2019;16:1289–1296. doi: 10.1038/s41592-019-0619-0. [DOI] [PMC free article] [PubMed] [Google Scholar]
- 18.La Manno G, et al. Molecular Diversity of Midbrain Development in Mouse, Human, and Stem Cells. Cell. 2016;167:566–580.:e19. doi: 10.1016/j.cell.2016.09.027. [DOI] [PMC free article] [PubMed] [Google Scholar]
- 19.Park C-H, et al. Acquisition of in vitro and in vivo functionality of Nurr1-induced dopamine neurons. FASEB J. 2006;20:2553–2555. doi: 10.1096/fj.06-6159fje. [DOI] [PubMed] [Google Scholar]
- 20.Ramonet D, et al. PARK9-associated ATP13A2 localizes to intracellular acidic vesicles and regulates cation homeostasis and neuronal integrity. Hum Mol Genet. 2012;21:1725–1743. doi: 10.1093/hmg/ddr606. [DOI] [PMC free article] [PubMed] [Google Scholar]
- 21.Arenas E, Denham M, Villaescusa JC. How to make a midbrain dopaminergic neuron. Development. 2015;142:1918–1936. doi: 10.1242/dev.097394. [DOI] [PubMed] [Google Scholar]
- 22.Welch JD, et al. Single-Cell Multi-omic Integration Compares and Contrasts Features of Brain Cell Identity. Cell. 2019;177:1873–1887.:e17. doi: 10.1016/j.cell.2019.05.006. [DOI] [PMC free article] [PubMed] [Google Scholar]
- 23.Cummings KJ, Hodges MR. The serotonergic system and the control of breathing during development. Respir Physiol Neurobiol. 2019;270:103255. doi: 10.1016/j.resp.2019.103255. [DOI] [PMC free article] [PubMed] [Google Scholar]
- 24.Campbell JN, et al. A molecular census of arcuate hypothalamus and median eminence cell types. Nat Neurosci. 2017;20:484–496. doi: 10.1038/nn.4495. [DOI] [PMC free article] [PubMed] [Google Scholar]
- 25.Sloan SA, et al. Human Astrocyte Maturation Captured in 3D Cerebral Cortical Spheroids Derived from Pluripotent Stem Cells. Neuron. 2017;95:779–790.:e6. doi: 10.1016/j.neuron.2017.07.035. [DOI] [PMC free article] [PubMed] [Google Scholar]
- 26.Zhang Y, et al. Purification and Characterization of Progenitor and Mature Human Astrocytes Reveals Transcriptional and Functional Differences with Mouse. Neuron. 2016;89:37–53. doi: 10.1016/j.neuron.2015.11.013. [DOI] [PMC free article] [PubMed] [Google Scholar]
- 27.Bertrand N, Castro DS, Guillemot F. Proneural genes and the specification of neural cell types. Nat Rev Neurosci. 2002;3:517–530. doi: 10.1038/nrn874. [DOI] [PubMed] [Google Scholar]
- 28.Lacomme M, Liaubet L, Pituello F, Bel-Vialar S. NEUROG2 drives cell cycle exit of neuronal precursors by specifically repressing a subset of cyclins acting at the G1 and S phases of the cell cycle. Mol Cell Biol. 2012;32:2596–2607. doi: 10.1128/MCB.06745-11. [DOI] [PMC free article] [PubMed] [Google Scholar]
- 29.Sherer TB, et al. Mechanism of toxicity in rotenone models of Parkinson’s disease. J Neurosci. 2003;23:10756–10764. doi: 10.1523/JNEUROSCI.23-34-10756.2003. [DOI] [PMC free article] [PubMed] [Google Scholar]
- 30.Knönagel H, Karmann U. Autologous blood transfusions in interventions of the pelvis using the cell saver. Helv Chir Acta. 1992;59:485–488. [PubMed] [Google Scholar]
- 31.Cannon JR, et al. A highly reproducible rotenone model of Parkinson’s disease. Neurobiol Dis. 2009;34:279–290. doi: 10.1016/j.nbd.2009.01.016. [DOI] [PMC free article] [PubMed] [Google Scholar]
- 32.D’Antonio-Chronowska A, et al. Association of Human iPSC Gene Signatures and X Chromosome Dosage with Two Distinct Cardiac Differentiation Trajectories. Stem Cell Reports. 2019;13:924–938. doi: 10.1016/j.stemcr.2019.09.011. [DOI] [PMC free article] [PubMed] [Google Scholar]
- 33.Volpato V, et al. Reproducibility of Molecular Phenotypes after Long-Term Differentiation to Human iPSC-Derived Neurons: A Multi-Site Omics Study. Stem Cell Reports. 2018;11:897–911. doi: 10.1016/j.stemcr.2018.08.013. [DOI] [PMC free article] [PubMed] [Google Scholar]
- 34.Ye W, Shimamura K, Rubenstein JL, Hynes MA, Rosenthal A. FGF and Shh signals control dopaminergic and serotonergic cell fate in the anterior neural plate. Cell. 1998;93:755–766. doi: 10.1016/s0092-8674(00)81437-3. [DOI] [PubMed] [Google Scholar]
- 35.He Z, Yu Q. Identification and characterization of functional modules reflecting transcriptome transition during human neuron maturation. BMC Genomics. 2018;19:262. doi: 10.1186/s12864-018-4649-2. [DOI] [PMC free article] [PubMed] [Google Scholar]
- 36.Lancaster MA, et al. Guided self-organization and cortical plate formation in human brain organoids. Nat Biotechnol. 2017;35:659–666. doi: 10.1038/nbt.3906. [DOI] [PMC free article] [PubMed] [Google Scholar]
- 37.Müller F-J, et al. A bioinformatic assay for pluripotency in human cells. Nat Methods. 2011;8:315–317. doi: 10.1038/nmeth.1580. [DOI] [PMC free article] [PubMed] [Google Scholar]
- 38.Bonder MJ, et al. Systematic assessment of regulatory effects of human disease variants in pluripotent cells. bioRxiv. 2019 [Google Scholar]
- 39.Sarkar AK, et al. Discovery and characterization of variance QTLs in human induced pluripotent stem cells. PLoS Genet. 2019;15:e1008045. doi: 10.1371/journal.pgen.1008045. [DOI] [PMC free article] [PubMed] [Google Scholar]
- 40.Urbut SM, Wang G, Carbonetto P, Stephens M. Flexible statistical methods for estimating and testing effects in genomic studies with multiple conditions. Nat Genet. 2019;51:187–195. doi: 10.1038/s41588-018-0268-8. [DOI] [PMC free article] [PubMed] [Google Scholar]
- 41.Miller DJ, Fort PE. Heat Shock Proteins Regulatory Role in Neurodevelopment. Front Neurosci. 2018;12:821. doi: 10.3389/fnins.2018.00821. [DOI] [PMC free article] [PubMed] [Google Scholar]
- 42.Bartelt-Kirbach B, et al. HspB5/αB-crystallin increases dendritic complexity and protects the dendritic arbor during heat shock in cultured rat hippocampal neurons. Cell Mol Life Sci. 2016;73:3761–3775. doi: 10.1007/s00018-016-2219-9. [DOI] [PMC free article] [PubMed] [Google Scholar]
- 43.Shimura H, Miura-Shimura Y, Kosik KS. Binding of tau to heat shock protein 27 leads to decreased concentration of hyperphosphorylated tau and enhanced cell survival. J Biol Chem. 2004;279:17957–17962. doi: 10.1074/jbc.M400351200. [DOI] [PubMed] [Google Scholar]
- 44.Wilhelmus MMM, et al. Small heat shock proteins inhibit amyloid-beta protein aggregation and cerebrovascular amyloid-beta protein toxicity. Brain Res. 2006;1089:67–78. doi: 10.1016/j.brainres.2006.03.058. [DOI] [PubMed] [Google Scholar]
- 45.Tucci S. Brain metabolism and neurological symptoms in combined malonic and methylmalonic aciduria. Orphanet J Rare Dis. 2020;15:27. doi: 10.1186/s13023-020-1299-7. [DOI] [PMC free article] [PubMed] [Google Scholar]
- 46.GTEx Consortium et al. Genetic effects on gene expression across human tissues. Nature. 2017;550:204–213. doi: 10.1038/nature24277. [DOI] [PMC free article] [PubMed] [Google Scholar]
- 47.Giambartolomei C, et al. Bayesian test for colocalisation between pairs of genetic association studies using summary statistics. PLoS Genet. 2014;10:e1004383. doi: 10.1371/journal.pgen.1004383. [DOI] [PMC free article] [PubMed] [Google Scholar]
- 48.Kory N, et al. SFXN1 is a mitochondrial serine transporter required for one-carbon metabolism. Science. 2018;362 doi: 10.1126/science.aat9528. [DOI] [PMC free article] [PubMed] [Google Scholar]
- 49.Palmer G, Horgan DJ, Tisdale H, Singer TP, Beinert H. Studies on the respiratory chain-linked reduced nicotinamide adenine dinucleotide dehydrogenase. XIV. Location of the sites of inhibition of rotenone, barbiturates, and piericidin by means of electron paramagnetic resonance spectroscopy. J Biol Chem. 1968;243:844–847. [PubMed] [Google Scholar]
- 50.Betarbet R, et al. Chronic systemic pesticide exposure reproduces features of Parkinson’s disease. Nat Neurosci. 2000;3:1301–1306. doi: 10.1038/81834. [DOI] [PubMed] [Google Scholar]
- 51.Ma DK, Ponnusamy K, Song M-R, Ming G-L, Song H. Molecular genetic analysis of FGFR1 signalling reveals distinct roles of MAPK and PLCgamma1 activation for self-renewal of adult neural stem cells. Mol Brain. 2009;2:16. doi: 10.1186/1756-6606-2-16. [DOI] [PMC free article] [PubMed] [Google Scholar]
- 52.Stachowiak EK, et al. Cerebral organoids reveal early cortical maldevelopment in schizophrenia-computational anatomy and genomics, role of FGFR1. Transl Psychiatry. 2017;7:6. doi: 10.1038/s41398-017-0054-x. [DOI] [PMC free article] [PubMed] [Google Scholar]
- 53.International Stem Cell Initiative. Assessment of established techniques to determine developmental and malignant potential of human pluripotent stem cells. Nat Commun. 2018;9:1925. doi: 10.1038/s41467-018-04011-3. [DOI] [PMC free article] [PubMed] [Google Scholar]
- 54.Tsankov AM, et al. A qPCR ScoreCard quantifies the differentiation potential of human pluripotent stem cells. Nat Biotechnol. 2015;33:1182–1192. doi: 10.1038/nbt.3387. [DOI] [PMC free article] [PubMed] [Google Scholar]
- 55.Bock C, et al. Reference Maps of human ES and iPS cell variation enable high-throughput characterization of pluripotent cell lines. Cell. 2011;144:439–452. doi: 10.1016/j.cell.2010.12.032. [DOI] [PMC free article] [PubMed] [Google Scholar]
- 56.Kajiwara M, et al. Donor-dependent variations in hepatic differentiation from human-induced pluripotent stem cells. Proc Natl Acad Sci U S A. 2012;109:12538–12543. doi: 10.1073/pnas.1209979109. [DOI] [PMC free article] [PubMed] [Google Scholar]
- 57.Hu S, et al. Effects of cellular origin on differentiation of human induced pluripotent stem cell-derived endothelial cells. JCI Insight. 2016;1 doi: 10.1172/jci.insight.85558. [DOI] [PMC free article] [PubMed] [Google Scholar]
- 58.Lancaster MA, Knoblich JA. Generation of cerebral organoids from human pluripotent stem cells. Nat Protoc. 2014;9:2329–2340. doi: 10.1038/nprot.2014.158. [DOI] [PMC free article] [PubMed] [Google Scholar]
- 59.Wolf FA, Alexander Wolf F, Angerer P, Theis FJ. SCANPY: large-scale single-cell gene expression data analysis. Genome Biology. 2018;19 doi: 10.1186/s13059-017-1382-0. [DOI] [PMC free article] [PubMed] [Google Scholar]
- 60.Ferri ALM, et al. Foxa1 and Foxa2 regulate multiple phases of midbrain dopaminergic neuron development in a dosage-dependent manner. Development. 2007;134:2761–2769. doi: 10.1242/dev.000141. [DOI] [PubMed] [Google Scholar]
- 61.Andersson E, et al. Identification of intrinsic determinants of midbrain dopamine neurons. Cell. 2006;124:393–405. doi: 10.1016/j.cell.2005.10.037. [DOI] [PubMed] [Google Scholar]
- 62.Loo L, et al. Single-cell transcriptomic analysis of mouse neocortical development. Nat Commun. 2019;10:134. doi: 10.1038/s41467-018-08079-9. [DOI] [PMC free article] [PubMed] [Google Scholar]
- 63.Ren J, et al. Single-cell transcriptomes and whole-brain projections of serotonin neurons in the mouse dorsal and median raphe nuclei. Elife. 2019;8 doi: 10.7554/eLife.49424. [DOI] [PMC free article] [PubMed] [Google Scholar]
- 64.Huang KW, et al. Molecular and anatomical organization of the dorsal raphe nucleus. Elife. 2019;8 doi: 10.7554/eLife.46464. [DOI] [PMC free article] [PubMed] [Google Scholar]
- 65.Okaty BW, et al. A single-cell transcriptomic and anatomic atlas of mouse dorsal raphe neurons. Elife. 2020;9 doi: 10.7554/eLife.55523. [DOI] [PMC free article] [PubMed] [Google Scholar]
- 66.Mercurio S, Serra L, Nicolis SK. More than just Stem Cells: Functional Roles of the Transcription Factor Sox2 in Differentiated Glia and Neurons. Int J Mol Sci. 2019;20 doi: 10.3390/ijms20184540. [DOI] [PMC free article] [PubMed] [Google Scholar]
- 67.Wu Y, Liu Y, Levine EM, Rao MS. Hes1 but not Hes5 regulates an astrocyte versus oligodendrocyte fate choice in glial restricted precursors. Dev Dyn. 2003;226:675–689. doi: 10.1002/dvdy.10278. [DOI] [PubMed] [Google Scholar]
- 68.Wiese S, Karus M, Faissner A. Astrocytes as a source for extracellular matrix molecules and cytokines. Front Pharmacol. 2012;3:120. doi: 10.3389/fphar.2012.00120. [DOI] [PMC free article] [PubMed] [Google Scholar]
- 69.Redies C. Cadherins in the central nervous system. Prog Neurobiol. 2000;61:611–648. doi: 10.1016/s0301-0082(99)00070-2. [DOI] [PubMed] [Google Scholar]
- 70.Haghverdi L, Lun ATL, Morgan MD, Marioni JC. Batch effects in single-cell RNA-sequencing data are corrected by matching mutual nearest neighbors. Nat Biotechnol. 2018;36:421–427. doi: 10.1038/nbt.4091. [DOI] [PMC free article] [PubMed] [Google Scholar]
- 71.Lippert C, Casale FP, Rakitsch B, Stegle O. LIMIX: genetic analysis of multiple traits. bioRxiv. 2014 [Google Scholar]
- 72.Casale FP, Rakitsch B, Lippert C, Stegle O. Efficient set tests for the genetic analysis of correlated traits. Nature Methods. 2015;12:755–758. doi: 10.1038/nmeth.3439. [DOI] [PubMed] [Google Scholar]
- 73.Aguirre-Gamboa R, et al. Deconvolution of bulk blood eQTL effects into immune cell subpopulations. BMC Bioinformatics. 2020;21:243. doi: 10.1186/s12859-020-03576-5. [DOI] [PMC free article] [PubMed] [Google Scholar]
- 74.Raudvere U, et al. g:Profiler: a web server for functional enrichment analysis and conversions of gene lists (2019 update) Nucleic Acids Res. 2019;47:W191–W198. doi: 10.1093/nar/gkz369. [DOI] [PMC free article] [PubMed] [Google Scholar]
- 75.Ongen H, Buil A, Brown AA, Dermitzakis ET, Delaneau O. Fast and efficient QTL mapper for thousands of molecular phenotypes. Bioinformatics. 2016;32:1479–1485. doi: 10.1093/bioinformatics/btv722. [DOI] [PMC free article] [PubMed] [Google Scholar]
- 76.Storey JD, Tibshirani R. Statistical significance for genomewide studies. Proc Natl Acad Sci U S A. 2003;100:9440–9445. doi: 10.1073/pnas.1530509100. [DOI] [PMC free article] [PubMed] [Google Scholar]
Associated Data
This section collects any data citations, data availability statements, or supplementary materials included in this article.
Supplementary Materials
Data Availability Statement
Managed access data from single-cell RNA sequencing are accessible in the European Genome-phenome Archive (EGA, https://www.dev.ebi.ac.uk/ega/) under the study number EGAS00001002885 (dataset: EGAD00001006157).
Open access single-cell RNA sequencing data are available in the European Nucleotide Archive (ENA) under the study ERP121676 (https://www.ebi.ac.uk/ena/browser/view/PRJEB38269).
Processed single-cell count data and eQTL and colocalization summary statistics are available from Zenodo: https://zenodo.org/record/4333872.
The two iPSC single-cell datasets are available from Zenodo (https://zenodo.org/record/3625024) and GEO (GSE118723: https://www.ncbi.nlm.nih.gov/geo/query/acc.cgi?acc=GSE118723) for the datasets described in Cuomo et al., 2020 and Sarkar et al., 2019 respectively.
iPSC bulk RNA-seq data from Bonder et al., 2021 are available on EGA (study ID: EGAS00001000593: https://www.ebi.ac.uk/ega/studies/EGAS00001000593) and ENA (ERP007111: https://www.ebi.ac.uk/ena/browser/view/PRJEB7388).
Chip genotypes for HipSci lines were available from EGA (EGAS00001000866: https://www.ebi.ac.uk/ega/studies/EGAS00001000866) and NCBI (PRJEB11750: https://www.ncbi.nlm.nih.gov/bioproject/?term=PRJEB11750).
All scripts are available in the following github repository: https://github.com/single-cell-genetics/singlecell_neuroseq_paper/.
Stand-alone predictor for neuronal differentiation capacity:
The eQTL mapping pipeline is available here: https://github.com/single-cell-genetics/limix_qtl/.


