Abstract
Understanding cellular organization demands the best possible spatial resolution in all three dimensions (3D). In fluorescence microscopy, this is achieved by 4Pi nanoscopy methods that combine the concepts of using two opposing objectives for optimal diffraction-limited 3D resolution with switching fluorescent molecules between bright and dark states to break the diffraction limit. However, optical aberrations have limited these nanoscopes to thin samples and prevented their application in thick specimens. Here we have developed an improved isoSTED nanoscope, which utilizes an advanced adaptive optics strategy to achieve sub-50 nm isotropic resolution of structures such as neuronal synapses and ring canals previously inaccessible in tissue. The adaptive optics scheme presented in this work is generally applicable to any microscope with a similar beam path geometry involving two opposing objectives to optimize resolution when imaging deep in aberrating specimens.
The past two decades have witnessed a revolution in far-field light microscopy. The newly developed nanoscopes (or super-resolution microscopes)1, 2 are exceptional in their ability to noninvasively visualize cellular structures below the diffraction limit in all three dimensions (3D). This has enabled investigations of fundamental biological questions at the nanoscale with light microscopy for the first time. However, while nanoscopy can achieve 20 to 40 nm resolution laterally (xy), the axial (z) resolution is at least two-times worse because of the limited illumination and/or detection aperture of single-objective systems.
To address this challenge, the axial resolution can be improved by coherently combining light from two opposing objectives with a common focus in a so-called ‘4Pi’ geometry3, 4. Interference in the common focal region dramatically sharpens the point-spread function (PSF) axially, improving the resolution 3- to 7-fold5. Further, collecting light with two objectives doubles the fluorescence detection efficiency. In combination with nanoscopy methods, such as stimulated emission depletion (STED) nanoscopy6, 7, reversible saturable optical linear fluorescence transitions (RESOLFT) nanoscopy8, or single-molecule switching (SMS; including (F)PALM, (d)STORM, GSDIM) nanoscopy9–11, 4Pi microscopes have realized nearly isotropic resolution of 20-50 nm in 3D. However, 4Pi microscopy is limited by axially repetitive side-lobes in the effective PSF, which can lead to ‘ghost images’ of structures above and below the focal plane. Further, the resolution is quickly compromised by accumulated optical aberrations when imaging deeper than a few microns off the coverslip. Because of these limitations, 4Pi nanoscopy applications were initially restricted to samples of <1 μm in thickness, and only recently have 4Pi nanoscopes been reported for whole-cell imaging8, 11, 12. However, 4Pi nanoscopy applications in tissues remain unexplored. Here we present the development of a new nanoscope with sub-50 nm 3D resolution imaging capabilities to whole cells and tissues.
Results
Implementation of an adaptive optics isoSTED nanoscope
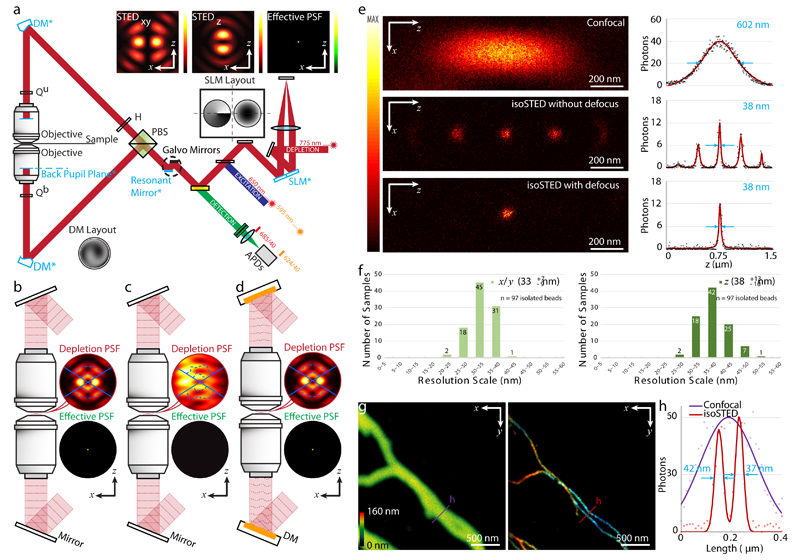
A simplified schematic of our instrument, a laser-scanning STED nanoscope13 utilizing two opposing objective lenses which expands on a previously published isoSTED instrument by Schmidt et al. 6, is shown in Fig. 1a (see Extended Data Fig. 1 for the details). Fluorescence is restricted in all three dimensions to a sub-diffraction-sized volume by depleting excited fluorophores in the excitation volume’s periphery using stimulated emission. Switching off fluorophores in the periphery is performed by a depletion laser, which forms a hollow, sphere-shaped focus with a red-shifted wavelength, superimposed on the excitation focus. To generate a depletion profile for isotropic compression of the fluorescence emission volume, two depletion patterns featuring a common focal zero are combined: one for lateral (STEDxy) and one for axial (STEDz) depletion (Fig. 1a, b). While the STEDxy pattern is generated by the constructive interference of two ring-shaped foci, the STEDz beams interfere destructively, which in combination results in a “zero”-intensity minimum at the center surrounded by a high-intensity crest in all directions.
Fig. 1. Principle and performance of adaptive optics (AO) isoSTED nanoscopy.
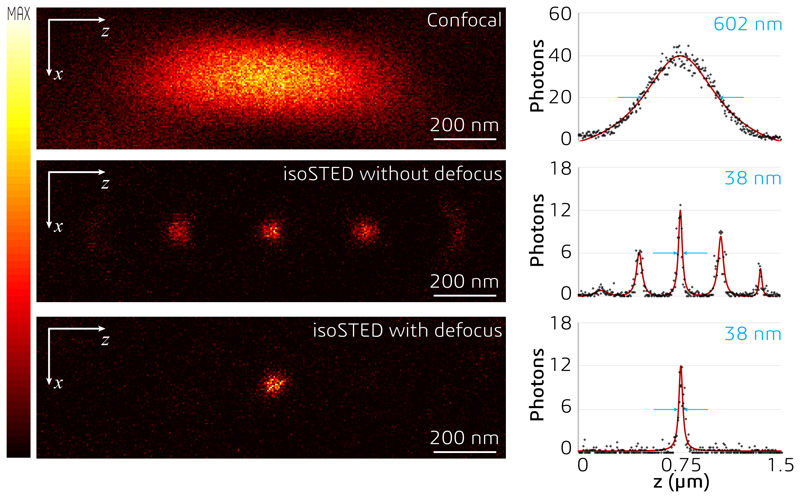
(a) Simplified schematic. Abbreviations: PBS, polarizing beam splitter; H, half-wave plate; Qu, upper quarter-wave plate; Qb, bottom quarter-wave plate; DM, deformable mirror; SLM, spatial light modulator. The conjugated planes are indicated with an asterisk and highlighted in blue. Inserts on top: simulated intensity distributions in the focal region. (b) – (d) Principle of aberration correction in isoSTED nanoscope. Depletion and effective PSFs with and without sample-induced aberrations are shown as (b) and (c), respectively. (d) The deformable mirrors in the interference cavity introduce phase patterns that counteract aberrations, restoring nearly perfect optical performance. (e) xz|y=0 cross sections of the effective PSFs as measured with a 20-nm diameter crimson fluorescent bead. From top to bottom: single-objective confocal PSF, isoSTED PSFs with (bottom) and without (middle) defocus added to the STEDz pattern. To the right of each PSF, the respective axial intensity profiles (z) are displayed. The raw data (black dots) are fitted with a Lorentzian function (red curves), and the corresponding FWHMs are highlighted in blue. (f) Histogram of the lateral (left) and axial (right) FWHMs in isoSTED mode. At the top-right corner of each histogram, the average FWHM and the corresponding value range are given (data from 97 isolated 20-nm-diameter crimson fluorescent beads, see Extended Data Fig. 2). (g) Confocal and isoSTED images of microtubules in the same region of a COS-7 cell. The distribution of α-tubulin (labeled with ATTO 647N) is visualized. The axial position of the microtubules is indicated using a rainbow colormap. A total of 16 optical sections (256×256 pixels each) were imaged. To maintain comparable brightness and contrast, the pixel dwell time in the confocal image (left) is 6 times shorter than that in isoSTED image (right). (h) Intensity profiles at the positions denoted by the solid lines in (g). The raw data (dots) are fitted with Lorentzian functions (solid curve). The corresponding FWHMs of the red line profiles from the isoSTED image are highlighted in blue.
To enable sub-50-nm isotropic resolution in thick specimens, our isoSTED nanoscope is built around two 100×, 1.35NA, silicone-oil objectives in a vertically oriented 4Pi interference cavity (see Methods and Extended Data Fig. 1). For multi-color imaging, two pulsed excitation beams and one depletion beam were supplied at 594, 650, and 775 nm wavelength, respectively, with an 80-MHz repetition rate. A 16-kHz resonant scanning mirror and two synchronized galvanometer mirrors were combined to enable fast 2D beam scanning.
Our new design provides three major improvements over the original isoSTED nanoscope6. First, using orthogonal polarization components from the same laser to generate the STEDxy and STEDz depletion patterns (Extended Data Fig. 1) leads to intrinsic co-alignment of the two depletion beams. To prevent these patterns from interfering with each other, we introduced a pulse delay module whose layout is inspired by a Michelson interferometer (Extended Data Fig. 1). A double-pass spatial light modulator (SLM) configuration14 was used to encode separate phase profiles upon each polarization component. Additionally, the SLM allows a small amount of defocus to be applied to the STEDz pattern. This additional defocus virtually eliminates the repetitive axial side-lobes inherent to 4Pi microscopy17. Second, we added two quarter-wave plates in front of the objective back apertures to convert the linear polarization of the laser sources to circular polarization. This minimized excitation and depletion selectivity with respect to fluorophore dipole orientation and also reduced laser-induced background in the recorded images (see Methods, Supplementary Fig. S1, and S2). Third, two deformable mirrors (DMs) were respectively placed into the upper and lower beam paths (Fig. 1a-d). Aberrations were corrected using a sensorless adaptive optics (AO) architecture15. A previously developed 4Pi aberration model16 enabled us to consider the whole isoSTED nanoscope as a single optical system and simultaneously optimize the wavefronts for both objectives using a single set of coefficients to achieve an aberration-free focus.
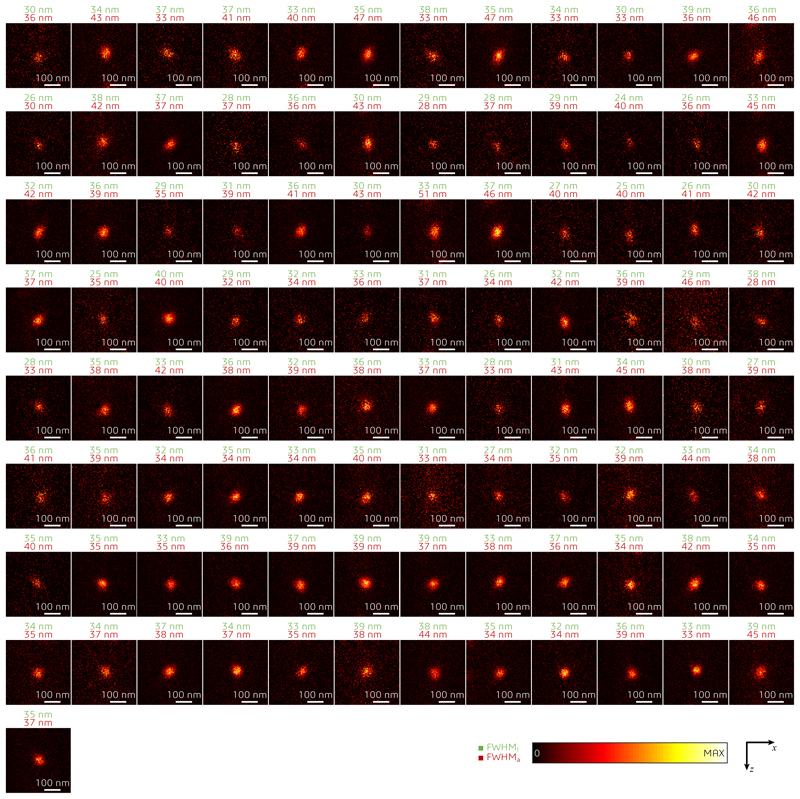
To quantify the resolution of our system, we imaged ninety-seven 20-nm diameter far-red fluorescent beads (see Fig. 1e and Extended Data Fig. 6). In confocal mode, the full-width-at-half-maximum (FWHM) of the PSF was measured as 216 and 606 nm in the lateral and axial directions, respectively. Switching on the STED depletion beam resulted in an isotropic effective PSF FWHM of ~35 nm (average over all the beads, Fig. 1f and Extended Data Fig. 2). In good agreement with simulations17, when no defocus was added to the STEDz beam, fluorescence was detected from the primary (>50% of the main peak) and secondary (10-20% of the main peak) side-lobes of the effective PSF. Next, we tested the resolution in COS-7 cells with ATTO 647N-immunolabeled microtubules (Fig. 1g). Example intensity profiles from imaged microtubules are presented in Fig. 1h. The system resolution was quantified from 56 intensity profiles by nested-loop ensemble PSF fitting18 at ~39 nm.
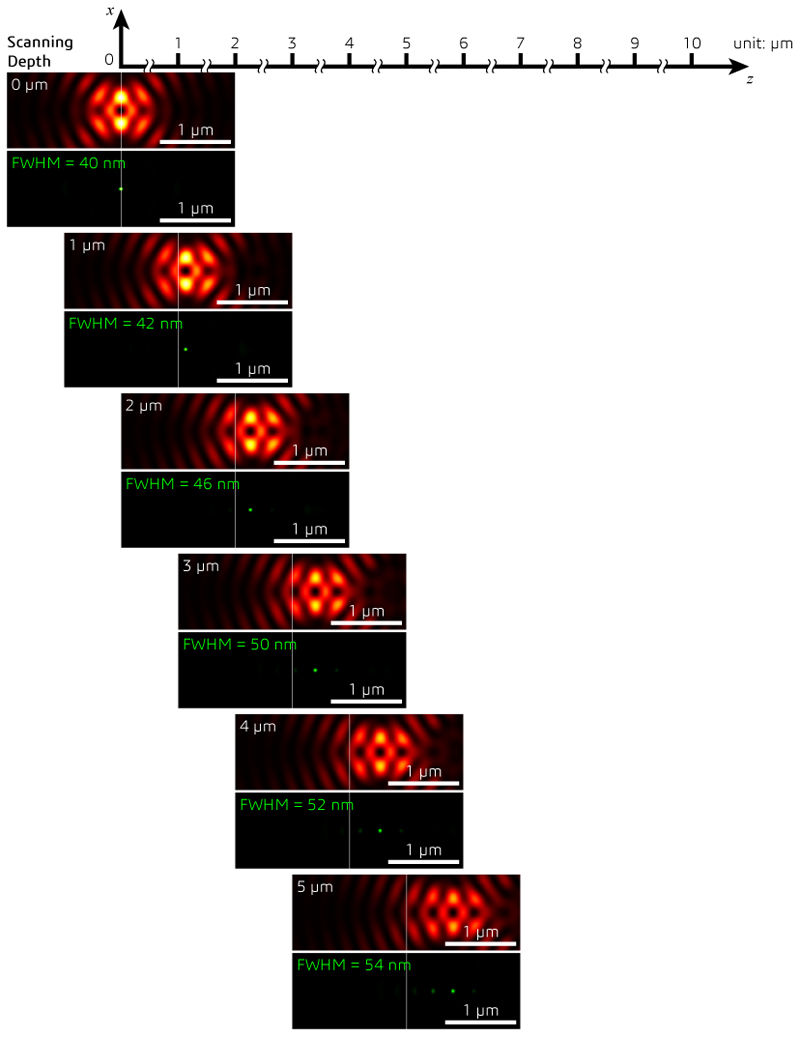
Optical aberrations are a critical issue affecting 4Pi microscopy. Under ideal conditions, the effective PSF of our system is virtually side-lobe free after adding moderate defocus to the STEDz pattern (see Fig. 1e and Extended Data Fig. 6) as mentioned above. In practice, however, the refractive index (RI) mismatch between the silicone oil and the mounting medium results in depth-dependent aberrations that subsequently result in depth-dependent side-lobes (Extended Data Fig. 3). These side-lobes manifest themselves as ‘ghost images’ above and below the real features in an image. In addition, when the sample is scanned in the z-direction, the positions of the PSF interference maxima shift under the PSF envelope, rendering any deconvolution procedure based on a spatially invariant PSF essentially useless. In principle, deconvolution with a variable PSF19 can mitigate this phenomenon, but still relies on an accurate knowledge of the PSF, and is limited to images with good signal-to-noise ratio (SNR). Therefore, a more effective approach is to minimize sample-induced aberrations using AO. Using the 4Pi aberration model and sensorless AO strategy mentioned above (see also Methods), sample-induced aberrations were corrected and a virtually side-lobe free PSF was restored.
AO isoSTED imaging in cells
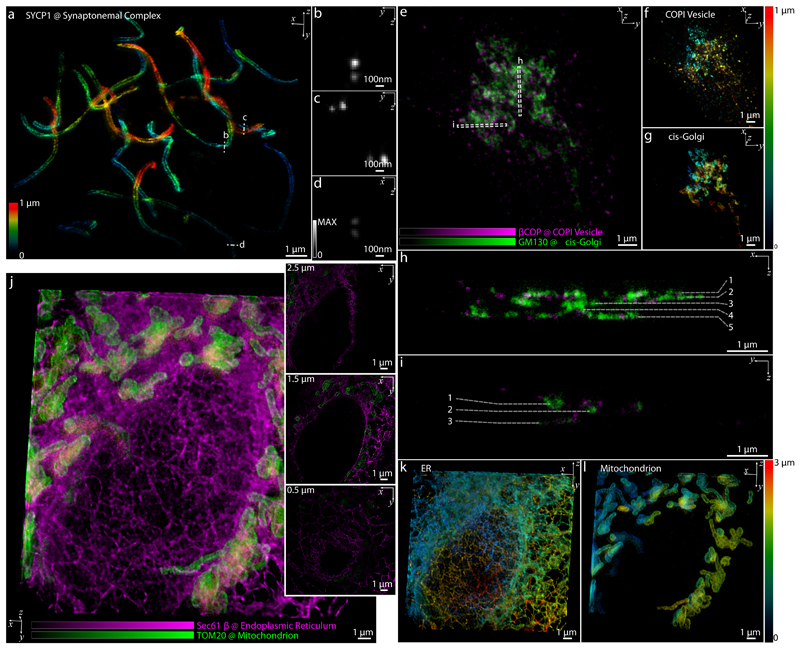
The AO strategy enabled us to image fine subcellular structures in one and two colors (Supplementary Fig. S3) within the cells, for example, microtubules in COS-7 cells (Fig. 1g), synaptonemal complexes in mouse spermatocytes (Fig. 2a – d and Supplementary Video S1), the Golgi apparatus in HeLa cells (Fig. 2e–i and Supplementary Video S2), and the endoplasmic reticulum (ER) and mitochondria in COS-7 cells (Fig. 2j–l and Supplementary Video S3). In these imaging experiments, typical laser powers were 5-50 μW and 50-100 mW for excitation and depletion, respectively (measured at the back pupil of the objective). Effective pixel dwell times ranged from 2 to 20 μs (10 to 80 ns pixel dwell time per line, depending on number of pixels and position in field of view; 200-250 line accumulations). Pixel dwell times were chosen to maximize the signal in a single 3D data stack. To assess photobleaching, we repeatedly acquired 3D data stacks of the same region in COS-7 cells at a reduced effective pixel dwell time of ~1 μs. The fluorescence signal decreased to approximately 30% after five consecutive 3D volume acquisitions (see Methods and Extended Data Fig. 4).
Fig. 2. Applications of AO isoSTED nanoscopy in cultured mammalian cells.
(a) Synaptonemal complexes in a mouse spermatocyte visualized by immunolabeling SYCP1 with ATTO 647N. (b) – (d) Cross sections of 1×1 μm2 regions at the positions denoted by the dashed line in (a). The images are normalized to the same peak intensity. (b) – (d) were smoothed using a 2D Gaussian kernel with a standard deviation of 1 pixel. (e) COPI vesicles (magenta) and Golgi apparatus (green) in a HeLa cell visualized by immunolabeling GM130 with ATTO 594 and βCOP with ATTO 647N. (f) - (g) Axial positions of vesicles (f) and cis-Golgi cisternae (g) in (e) indicated using a rainbow colormap. (h) - (i) Cross sections at the positions denoted by the dashed boxes in (e). Cisternae in the Golgi apparatus are indicated by the dashed lines. (j) ER (magenta) and mitochondria (green) in a COS-7 cell visualized by immunolabeling Sec61β with ATTO 594 and TOM20 with ATTO 647N. xy cross sections at different depths (z) are shown on the right. (k) - (l) Axial positions of mitochondria and ER in (j) indicated using a rainbow colormap.
AO isoSTED imaging in tissues
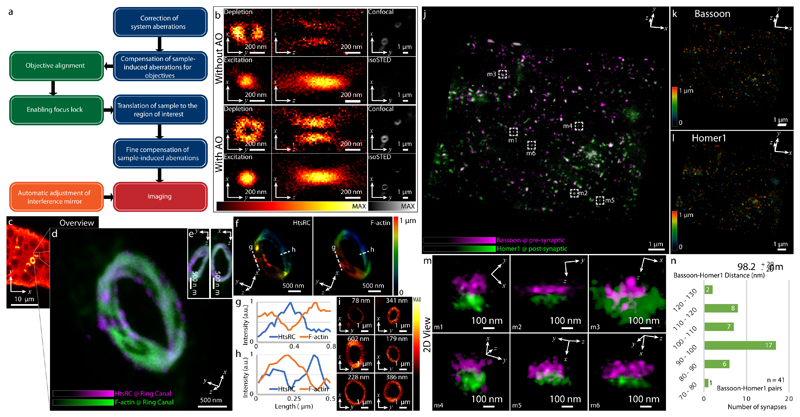
Compared to typical mammalian cells cultured on coverslips (3-5 μm thick), RI inhomogeneities in tissue samples that are usually much thicker pose a greater challenge for aberration-sensitive techniques such as isoSTED nanoscopy. When mounting a sample for 4Pi imaging, a coverslip sandwich must be created with sufficient space to accommodate thick samples between the coverslips. While the distance between coverslips can be as low as 5 to 10 μm for samples of cultured cells, this distance must be expanded to >30 μm for most tissues to avoid compression artifacts (Extended Data Fig. 5). This increased sample thickness amplifies any existing RI mismatch between mounting medium and objective immersion liquid. To overcome this challenge and enable isoSTED nanoscopy in tissues, we developed a multistep method to optimize the DM surface shapes (see Fig. 3a, Supplementary Fig. S4, and Methods). First, after system aberrations were corrected, the two interference arms of the isoSTED instrument were treated as two separate microscopes20, 21, and the wavefront distortions in the upper and lower pupils were corrected separately by imaging gold beads attached to one of the coverslips in confocal. After this coarse aberration correction step, the focal plane was translated to the middle of the tissue. Next, we applied sensorless AO to minimize aberrations based on optimization of the fluorescence signal from the labeled biological structures. This correction step employed the 4Pi-aberration model previously developed16. The STEDxy pattern was turned on, and a weak depletion power (~10% of the power used for imaging) was chosen in order to minimize bleaching.
Fig. 3. IsoSTED images of Drosophila egg chambers and mouse hippocampal brain tissue.
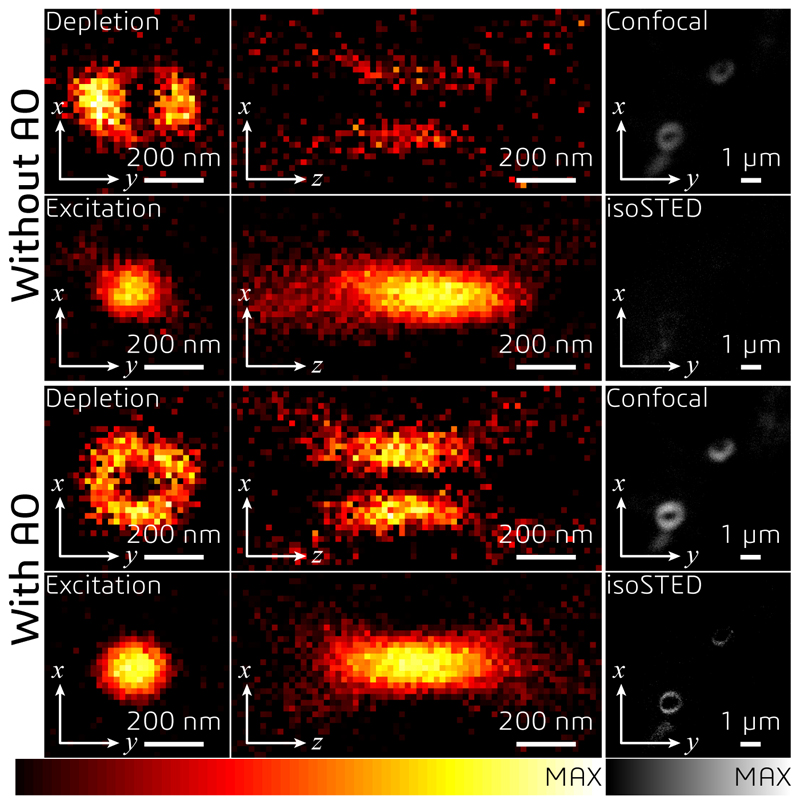
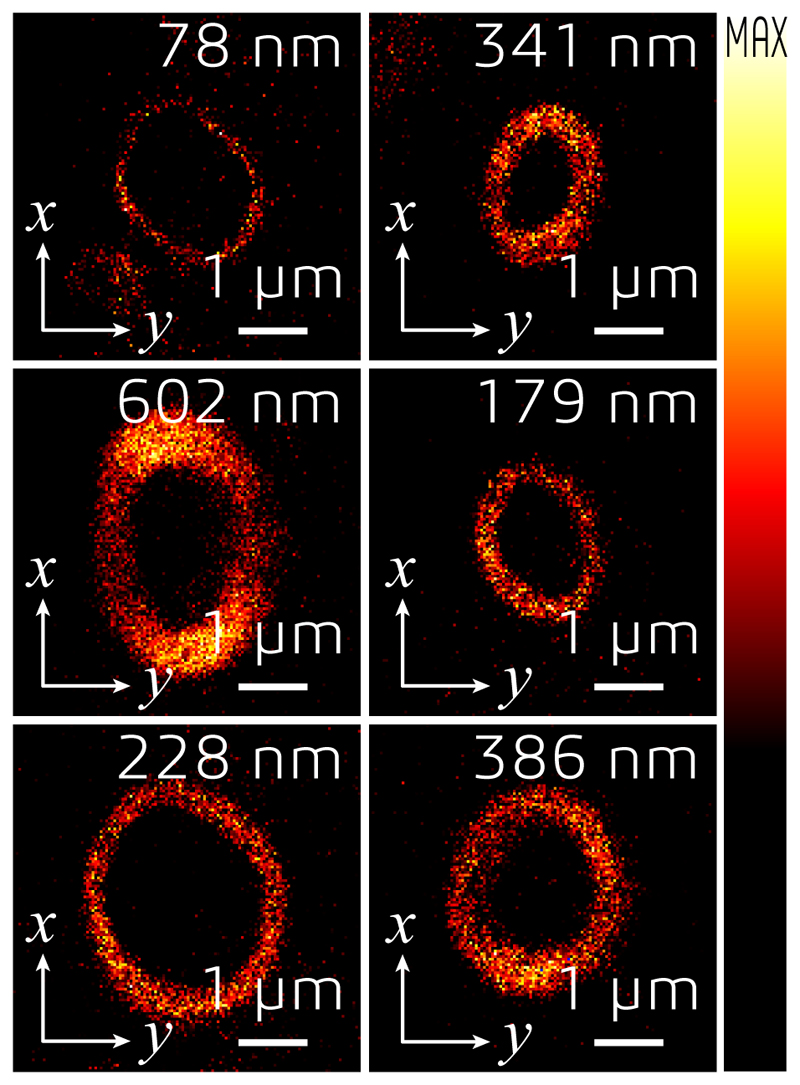
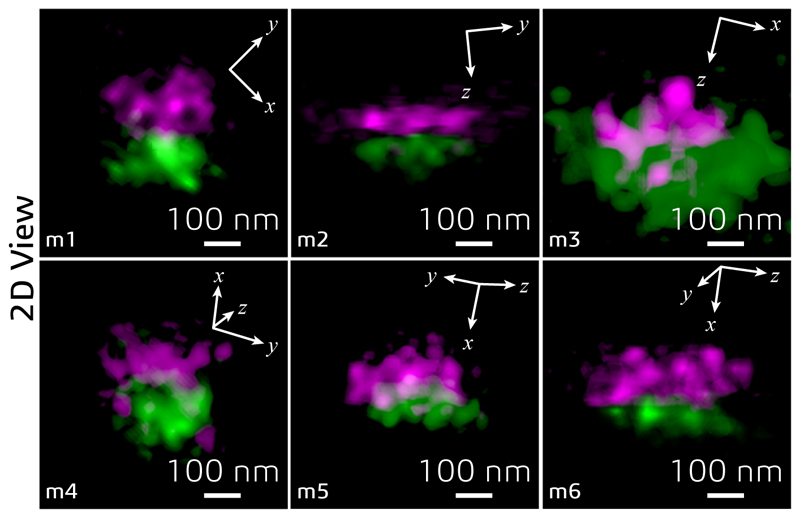
(a) Control loop of the AO strategy used for imaging tissue samples via isoSTED nanoscopy. (b) Effects of AO on the imaging performance of isoSTED. The figures in the left and middle columns show the xy|z = 0 (left) and xz|y = 0 (middle) cross-sections of the PSFs with (bottom two rows) and without (top two rows) AO aberration correction. The PSFs were obtained by imaging 150-nm-diameter gold beads. The right column shows 2D images of ring canals in a Drosophila egg chamber recorded in confocal and isoSTED modes. The F-actin proteins on the ring canals are immunolabeled with ATTO 594. (c) Overview image of Drosophila egg chambers. (d) Magnified image of a single ring canal recorded in isoSTED mode showing F-actin (green) and HtsRC (magenta) immunolabeled by ATTO 594 and ATTO 647N, respectively. (e) Front (left) and side (right) views of the ring canal shown in (d). (f) Axial positions of HtsRC (left) and F-actin (right) indicated using a rainbow colormap. (g) - (h) Intensity line profiles at the positions denoted by the dashed lines in (f). (i) F-actin staining of six ring canals in the same egg chamber. At the top-right corner of each sub-figure, the ring thickness is given (measured as the FWHM of the intensity profile in radial direction in the corresponding 2D ring). (j) IsoSTED image of hippocampal excitatory synapses visualized by immunolabeling the presynaptic active zone marker Bassoon and the postsynaptic scaffolding molecule Homer1 with ATTO 594 and ATTO 647N, respectively. (k) - (l), Axial positions of Bassoon (k) and Homer1 (l) in (j) indicated using a rainbow colormap. (m) Magnified projection images of the pre- and postsynaptic labels at the positions highlighted in (j). The trans-synaptic axes in these figures are rotated into the viewing planes. (n) Histogram of the Bassoon-Homer1 distances (measured as the peak-to-peak distance between the intensity distributions of the two stainings). At the top-right corner of the histogram, the average distance and the value range are given (data from 41 Bassoon-Homer1 pairs).
We demonstrate this multistep AO correction on ring canals, the cytoplasmic bridges that form from cells with arrested mitotic cleavage furrows in a Drosophila egg chamber (Fig. 3c and Supplementary Video S4). The proteins HtsRC and F-actin, both localized at the ring canals, were immunolabeled with ATTO 647N and ATTO 594, respectively. We compared the effects of AO in the same field of view in both confocal and isoSTED modes (see Fig. 3b and Extended Data Fig. 6). While our AO approach somewhat improved the image quality in confocal, the AO-related improvements in isoSTED mode were striking: applying our aberration correction in isoSTED mode increased the image quality from essentially useless (see Fig. 3b and Extended Data Fig. 7, second row) to a level where nanoscale features of the ring canals became clearly visible (Fig. 3d–i, Fig. 3b and Extended Data Fig. 7, fourth row). The 2-color 3D data set of a ~1.2-μm-diameter ring canal clearly reveals the different distributions of HtsRC and F-actin stainings (Fig. 3d–f) showing a more sparse, localized distribution of the HtsRC and a more continuous one for the F-actin. At the high 3D resolution of isoSTED nanoscopy, the two staining patterns show only little overlap (Fig. 3f–h). IsoSTED images of six different ring canals of similar diameter in the same egg chamber reveal notably different ring thicknesses in their HtsRC staining (see Fig. 3i and Extended Data Fig. 8), ranging from sub-100 nm to ~600 nm.
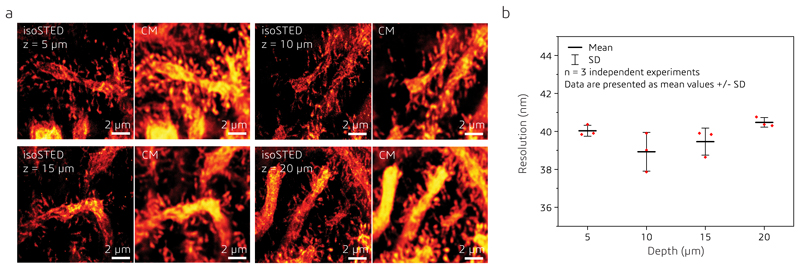
To demonstrate our approach on another challenging target, we imaged excitatory synapses in a 30-μm-thick mouse hippocampal brain sections (Fig. 3j and Supplementary Video S5). A pair of pre- and postsynaptic proteins, the active zone marker Bassoon and the scaffolding protein Homer1 that labels excitatory synapses, were immuno-stained and detected with ATTO 594 and ATTO 647N-conjugated secondary antibodies, respectively. IsoSTED images (see Fig. 3j–n and Extended Data Fig. 9) resolved the two protein distributions as juxtaposed, clearly resolved pairs, demonstrating the quantification capabilities of our instrument at the sub-diffraction-limit scale inside the tissue. The mean distance between the pre- and post-synaptic markers was ~100 nm, (Fig. 3n), a distance in excellent agreement with a previous report22 but now reported from much thicker sections. To evaluate the resolution as a function of depth, we imaged Calbindin-labeled mouse cerebellum sections at different z-positions. The resolution in isoSTED mode varied from 38.9 to 40.5 nm over the 30-μm thick tissue and was consistently ~8-fold better than the average resolution in confocal microscopy mode (307 nm; see Methods and Extended Data Fig. 10).
Discussion
In summary, AO isoSTED nanoscopy reveals fine structures with sub-50-nm isotropic resolution and demonstrates AO for nanoscopy techniques in thick samples. Compared with other approaches suitable for tissue imaging (Supplementary Table S1), AO isoSTED nanoscopy is especially advantageous with regard to 3D resolution. Stimulated emission is only one of several mechanisms to realize reversible fluorescence inhibition. Thus, the scheme presented in this work is generally applicable to any AO microscope with a 4Pi cavity. This underscores the potential of applying our AO strategy to other nanoscopy techniques, such as 4Pi-RESOLFT8 and 4Pi-SMS10, 11 to pursue comparable resolution when imaging deeper. The realization of the AO function in a 4Pi microscope is reasonably flexible. For example, the DMs in the 4Pi cavity can readily be replaced by other AO devices, e.g. liquid lenses24.
AO has many other applications beyond “simple” aberration correction in 4Pi techniques - suppressing 4Pi sidelobes by introducing defocus modes to the depletion wavefronts is just one possibility. More advanced wavefront control can be applied to customize PSFs and generate elaborately-designed PSF to expand the application scale.
Similar to the combination of AO with light-sheet and expansion microscopy25, combining expansion microscopy23 with isoSTED nanoscopy is an exciting new frontier which could achieve sub-10-nanometer isotropic resolution – a value which approaches the size of the labels themselves. AO will be instrumental in correcting for the depth-dependent aberrations stemming from the refractive index mismatch between the immersion medium of the objective and the hydrogel.
The results presented here were all obtained in fixed samples. 3D live-cell super-resolution imaging is still challenging due to photobleaching, phototoxicity and slow recording speed. However, several promising developments in this direction have recently been presented: advanced wavefront control to generate multiple foci for parallelized, faster scanning8, plasma membrane-permeable, STED-compatible dyes for live-cell STED experiments26, imaging conditions for reduced phototoxicity in live-cell STED nanoscopy27, and a chamber that keeps cells alive within the narrow gap between two objectives8. These efforts combined present a strategy for future live-cell 3D imaging using isoSTED nanoscopy and similar techniques.
In this article, we demonstrated the application of a 4Pi nanoscope in samples of 30 to 35 μm in thickness. Imaging thicker specimens should be possible by employing higher-order aberration modes to compensate for larger aberrations. However, thick biological specimens give rise to not just aberrations, but light scattering. The 4Pi aberration basis we developed16 is not effective for modelling scattering effects. As a consequence, beyond a sample thickness of several mean free paths (~100 μm in biological specimens) our AO strategy is unlikely to yield substantial image improvement since scattering will dominate the light wave distortion.
In conclusion, our development provides access to the 3D organization of tissue at the nanoscale by fluorescence microscopy and represents an important step towards understanding sub-cellular organization in the context of tissue.
Methods
Nanoscope setup
Design details are provided as Supplementary Information (Extended Data Fig. 1). In brief, the 4Pi interference cavity of the isoSTED system is set up vertically around two 100×, 1.35NA, silicone-oil objective lenses (UPLSAPO 100XS, Olympus). An 80-MHz pulsed depletion laser with a pulse length of ~600 ps (775 nm, Katana HP, OneFive) is coupled into a 10-m long, polarization-maintaining single-mode fiber (PM-S630-HP, Nufern). One polarization component of the laser is delayed by a Michelson interferometer with respect to the orthogonally polarized component to avoid later interference between the two polarization components. The beam emerging from the fiber is collimated and illuminates a spatial light modulator (SLM, X10468-02, Hamamatsu), which applies a vortex and a moderate defocus phase pattern to the two orthogonally oriented polarization components of the depletion beam, respectively17. The SLM is imaged onto a 16-kHz resonance scan mirror (SC-30, EOPC), which is, in turn, imaged into the back pupils of both objectives.
Pulsed excitation light from two laser lines at wavelengths of 650 nm (LDH-P-C-650m, PicoQuant) and 594 nm (LDH-D-TA-595, PicoQuant) is coupled into the same 2-m long polarization maintaining single-mode fiber (P1-488PM-FC-2, Thorlabs) and merged with the STED beam path via a dichroic mirror (T740lpxr, Chroma). The polarization orientation of the excitation beam is tuned by a quarter-wave plate (QWP, AQWP05M-600, Thorlabs), a linear polarizer (LPVISE100-A, Thorlabs), and a half-wave plate (HWP, AHWP10M-600, Thorlabs) to an angle of 45° with respect to that of the depletion beam.
The resonance mirror scans the combined laser beams along the fast scanning axis (x), while two synchronized galvanometer scanning mirrors (dynAXIS XS, SCANLAB) scan the beams along the slow scanning axis (y). Together, the two galvanometer mirrors behave as a single scan mirror at the conjugate pupil plane, allowing the three scanning mirrors to act as a fast, dual-axis scanning system positioned in a plane conjugate to the pupil planes of the objectives. A polarizing beam-splitter (PBS, PBSH-450-00-100, CVI Laser Optics) is used to produce the counter-propagating pair of beams in the interference cavity. A HWP (AHWP10M-600, Thorlabs) before the PBS rotates the polarization orientations of the incident depletion beam to ±45° with respect to the polarization axis of the PBS, enabling precise 50/50 power allocation between the two arms of the cavity. Because of its incident 45° linear polarization, the excitation beam is rotated to 0° by the HWP in front of the PBS and is therefore only coupled into the upper arm of the interference cavity. The polarization of the beams in the upper arm is further rotated by another HWP (AHWP10M-600, Thorlabs) for later interference in the combined focus (Supplementary Fig. S1). The phase difference between the two arms is minimized by translating the BK-7 glass wedge (custom design, OptoCity) in the lower arm. In both arms of the interference cavity, a deformable mirror (DM, MultiDM-5.5, Boston Micromachines) is added in the plane conjugated to the back pupil of the corresponding objective, which allows for aberration correction and manipulation of the PSF. Circular polarization of all beams in the focus is ensured by QWPs (AHWP05M-600, Thorlabs) in front of the objectives.
The sample is mounted at the common focal plane of the objectives. The fluorescence from the sample is collected by both objectives, combined at the PBS, de-scanned by the scanning mirrors, and then separated from the common beam path via a custom-made, 5-mm-thick quad-bandpass dichroic mirror (ZT485/595/640/775rpc, Chroma). An additional dichroic mirror (ZT640rdc, Chroma) splits the fluorescence into two detection bands for multicolor imaging. For each band, two filters of the same type (separated by about 50 mm and mounted at a small angle relative to each other to avoid interference between them) reject stray excitation and depletion laser light (FF02-685/40-25, FF01-624/40-25, Semrock). Fluorescence in each detection band is coupled into a multimode stainless tubing fiber (FG105LCA, Thorlabs) acting as a confocal pinhole, with a pinhole size of ~0.8 Airy units. Each fiber is connected to a single-photon counting avalanche photodiode (APD, SPCM-ACRH-13-FC, Excelitas). The measured fluorescence signals from the APDs are relayed to circuit boards for gated detection (custom built, Opsero Electronics). These gate boards are synchronized to the trigger signal from the depletion laser. The gate electronics allow software control of the detection window length and position. The same trigger signal and circuit boards are used to trigger the excitation lasers at a user-defined delay. Finally, the APD signal is acquired by a field-programmable gate array board (PCIe-7852R, National Instruments), which is synchronized to the resonance mirror. The system is controlled via a custom-made interface programmed in LabVIEW 2014 (National Instruments). The system allows line-by-line image acquisition.
Sample Mounting
Our nanoscope is designed to facilitate easy sample mounting and removal. First, a cover glass is mounted into a custom made Ø39 mm black anodized aluminum sample holder with a Ø25.4 mm × 500 μm deep pocket and a total thickness of 4 mm. This cover glass is glued in place from below with Picodent two-component silicone sealant. Next, 25 μl of imaging buffer is pipetted onto this fixed cover glass, and the second cover glass is placed on top (now also sitting inside the pocket of the sample holder). The second cover glass is glued in place with the two-component sealant and allowed to cure. To facilitate mounting the sample holder for imaging, the upper objective in the isoSTED nanoscope is placed on a long-travel range, nanometer-resolution, linear translation stage (N-664, PI) that can retract 16 mm allowing the sample holder, with cover glass sandwich, to be easily inserted or removed between the opposing objectives. Sample mounting and removal can be carried out with no cavity realignment.
Background Reduction
The depletion beam enters the 4Pi interference cavity from the bottom-right side of the PBS. In our design, for the upper arm in the cavity, the HWP rotates the polarization orientation of the incoming light by 90°. The polarization is further converted to circular polarization by the upper QWP before entering the upper objective. After propagating through the sample, the transmitted light is collected by the opposing objective, and its polarization is converted back to linear polarization by the bottom QWP. As the polarization orientation is the same as the original one, the beam is transmitted by the PBS and leaves the cavity at the empty (top-right) side of the PBS. Similarly, the incident beam entering the lower arm is also dumped to the same side of the PBS. See Supplementary Fig. S1 for the details.
Pulse Gate/Delay Module
Using pulsed excitation and pulsed depletion lasers requires synchronization between the excitation and depletion pulses. We employed a custom-built electronic module (designed and built by Opsero Electronic Design; https://opsero.com/) capable of producing an approximately 20 ns delay on an electronic pulse train, with approximately 10 ps step size. This module was also used to gate the detector signal relative to the excitation pulse signal. The gate/delay module has two inputs: one input for the laser “master” sync signal (in this case the depletion laser), and the second input for the detector (APD) signal. The gate/delay module also includes USB connectivity for easy serial communication with a typical laboratory computer. In our case, the sync output from our depletion laser was connected to the gate/delay board laser signal input. This input signal was then electronically delayed and passed to a sync output that was connected to our excitation laser sync input. In this way, the timing between the excitation and depletion pulses could be controlled by sending serial commands to the gate/delay board that increased or decreased the electronic delay. In practice, the timing between the excitation and depletion pulse trains is set by removing the vortex phase ramp from the SLM in the depletion beam path while imaging a bead sample. This results in a depletion beam with no pattern that should simply suppress any fluorescence excited by the excitation laser. The delay between the excitation and depletion beams is then scanned (stepped) until the total fluorescent signal reaches a minimum (typically a few percent higher than the APD dark count level). The excitation-depletion timing sensitivity will depend on the length and shape of the excitation and depletion pulses. For the system described here, our excitation pulses are approximately 70 ps FWHM, while the depletion pulse is approximately 700 ps FWHM as reported by the respective vendors. In our case, there is an approximately 300 ps range over which reasonable depletion may be observed. Similarly, the detector (APD) output signal is connected to the gate/delay board and is passed to the gate/delay board output only during a specific tunable interval. That is, a detection window is set relative to the laser input sync signal and of a user-specified width. The position of this window, relative to the laser input sync signal, may be set between 0.1 and 9.8 ns in 10 ps steps, and the period (length) of this window may be set between 0.1 and 9.8 ns in 10 ps steps. This allows for easy gated detection controlled by serial commands from a laboratory PC.
Adaptive Optics Strategy
Characterization of DMs
Each DM is characterized offline28 using an external Michelson interferometer setup before it is inserted into the 4Pi cavity. During characterization, the DM is controlled and analyzed by custom code programmed in Matlab 2017b. By tilting the flat mirror in the reference arm of the interferometer setup, the phase induced by the DM can be obtained using Fourier fringe analysis29 and phase unwrapping30. The characterization of the DM consists of computing the influence matrix H that maps a vector u containing the voltage of each actuator of the DM to the corresponding vector z that contains the coefficients of the Zernike analysis of the phase. The matrix H is computed by collecting a set of input-output vector pairs u and z, and by solving a least-squares problem31. After the DMs are installed into the 4Pi cavity, they are operated in open-loop and controlled using the vector of Zernike coefficients z as the independent variable, i.e., given a vector of desired Zernike coefficients z, the voltage vector u to be applied to the DM is found by minimizing the norm squared of z − H · u.
Aberration Control in the 4Pi Cavity
We employ the modes defined in Ref. 32 to model the aberration in the 4Pi cavity and to apply the aberration correction using a single set of coefficients . To operate the two DMs simultaneously, we relate these coefficients to the vectors of Zernike coefficients zu and zl, which correspond to the upper and lower pupil of the 4Pi objectives, respectively. The voltage to be applied to each actuator of a single DM is subsequently determined from either zu or zl as described in the previous section.
Aberration Correction
The flowchart used for aberration correction is presented in Fig. 3a. We employ an image-based, quadratic aberration-correction algorithm to apply the aberration correction at the three different steps outlined in the flowchart (See Supplementary Fig. S4). The algorithm involves taking a series of images where different amounts of a certain aberration mode are applied to the DMs while acquiring each image15. An image quality metric specified below is used to quantify the quality of each acquired image. By fitting a curve through the determined image quality metric values versus the amounts of the applied aberration, the optimal value that maximizes the image quality can be found. This process is repeated for each of the considered aberration modes.
The first step involves removing the system aberrations, i.e., the aberrations caused by misalignment of the optical components comprising the nanoscope and their manufacturing tolerances. In this step, we image 100-nm-diameter crimson fluorescent beads as the target. We optimize the setting of the objective correction collar, the SLM, and then we apply the image-based aberration correction to optimize the Zernike coefficients of the upper and lower pupils individually. The brightness of the image is taken for the metric.
In the second step, the two DMs are still independently adjusted to coarsely compensate sample-induced aberrations and to correct for the large amounts of aberrations caused by the refractive index (RI) mismatch between sample, embedding medium and immersion liquid (silicone oil). In this step, we image 150-nm-diameter gold beads21 attached to the bottom coverslip using the depletion beam for illumination. We optimize the first 11 Zernike coefficients in each pupil using the brightness and the PSF shape as the metric. To reduce the influence of noise, a threshold is set manually to remove background pixels. After this coarse aberration correction step, the objectives are aligned and locked (see “Focus-Lock Module” section).
In the final step, we optimize the 4Pi modes by simultaneously adjusting both DMs. In this step, we switch to 2D isoSTED mode and move to the area of interest within the tissue. At this step the fluorescence emission signal is recorded to apply the aberration correction. We optimize the following 4Pi modes up to . Note that in this step we do not consider the modes and , which cause displacement of the 4Pi PSF but do not affect the image quality6. In addition, mode is corrected by translating a piezo-driven mirror in the 4Pi cavity (see Extended Data Fig. 1) instead of using the DMs. To ensure that the sensorless algorithm is sensitive to aberrations that affect the STED resolution, we activate the STEDxy phase pattern at a weak depletion power (~10% of the power level used for imaging). This step is optional when imaging relatively thin cell samples, especially if the imaging volume is close to the coverslip. In contrast, for tissue samples, this step is essential to allow for high-quality isoSTED imaging. If necessary, the three stages are repeated to further improve the image quality.
To acquire a large imaging volume (>1 μm in z-direction), a linear bias compensation of mode (plus, optionally, defocus and 1st -order spherical aberration is applied when the sample is scanned in z-direction. The bias step size is manually selected to achieve constructive interference in the focal plane of the STEDxy focus throughout the whole imaging volume in the z-direction. To obtain the appropriate step size value, we switch to 2D isoSTED mode and activate the STEDxy phase pattern at a weak depletion power (~10% of the power level used for imaging). We optimize the mode (plus and if needed) to shift the interference fringes underneath the PSF envelope until the size of the effective PSF is minimized. Depending on the expected imaging depth, this measurement is repeated every 1 μm in z-direction. In this way, we obtain a series of biases as a function of the depth, and the step size is calculated based on the linear regression to these discrete points.
Biological Sample Preparation
Cell Sample Preparation
Cell culture
COS-7 (ATCC, CRL-1651) and HeLa (ATCC, CCL-2) cells were grown in DMEM (Gibco, 21063029) supplemented with 10% fetal bovine serum (Gibco, 10438026) at 37 °C with 5% CO2.
Microtubules
COS-7 cells were grown on #1.5, 25-mm-diameter round precision coverslips. Cells were rinsed 3 times with pre-warmed 1× phosphate-buffered saline (37 °C) and then pre-extracted with 0.2% saponin in CBS buffer (10 mM MES, 138 mM KCl, 3 mM MgCl, 2 mM EGTA, 32 mM sucrose). After 1 min, the pre-extraction buffer was removed and the cells were fixed in pre-warmed (37 °C) 3% paraformaldehyde, 0.1% glutaraldehyde in CBS buffer for 15 min at room temperature. The cells were then washed with 1× phosphate-buffered saline 3 times and immunofluorescence staining was performed using mouse anti-alpha tubulin primary antibody (T5168, Sigma-Aldrich) at 1:1000 dilution, and goat anti-mouse ATTO 647N secondary antibody (50185, Sigma-Aldrich) at 1:1000.
Synaptonemal Complex
All experimental procedures involving the use of mice were performed in agreement with the Yale University Institutional Animal Care and Use Committee (IACUC). Testes (tunica removed) from 18-day old mouse pups (C57BL/6) were disrupted using forceps and a razor blade in 1 mL of 1× phosphate-buffered saline with protease inhibitors (05896988001, Roche Complete Ultra). The cell suspension was then gently added to a 15-mL conical tube with 5 mL of 1× phosphate-buffered saline with protease inhibitors and allowed to settle. After approximately 3 min, 5 1-mL aliquots of the cell suspension were places in 1.5-mL microcentrifuge tubes and centrifuged at 9000 RPM for 10 min. The supernatant was then aspirated, and the pellets were combined in 0.5 mL of 1× phosphate-buffered saline per testes. 50-100 μL of the cell suspension were added to clean, #1.5, 25-mm-diameter round coverslips and allowed to sit for 30 min. The coverslips with cells were then fixed in 4% paraformaldehyde for 15 min at room temperature. The samples were then washed with 1× phosphate-buffered saline 3 times, and immunofluorescence staining was performed using rabbit anti-SYCP3 primary antibody (ab15092, Abcam) at 1:1000 dilution, and goat anti-rabbit ATTO 647N secondary antibody (40839, Sigma-Aldrich) at 1:1000.
Golgi Apparatus
HeLa cells were fixed with 4% paraformaldehyde for 15 min at room temperature. Indirect immunofluorescence was carried out using anti-GM130 (610822, BD Transduction Laboratories, 1:500) and anti-ßCOP33 (1:500) and secondary antibodies conjugated with ATTO 594 (76085, Sigma-Aldrich) and ATTO 647N (40839, Sigma-Aldrich).
ER + mitochondrion
COS-7 cells growing on #1.5, 25-mm-diameter round precision coverslip were transfected with mEmerald-Sec61-C-18, a gift from Michael Davidson (54249, Addgene plasmid) using Lipofectamine 2000 (11668019, Invitrogen). The next day, the cells were fixed with fresh 3% paraformaldehyde (15710, Electron Microscopy Sciences), 0.1% glutaraldehyde (16019, Electron Microscopy Sciences) in phosphate-buffered saline for 15 min at room temperature. The endoplasmic reticulum (ER) was labeled with mouse anti-GFP (A11120, Invitrogen, 1:500), and mitochondria were labeled with rabbit anti-TOM20 (11415, Santa Cruz Biotechnology, 1:1000) primary antibodies at 4 °C overnight. Secondary antibodies anti-mouse ATTO 594 (76085, Sigma-Aldrich) and anti-rabbit ATTO 647N (40839, Sigma-Aldrich) were used at 1:1000.
Tissue Sample Preparation
Drosophila egg chamber
Ovaries from w1118 (RRID:BDSC_3605) were dissected in IMADS buffer (ionically matched Drosophila saline34) and fixed for 5 min in 4% paraformaldehyde in phosphate-buffered saline with 0.6% Triton X-100. Fixed tissue was washed in PBT (phosphate-buffered saline with 0.6% Triton X-100 and 0.5% BSA) and incubated with a 1:10 anti-HtsRC (655 4B, Developmental Studies Hybridoma Bank, RRID:AB_528289)35. Secondary antibodies used were goat anti-mouse conjugated to ATTO 647N (50185, Sigma-Aldrich, 1:500). F-actin was labeled with phalloidin conjugated to ATTO 594 (51927, Sigma-Aldrich, 1:500).
Mouse hippocampal sections
All experiments were carried out in accordance with NIH guidelines and approved by the Tuft Institutional Animal Care and Use Committee. All mice were between P30-P35 and maintained in the vivarium with a 12-hour light/dark cycle, stable temperature at 22±1 °C and humidity between 20% and 50%. Wild-type (C57BL/6) adult male mice were transcardially perfused first with ice-cold phosphate-buffered saline and then with 4% paraformaldehyde (in phosphate-buffered saline, pH 7.4). Brains were isolated and post-fixed overnight in 4% PFA and subsequently washed and stored in phosphate-buffered saline (all at 4 °C). Brains were mounted in ice-cold phosphate-buffered saline and coronally sectioned at 30 μm using a vibrating microtome (Vibratome 1500, Harvard Apparatus). Sections were stored in phosphate-buffered saline at 4 °C. Medial hippocampal slices were selected and washed four times for 15 min in phosphate-buffered saline at room temperature. Next, non-specific antibody binding sites were blocked with 3% normal horse serum and 0.1% Triton-X 100 in phosphate-buffered saline for 2 hours at room temperature. Tissues were incubated sequentially with primary and secondary antibodies at 4 °C for 48-72 hours and overnight, respectively. Presynaptic monoclonal mouse anti-Bassoon (SSP7F407, Enzo; 1:500; RRID: AB 2313991) and postsynaptic polyclonal rabbit anti-Homer1 (160 003, Synaptic Systems GmbH; 1:500; RRID: AB 887730) were used as primary antibodies. Goat anti-mouse IgG antibodies conjugated with ATTO 594 (76085, Sigma-Aldrich; 1:500) and goat anti-rabbit IgG antibodies labeled with ATTO 647N (40839, Sigma-Aldrich; 1:500) were used for secondary antibody labeling. All primary and secondary antibodies were diluted in 3% normal horse serum and 0.1% Triton-X 100 in phosphate-buffered saline. After the incubation steps, sections were extensively washed in phosphate-buffered saline and then floated onto 25-mm-diameter precision glass coverslips in distilled water. All coverslips were first sonicated (Branson 2510 Ultrasonic Cleaner, Marshall Scientific) in 1 M potassium hydroxide for 15 min and then washed generously and allowed to dry. The coverslip opposite to the coverslip holding the specimen was treated with ~80 μL of poly-L-lysine for 15 min at room temperature. After aspirating off the bead dilution, the coverslips were sandwiched into a mounting ring using mounting medium (CFM-3, Citifluor). A thin coat of clear nail polish was used to seal the coverslips into the mounting ring.
Mouse cerebellar sections
All experiments were carried out in accordance with NIH guidelines and approved by the Yale Institutional Animal Care and Use Committee. All mice were between P30-P35 and maintained in the vivarium with a 12-hour light/dark cycle, temperature stable at 22±1 °C and humidity between 20% and 50%. PFA-fixed mouse cerebellum was sectioned at 30 μm using a Leica VT1000 vibratome. Sections were permeabilized at room temperature on a rocking platform with 0.3% NP40, 0.05% TX-100, and 0.1% BSA in phosphate-buffered saline for 5 minutes. Sections were then blocked at room temperature on a rocking platform with 0.05% NP40, 0.05% TX-100, and 5% normal serum in phosphate-buffered saline for 1 hour. A monoclonal antibody raised in rabbit against Calbindin (13176, Cell Signaling Technologies; 1:100; RRID: AB_2687400) and goat anti-rabbit IgG ATTO 647N (40839, Sigma-Aldrich; 1:200) were used for primary and secondary antibody labeling overnight at 4 °C, respectively.
Sample Mount
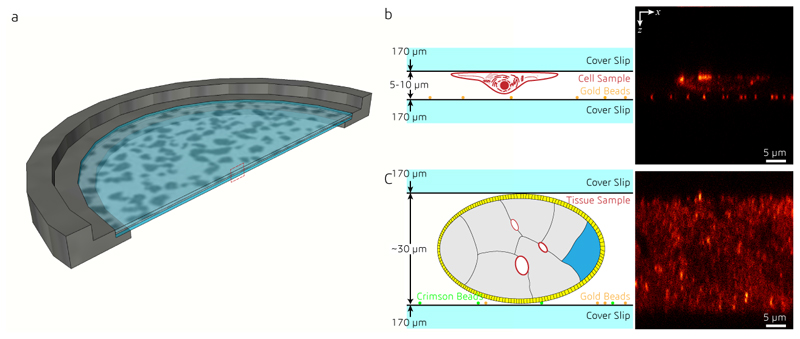
All samples were mounted between two 25-mm-diameter, 170-μm-thick coverslips (0117650, Superior Marienfeld) at 5-30 μm separation (see Extended Data Fig. 5). 150-nm-diameter gold beads were pre-deposited onto the bottom coverslip, acting as the reference for the objective alignment during the experiment. For fluorescent beads and cell samples, mounting medium (Prolong Diamond, Thermo Fisher Scientific) was applied to supply anti-fade protection and to narrow the RI difference between the sample and the silicone oil. After mounting, a custom-designed ring was used to hold the coverslips, and the gap between them was sealed using a two-component silicone (Twinsil 22, Picodent).
Drift Correction
Focus-Lock Module
A focus-lock module is integrated into the nanoscope to stabilize the objective alignment. A 980-nm-wavelength CW laser is merged with the other beams via a dichroic mirror (ZT1064rdc-sp, Chroma) in the top arm of the interference cavity. The beam is focused by the upper objective, collected again by the lower objective and is separated from the common beam path by another dichroic mirror of the same type in the bottom arm. Before being focused by a 400-mm-focal-length lens onto a camera (DCC1545Mz, Thorlabs), the beam is modulated by a weak cylindrical lens (LJ1144RM-B, Thorlabs) to add astigmatism. The position and the shape of the focal spot are recorded, and monitored during the imaging. Specifically, the position of the spot reflects the relative positions of the objectives in x and y directions, while the spot shape is used for alignment in z direction. Spot position and shape are automatically analyzed and, when changes are detected, the piezo objective stages are translated to compensate for them using a proportional–integral–derivative (PID) control loop programmed in LabVIEW. The application of the focus-lock module enables long-term (>3 hours) imaging. Notably, as the laser power of the alignment laser is very low (< 5 μW), and the wavelength is far beyond the excitation spectrum, there is no visible impact to the sample or image when the focus-lock module is on.
Sample Drift
While sample drift is negligible in most experiments, cross-correlation is applied occasionally as an effective post-processing algorithm to correct for small sample drift. The whole dataset is split into n frames along the z-axis. The 2D cross-correlation is calculated between two contiguous frames, and the second frame is shifted accordingly to match the correlation peak and compensate sample drift in x- and y-directions.
Photobleaching
We imaged ATTO 647N immunolabeled microtubules in COS-7 cells. For each imaged region, we acquired ten consecutive 3D data stacks and added them up along the z-axis (see Extended Data Fig. 4a). Fluorescence intensities of five filaments and a background region were extracted for each data set, and the background level was subtracted from the averaged fluorescence intensities using custom code programmed in Matlab 2018b. Stacks were imaged in five different regions and the normalized photobleaching curves were averaged and the standard deviations calculated (see Extended Data Fig. 4b). We observed that the fluorescent signals decreased to approximately 30% after five consecutive 3D volume acquisitions. All data were acquired with 30 line accumulations, ~10 μW of the 650 nm laser, and ~60 mW of the 775 nm laser (power measured at the back pupil of the objective). Z-stacks were acquired from 50 optical sections at 20 nm intervals. All images are 10×10 μm2 with 512x512 pixels.
Depth-dependent Resolution
To measure the resolution of AO isoSTED at different z-positions in tissue, we imaged calbindin, which was immunolabeled with ATTO 647N, in a 30-μm-thick mouse cerebellum tissue at 4 depths with 5 μm intervals (see Extended Data Fig. 10a). For resolution estimation, we used the Fiji plugin of image decorrelation analysis36. The resolution was averaged over three images for each depth. It remained remarkably constant and varied only between 38.9 and 40.5 nm (see Extended Data Fig. 10b), about 8-fold better than the resolution obtained in confocal microscopy mode (307 nm) in the same regions. The used image decorrelation analysis algorithm employed here does not consider the possible presence of artifacts with high spatial frequency support in the image which could theoretically result in erroneously high resolution values. However, the fact that STED and confocal resolution measurements were obtained from the same sample region imaged with the same instrument and that the measured confocal was within expectations, builds confidence that high spatial frequency image artifacts did not dominate these resolution measurements. All data were acquired with 200-line accumulations, about 10 μW of the 650-nm excitation laser, and about 60 mW of the 775-nm depletion laser (power measured at the back aperture of the objective). All images are 12.8×12.8 μm2 with 1024×1024 pixels.
Image Processing and Visualization
Image data was recorded with custom-programmed LabVIEW software (see above). A 2D Gaussian smoothing filter (σ = 1 pixel) was applied to the data shown in Figure 2b. None of the other data was smoothed. No deconvolution algorithms were applied to any of the shown data. The freely available software package Fluorender (version 2.22.3, https://www.sci.utah.edu/software/fluorender.html) was applied for image rendering.
Extended Data
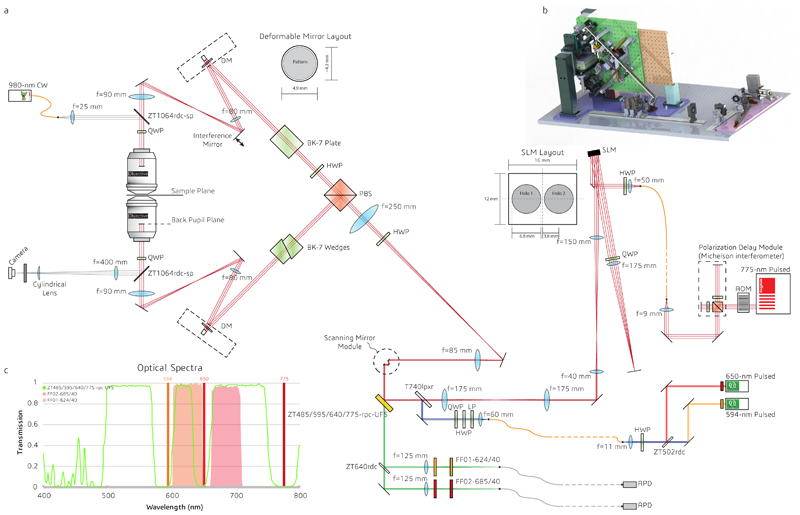
Extended Data Fig. 1. Design of isoSTED nanoscope.
(a) System layout. The system is built from the following components: excitation lasers (594 nm, 650 nm), depletion laser (775 nm), acousto-optic modulator (AOM), polarization-maintaining single-mode fibers (curvy orange lines), multi-mode fibers (curvy grey lines), half-wave plate (HWP), quarter-wave plate (QWP), spatial light modulator (SLM), scanning mirror module (including one resonant mirror and two galvanometer mirrors), polarizing beam splitter (PBS), dichroic mirrors, lenses, mirrors, bandpass filters, avalanche photo diodes (APDs), and control electronics. (b) CAD rendering of the isoSTED instrument. (c) Transmission spectra of the detection bandpass filters and the custom-made quad-bandpass dichroic mirror (highlighted in yellow in (a)).
Extended Data Fig. 2. Quantification of 3D resolution.
Crimson fluorescent beads with 20 nm diameter were imaged in isoSTED mode. One-dimensional Lorentzian functions were fitted to images of isolated beads in both x and z directions. The full-width-half-maximum (FWHM) of the fitted functions are marked above each bead image. The numbers in green and red indicate the corresponding FWHMs in lateral (x) and axial (z) directions, respectively. All images are normalized to their peak intensities.
Extended Data Fig. 3. Effects of refractive index mismatch on the depletion and effective PSF.
The presence of refractive index mismatch between the silicone oil (ns) and the sample mounting medium (ni) causes the appearance of depth dependent side-lobes in the effective PSFs, even when correcting for piston. In addition, the main lobe of the effective PSF also shifts as a function of depth. All results are calculated for ns= 1.406 and ni = 1.33.
Extended Data Fig. 4. Relative fluorescence intensity of ten consecutive 3D data stacks.
(a) Sum projections of a representative series of ten 3D data stacks consecutively recorded of the same cell region (N=5 cell regions). A photobleaching curve is extracted for each series. (b) Photobleaching as a function of iterations. Data points and error bars represent the mean values of five different data sets and their standard deviations, respectively.
Extended Data Fig. 5. Sample holder design.
The specimens are mounted on a ring-shaped sample holder (a), between two coverslips at 5-10 μm (b, cells) or ~30 μm (c, tissue) distance. 100-nm gold beads are sparsely deposited onto the bottom coverslip for use during the aberration correction.
Extended Data Fig. 6. Magnified Fig. 1e for better visualization.
Extended Data Fig. 7. Magnified Fig. 3b for better visualization.
Extended Data Fig. 8. Magnified Fig. 3i for better visualization.
Extended Data Fig. 9. Magnified Fig. 3m for better visualization.
Extended Data Fig. 10. isoSTED and confocal images of calbindin in mouse cerebellar sections at different depths (z).
(a) xy cross sections of isoSTED and confocal microscopy (CM) images at different depths. (b) Resolution at different depths (n = 3 independent experiments). Data points and error bars represent the mean values of three different data sets and the respective standard deviation. An equivalent analysis of the CM images yields an average resolution of 307 nm.
Supplementary Material
Supplementary information is available in the online version of the paper.
Video rendering of the data shown in Fig. 2a. One-color image of synaptonemal complexes (SYCP1 immunolabeled with ATTO 647N).
Video rendering of the data shown in Fig. 2e. Two-color image of COPI vesicles (βCOP immunolabeled with ATTO 647N) and Golgi apparatus (GM130 immunolabeled with ATTO 594).
Video rendering of the data shown in Fig. 2j. Two-color image of ER (Sec61β immunolabeled with ATTO 594) and mitochondria (TOM20 immunolabeled with ATTO 647N).
Video rendering of the data shown in Fig. 3d. Two-color image of F-actin (immunolabeled with ATTO 594) and HtsRC (immunolabeled with ATTO 647N).
Video rendering of the data shown in Fig. 3j. Two-color image of presynaptic active zone marker Bassoon (immunolabeled with ATTO 594) and postsynaptic scaffolding molecule Homer1 (immunolabeled with ATTO 647N).
Editor’s summary
The combination of adaptive optics with an improved isoSTED nanoscope allows imaging of cells and tissues with sub-50 nm isotropic resolution.
Editor recognition statement
Rita Strack was the primary editor on this article and managed its editorial process and peer review in collaboration with the rest of the editorial team.
Reviewer recognition statement
Nature Methods thanks the anonymous reviewer(s) for their contribution to the peer review of this work.
Acknowledgments
We thank Dr. George Sirinakis, now at the University of Cambridge, Dr. Yongdeng Zhang, now at the Westlake University, Andrew E. S. Barentine, and Dr. Mary Grace Velasco, now at the Abberior Instruments, and Dr. Emil B. Kromann, now at the Technical University of Denmark, from Yale University, for sharing the source code and fruitful discussions. We also thank Dr. Yong Wang at the University of Utah for technical support with FluoRender. This work was supported by the Wellcome Trust (095927/A/11/Z to J. B. and J. R.; 095927/B/11/Z to M. B., 203285/B/16/Z to J. R.; 203285/C/16/Z to M. B.), the G. Harold & Leila Y. Mathers Foundation to J. B., the National Institutes of Health (P30 DK045735 to J. B.; R01 GM043301 to L.C.; R01 DA018928 to T.B.) and the European Research Council (AdOMiS, No. 695140) to M. B.
Footnotes
Author contributions
X. H., E. A., and J. B. designed the instrument. X. H., E. A., J. A., and D. L. built the instrument and developed the software. X. H., J. A., J. Z., and M. B. developed and optimized the adaptive optics strategy. X. H., D. L., and E. A. optimized and tested the instrument. K. W., J. G., L. S., F. B., P. K., M. L., J. R., L. C., T. B., and J. B. designed the biological experiments. K. W., J. G., L. S., F. B., P. K., and M. L. optimized the sample preparation protocols and prepared the samples. X. H., D. L., M. L., and J. B. visualized the data. All authors contributed to writing the manuscript.
Reprints and permissions information is available online at www.nature.com/reprints
Competing financial interests
J. B. discloses a significant financial interest in Bruker Corp. and Hamamatsu Photonics.
Data Availability
Datasets generated and/or analyzed in this study are available from J. B. (the corresponding author) upon request.
Code Availability
The data collection and analysis software is available on https://github.com/bewersdorflab/isoSTED, or from J. B. (the corresponding author) upon request.
References
- 1.Abbe E. Beiträge zur Theorie des Mikroskops und der mikroskopischen Wahrnehmung. Archiv für mikroskopische Anatomie. 1873;9:413–468. [Google Scholar]
- 2.Hell SW. Far-Field Optical Nanoscopy. Science. 2007;316:1153–1158. doi: 10.1126/science.1137395. [DOI] [PubMed] [Google Scholar]
- 3.Hell S, Stelzer EHK. Properties of a 4pi Confocal Fluorescence Microscope. J Opt Soc Am A. 1992;9:2159–2166. [Google Scholar]
- 4.Bewersdorf J, Schmidt R, Hell SW. Comparison of I5M and 4Pi-microscopy. J Microsc. 2006;222:105–117. doi: 10.1111/j.1365-2818.2006.01578.x. [DOI] [PubMed] [Google Scholar]
- 5.Gugel H, et al. Cooperative 4Pi excitation and detection yields sevenfold sharper optical sections in live-cell microscopy. Biophys J. 2004;87:4146–4152. doi: 10.1529/biophysj.104.045815. [DOI] [PMC free article] [PubMed] [Google Scholar]
- 6.Schmidt R, et al. Spherical nanosized focal spot unravels the interior of cells. Nat Methods. 2008;5:539–544. doi: 10.1038/nmeth.1214. [DOI] [PubMed] [Google Scholar]
- 7.Dyba M, Hell SW. Focal spots of size λ/23 open up far-field fluorescence microscopy at 33 nm axial resolution. Phys Rev Lett. 2002;88 doi: 10.1103/PhysRevLett.88.163901. [DOI] [PubMed] [Google Scholar]
- 8.Böhm U, Hell SW, Schmidt R. 4Pi-RESOLFT nanoscopy. Nat Commun. 2016;7:10504. doi: 10.1038/ncomms10504. [DOI] [PMC free article] [PubMed] [Google Scholar]
- 9.Shtengel G, et al. Interferometric fluorescent super-resolution microscopy resolves 3D cellular ultrastructure. Proc Natl Acad Sci USA. 2009;106:3125–3130. doi: 10.1073/pnas.0813131106. [DOI] [PMC free article] [PubMed] [Google Scholar]
- 10.Aquino D, et al. Two-color nanoscopy of three-dimensional volumes by 4Pi detection of stochastically switched fluorophores. Nat Methods. 2011;8:353–359. doi: 10.1038/nmeth.1583. [DOI] [PubMed] [Google Scholar]
- 11.Huang F, et al. Ultra-High Resolution 3D Imaging of Whole Cells. Cell. 2016;166:1–13. doi: 10.1016/j.cell.2016.06.016. [DOI] [PMC free article] [PubMed] [Google Scholar]
- 12.Curdt F, et al. isoSTED nanoscopy with intrinsic beam alignment. Opt Express. 2015;23:30891–30903. doi: 10.1364/OE.23.030891. [DOI] [PubMed] [Google Scholar]
- 13.Blom H, Widengren J. Stimulated Emission Depletion Microscopy. Chem Rev. 2017;117:7377–7427. doi: 10.1021/acs.chemrev.6b00653. [DOI] [PubMed] [Google Scholar]
- 14.Lenz MO, et al. 3-D stimulated emission depletion microscopy with programmable aberration correction. J Biophotonics. 2014;7:29–36. doi: 10.1002/jbio.201300041. [DOI] [PubMed] [Google Scholar]
- 15.Booth MJ. Adaptive optical microscopy: the ongoing quest for a perfect image. Light-Sci Appl. 2014;3:e165. [Google Scholar]
- 16.Hao X, Antonello J, Allgeyer ES, Bewersdorf J, Booth MJ. Aberrations in 4Pi Microscopy. Opt Express. 2017;25:14049–14058. doi: 10.1364/OE.25.014049. [DOI] [PMC free article] [PubMed] [Google Scholar]
- 17.Hao X, Allgeyer ES, Booth MJ, Bewersdorf J. Point-spread function optimization in isoSTED nanoscopy. Opt Lett. 2015;40:3627–3630. doi: 10.1364/OL.40.003627. [DOI] [PubMed] [Google Scholar]
- 18.Barentine AES, Schroeder LK, Graff M, Baddeley D, Bewersdorf J. Simultaneously Measuring Image Features and Resolution in Live-Cell STED Images. Biophys J. 2018;115:951–956. doi: 10.1016/j.bpj.2018.07.028. [DOI] [PMC free article] [PubMed] [Google Scholar]
- 19.Baddeley D, Carl C, Cremer C. 4Pi microscopy deconvolution with a variable point-spread function. Appl Opt. 2006;45:7056–7064. doi: 10.1364/ao.45.007056. [DOI] [PubMed] [Google Scholar]
- 20.Gould TJ, Burke D, Bewersdorf J, Booth MJ. Adaptive optics enables 3D STED microscopy in aberrating specimens. Opt Express. 2012;20:20998–21009. doi: 10.1364/OE.20.020998. [DOI] [PMC free article] [PubMed] [Google Scholar]
- 21.Patton BR, et al. Three-dimensional STED microscopy of aberrating tissue using dual adaptive optics. Opt Express. 2016;24:8862–8876. doi: 10.1364/OE.24.008862. [DOI] [PubMed] [Google Scholar]
- 22.Dani A, Huang B, Bergan J, Dulac C, Zhuang X. Superresolution imaging of chemical synapses in the brain. Neuron. 2010;68:843–856. doi: 10.1016/j.neuron.2010.11.021. [DOI] [PMC free article] [PubMed] [Google Scholar]
- 23.Gao M, et al. Expansion Stimulated Emission Depletion Microscopy (ExSTED) ACS Nano. 2018;12:4178–4185. doi: 10.1021/acsnano.8b00776. [DOI] [PubMed] [Google Scholar]
- 24.Piazza S, Bianchini P, Sheppard C, Diaspro A, Duocastella M. Enhanced volumetric imaging in 2-photon microscopy via acoustic lens beam shaping. J Biophotonics. 2018;11:e201870129. doi: 10.1002/jbio.201700050. [DOI] [PubMed] [Google Scholar]
- 25.Gao R, et al. Cortical column and whole-brain imaging with molecular contrast and nanoscale resolution. Science. 2019;363:eaau8302. doi: 10.1126/science.aau8302. [DOI] [PMC free article] [PubMed] [Google Scholar]
- 26.Bottanelli F, et al. Two-colour live cell nanoscale imaging of intracellular targets. Nat Communications. 2016;7:1–5. doi: 10.1038/ncomms10778. [DOI] [PMC free article] [PubMed] [Google Scholar]
- 27.Kilian N, et al. Assessing photodamage in live-cell STED microscopy. Nat Methods. 2018;15:755–756. doi: 10.1038/s41592-018-0145-5. [DOI] [PMC free article] [PubMed] [Google Scholar]
- 28.Booth M, Wilson T, Sun HB, Ota T, Kawata S. Methods for the characterization of deformable membrane mirrors. Appl Opt. 2005;44:5131–5139. doi: 10.1364/ao.44.005131. [DOI] [PubMed] [Google Scholar]
- 29.Takeda M, Ina H, Kobayashi S. Fourier-Transform Method of Fringe-Pattern Analysis for Computer-Based Topography and Interferometry. J Opt Soc Am. 1982;72:156–160. [Google Scholar]
- 30.Herraez MA, Burton DR, Lalor MJ, Gdeisat MA. Fast two-dimensional phase-unwrapping algorithm based on sorting by reliability following a noncontinuous path. Appl Opt. 2002;41:7437–7444. doi: 10.1364/ao.41.007437. [DOI] [PubMed] [Google Scholar]
- 31.Antonello J, et al. Optimization-based wavefront sensorless adaptive optics for multiphoton microscopy. J Opt Soc Am A. 2014;31:1337–1347. doi: 10.1364/JOSAA.31.001337. [DOI] [PubMed] [Google Scholar]
- 32.Hao X, Antonello J, Allgeyer ES, Bewersdorf J, Booth MJ. Aberrations in 4Pi Microscopy. Opt Express. 2017;25:14049–14058. doi: 10.1364/OE.25.014049. [DOI] [PMC free article] [PubMed] [Google Scholar]
- 33.Duden R, Griffiths G, Frank R, Argos P, Kreis TE. β-COP, a 110 kd protein associated with non-clathrin-coated vesicles and the golgi complex, shows homology to β-adaptin. Cell. 1991;64:649–665. doi: 10.1016/0092-8674(91)90248-w. [DOI] [PubMed] [Google Scholar]
- 34.Singleton K, Woodruff RI. The osmolarity of adult Drosophila hemolymph and its effect on oocyte-nurse cell electrical polarity. Dev Biol. 1994;161:154–167. doi: 10.1006/dbio.1994.1017. [DOI] [PubMed] [Google Scholar]
- 35.Robinson DN, Cant K, Cooley L. Morphogenesis of Drosophila ovarian ring canals. Development. 1994;120:2015–2025. doi: 10.1242/dev.120.7.2015. [DOI] [PubMed] [Google Scholar]
- 36.Descloux AC, Grussmayer KS, Radenovic A. Parameter-free image resolution estimation based on decorrelation analysis. Nat Methods. 2019;16:918–924. doi: 10.1038/s41592-019-0515-7. [DOI] [PubMed] [Google Scholar]
Associated Data
This section collects any data citations, data availability statements, or supplementary materials included in this article.
Supplementary Materials
Video rendering of the data shown in Fig. 2a. One-color image of synaptonemal complexes (SYCP1 immunolabeled with ATTO 647N).
Video rendering of the data shown in Fig. 2e. Two-color image of COPI vesicles (βCOP immunolabeled with ATTO 647N) and Golgi apparatus (GM130 immunolabeled with ATTO 594).
Video rendering of the data shown in Fig. 2j. Two-color image of ER (Sec61β immunolabeled with ATTO 594) and mitochondria (TOM20 immunolabeled with ATTO 647N).
Video rendering of the data shown in Fig. 3d. Two-color image of F-actin (immunolabeled with ATTO 594) and HtsRC (immunolabeled with ATTO 647N).
Video rendering of the data shown in Fig. 3j. Two-color image of presynaptic active zone marker Bassoon (immunolabeled with ATTO 594) and postsynaptic scaffolding molecule Homer1 (immunolabeled with ATTO 647N).
Data Availability Statement
Datasets generated and/or analyzed in this study are available from J. B. (the corresponding author) upon request.
The data collection and analysis software is available on https://github.com/bewersdorflab/isoSTED, or from J. B. (the corresponding author) upon request.


