Abstract
Glycemic traits are used to diagnose and monitor type 2 diabetes, and cardiometabolic health. To date, most genetic studies of glycemic traits have focused on individuals of European ancestry. Here, we aggregated genome-wide association studies in up to 281,416 individuals without diabetes (30% non-European ancestry) with fasting glucose, 2h-glucose post-challenge, glycated hemoglobin, and fasting insulin data. Trans-ancestry and single-ancestry meta-analyses identified 242 loci (99 novel; P<5x10⁻⁸), 80% with no significant evidence of between-ancestry heterogeneity. Analyses restricted to European ancestry individuals with equivalent sample size would have led to 24 fewer new loci. Compared to single-ancestry, equivalent sized trans-ancestry fine-mapping reduced the number of estimated variants in 99% credible sets by a median of 37.5%. Genomic feature, gene-expression and gene-set analyses revealed distinct biological signatures for each trait, highlighting different underlying biological pathways. Our results increase understanding of diabetes pathophysiology by use of trans-ancestry studies for improved power and resolution.
Fasting glucose (FG), 2h-glucose post-challenge (2hGlu), and glycated hemoglobin (HbA1c) are glycemic traits used to diagnose diabetes1. In addition, HbA1c is the most commonly used biomarker to monitor glucose control in patients with diabetes. Fasting insulin (FI) reflects a combination of insulin secretion and insulin resistance, both components of type 2 diabetes (T2D), and insulin clearance2. Collectively, all four glycemic traits are useful to better understand T2D pathophysiology3–5 and cardiometabolic outcomes6.
To date, genome-wide association studies (GWAS) and analysis of Metabochip and exome arrays have identified >120 loci associated with glycemic traits in individuals without diabetes7–15. However, despite considerable differences in the prevalence of T2D risk factors across ancestries16–18, most glycemic trait GWAS have insufficient representation of individuals of non-European ancestry. Additionally, they have limited resolution for fine-mapping of causal variants and for effector transcript identification. Here, we present large-scale trans-ancestry meta-analyses of GWAS for four glycemic traits in individuals without diabetes. We aimed to identify additional glycemic trait-associated loci; investigate the portability of loci and genetic scores across ancestries; leverage differences in effect allele frequency (EAF), effect size, and linkage disequilibrium (LD) across diverse populations to conduct fine-mapping and aid causal variant/effector transcript identification; and compare the genetic architecture of glycemic traits to further identify the cell-types and target tissues most influenced by these traits which inform T2D pathophysiology.
Results
Study design and definitions
To identify loci associated with glycemic traits FG, 2hGlu, FI, and HbA1c, we aggregated GWAS in up to 281,416 individuals without diabetes, ~30% of whom were of non-European ancestry [13% East Asian, 7% Hispanic, 6% African-American, 3% South Asian, and 2% sub-Saharan African (Ugandan data only available for HbA1c)]. Each cohort imputed data to the 1000 Genomes Project reference panel19 (phase 1 v3, March 2012, or later; Methods, Supplementary Table 1, Extended Data Figure 1, Supplementary Note). Up to ~49.3 million variants were directly genotyped or imputed, with between 38.6 million (2hGlu) and 43.5 million variants (HbA1c) available for analysis after exclusions based on minor allele count (MAC < 3) and imputation quality (imputation r2 or INFO score <0.40) in each cohort. FG, 2hGlu and FI analyses were adjusted for BMI15 but for simplicity they are abbreviated as FG, 2hGlu and FI (Methods).
We first performed trait-specific fixed-effect meta-analyses within each ancestry using METAL20 (Methods). We defined “single-ancestry lead” variants as the strongest trait-associated variants (P<5x10⁻⁸) within a 1Mb region in an ancestry (Table 1). Within each ancestry and each autosome, we used approximate conditional analyses in GCTA21,22, to identify “single-ancestry index variants” (P<5x10⁻⁸) that exert conditionally distinct effects on the trait (Table 1, Methods, Supplementary Note). This approach identified 124 FG, 15 2hGlu, 48 FI and 139 HbA1c variants that were significant in at least one ancestry (Supplementary Table 2).
Table 1.
Glossary of terms - This study combined analyses of trait-associations across multiple correlated glycemic traits and across multiple ancestries, which has presented challenges in our ability to apply commonly used terms with clarity. For this reason, we define below terms often used in the field with variable meaning, as well as definitions of new terms used in this study.
| Term | Definition |
|---|---|
| EA (Effect allele) | The effect allele was that defined by METAL based on trans-ancestry FG results and aligned such that the same allele was kept as the effect allele across all ancestries and traits, irrespective of its allele frequency or effect size for that particular ancestry and trait, in this way the effect allele is not necessarily the trait-increasing allele. |
| Single-ancestry lead variant | Variant with the smallest p-value amongst all with P < 5x10⁻⁸, within a 1Mb region, based on analysis of a single trait in a single ancestry. |
| Single-ancestry index variants | Variants identified by GCTA analysis of each autosome, and that appear to exert conditionally distinct effects on a given trait in a given ancestry (P < 5x10⁻⁸). As defined, these include the single-ancestry lead variants. |
| Trans-ancestry lead variant | Variant identified by trans-ethnic meta-analysis of a given trait that has the strongest association for that trait (log10BF > 6, which is broadly equivalent to P < 5x10⁻⁸) within a 1Mb region. |
| Single-ancestry locus | 1Mb region centred on a single-ancestry lead variant which does not contain a lead variant identified in the trans-ancestry meta-analysis (i.e., does not contain a trans-ancestry lead variant). |
| Signal | Conditionally independent association between a trait and a set of variants in LD with each other and which is noted by the corresponding index variant. |
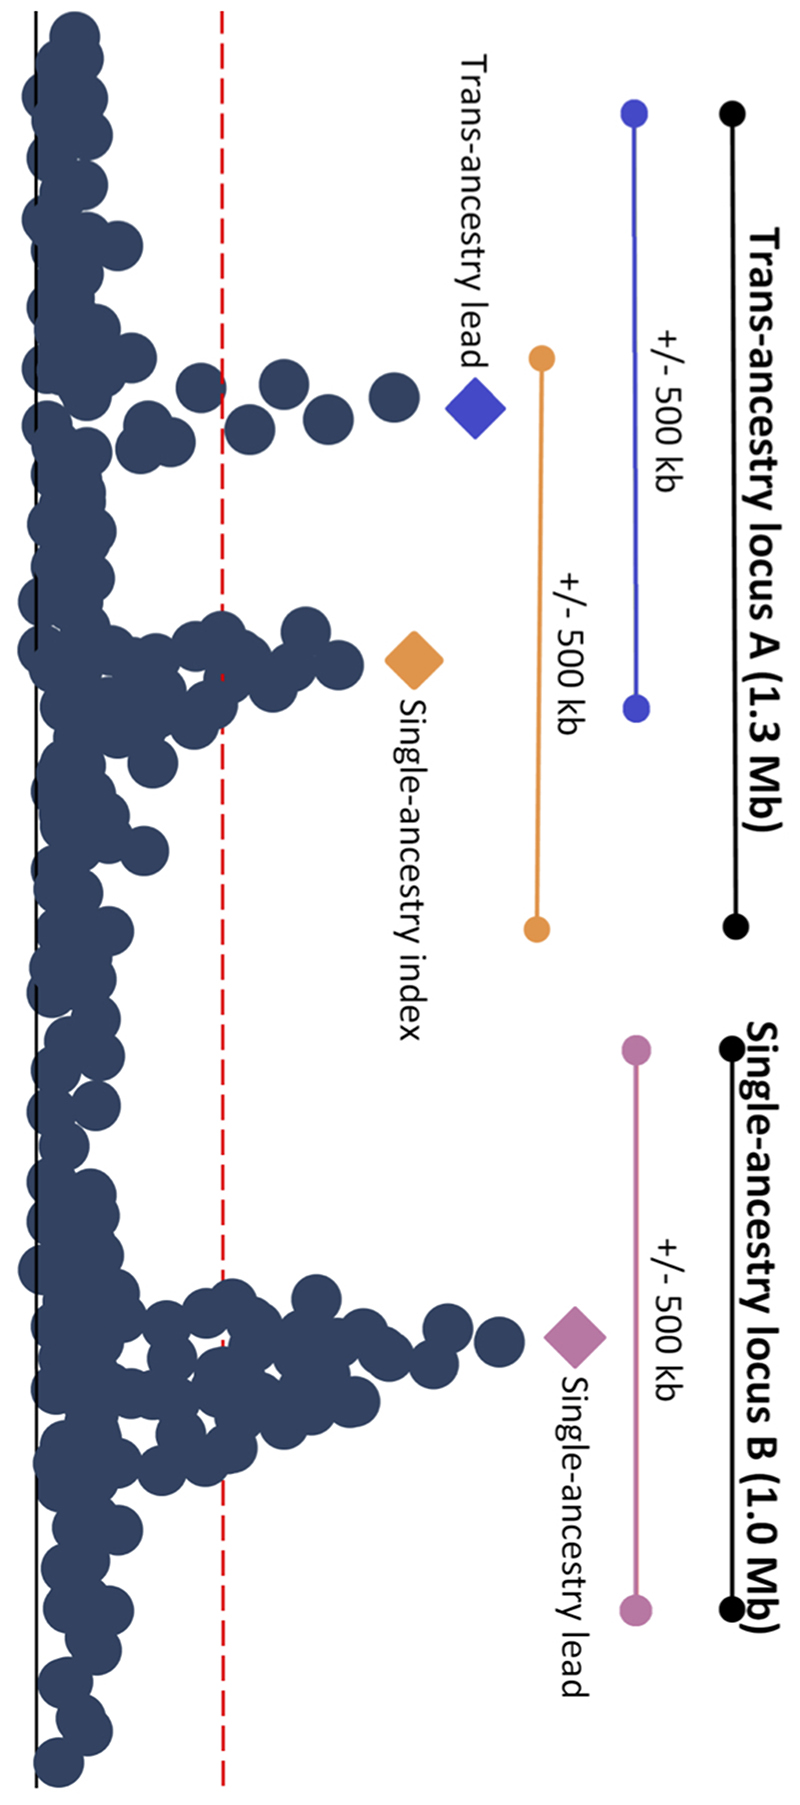
| Trans-ancestry locus | A genomic interval that contains trans-ancestry trait-specific lead variants, with/out additional single-ancestry index variants, for one or more traits. This region is defined by starting at the telomere of each chromosome and selecting the first single-ancestry index variant or trans-ancestry lead variant for any trait. If other trans-ancestry lead variants or single-ancestry index variants mapped within 500kb of the first signal, then they were merged into the same locus. This process was repeated until there were no more signals within 500kb of the previous variant. A 500kb interval was added to the beginning of the first signal, and the end of the last signal to establish the final boundary of the trans-ancestry locus (Extended Data Figure 2). As defined, a trans-ancestry locus may not have a single lead trans-ancestry variant, but may instead contain multiple trans-ancestry lead variants, one for each trait. |
Next, we conducted trait-specific trans-ancestry meta-analyses using MANTRA (Methods, Supplementary Table 1, Supplementary Note) to identify genome-wide significant “trans-ancestry lead variants”, defined as the most significant trait-associated variant across all ancestries (log10 Bayes Factor [BF] >6, equivalent to P<5x10⁻⁸)23 (Table 1, Methods). Here, we present trans-ancestry results as our primary results (Supplementary Table 2).
Causal variants are expected to affect related glycemic traits and may be shared across ancestries. Therefore, we combined all single-ancestry lead variants, single-ancestry index variants, and/or trans-ancestry lead variants (for any trait) mapping within 500Kb of each other, into a single “trans-ancestry locus” bounded by 500Kb flanking sequences (Table 1, Extended Data Figure 2). As defined, a trans-ancestry locus may contain multiple causal variants affecting one or more glycemic traits, exerting their effect in one or more ancestry.
Glycemic trait locus discovery
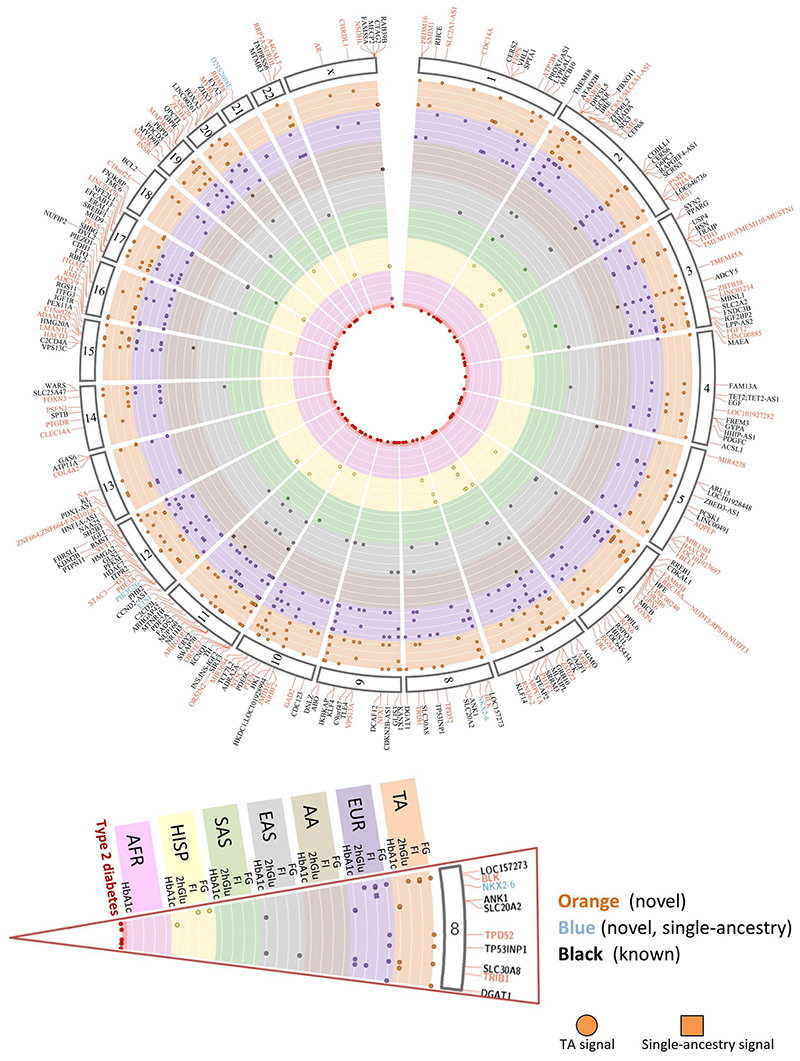
Trans-ancestry meta-analyses identified 235 trans-ancestry loci, of which 59 contained lead variants for more than one trait. In addition, we identified seven “single-ancestry loci” that did not contain any trans-ancestry lead variants (Table 1, Supplementary Table 2). Of the 242 combined loci, 99 (including 6 of the 7 single-ancestry) had not been previously associated with any of the four glycemic traits or with T2D, at the time of analysis (Figure 1, Supplementary Table 3, Supplementary note). However, based on recent East Asian and trans-ancestry T2D GWAS meta-analyses23–27, the lead variants at 27/99 novel glycemic trait loci have strong evidence of association with T2D (P<10-4; 13 loci with P<5x10⁻⁸), suggesting they are also important in T2D pathophysiology (Supplementary Tables 2 and 4).
Figure 1. Summary of all 242 loci identified in this study.
235 trans-ancestry loci are shown in orange (novel) or black (established) along with seven single-ancestry loci (blue) represented by nearest gene. Each locus is mapped to corresponding chromosome (outer segment). Each set of rows shows the results from the trans-ancestry analysis (orange) and each of the ancestries: European (purple), African American (tan), East Asian (grey), South Asian (green), Hispanic (yellow), sub-Saharan African (Ugandan-pink). Loci with a corresponding type 2 diabetes signal are represented by red circles in the middle of the plot.
Of the six single-ancestry novel loci, three were unique to non-European ancestry individuals (Supplementary Table 3). An African American association for FI (lead variant rs12056334) near LOC100128993 (an uncharacterized RNA gene; Supplementary Note), an African American association for FG (lead variant rs61909476) near ETS1 and a Hispanic association for FG (lead variant rs12315677) within PIK3C2G (Supplementary Table 3). Despite broadly similar EAF across ancestries, rs61909476 was significantly associated with FG only in African American individuals (EAF ~7%, b=0.0812 mmol/l, SE=0.01 mmol/l, P=3.9×10⁻⁸ vs EAF 10-17%, b=0-0.002 mmol/l, se=0.003-0.017 mmol/l, P=0.44-0.95 in all other ancestries, Supplementary table 2, Supplementary note). The nearest gene, ETS1, encodes a transcription factor that is expressed in mouse pancreatic β-cells, and its overexpression decreases glucose-stimulated insulin secretion in mouse islets28. Located within the PIK3C2G gene, rs12315677 has an 84% EAF in Hispanic (70-94% in other ancestries) and is significantly associated with FG in this ancestry alone (b=0.0387 mmol/l, SE=0.0075 mmol/l, P=4.0×10⁻⁸ vs b=-0.0128-0.010 mmol/l, SE=0.003-0.018 mmol/l, P=0.14-0.76 in all other ancestries, Supplementary note). In mice, deletion of Pik3c2g leads to a phenotype characterized by reduced glycogen storage in the liver, hyperlipidemia, adiposity, and insulin resistance with increasing age, or after a high fat diet29. Instances of similar EAFs but differing effect sizes between populations, could be due to genotype-by-environment or other epistatic effects. Alternatively, lower imputation accuracy in smaller sample sizes could deflate effect sizes, although imputation quality for these variants was good (average r2=0.81). Finally, the variants detected here may be in LD with ancestry-specific causal variants not interrogated here that differ in frequency across ancestries. However, we could not find evidence of rarer alleles in the cognate populations from the 1000G project (Supplementary Table 5). The final three single-ancestry loci were identified in individuals of European ancestry (Supplementary note).
Next, by rescaling the standard errors of allelic effect sizes to artificially boost the sample size of the European meta-analysis to match that of trans-ancestry meta-analysis, we determined that 21 of the novel trans-ancestry loci would not have been discovered with an equivalent sample size comprised exclusively of European ancestry individuals (Supplementary note). Their discovery was due to the higher EAF and/or larger effect size in non-European ancestry populations. In particular, two loci (near LINC00885 and MIR4278) contain East Asian and African American single-ancestry lead variants, respectively, suggesting that these specific ancestries may be driving the trans-ancestry discovery (Supplementary Tables 2-3). Combined with the three single-ancestry non-European loci described above, our results show that 24% (24/99) of novel loci were discovered due to the contribution of non-European ancestry participants, strengthening the argument for expanding genetic studies in diverse populations.
Allelic architecture of glycemic traits
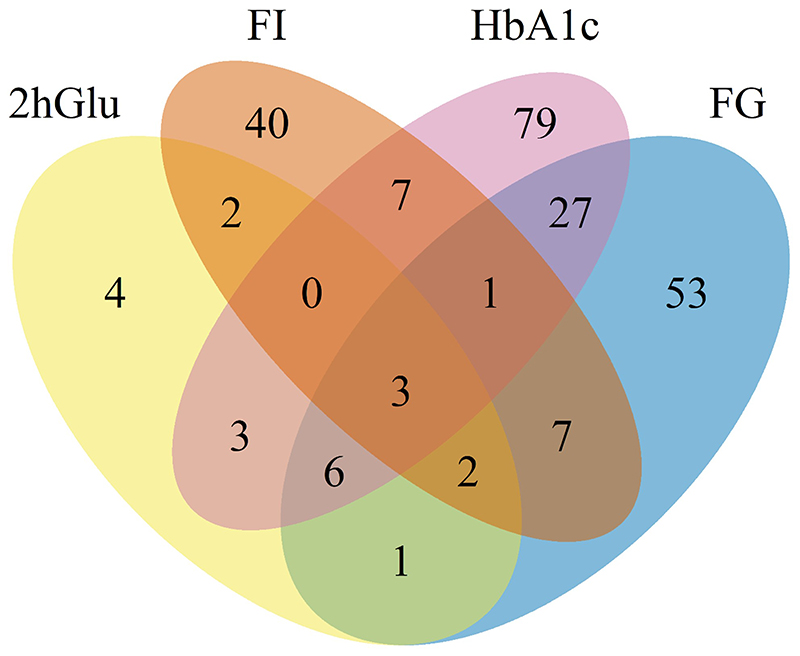
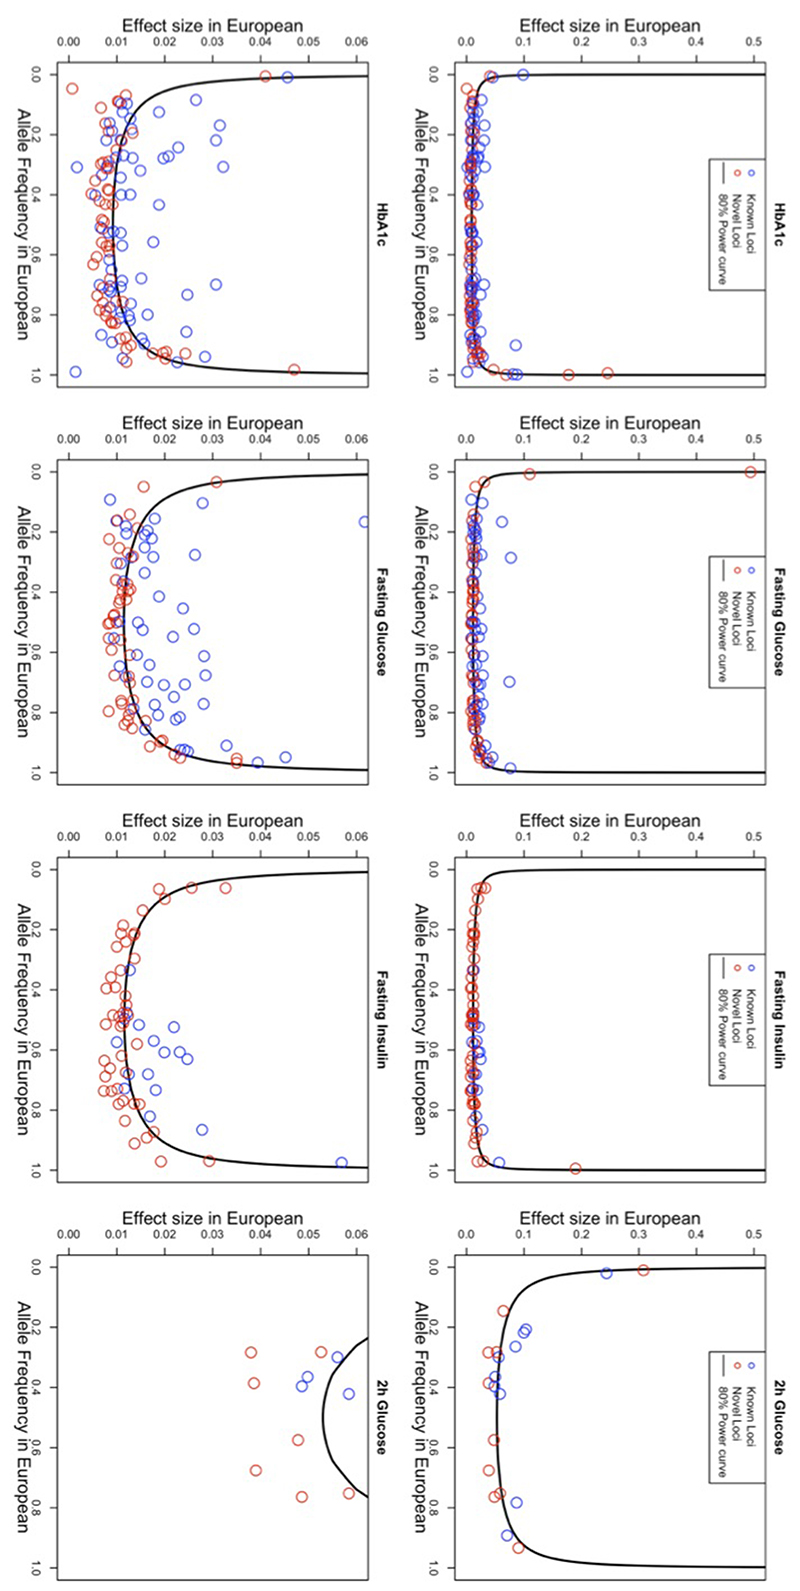
Single-ancestry and trans-ancestry results combined increased the number of established loci for FG to 102 (182 signals, 53 novel loci), FI to 66 (95 signals, 49 novel loci), 2hGlu to 21 (28 signals, 11 novel loci), and HbA1c to 127 (218 signals, 62 novel loci) (Supplementary Table 2), with significant overlap across traits (Extended Data Figure 3). We also detected (P<0.05 or log10BF>0) the vast majority (~90%) of previously established glycemic signals, 70-88% of which attained genome-wide significance (Supplementary Note, Supplementary Table 6). Given that analyses for FG, FI, and 2hGlu were performed adjusted for BMI, we confirmed that collider bias did not influence >98% of signals discovered (Supplementary note)31. As expected, given the greater power due to increased sample sizes, new association signals tended to have smaller effect sizes and/or EAFs in European ancestry individuals compared to established signals (Extended Data Figure 4).
Characterization of lead variants across ancestries
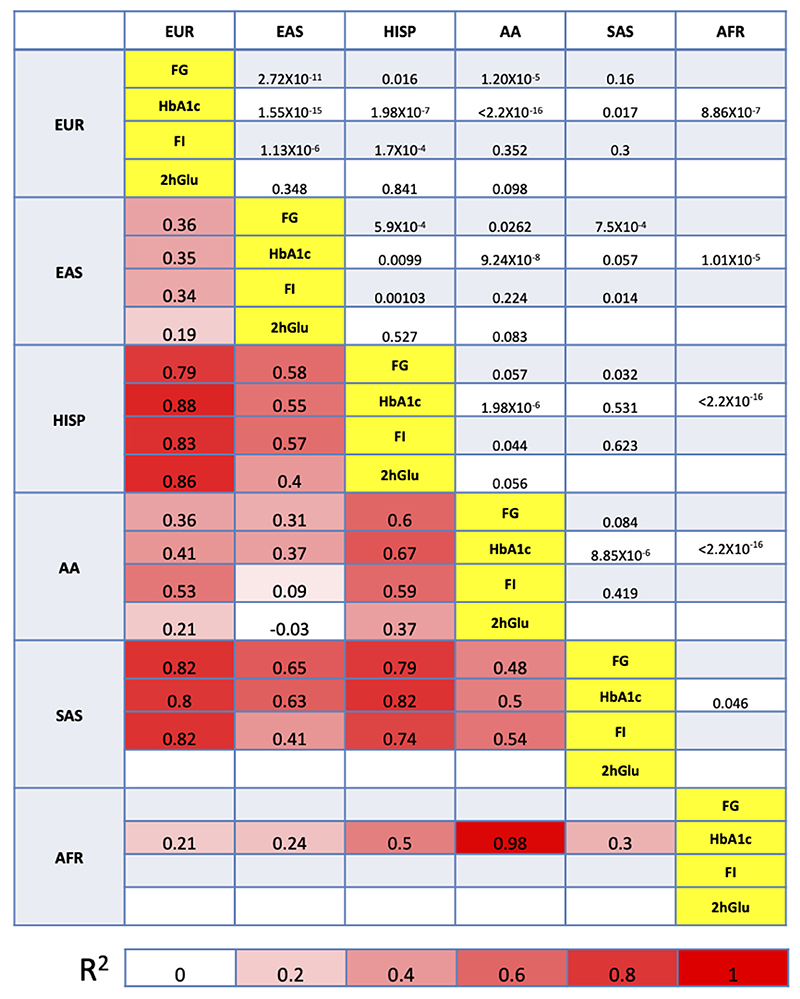
To better understand the transferability of trans-ancestry lead variants across ancestries, we investigated the pairwise EAF correlation and the pairwise summarized heterogeneity of effect sizes between ancestries32 (Methods, Supplementary Note). Consistent with population history and evolution, these results demonstrated considerable EAF correlation (ρ2>0.70) between European and Hispanic, European and South Asian, and Hispanic and South Asian populations, consistent across all four traits, and between African Americans and Ugandans for HbA1c (Extended Data Figure 5). Despite significant EAF correlations, some pairwise comparisons exhibited strong evidence for effect size heterogeneity between ancestries that was less consistent between traits (Extended Data Figure 5). However, sensitivity analyses demonstrated that, across all comparisons, the evidence for heterogeneity is driven by a small number of variants, with between 81.5% (for HbA1c) and 85.7% of trans-ancestry lead variants (for FG) showing no evidence for trans-ancestry heterogeneity (P>0.05) (Supplementary Note).
Trait variance explained by associated loci
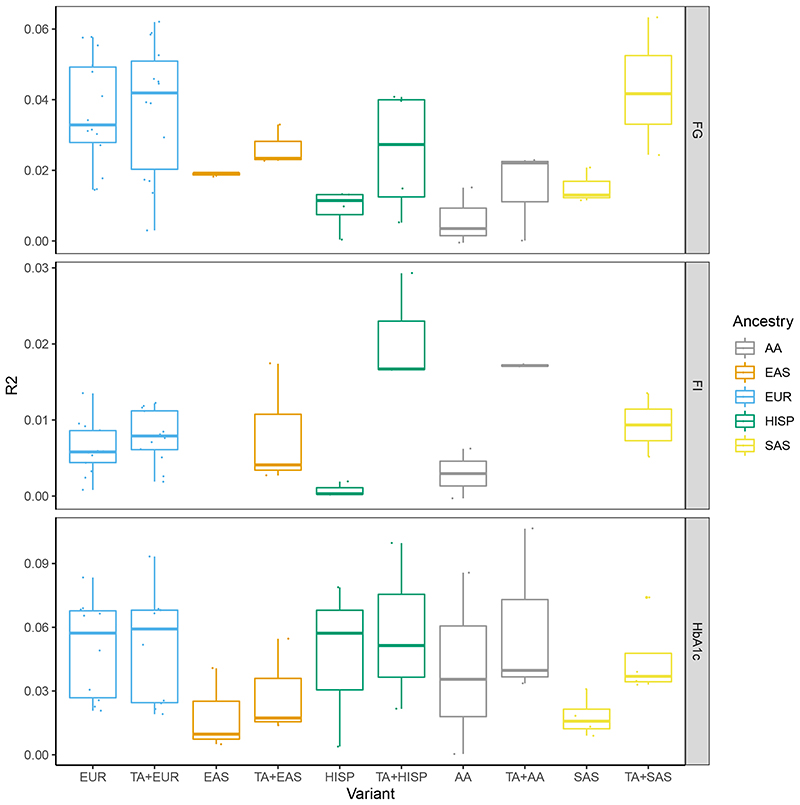
The trait variance explained by genome-wide significant loci was assessed using the single-ancestry variants only or a combination of single-ancestry and trans-ancestry variants (Supplementary Table 7) with betas extracted from the relevant single-ancestry meta-analysis results (Methods). The variance explained was assessed by linear regression in a subset of the contributing cohorts (Methods, Supplementary Tables 8-11). In general, the approach that explained the most variance was to begin with the trans-ancestry lead variants that had P<0.1 in the relevant single-ancestry meta-analysis, then add in all single-ancestry variants that were not in LD with the trans-ancestry variants (LD r2<0.1) (List C, Supplementary Tables 8-11, Figure 2). Using this approach, the mean variance in the trait distribution explained was between 0.7% (2hGlu in EUR) and 6% (HbA1c in AA). The European-based estimates explained more variance relative to previous estimates of 2.8% for FG and 1.7% for HbA1c33 (Supplementary Note).
Figure 2. Trait variance explained by associated loci.
The boxplots show the maximum, first quartile, median, third quartile and minimum of trait variance explained when using a genetic score with single-ancestry lead and index variants (EUR, AA, EAS, HISP and SAS) or a combination of individual trait trans-ancestry lead variants and single-ancestry lead and index variants (TA+EUR, TA+AA, TA+EAS, TA+HISP and TA+SAS). Variance explained for each trait (FG, FI and HbA1c) in each ancestry is shown on different panels and in different colors. Data points represent the variance explained in individual cohorts used in this analysis. R2 was estimated in 1 to 11 cohorts with sample sizes ranging from 489 to 9,758 (Supplementary Tables 8-11).
Transferability of EUR ancestry-derived polygenic scores
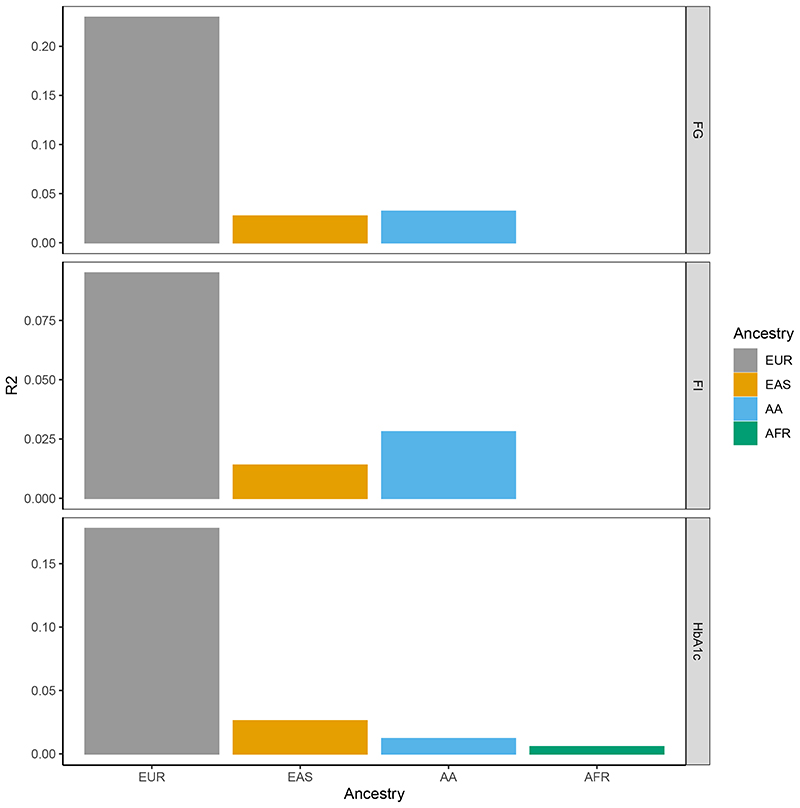
To investigate the transferability of polygenic scores across ancestries we used the PRS-CSauto software34 to first build polygenic scores for each glycemic trait based on European ancestry data. However, the training set for 2hGlu was too small so this trait was excluded. To build the polygenic scores (PGS), for each trait we first removed five of the largest European cohorts from the European ancestry meta-analysis. These five cohorts were meta-analyzed and used as our European ancestry test dataset, for each trait. The remaining European ancestry cohorts were also meta-analyzed and used as the training dataset, from which we derived a PGS for each trait (Methods). We used PRS-CSauto to revise the effect size estimates for the variants in the score (obtained from the training European datasets) based on the LD of the test population. PRS-CSauto does not have LD reference panels for South Asian or Hispanic ancestry and as such we were unable to test the transferability of the PGS into those populations. The “gtx” package35 (Methods) was used to obtain the R2 for each test population (Figure 3, Supplementary Table 12). Consistent with other complex traits36, the European ancestry-derived PGS had greater predictive power into test data of European ancestry than other ancestry groups.
Figure 3. Transferability of PGS across ancestries.
For each trait, the barplots represent trait variance explained when using a European ancestry-derived PGS in European, East Asian and African American test datasets. Variance explained (the height of each bar) for each trait (FG, FI and HbA1c) in each ancestry is shown on different panels and in different colors.
Fine-mapping
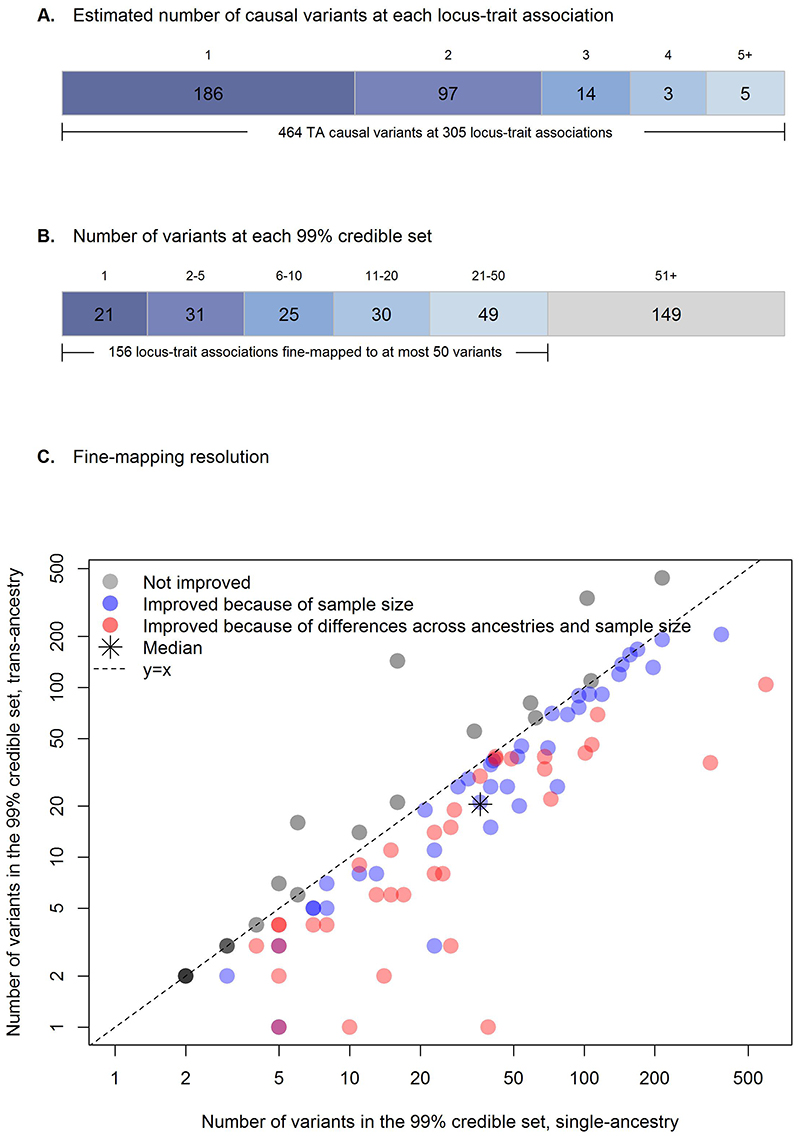
We fine-mapped, 231 trans-ancestry and six single-ancestry autosomal loci (Supplementary Table 2, Supplementary note). Using FINEMAP with ancestry-specific LD and an average LD matrix across ancestries, we conducted fine-mapping both within (161 loci with single-ancestry lead variants) and across ancestries (231 loci) for each trait (Methods). Because 59 of the 231 trans-ancestry loci were associated with more than one trait, we conducted trans-ancestry fine-mapping for a total of 305 locus-trait associations. Of these 305 locus-trait combinations, FINEMAP estimated the presence of a single causal variant at 186 loci (61%), while multiple distinct causal variants were implicated at 126 loci (39%), for a total of 464 causal variants (Figure 4A).
Figure 4. Trans-ancestry fine-mapping.
A) Number of plausible causal variants at each locus-trait association derived from FINEMAP. B) Number of variants within each 99% credible set. Twenty-one locus-trait associations at 19 loci were mapped to a single variant in the 99% credible set. C) Fine-mapping resolution. For each of the 98 locus-trait associations with a predicted single causal variant in both trans-ancestry and single-ancestry analyses, the number of variants included in the 99% credible set in the single-ancestry fine-mapping (x axis; logarithmic scale) is plotted against those in the trans-ancestry fine-mapping (y axis; logarithmic scale). Trans-ancestry and single-ancestry fine-mapping were based on the same set of variants. After removing eight locus-trait associations with one variant in the 99% credible sets in both trans-ancestry and single-ancestry analyses, there were 18 locus-trait associations (in grey) where trans-ancestry fine-mapping did not improve the resolution of fine-mapping results (i.e. number of variants in the 99% credible set did not decrease). Of the 72 locus-trait associations with improved trans-ancestry fine-mapping resolution (blue and red) further analyses in European fine-mapping emulating the total sample size in trans-ancestry fine-mapping demonstrated that 34 locus-trait associations (in red) were improved because of both total sample size and differences across ancestries, while 38 locus-trait associations (in blue) were only improved due to increased sample size in the original trans-ancestry fine-mapping analysis.
Credible sets for causal variants
At each locus, we next constructed credible sets (CS) for each causal variant that account for >=99% of the posterior probability of association (PPA). We identified 21 locus-trait associations (at 19 loci) for which the 99% CS included a single variant, and we highlight four examples (Methods, Supplementary Note, Figure 4B, Supplementary Table 13).
At MTNR1B and SIX3 we identified, respectively, rs10830963 (PPA>0.999, for both HbA1c and FG) and rs12712928 (PPA=0.997, for FG) as the likely causal variants. At both loci previous studies confirm these variants affect transcriptional activity37,38,39 (Supplementary note). At a locus near PFKM associated with HbA1c, trans-ancestry fine-mapping identified rs12819124 (PPA>0.999) as the likely causal variant. This variant has been previously associated with mean corpuscular hemoglobin40, suggesting an effect on HbA1c via the red blood cell (RBC, Supplementary note). At HBB, we identifed rs334 (PPA>0.999; Glu7Val) as the likely causal variant associated with HbA1c. rs334 is a causal variant of sickle cell anemia41, previously associated with urinary albumin-to-creatinine ratio in Caribbean Hispanic individuals42, severe malaria in a Tanzanian study population43, hematocrit and mean corpuscular volume in Hispanic/Latino populations44, and RBC distribution in Ugandan individuals45, all pointing to a variant effect on HbA1c via non-glycemic pathways.
The remaining locus-trait associations with a single variant in the 99% CS (Supplementary Table 13) point to variants that could be prioritized for functional follow-up to elucidate impact on glycemic trait physiology.
At an additional 156 locus-trait associations trans-ancestry fine-mapping identified 99% CS with 50 or fewer variants (Figure 4B, Supplementary Table 13). Consistent with the potential for >1 causal variant in a locus, 74 locus-trait associations contained 88 variants with PPA>0.90 that are strong candidate causal variants (Supplementary Table 14). For example, 10 are coding variants including several missense such as the HBB Glu7Val mentioned above, GCKR Leu446Pro, RREB1 Asp1771Asn, G6PC2 Pro324Ser, GLP1R Ala316Thr, and TMPRSS6 Val736Ala, each of which have been proposed or shown to affect gene function12,46–50. We additionally identified AMPD3 Val311Leu (PPA=0.989) and TMC6 Trp125Arg (PPA>0.999) variants associated with HbA1c which were previously detected in an exome array analysis but had not been fine-mapped with certainty due to the absence of backbone GWAS data30. Our fine-mapping now suggest these variants are likely causal and identify their cognate genes as effector transcripts.
Finally, we evaluated the resolution obtained in the trans-ancestry versus single-ancestry fine-mapping (Methods, Supplementary Note). We compared the number of variants in 99% CS across 98 locus-trait associations which, as suggested by FINEMAP, had a single causal variant in both trans-ancestry and single-ancestry analyses. Fine-mapping within and across ancestries was conducted using the same set of variants. At 8 of 98 locus-trait associations single-ancestry fine-mapping identified a single variant in the CS. In addition, at 72 of the 98 locus-trait associations, the number of variants in the 99% CS was smaller in the trans-ancestry fine-mapping (Figure 4C), which likely reflects the larger sample size and differences in LD structure, EAFs, and effect sizes across diverse populations. To quantify the estimated improvement in fine-mapping resolution attributable to the multi-ancestry GWAS, we then compared 99% CS sizes from the trans-ancestry fine-mapping to single-ancestry-specific data emulating the same total sample size by rescaling the standard errors (Methods). Of the 72 locus-trait associations with estimated improved fine-mapping in trans-ancestry analysis, resolution at 38 (53%) was improved because of the larger sample size in the trans-ancestry fine-mapping analysis (Figure 4C), and this estimated improved resolution would likely have been obtained in a European-only fine-mapping effort with equivalent sample size. However, at 34 (47%) loci, the inclusion of samples from multiple diverse populations yielded the estimated improved resolution. On average, ancestry differences led to a reduction in the median number of variants in the 99% CS from 24 to 15 variants (37.5% median reduction; Figure 4C), demonstrating the value of conducting fine-mapping across ancestries.
HbA1c Signal Classification
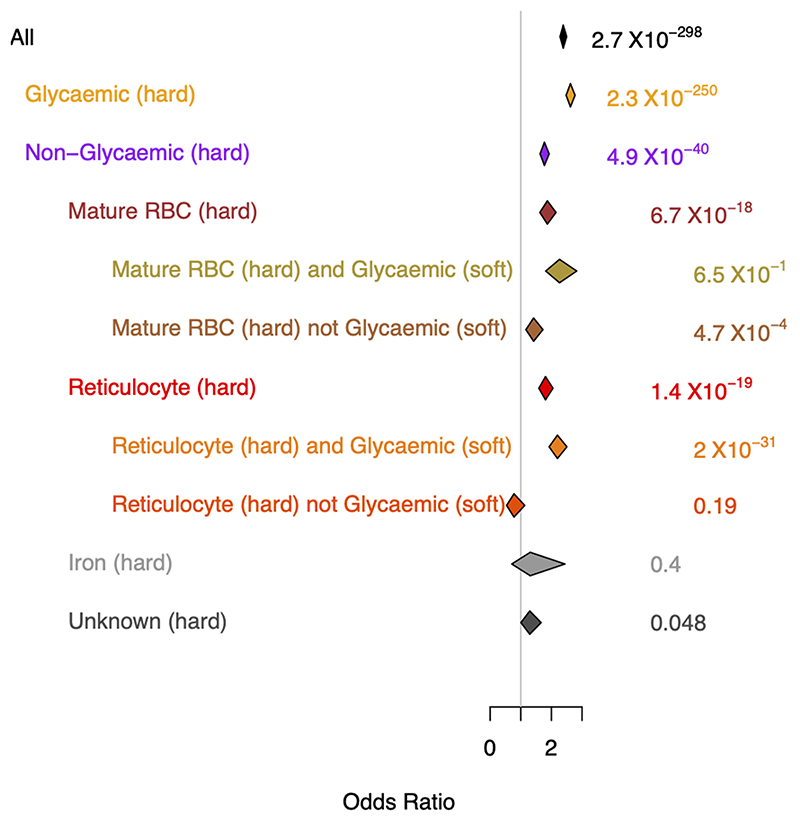
HbA1c-associated variants can exert their effects on HbA1c levels through both glycemic and non-glycemic pathways 7,51 and their correct classification can affect T2D diagnostic accuracy7,52. Using prior association results for other glycemic, RBC, and iron traits, and a fuzzy clustering approach we classified variants into their most likely mode of action (Methods, Supplementary note). Of the 218 HbA1c-associated variants, 27 (12%) could not be characterized due to missing data and 23 (11%) could not be classified into a “known” class (Supplementary note). The remaining signals were classified as principally: a) glycemic (n=53; 24%), b) affecting iron levels/metabolism (n=12; 6%), or c) RBC traits (n=103; 47%). A genetic risk score (GRS) composed of all HbA1c-associated signals was strongly associated with T2D risk (OR=2.4, 95% CI 2.3-2.5, P=2.7x10-298). However, when using partitioned GRSs composed of these different classes of variants (Methods), we found the T2D association was mainly driven by variants influencing HbA1c through glycemic pathways (OR=2.6, 95% CI 2.5-2.8, P=2.3x10-250), with weaker evidence of association (despite the larger number of variants in the GRS) and a more modest risk (OR=1.4, 95% CI 1.2-1.7, P=4.7x10⁻⁴) imparted by signals in the mature RBC cluster that were not glycemic (i.e. where those specific variants had P>0.05 for FI, 2hGlu and FG) (Extended Data Figure 6, Supplementary note). This contrasts our previous finding where we found no significant association between a risk score of non-glycemic variants and T2D7. Our current results could be partly driven by T2D cases being diagnosed based on HbA1c levels that may be influenced by the non-glycemic signals, or by glycemic effects not captured by FI, 2hGlu or FG measures.
Biological signatures of glycemic trait associated loci
To better understand distinct and shared biological signatures underlying variant-trait associations, we conducted genomic feature enrichment, eQTL co-localization, and tissue and gene-set enrichment analyses across all four traits.
Epigenomic landscape of trait-associated variants
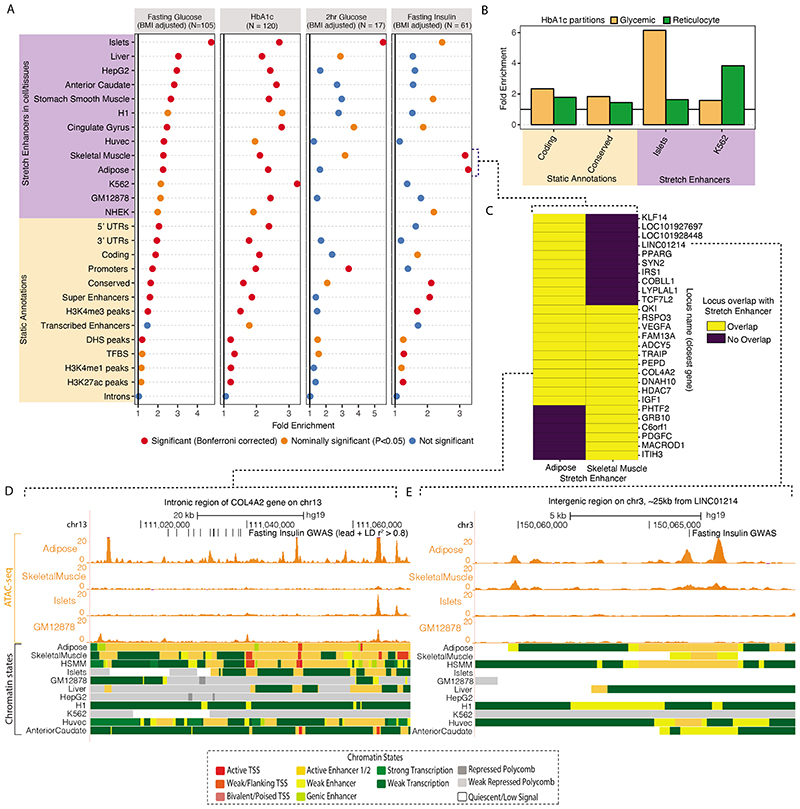
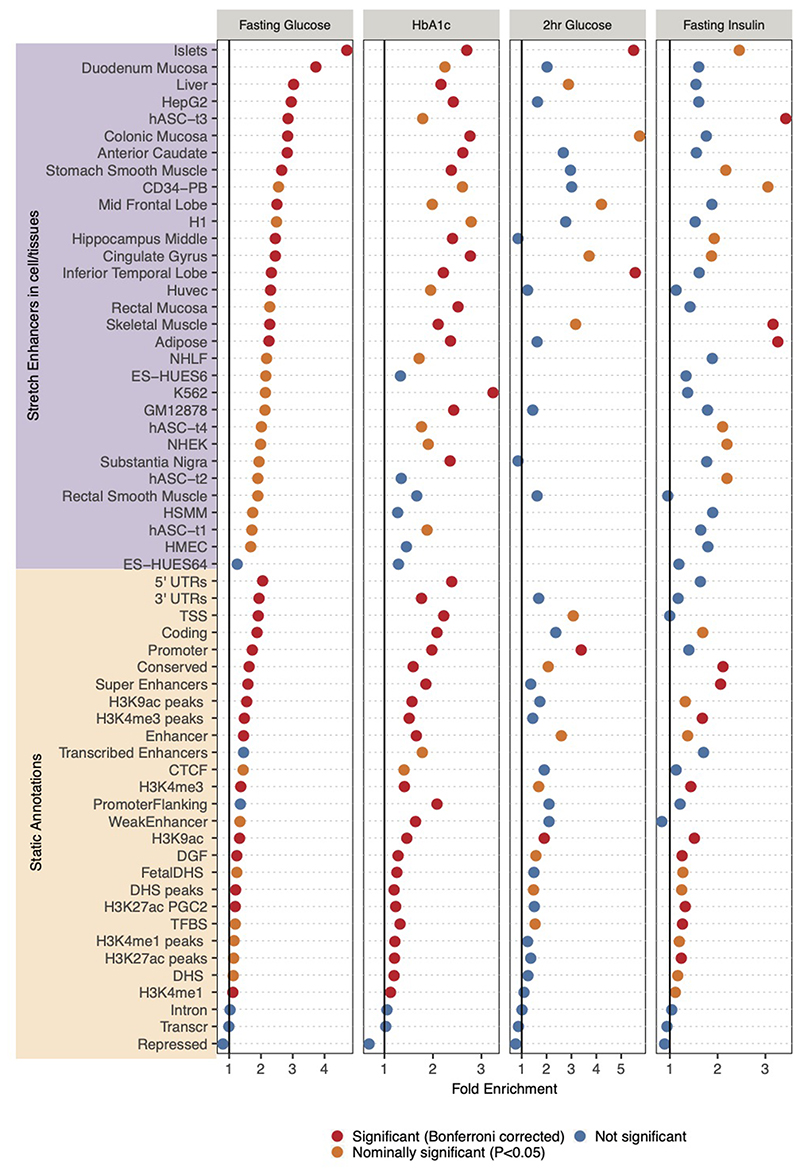
We explored the genomic context underlying glycemic trait loci by computing overlap enrichment for annotations such as coding, conserved regions, and super enhancers merged across multiple cell types53–55 using the GREGOR tool56. We observed that FG, FI and HbA1c signals (Supplementary Table 7) were significantly (P<8.4x10⁻⁴, Bonferroni threshold for 59 annotations) enriched in evolutionarily conserved regions (Fig 5A, Extended Data Figure 7, Supplementary Table 15).
Figure 5. Epigenomic landscape of trait-associated variants.
A: Enrichment of GWAS variants to overlap genomic regions including ‘Static Annotations’ which are common or ‘static’ across cell types and ‘Stretch Enhancers’ which are identified in each tissue/cell type. The numbers of signals for each trait are indicated in parentheses. Enrichment was calculated using GREGOR 56. One-sided test for significance (red) is determined after Bonferroni correction to account for 59 total annotations tested for each trait; nominal significance (P<0.05) is indicated in yellow. B: Enrichment for HbA1c GWAS signals partitioned into “hard” Glycemic and Red Blood Cell cluster (signals from “hard” mature Red Blood Cell and reticulocyte clusters together) to overlap annotations including StrEs in Islets and the blood-derived leukemia cell line K562, respectively (additional partitioned results in Supplementary Table 17). C: Individual FI GWAS signals that drive enrichment in Adipose and Skeletal Muscle StrEs. D, E: Genome browser shots of FI GWAS signals – intronic region of the COL4A2 gene (D) and an inter-genic region ~25kb from LINC01214 gene (E) showing GWAS SNPs (lead and LD r2>0.8 proxies), ATAC-seq signal tracks and chromatin state annotations in different tissues/cell types.
We then considered epigenomic landscapes defined in individual cell/tissue types. Previously, stretch enhancers (StrE, enhancer chromatin states ≥3kb in length) in pancreatic islets were shown to be highly cell-specific and strongly enriched with T2D risk signals57. Considering StrEs across 31 cell-types39, FG and 2hGlu signals showed the highest enrichment in islets (FG: fold-enrichment=4.70, P=2.7x10⁻²⁴; 2hGlu: fold-enrichment=5.51, P=3.6x10⁻⁴ Figure 5A, Supplementary Table 16), highlighting the importance of islets for these traits. FI signals were enriched in skeletal muscle (fold-enrichment=3.17, P=7.8x10⁻⁶) and adipose StrEs (fold-enrichment=3.27, P=1.8x10⁻⁷) consistent with these tissues as targets of insulin action (Figure 5A). StrEs in individual cell types showed higher enrichment than super enhancers merged across cell types, highlighting the importance of cell-specific analyses (Figure 5A). HbA1c signals were enriched in StrEs of multiple cell types and tissues, but have the strongest enrichment in K562 leukemia derived cells (fold-enrichment=3.24, P=1.2x10⁻⁷, Figure 5A). Among the “hard” glycemic and red blood cell (mature + reticulocyte) HbA1c signals, glycemic signals were enriched in islet StrEs (fold-enrichment=3.96, P=3.7x10⁻¹⁶) while red blood cell signals were enriched in K562 StrEs (fold-enrichment=7.5, P=2.08x10⁻¹⁴, Figure 5B, Supplementary Table 17). These analyses suggest that these glycemic trait-associated variants influence the function of tissue-specific enhancers.
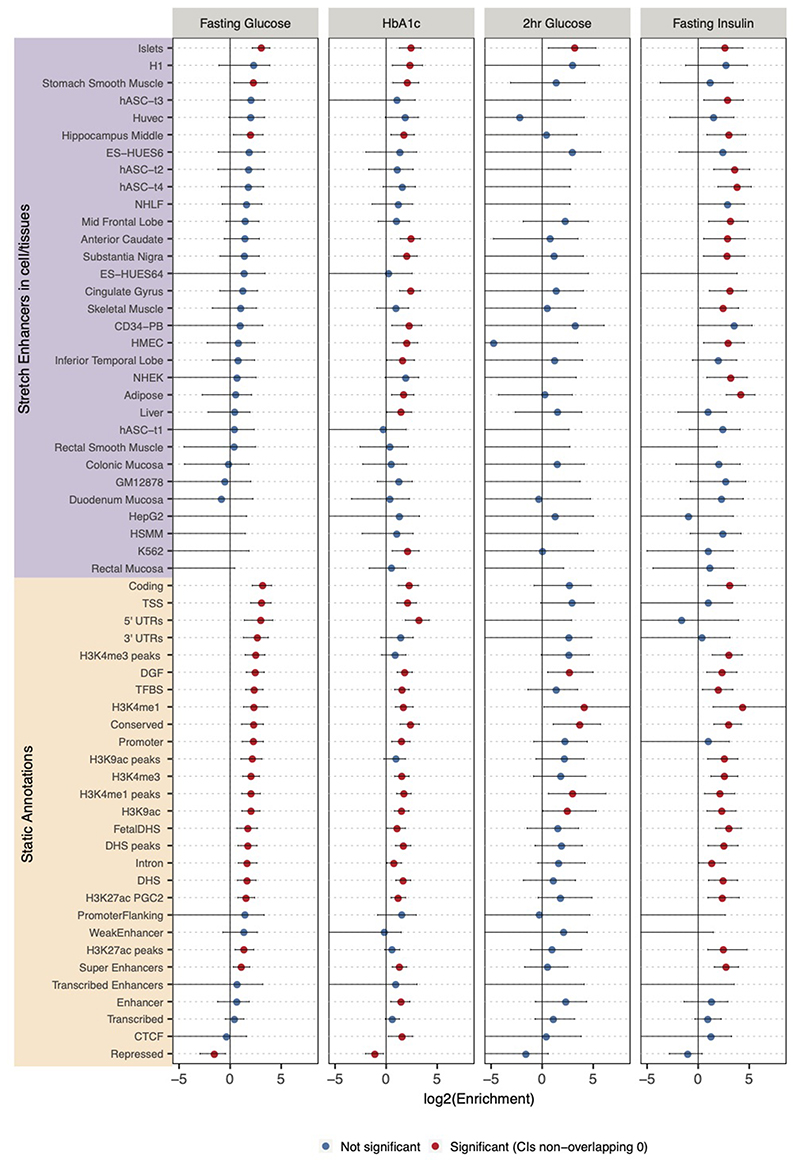
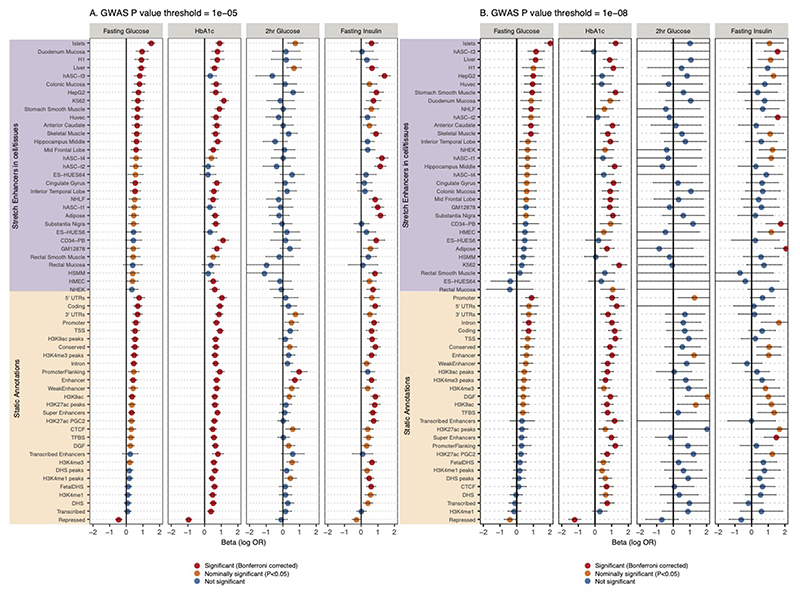
Independent analyses with fGWAS58 and GARFIELD59 yielded consistent results (Extended Data Figures 8 and 9, Supplementary Tables 16 and 18). Notably, FI signals at a lenient threshold of P<10-5 were enriched in liver StrEs using GARFIELD (odds ratio=1.92, P=1.7x10⁻⁴) (Extended Data Figure 9A). This suggests that liver regulatory annotations are relevant for FI GWAS signals, but that we lack power to detect significant enrichment using the genome-wide significant loci and the current set of reference annotations.
We next explored the 27 loci driving the FI enrichment in adipose and skeletal muscle, 11 of which overlapped StrEs in both tissues (Figure 5C). At the COL4A2 locus, variants within an intronic region overlap StrEs in adipose tissue, skeletal muscle, and a human skeletal muscle myoblast (HSMM) cell line that are not shared across other cell/tissue types. Among these, rs9555695 (in the 99% CS) also overlaps accessible chromatin regions in adipose (Figure 5D). At a narrow signal with no proxy variants (LD r2>0.7 in Europeans), the lead trans-ancestry variant rs62271373 (PPA = 0.94) located in an intergenic region ~25kb from the LINC01214 gene overlaps StrEs specific to adipose and HSMM and an active enhancer chromatin state in skeletal muscle (Figure 5E). Collectively, the tissue-specific epigenomic signatures at GWAS signals provide an opportunity to nominate tissues where these variants are likely to be active. This map may help future efforts to deconvolute GWAS signals into tissue-specific disease pathology.
Co-localization of GWAS and eQTLs
Among the 99 novel glycemic trait loci, we identified co-localized eQTLs at 34 loci in blood, pancreatic islets, subcutaneous or visceral adipose, skeletal muscle, or liver, providing suggestive evidence of causal genes (Supplementary Table 19). The co-localized eQTLs include several genes previously reported at glycemic trait loci: ADCY5, CAMK1D, IRS1, JAZF1, and KLF14 60–62. For some additional loci, the co-localized genes have prior evidence for a role in glycemic regulation. For example, the lead trans-ancestry variant and likely causal variant, rs1799815 (PPA=0.993), associated with FI is the strongest variant associated with expression of INSR, encoding the insulin receptor, in subcutaneous adipose from METSIM (P=2x10⁻⁹) and GTEx (P=5x10⁻⁶). The A allele at rs1799815 is associated with higher FI and lower expression of INSR, consistent with the relationship between insulin resistance and reduced INSR function63. In a second example, rs841572, the trans-ancestry lead variant associated with FG, has the highest PPA (PPA=0.535) among the 20 variants in the 99% CS and is in strong LD (r2=0.87) with the lead eQTL variant (rs841576, also in the 99% CS) associated with SLC2A1 expression in blood (eQTLGen P=1x10⁻⁸). SLC2A1, also known as GLUT1, encodes the major glucose transporter in brain, placenta, and erythrocytes, and is responsible for glucose entry into the brain64. rs841572-A is associated with lower FG and lower SLC2A1 expression. While rare missense variants in SLC2A1 are an established cause of seizures and epilepsy65, our data suggest that SLC2A1 variants also affect plasma glucose levels within a population. These co-localized signals provide possible regulatory mechanisms for variant effects on genes to influence glycemic traits.
The co-localized eQTLs also provide new insights into the mechanisms at glycemic trait loci. For example, rs9884482 (in the 99% CS) is associated with FI and TET2 expression in subcutaneous adipose (P=2x10-20); rs9884482 is in high LD (r2=0.96 in Europeans) with the lead TET2 eQTL variant (rs974801). TET2 encodes a DNA-demethylase that can affect transcriptional repression 66. Adipose Tet2 expression is reduced in diet-induced insulin resistance in mice67, and knockdown of Tet2 blocked adipogenesis67,68. Consistently, in human adipose tissue, rs9884482-C was associated with lower TET2 expression and higher FI. In a second example, rs617948 is associated with HbA1c (in the 99% CS) and is the lead variant associated with C2CD2L expression in blood (eQTLGen P=3x10-96). C2CD2L, also known as TMEM24, regulates pulsatile insulin secretion and facilitates release of insulin pool reserves69,70. rs617948-G was associated with higher HbA1c and lower C2CD2L, providing evidence for a role of this insulin secretion protein in glucose homeostasis. Our HbA1c “soft” clustering assigned this signal to both the “unknown” (0.51 probability) and “reticulocyte” (0.42 probability) clusters. rs617948 is strongly associated with HbA1c (P<6.8x10⁻⁸), but not with FG, FI or 2hGlu (P>0.05, Supplementary Table 20, Supplementary Note). This suggests an effect of this variant on reticulocyte biology, and on insulin secretion, potentially influencing HbA1c levels through different tissues, and providing a plausible explanation for the classification as “unknown”.
Tissue Expression
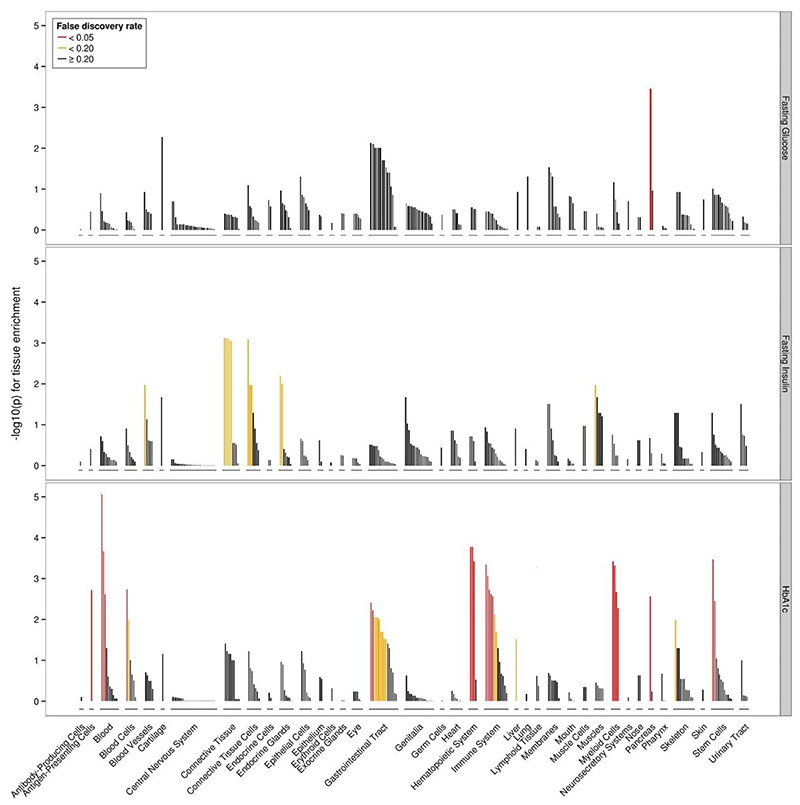
Consistent with effector transcript expression analysis using GTEx data30, we found significant differences in tissue expression across the glycemic trait signals. FG signals were enriched for genes expressed in the pancreas (FDR<0.05), while there were an insufficient number of significant associations in 2hGlu to identify enrichment for any tissue or cell type at FDR<0.2 threshold. FI signals were enriched for connective tissue and cells (which includes adipose tissue), endocrine glands, blood cells, and muscles (FDR<0.2) and HbA1c signals were significantly enriched for genes expressed in the pancreas, hemic, and immune system (FDR<0.05) (Figure 6, Supplementary Table 21). Consistent with previous analysis30, FI-enrichment for connective tissue was driven by adipose tissue (subcutaneous and visceral), while the newly described enrichment with endocrine glands was driven by the adrenal glands and cortex (Supplementary Table 21). Beyond enrichment for genes expressed in glycemic-related tissues, HbA1c signals were enriched with genes expressed in blood, consistent with the role of RBC in this trait and our previous results30.
Figure 6. Tissues and cell types significantly enriched for genes within glycemic-associated loci.
Top panel FG-associated loci, middle panel FI-associated loci, bottom panel Hba1c-associated loci. FDR thresholds are shown in red (q<0.05), orange (q<0.2), black (q≥0.2).
The association between FI signals and genes expressed in adrenal glands is notable, suggesting a possible direct role for these genes in insulin resistance. These genes might influence cortisol levels, which could contribute to insulin resistance and FI levels through impaired insulin receptor signaling in peripheral tissues, as well as influencing body fat distribution, stimulate lipolysis, and other indirect mechanisms71,72.
Gene-set Analyses
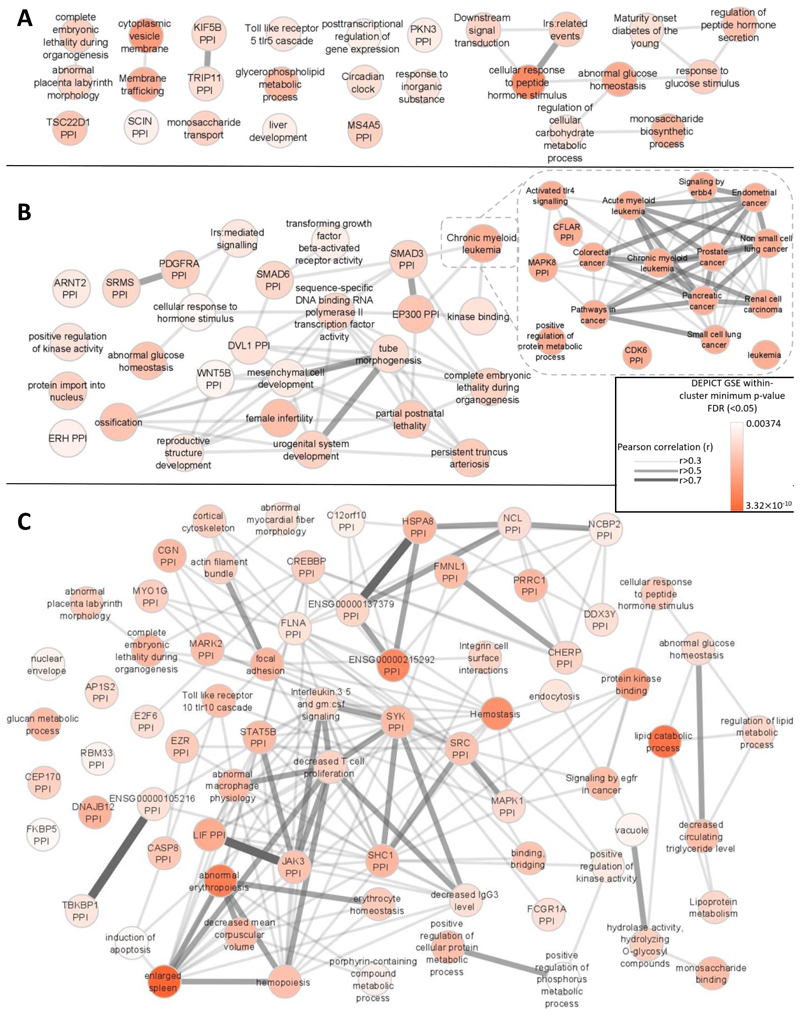
Next, we performed gene-set analysis using DEPICT (Methods). In keeping with previous results30, we found distinct gene-sets enriched (FDR<0.05) for each glycemic trait except 2hGlu, which had insufficient associations to have power in this analysis. FG-associated variants highlighted gene-sets involved in metabolism and gene-sets involved in general cellular function such as “cytoplasmic vesicle membrane” and “circadian clock”” (Figure 7A). In contrast, in addition to metabolism-related gene-sets, FI-associated variants highlighted pathways related to growth, cancer and reproduction (Figure 7B). This is consistent with the role of insulin as a mitogenic hormone, and with epidemiological links between insulin and certain types of cancer73 and reproductive disorders such as polycystic ovary syndrome74. HbA1c-associated variants highlighted many gene-sets (Figure 7C), including those linked to metabolism and hematopoiesis, again recapitulating our postulated effects of variants on glucose and RBC biology. Additional pathways from HbA1c-associated variants also highlighted previous “CREBP PPI” and lipid biology related to T2D75 and HbA1c76, respectively, and potential new biology through which variants may influence HbA1c.
Figure 7. Gene-set enrichment analyses.
Results from affinity-propagation clustering of significantly enriched gene-sets (FDR<0.05) identified by DEPICT for A) FG, B) FI, and C) HbA1c. Each node is a meta gene-set which is represented by an exemplar gene-set within the meta gene-set. For example, in B. “chronic myeloid leukemia “ is an exemplar gene-set representing a much broader meta gene-set relating to cancer and represented in the zoomed in section on the right. Similarities between the meta gene-sets are represented by Pearson correlation coefficients (r>0.3). The nodes are colored according to the minimum gene-set enrichment p-value for gene-sets in that meta gene-set.. PPI=protein-protein interaction network.
Discussion
Here we describe a large glycemic trait meta-analysis of GWAS for which 30% of the population was composed of East Asian, Hispanic, African-American, South Asian and sub-Saharan African participants. This effort identified 242 loci (235 trans-ancestry and seven single-ancestry), which jointly explain between 0.7% (2hGlu in European ancestry individuals) and 6% (HbA1c in African American ancestry individuals) of the variance in glycemic traits in any given ancestry. While 114/242 loci are associated with T2D (P<10-4; 83 loci with P<5x10⁻⁸, Supplementary Table 4), absence of strong evidence of association at the remaining loci (P≥10-4) suggests that for alleles more frequent than 5% we can exclude T2D ORs≥1.07 with 80% power (alpha=5x10⁻⁸; and ORs≥1.05 for alpha=10-4) given a current study of 228,499 T2D cases and 1,178,783 controls27. We identified 486 signals associated with glycemic traits, of which eight have MAF<1%, and 45 have 1%<=MAF<5% in all ancestries, highlighting that 89% of signals identified are common in at least one ancestry studied.
A key aim of our study was to evaluate the added advantage of including population diversity in genetic discovery and fine-mapping efforts. Beyond the larger sample size included in the trans-ancestry meta-analysis, we were able to estimate the contribution of non-European ancestry data in locus discovery and fine-mapping resolution. We found that 24 of the 99 newly discovered loci owe their discovery to the inclusion of East Asian, Hispanic, African-American, South Asian and sub-Saharan African participant data, due to differences in EAF and effect sizes across ancestries.
Comparison of 295 trans-ancestry lead variants (315 locus-trait associations) across ancestries demonstrated that between 81.5% (HbA1c) and 85.7% (FG) of the trans-ancestry lead variants had no evidence of trans-ancestry heterogeneity in allelic effects (P>0.05).
Given sample size and power limitations, genome-wide significant trait-associated variants in a single-ancestry explain only a modest proportion of trait variance in that ancestry (Figure 2). We demonstrate that trans-ancestry lead variants explain more trait variance than the ancestry-specific variants (Figure 2). This shows that even though some trans-ancestry lead variants are not genome-wide significant in all ancestries, they contribute to the genetic architecture of the trait in most ancestries.
We evaluated for the first time the transferability of European ancestry-derived glycemic trait PGS into other ancestries. Consistent with other traits36,77,78, we confirm that European ancestry-derived PGS perform much worse when the test dataset is from a different ancestry. Each trait-specific PGS improves trait variance explained by between 3.5-fold (HbA1c) and 6-fold (FG) in the European dataset (Figure 3, Supplementary Table 12) compared to a score built only from trans-ancestry lead variants and European index variants (Figure 2, Supplementary tables 9-12).
Despite development of approaches to derive polygenic risk scores79, we note the difficulty in using summary level data to build a PGS in one ancestry and then apply it in test datasets of different ancestry. While PRS-CSauto34 is able to use summary level data, revision of the effect size estimates to account for LD required reference panels that matched the ancestry of the test dataset. However, the current software lacks appropriate reference panels for many ancestries, precluding its broad application. Future developments of trans-ancestry PGS are required for improved cross-ancestry performance.
We show that fine-mapping resolution is improved in trans-ancestry, compared to single-ancestry fine-mapping efforts. In ~50% of our loci, we showed that the improvement was due to differences in EAF, effect size, or LD structure between ancestries, and not just due to the overall increased sample size available for trans-ancestry fine-mapping. By performing trans-ancestry fine-mapping, and co-localizing GWAS signals with eQTL signals and coding variants, we identified new candidate causal genes. Altogether, these results motivate continued expansion of genetic and genomic efforts in diverse populations to improve understanding of these traits in groups disproportionally affected by T2D.
Given data on four different glycemic traits and their utility to diagnose and monitor T2D and metabolic health, we also sought to characterize biological features underlying these traits. We show that despite significant sharing of loci across the four traits, each trait is also characterized by unique features based on StrE, gene expression and gene-set signatures. Combining genetic data from these traits with T2D data will further elucidate pathways driving normal physiology and pathophysiology, and help further develop useful predictive scores for disease classification and management4,5.
Online Methods
Study design and participants
This study included trait data from four glycemic traits: fasting glucose (FG), fasting insulin (FI), 2hr post-challenge glucose (2hGlu), and glycated hemoglobin (HbA1c). The total number of contributing cohorts ranged from 41 (2hGlu) to 131 (FG), and the maximum sample size for each trait ranged from 85,916 (2hGlu) to 281,416 (FG) (Supplementary Table 1). Ancestry was initially defined at the cohort level, but within each cohort ancestry was confirmed with genetic data with ancestry outliers removed (Supplementary Table 1). Overall, European ancestry (EUR) participants dominated the sample size for all traits, representing between 68.0% (HbA1c) to 73.8% (2hGlu) of the overall sample size. African Americans (AA) represented between 1.7% (2hGlu) to 5.9% (FG) of participants; individuals of Hispanic ancestry (HISP) represented between 6.8% (FG) to 14.6% (2hGlu) of participants; individuals of East-Asian ancestry (EAS) represented between 9.9% (2hGlu) to 15.4% (HbA1c) of participants; and South-Asian ancestry (SAS) individuals represented between 0% (no contribution to 2hGlu) to 4.4% (HbA1c) of participants. Data from Ugandan participants were only available for the HbA1c analysis and represented 2% of participants.
Phenotypes
Analyses included data for FG and 2hGlu measured in mmol/l, FI measured in pmol/l, and HbA1c in % [where possible, studies reported HbA1c as a National Glycohemoglobin Standardization Program (NGSP) percent]. Similar to previous MAGIC efforts7, individuals were excluded if they had type 1 or type 2 diabetes (defined by physician diagnosis); reported use of diabetes-relevant medication(s); or had a FG ≥7 mmol/L, 2hGlu ≥11.1mmol/L, or HbA1c ≥ 6.5%, as detailed in Supplementary Table 1. 2hGlu measures were obtained 120 minutes after a glucose challenge in an oral glucose tolerance test (OGTT). Measures for FG and FI taken from whole blood were corrected to plasma level using the correction factor 1.1380.
Genotyping, quality control, and imputation
Each participating cohort performed study-level quality control, imputation, and association analyses following a shared analysis plan. Cohorts were genotyped using commercially available genome-wide arrays or the Illumina CardioMetabochip (Metabochip) array (Supplementary Table 1)81. Prior to imputation, each cohort performed stringent sample and variant quality control (QC) to ensure only high-quality variants were kept in the genotype scaffold for imputation. Sample quality control checks included removing samples with low call rate < 95%, extreme heterozygosity, sex mismatch with X chromosome variants, duplicates, first- or second-degree relatives (unless by design), or ancestry outliers. Following sample QC, cohorts applied variant QC thresholds for call rate (< 95%), Hardy-Weinberg Equilibrium (HWE) P < 1x10⁻⁶, and minor allele frequency (MAF). Full details of QC thresholds and exclusions by participating cohort are available in Supplementary Table 1.
Imputation was performed up to the 1000 Genomes Project phase 1 (v3) cosmopolitan reference panel82, with a small number of cohorts imputing up to the 1000 Genomes phase 3 panel19 or population-specific reference panels (Supplementary Table 1).
Study level association analyses
Each of the glycemic traits (FG, natural log FI, and 2hGlu) were regressed on BMI (except HbA1c), study-specific covariates, and principal components (unless implementing a linear mixed model). Analyses for FG, FI, and 2hGlu were adjusted for BMI as we had previously shown this did not materially affect results for FG and 2hGlu but improved our ability to detect FI-associated loci15. For simplicity, we refer to the traits as FG, FI and 2hGlu. For a discussion on collider bias see Supplementary Note section 2c. Both the raw and rank-based inverse normal transformed residuals from the regression were tested for association with genetic variants using SNPTEST23 or Mach2Qtl83,84. Poorly imputed variants, defined as imputation r2 < 0.4 or INFO score < 0.4, were excluded from downstream analyses (Supplementary Table 1). Following study level QC, approximately 12,229,036 variants (GWAS cohorts) and 1,999,204 variants (Metabochip cohorts) were available for analysis (Supplementary Table 1).
Centralized quality control
Each contributing cohort shared their summary statistic results with the central analysis group who performed additional QC using EasyQC85. Allele frequency estimates were compared to estimates from 1000Gp1 reference panel82, and variants were excluded from downstream analyses if there was a minor allele frequency difference > 0.2 for AA, EUR, HISP, and EAS populations against AFR, EUR, MXL, and ASN populations from 1000 Genomes Phase 1, respectively, or a minor allele frequency difference > 0.4 for SAS against EUR populations. At this stage, additional variants were excluded from each cohort file if they met one of the following criteria: were tri-allelic; had a minor allele count (MAC) < 3; demonstrated a standard error of the effect size ≥ 10; or were missing an effect estimate, standard error, or imputation quality. All data that survived QC (approximately 12,186,053 variants from GWAS cohorts and 1,998,657 variants from Metabochip cohorts) were available for downstream meta-analyses.
Single-ancestry meta-analyses
Single-ancestry meta-analyses were performed within each ancestry group using the fixed-effects inverse variance meta-analysis implemented in METAL20. We applied a double-genomic control (GC) correction15,86 to both the study-specific GWAS results and the single-ancestry meta-analysis results. Study-specific Metabochip results were GC-corrected using 4,973 SNPs included on the Metabochip array for replication of associations with QT-interval, a phenotype not correlated with our glycemic traits15.
Identification of single-ancestry index variants
To identify distinct association index variants across each chromosome within each ancestry (Table 1), we performed approximate conditional analyses implemented in GCTA21 using the --cojo-slct option (autosomes) and distance-based clumping (X chromosome). Linkage disequilibrium (LD) correlations for GCTA were estimated from a representative cohort from each ancestry: WGHS (EUR); CHNS (EAS); SINDI (SAS); BioMe (AA); SOL (HISP) and Uganda (for itself). The results from GCTA were comparable when using alternative cohorts for the LD reference. For any index variant with a QC flag which caused reason for concern, we performed manual inspection of forest plots to decide whether the signal was likely to be real (Supplementary note). Among 335 single-ancestry index variants across all traits, this manual inspection was done for 40 signals of which 32 passed and 8 failed after inspection. Thus, a total of 327 single-ancestry index variants passed and 8 failed.
Trans-ancestry meta-analyses
To leverage power across all ancestries, we also conducted trait-specific trans-ancestry meta-analysis by combining the single-ancestry meta-analysis results using MANTRA (Supplementary note)87.We defined log10Bayes’ Factor (BF) > 6 as genome-wide significant, approximately comparable to P < 5x10⁻⁸.
Manual curation of trans-ancestry lead variants
To ensure trans-ancestry lead variants were robust, we performed manual inspection of forest plots by at least two authors, for any variants with flags indicating possible QC issues (Supplementary note). Of 463 trans-ancestry lead variants across all traits, 184 passed without inspection, 131 passed after inspection, and 148 failed after inspection.
Comparison of TA lead variants across ancestries
For each pair of ancestries, we calculated Pearson’s correlation in EAFs for each trans-ancestry lead variant. The pairwise summarized heterogeneity of effect sizes between ancestries was then tested using the joint F-test of heterogeneity32. The test statistic is the sum of Cochran Q-statistics for heterogeneity across all trans-ancestry signals. Under the null hypothesis, the statistics follows the χ2 distribution with n degrees of freedom, where n is the number of the trans-ancestry lead variants.
LD-pruned variant lists
Several downstream analyses (for example, genomic feature enrichment, genetic scores, and estimation of variance explained by associated variants) require independent LD-pruned variants (r2<0.1) to avoid double-counting variants which might otherwise be in LD with each other and that do not provide additional “independent” evidence. Therefore, for these analyses we generated different lists of either TA or single-ancestry LD pruned (r2<0.1) variants, keeping in each case the variant with the strongest evidence of association (Supplementary Table 7). Subsequently, we combined TA and single-ancestry variant lists and conducted further LD pruning. For some analyses, we took the TA pruned variant list and added single-ancestry signals if the LD r2<0.1, while for others we started with the single-ancestry pruned lists and supplemented with TA lead variants if the LD r2<0.1. One exception was the list used for eQTL co-localizations, which included all single-ancestry European signals (without LD pruning) and supplemented with any additional TA lead variants (starting from the variants with the most significant P-values) in EUR LD r2<0.1 with any of the variants already in list, and that reached at least P<1x10⁻⁵ in the European ancestry meta-analysis.
Trait variance explained by associated loci
To determine how much of the phenotypic variance of each trait could be explained by the corresponding trait-associated loci, variants were combined in a series of weighted genetic scores (GS). The analysis was performed in a subset of the cohorts included in the discovery GWAS (with representation from each ancestry) and in a smaller number of independent cohorts (European ancestry only). Up to three different GS were derived per trait (and for each ancestry) in order to evaluate the potential for the trans-ancestry meta-GWAS identified loci to provide additional information above and beyond that contributed by the ancestry-specific meta-analysis results. These GS comprised: List A - single-ancestry signals; List B - single-ancestry signals plus trans-ancestry signals; and List C - trans-ancestry signals plus single-ancestry signals (Supplementary Table 7). In the case of the European ancestry cohorts that contributed to the GWAS, we employed the method of Nolte et al.33 to adjust the effect sizes (betas) from the GWAS for the contribution of that cohort, providing sets of cohort-specific effect sizes that were then used to generate the GS. The association between each GS and its corresponding trait was tested by linear regression and the adjusted R2 from the model extracted as an estimate of the variance explained.
Transferability of polygenic scores (PGS) across ancestries
We used the PRS-CSauto34 software to first build European ancestry-derived PGS for each glycemic trait (FG, FI, 2hGlu, HbA1c) on the basis of summary statistics. However, PRS-CSauto does not perform well when the training dataset is relatively small and the genetic architecture is sparse34. Consequently, 2hGlu was excluded from this analysis. For each trait, to obtain European ancestry training and test datasets, we first removed all cohorts only genotyped on the Metabochip which were not included in this analysis. From the remaining cohorts we then removed five of the largest European cohorts contributing to the respective European ancestry meta-analysis. For each trait, these five cohorts were meta-analyzed and used as the European ancestry test dataset. Subsequently, the remaining European ancestry cohorts were also meta-analyzed and used as the European ancestry training dataset. For each of the other ancestries, cohorts only genotyped on the Metabochip were also removed, and the remaining cohorts were meta-analyzed, and used as the non-European ancestry test datasets. Variants with MAF<0.05 or missing in over half of the individuals in the training dataset were removed34,88. The PGS for each trait was built using PRS-CSauto with default settings34 with the effect size estimates based on the European training dataset being revised based on an LD reference panel matching the test dataset. The proportion of the trait variance explained by the European ancestry-derived PGS (R2) was estimated using the R package “gtx”89 based on the revised effect sizes and summary statistics from the test dataset for each ancestry.
Fine-mapping
Of the 242 loci identified in this study, 237 were autosomal loci which we took forward for fine-mapping (Supplementary Table 2). We used the Bayesian fine-mapping method FINEMAP90 (version 1.1) to refine association signals and attempt to identify likely causal variants at each locus. FINEMAP estimates the maximum number of causal variants at each locus, calculates the posterior probability of each variant being causal, and proposes the most likely configuration of causal variants. The posterior probabilities of the configurations in each locus were used to construct 99% credible sets.
We performed both single-ancestry and trans-ancestry fine-mapping. In both analyses, only data from cohorts genotyped on GWAS arrays were used, and analyses were limited to trans-ancestry lead variants and other single-ancestry lead variants present in at least 90% of the samples for each trait. For the single-ancestry fine-mapping, FINEMAP estimates the number of causal variants in a region up to a maximum number, which we set to be two plus the number of distinct signals identified from the GCTA signal selection. FINEMAP uses single-ancestry and trait-specific z-scores from the fixed-effect meta-analysis in METAL20 and an ancestry-specific LD reference, which we created from a subset of cohorts (combined sample size > 30% of the sample size for that ancestry), weighting each cohort by sample size. In the trans-ancestry fine-mapping, FINEMAP was similarly used to estimate the number of causal variants starting with two, and trait-specific z-scores and LD maps were generated from the sample size weighted average of those used in the single-ancestry fine-mapping. The maximum number of causal variants was iteratively increased by one until it was larger than the number of causal variants supported by data (Bayes factor), which was the estimated maximum number of causal variants used in the final run of fine-mapping analysis.
To compare fine-mapping results obtained from the single-ancestry and trans-ancestry efforts, analyses were limited to fine-mapping regions with evidence for a single likely causal variant in both, enabling a straightforward comparison of credible sets (Supplementary note). To ensure any difference in the fine-mapping results was not driven by different sets of variants being present in the different analyses, we repeated the single-ancestry fine-mapping limited to the same set of variants used in the trans-ancestry fine-mapping. The fine-mapping resolution was assessed based on comparisons of the 99% credible sets in terms of number of variants included in the set, and length of the region. To assess whether the improvement in the trans-ancestry fine-mapping was due to differences in LD, increased sample size, or both, we repeated the trans-ancestry fine-mapping mimicking the sample size present in the single-ancestry fine-mapping by dividing the standard errors by the square root of the sample size ratio and compared the results with those from the single-ancestry fine-mapping.
Functional Annotation of trait-associated variants
HbA1c signal classification
There were 218 HbA1c-associated signals from either the single-ancestry (i.e. all GCTA-signals from any ancestry) or trans-ancestry meta-analyses. To classify these signals in terms of their likely mode of action (i.e., glycemic, erythrocytic, or other 7), we examined association summary statistics for the lead variants at the 218 signals in other large European datasets for 19 additional traits: three glycemic traits from this study (FG, 2hGlu and FI); seven mature red blood cell (RBC) traits91,92 (red blood cell count, mean corpuscular volume, hematocrit, mean corpuscular hemoglobin, mean corpuscular hemoglobin concentration, hemoglobin concentration and red cell distribution width); five reticulocyte traits (reticulocyte count, reticulocyte fraction of red cells, immature fraction of reticulocytes, high light scatter reticulocyte count and high light scatter percentage of red cells)91,92, and four iron traits (serum iron, transferrin, transferrin saturation and ferritin)93. Of the 218 HbA1c signals, data were available for the lead (n=183) or proxy (European LD r2 > 0.8, n = 8) variants at 191 signals.
The additional traits were clustered using hierarchical clustering to ensure biologically related traits would cluster together (Supplementary note). We then used a non-negative matrix factorization (NMF)94 process to cluster the HbA1c signals. Each cluster was labelled as glycemic, reticulocyte, mature RBC, or iron related based on the strength of association of signals in the cluster to the glycemic, reticulocyte, mature RBC and iron traits (Supplementary note). To verify that our cluster naming was correct, we used HbA1c association results conditioned on either FG or iron traits, or type 2 diabetes association results (Supplementary note).
HbA1c genetic risk scores (GRSs) and T2D risk
We constructed GRS for each cluster of HbA1c-associated signals (based on hard clustering) and tested the association of each cluster with T2D risk using samples from the UK Biobank. Pairs of HbA1c signals in LD (EUR r2>0.10) were LD pruned by removing the signal with the less significant P-value of association with HbA1c. The GRS for each cluster was calculated based on the logarithm of odds ratios from the latest T2D study summary statistics95 and UK Biobank genotypes imputed to the Haplotype Reference Consortium19. From 487,409 UK Biobank samples (age between 46 and 82 years, and 55% female), we excluded participants for the following reasons: 373 with mismatched sex; 9 not used in the kinship calculation; 78,365 non-European ancestry individuals; and 138,504 with missing T2D status, age, or sex information. We further removed 26,896 related participants (kinship > 0.088, preferentially removing individuals with the largest number of relatives and controls where a T2D case was related to a control). T2D cases were defined by: (i) a history of diabetes without metformin or insulin treatment, (ii) self-reported diagnosis of T2D, or (iii) diagnosis of T2D in a national registry (N = 17,022, age between 47 and 79 years, and 36% female). Controls were participants without a history of T2D (N = 226,240, age between 46 and 82 years, and 56% female). We tested for association between each GRS and T2D using logistic regression including covariates for age, sex, and the first five principal components. Significance of association was evaluated by a bootstrap approach to incorporate the variance of each HbA1c associated signal in the T2D summary data. To do this, we generated the GRS of each cluster 200 times by resampling the logarithm of odds ratio of each signal with T2D. For each non-glycemic class that had a GRS significantly associated with T2D, we performed sensitivity analyses to evaluate whether the association was driven from variants that also belonged to a glycemic cluster when using a soft clustering approach (the signals were classified as also glycemic in the soft clustering or had an association P ≤ 0.05 with any of the three glycemic traits).
Chromatin states
To identify genetic variants within association signals that overlapped predicted chromatin states, we used a previously published, 13 chromatin state model that included 31 diverse tissues, including pancreatic islets, skeletal muscle, adipose, and liver39. Briefly, this model was generated from cell/tissue ChIP-seq data for H3K27ac, H3K27me3, H3K36me3, H3K4me1, and H3K4me3, and input control from a diverse set of publicly available data53,57,96,97 using the ChromHMM program98. As reported previously39, StrEs were defined as contiguous enhancer chromatin state (Active Enhancer 1 and 2, Genic Enhancer and Weak Enhancer) segments longer than 3kb57.
Enrichment of genetic variants in genomic features
We used GREGOR (version 1.2.1) to calculate the enrichment of GWAS variants overlapping static and StrEs56. For calculating the enrichment of glycemic trait-associated variants in these annotations, we used the filtered list of trait-associated variants as described above (Supplementary Table 7) as input. For calculating the enrichment of sub-classified HbA1c variants, we included the list of loci characterized as Glycemic, another list of loci characterized as Reticulocyte or mature Red Blood Cell, collectively representing the red blood cell fraction, along with lists of iron related or unclassified loci (Supplementary Table 17). We used the following parameters in GREGOR enrichment analyses: European r2 threshold (for inclusion of variants in LD with the lead variant) = 0.8, LD window size = 1 Mb, and minimum neighbour number = 500.
We used fGWAS (version 0.3.6)58 to calculate enrichment of glycemic trait-associated variants in static and StrE annotations using summary level GWAS results. We used the default fGWAS parameters for enrichment analyses for individual annotations for each trait. For each annotation, the model provided the natural log of maximum likelihood estimate of the enrichment parameter. Annotations were considered as significantly enriched if the log2 (parameter estimate) and respective 95% confidence intervals were above zero or significantly depleted if the log2 (parameter estimate) and respective 95% confidence intervals were below zero.
We tested enrichment of trait-associated variants in static and StrE annotations with GARFIELD (v2)59. We formatted annotation overlap files as required by the tool; prepared input data at two GWAS thresholds - of 1x10⁻⁵ and a more stringent 1x10⁻⁸ by pruning and clumping with default parameters (garfield-prep-chr script). We calculated enrichment in each individual annotation using garfield-test.R with –c option set to 0. We also calculated the effective number of annotations using the garfield-Meff-Padj.R script. We used the effective number of annotations for each trait to obtain Bonferroni corrected significance thresholds for enrichment for each trait.
eQTL analyses
To aid in the identification of candidate casual genes at the European-only and trans-ancestry association signals, we examined whether any of the lead variants associated with glycemic traits (Supplementary Table 7) were also associated with expression level (FDR < 5%) of nearby transcripts located within 1 Mb in existing eQTL data sets of blood, subcutaneous adipose, visceral adipose, skeletal muscle, and pancreatic islet samples60,61,99–102. LD was estimated from the collected cohort pairwise LD information, where available, else from the European samples in 1000G phase 3. GWAS and eQTL signals likely co-localize when the GWAS variant and the variant most strongly associated with the expression level of the corresponding transcript (eSNP) exhibit high pairwise LD (r2 > 0.8; 1000 Genomes Phase 3, EUR). At these signals, we conducted reciprocal conditional analyses to test association between the GWAS variant and transcript level when the eSNP was also included in the model, and vice versa. We report GWAS and eQTL signals as co-localized if the association for the eSNP was not significant (FDR ≥ 5%) when conditioned on the GWAS variant; we also report signals from the eQTLGen whole blood meta-analysis data that meet only the LD threshold because conditional analysis was not possible.
Tissue and gene-set analysis
We performed enrichment analysis using DEPICT (Data-driven Expression-Prioritized Integration for Complex Traits) version 3, specifically developed for 1000 Genomes Project imputed meta-analysis data103 to identify cell types and tissues in which genes at trait-associated variants were strongly expressed, and to detect enrichment of gene-sets or pathways. DEPICT data included human gene expression data for 19,987 genes in 10,968 reconstituted gene sets, and 209 tissues/cell types. Because gene expression data in DEPICT is based on European samples and LD, we selected trait-associated variants with P<10-5 in the European meta-analysis and tested for enrichment of signals in each reconstituted gene-set, and each tissue or cell type. Enrichment results with a false discovery rate (FDR)<0.05 were considered significant. We ran DEPICT based on association results for all traits among: (i) cohorts with genome-wide data, or (ii) all cohorts (genome-wide and Metabochip cohorts). Because results were broadly consistent between the two approaches, we present results from the analysis that contained all cohorts as it had greater statistical power.
Statistics and reproducibility
Sample size
No statistical method was used to predetermine sample size. We aimed to bring together the largest possible sample size with GWAS data from individuals of diverse ancestries (European, Hispanic, African American, East Asian, South Asian and sub-Saharan African) without diabetes and with data for one or more of the following traits: fasting glucose, fasting insulin, 2hr post-challenge glucose, and glycated hemoglobin. The sample sizes were 281,416 (FG), 213,650 (FI), 215,977 (HbA1c) and 85,916 (2hGlu) (Supplementary Table 1).Our sample size was sufficiently powered to detect common variant associations with each of the glycemic traits and was able to detect associations at 242 loci.
Randomization/Blinding
This is a study of continuous traits therefore there were no experiments to randomize and there was no “outcome” to which investigators needed to be blinded to.
Data exclusions
Prior to conducting this study, we identified reasons for which data should be excluded from the analysis at either the cohort or summary level; these exclusions are as follows. Sample quality control checks included removing samples with low call rate < 95%, extreme heterozygosity, sex mismatch with X chromosome variants, duplicates, first- or second-degree relatives (unless by design), or ancestry outliers. Following sample QC, cohorts applied variant QC thresholds for call rate (< 95%), Hardy-Weinberg Equilibrium (HWE) P < 1x10⁻⁶, and minor allele frequency (MAF). Full details of QC thresholds and exclusions by participating cohort are available in Supplementary Table 1. Each contributing cohort shared their summary statistic results with the central analysis group who performed additional QC using EasyQC. Allele frequency estimates were compared to estimates from 1000Gp1 reference panel, and variants were excluded from downstream analyses if there was a minor allele frequency difference > 0.2 for AA, EUR, HISP, and EAS populations against AFR, EUR, MXL, and ASN populations from 1000 Genomes Phase 1, respectively, or a minor allele frequency difference > 0.4 for SAS against EUR populations. At this stage, additional variants were excluded from each cohort file if they met one of the following criteria: were tri-allelic; had a minor allele count (MAC) < 3; demonstrated a standard error of the effect size ≥ 10; imputation r2 < 0.4 or INFO score < 0.4; or were missing an effect estimate, standard error, or imputation quality.
Extended Data
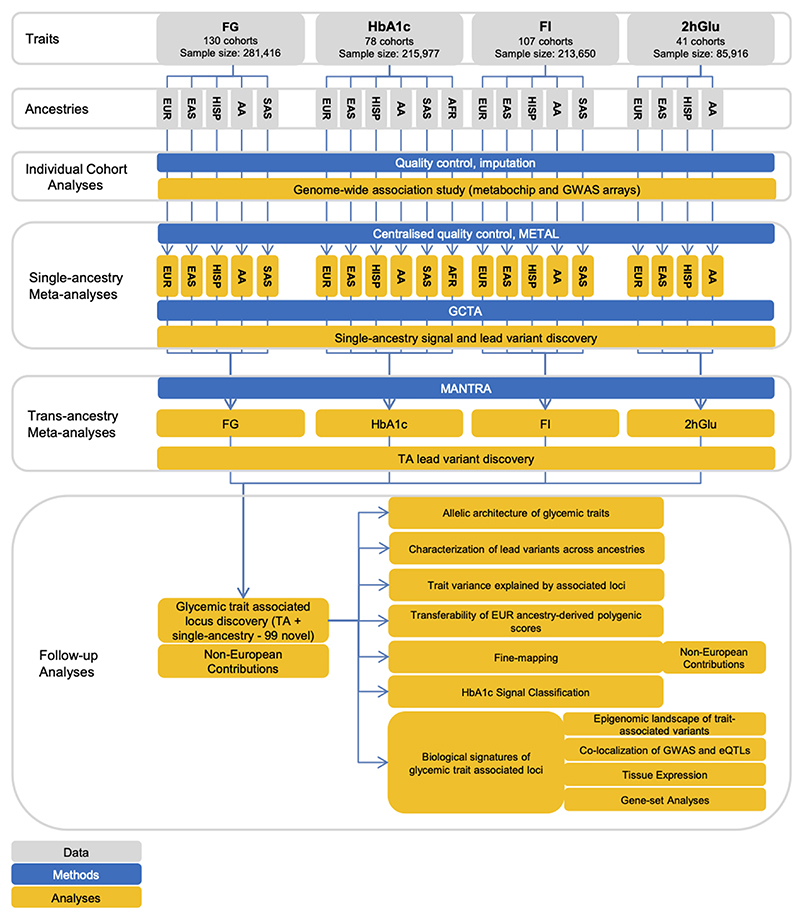
Extended Data Fig. 1. Flow diagram of this study.
The figure shows the data, key methods and main analyses included in this effort.
Extended Data Fig. 2. Locus diagram.
Trans-ancestry locus A contains a trans-ancestry lead variant for one glycemic trait represented by the blue diamond, and another single-ancestry index variant for another glycemic trait represented by the orange triangle. Single-ancestry locus B contains a single-ancestry lead variant represented by the purple square. The orange, blue and purple bars represent a +/- 500Kb window around the orange, blue, and purple variants, respectively. The black bars indicate the full locus window where trans-ancestry locus A contains trans-ancestry lead and single-ancestry index variants for two traits and single-ancestry locus B has a single-ancestry lead variant for a single trait.
Extended Data Fig. 3. Venn diagram.
Overlap of TA loci between traits.
Extended Data Fig. 4. Allele frequency versus effect size.
Allele frequency versus effect size for all signals detected through the trans-ancestry meta-analyses, for each of the four traits. Frequency and effect size are from the European meta-analyses. The power curves were computed based on the European sample size for each trait, and the mean (m) and standard deviation (sd) computed on the FENLAND study: FG, m=4.83 mmol/l, sd=0.68; FI, m=3.69 mmol/l, sd=0.60; 2hGlu, m=5.30 mmol/l, sd=1.74; HbA1c, m=5.55%, sd=0.48.
Extended Data Fig. 5. EAF correlation and heterogeneity test.
Pearson correlation of EAF on the lower tri-angle and p-value of one-side heterogeneity test without multiple testing corrections on the upper tri-angle of the trans-ancestry lead variants associated with each trait between ancestries. Correlations > 0.7 are in bold.
Extended Data Fig. 6. Forest plot of T2D GRS from HbA1c variants.
The p-value on the right side is from the two-side test without multiple testing corrections. Vertical points of each diamond represent the point estimate of the odds ratio. The horizontal points of each diamond represent the 95% confidence interval of the odds ratio. Figure shows the association results between HbA1c-associated variants built into a GRS for T2D by taking each HbA1c-associated variant and using a weight that corresponds to its T2D effect size (logOR) based on analysis by the DIAGRAM consortium. The overall GRS is subsequently partitioned according to the HbA1c signal classification. The overall and partitioned GRS were tested for association with T2D based on data from UK biobank.
Extended Data Fig. 7. Enrichment of glycemic trait associated GWAS variants to overlap genomic annotations using GREGOR.
Figure shows enrichment for 59 total static and stretch enhancer annotations considered. One-side test significance (red) is determined after Bonferroni correction to account for 59 total annotations tested for each trait; nominal significance (P<0.05) is indicated in yellow.
Extended Data Fig. 8. Enrichment of glycemic trait associated GWAS variants to overlap genomic annotations using fGWAS.
Figure shows log2(Fold Enrichment) of GWAS variants to overlap 59 static and stretch enhancer annotations calculated. Significant enrichment (red) is considered if the 95% confidence intervals (shown by the error bars) do not overlap 0.
Extended Data Fig. 9. Enrichment of glycemic trait associated GWAS variants to overlap genomic annotations using GARFIELD.
Figure shows the beta or effect size (log odds ratio) for GWAS variants to overlap 59 static and stretch enhancer annotations. GWAS variants were included at two significance thresholds, 1e-05 (A) and 1e-08 (B). One-side test significance (red) is determined after Bonferroni correction to account for effective annotations tested for each trait reported by GARFIELD (see supplementary note); nominal significance (P<0.05) is indicated in yellow. The 95% confidence intervals are shown by the error bars.
Supplementary Material
Acknowledgments
The authors thank all investigators, staff members, and study participants for their contribution to all participating studies. The funders had no role in study design, data collection, analysis, decision to publish, or preparation of the manuscript. The authors received no specific funding for this work. A full list of funding and individual and study acknowledgments appears in the Supplementary Note.
Footnotes
Author contributions
Project coordination: I.B.
Writing group: J.C., C.N.S, G.M., A.V., L.J.C, S.C.J.P., K.L.M., C.L., E.W., A.P.M., I.B.
Central analysis group: J.C., C.N.S, G.M., A.V., L.J.C, J.L., S.W., Y.W., X.Z., M.H., T.S.B., R.M., J.W., A.P., R.L., K.H.K.C., J.Y., M.D.A, A.Y.C., A.C., J.H., S.H., M.A.K., T.L., W.M., H.M-M., A.N., S.C.N., K.N., C.K.R., D.R., R.R., D.R., C.S., X.S., L.S., I.D.S., C.A.W., Y.W., P.W., W.Z., J.I.R., A.L.G., M.I.M., J.D., J.B.M., R.A.S., I.P., A.L., CT.L., S.C.J.P., K.L.M., C.L., E.W., A.P.M., I.B.
Cohort analysts: T.S.A., E.VR.A., L.F.B., J.A.B., N.P.B., C.P.C., B.E.C., J.C., X.C., L.C., C.C., B.H.C., K.C., Y.C., H.G.d., G.E.D., A.D., Q.D., J.E., S.A.F., J.G., F.G., J.G., S.G., Y.H., F.P.H., J.H., Y.H., T.H., A.H., M.H., R.A.J., T.K., K.A.K., Y.K., M.E.K., I.K.K., S.L., L.A.L., C.D.L., M.L., M.L., S.L., J.L., M.L., J.L., V.L., M.M., C.M., M.E.M., A.N., M.N., D.N., R.N., G.P., M.P., L.R., L.J.R., S.S.R., N.R.R., R.R., K.R., S.S., R.S., K.E.S., B.S., K.S., A.V.S., L.S., T.S., R.J.S., F.T., J.T., S.T., E.v., P.J.v., N.V., M.V., H.W., C.W., N.W., H.R.W., W.W., T.W., A.W., A.R.W., T.X., M.Z., J.Z., W.Z.
Cohort genotyping and phenotyping: N.A., Z.A., A.A., S.JL.B., D.B., M.B., R.N.B., A.B., M.B., L.L.B., S.R.B., D.W.B., Q.C., A.C., H.C., Y.C., E.J.C.d., A.D., S.D., G.E., A.F., M.F., C.F., Y.G., A.P.G., A.G., S.H., C.A.H., C.H., A.A.H., C.H., W.A.H., S.I., M.I., M.ArfanI., W.CraigJ., M.E.J., P.K.J., R.R.K., F.R.K., T.K., C.K., W.K., I.K., T.K., J.K., K.L., K.L., D.A.L., N.R.L., R.N.L., H.L., S.L., J.L., A.L., J.L., C.L., T.M., F.M., G.M., S.M., S.M., T.N., G.N.N., J.L.N., M.N., M.J.N., J.M.N., Y.O., A.P., P.A.P., O.P., Q.Q., D.R., D.F.R., A.R., F.R., K.R., I.R., C.S., K.S., N.S., A.S., J.S., H.M.S., K.D.T., T.M.T., B.T., P.RHJ.T., E.T., M.Y.T., A.U., R.M.v., D.v., A.v., J.V.V., J.V., H.V., T.W., K.W., T.Z.
Cohort oversight and/or principal investigator: G.R.A., L.S.A., C.AlbertoA., M.E.A., P.A., L.A., D.M.B., L.J.B., S.B., H.B., C.B., M.B., E.B., B.O.B., K.B., D.I.B., E.P.B., T.A.B., M.C., M.J.C., J.C.C., D.I.C., Y.C., C.C., F.S.C., A.C., F.C., H.d., G.D., S.E., M.K.E., E.F., L.F., J.C.F., P.W.F., T.M.F., P.F., B.G., M.O.G., P.G., H.G., N.G., S.G., L.G., V.G., X.G., A.H., T.H., C.H., S.R.H., B.L.H., W.H., E.I., P.S.J., M.J., J.B.J., J.WouterJ., P.K., R.K., S.L.R.K., N.K., S.M.K., B.K., M.K., H.A.K., J.S.K., A.K., P.K., D.K., M.K., Z.K., M.L., T.A.L., L.J.L., K.L., H.L., X.L., L.L., C.L., S.L., R.J.F.L., P.KE.M., A.M., A.M., D.O.M., T.A.M., P.B.M., I.N., J.R.O., A.J.O., K.K.O., S.P., C.N.A.P., N.D.P., O.P., C.E.P., D.J.P., P.P.P., M.A.P., B.M.P., L.Q., L.J.R., R.R., S.R., P.M.R., F.R.R., T.E.S., M.S., J.S.,N.S., P.S., L.J.S., E.S., P.S., X.S., P.ElineS., K.S.S., B.H.S., H.S., T.S., T.I.A.S., T.D.S., A.S., C.J.S., M.S., L.S., Y.T., E.T., N.J.T., A.T., J.T., T.T., M.U., P.v., C.v., P.V., T.GM.V., L.E.W., M.W., Y.X.W., N.J.W., R.M.W., H.W., W.B.W., A.R.W., G.W., J.F.W., T.W., J.W., A.H.X., L.R.Y., L.Y., M.Y., E.Z., W.Z., A.B.Z., J.I.R., A.L.G., M.I.M., J.D., J.B.M., R.A.S., I.P., A.L., C.L., S.CJ.P., K.L.M., C.L., E.W., A.P.M., I.B.
Competing interests statement
A. Astrup is the recipient of honoraria as speaker for a wide range of Danish and international concerns and receives royalties from textbooks, and from popular diet and cookery books. A. Astrup is also co-inventor of a number of patents, including Methods of inducing weight loss, treating obesity and preventing weight gain (licensee Gelesis, USA) and Biomarkers for predicting degree of weight loss (licensee Nestec SA, CH), owned by the University of Copenhagen, in accordance with Danish law. I. Barroso and spouse own stock in GlaxoSmithKline and Incyte Corporation. B.H. Chen is now an employee of Life Epigenetics, Inc.; all work was completed prior to employment at Life Epigenetics. A.Y. Chu is now an employee of Merck & Co.; all work was completed prior to employment by Merck & Co. J.C. Florez has received consulting honoraria from Janssen. J. Gayan is now an employee of F. Hoffmann-La Roche Ltd, and owns stock of Roche and GlaxoSmithKline. A.L. Gloyn has received honoraria from Merck and Novo Nordisk. As of June 2019, ALG discloses that her spouse is an employee of Genentech and hold stock options in Roche. E. Ingelsson is now an employee of GSK; all work was completed prior to his employment by GSK. W. März has received grants and/or personal fees from the following companies/corporations: Siemens Healthineers, Aegerion Pharmaceuticals, AMGEN, Astrazeneca, Sanofi, Alexion Pharmaceuticals, BASF, Abbott Diagnostics Numares AG, Berlin-Chemie, Akzea Therapeutics, Bayer Vital GmbH, bestbion dx GmbH, Boehringer Ingelheim Pharma GmbH Co KG, Immundiagnostik GmbH, Merck Chemicals GmbH, MSD Sharp and Dohme GmbH, Novartis Pharma GmbH, Olink Proteomics, and Synlab Holding Deutschland GmbH. M.I. McCarthy has served on advisory panels for Pfizer, NovoNordisk, Zoe Global and received honoraria from Merck, Pfizer, NovoNordisk and Eli Lilly. He holds stock options in Zoe Global and has received research funding from Abbvie, Astra Zeneca, Boehringer Ingelheim, Eli Lilly, Janssen, Merck, NovoNordisk, Pfizer, Roche, Sanofi Aventis, Servier, Takeda. He is now an employee of Genentech and a holder of Roche stock. J.B. Meigs has consulted for Quest Diagnostics, Inc., who manufacturers of an HbA1c assay. M.E. Montasser has received grant funding from Regeneron Pharmaceutials. M.E. Montasser is also an inventor on a patent that was published by the United States Patent and Trademark Office on December 6, 2018 under Publication Number US 2018-0346888, and international patent application that was published on December 13, 2018 under Publication Number WO-2018/226560; all work was completed before these COI arose, and are unrelated to this work. D. Mook-Kanamori is a part-time clinical research consultant for Metabolon. J.L. Nadler is a member of the Scientific Advisory Board for Veralox Therapeutics Inc. C.N.A. Palmer has received research support from GlaxoSmithKline and AstraZeneca unrelated to this project. B.M. Psaty serves on the Steering Committee of the Yale Open Data Access Project funded by Johnson & Johnson. N. Sattar has consulted for Astrazeneca, Boehringer Ingelheim, Eli Lilly, Novo Nordisk, Napp and Sanofi and received grant support from Boehringer Ingelheim. R.A. Scott is an employee and shareholder of GlaxoSmithKline. T. Spector is the founder of Zoe Global Ltd. J. Tuomilehto receives research support from Bayer, is a consultant for Eli Lily, and holds stock in Orion Pharma and Aktivolabs Ltd.
Data Availability
Ancestry-specific and overall meta-analysis summary level results are available through the MAGIC website (https://www.magicinvestigators.org/). Summary statistics are also available through the GWAS catalogue (https://www.ebi.ac.uk/gwas/) with the following accession codes: GCST90002225, GCST90002226, GCST90002227, GCST90002228, GCST90002229, GCST90002230, GCST90002231, GCST90002232, GCST90002233, GCST90002234, GCST90002235, GCST90002236, GCST90002237, GCST90002238, GCST90002239, GCST90002240, GCST90002241, GCST90002242, GCST90002243, GCST90002244, GCST90002245, GCST90002246, GCST90002247, and GCST90002248.
Code availability
Source code implementing methods described in the paper are publicly available on https://zenodo.org/badge/latestdoi/346687844.
References
- 1.Use of Glycated Haemoglobin (HbA1c) in the Diagnosis of Diabetes Mellitus: Abbreviated Report of a WHO Consultation. World Health Organization; 2011. Copyright © World Health Organization 2011. [PubMed] [Google Scholar]
- 2.Goodarzi MO, et al. Fasting insulin reflects heterogeneous physiological processes: role of insulin clearance. American journal of physiology Endocrinology and metabolism. 2011;301:E402–408. doi: 10.1152/ajpendo.00013.2011. [DOI] [PMC free article] [PubMed] [Google Scholar]
- 3.Dimas AS, et al. Impact of type 2 diabetes susceptibility variants on quantitative glycemic traits reveals mechanistic heterogeneity. Diabetes. 2014;63:2158–2171. doi: 10.2337/db13-0949. [DOI] [PMC free article] [PubMed] [Google Scholar]
- 4.Udler MS, et al. Type 2 diabetes genetic loci informed by multi-trait associations point to disease mechanisms and subtypes: A soft clustering analysis. PLoS medicine. 2018;15:e1002654. doi: 10.1371/journal.pmed.1002654. [DOI] [PMC free article] [PubMed] [Google Scholar]
- 5.Udler MS, McCarthy MI, Florez JC, Mahajan A. Genetic Risk Scores for Diabetes Diagnosis and Precision Medicine. Endocrine reviews. 2019;40:1500–1520. doi: 10.1210/er.2019-00088. [DOI] [PMC free article] [PubMed] [Google Scholar]
- 6.Sarwar N, et al. Diabetes mellitus, fasting blood glucose concentration, and risk of vascular disease: a collaborative meta-analysis of 102 prospective studies. Lancet. 2010;375:2215–2222. doi: 10.1016/s0140-6736(10)60484-9. [DOI] [PMC free article] [PubMed] [Google Scholar]
- 7.Wheeler E, et al. Impact of common genetic determinants of Hemoglobin A1c on type 2 diabetes risk and diagnosis in ancestrally diverse populations: A transethnic genome-wide meta-analysis. PLoS medicine. 2017;14:e1002383. doi: 10.1371/journal.pmed.1002383. [DOI] [PMC free article] [PubMed] [Google Scholar]
- 8.Dupuis J, et al. New genetic loci implicated in fasting glucose homeostasis and their impact on type 2 diabetes risk. Nature genetics. 2010;42:105–116. doi: 10.1038/ng.520. [DOI] [PMC free article] [PubMed] [Google Scholar]
- 9.Manning AK, et al. A genome-wide approach accounting for body mass index identifies genetic variants influencing fasting glycemic traits and insulin resistance. Nature genetics. 2012;44:659–669. doi: 10.1038/ng.2274. [DOI] [PMC free article] [PubMed] [Google Scholar]
- 10.Walford GA, et al. Genome-Wide Association Study of the Modified Stumvoll Insulin Sensitivity Index Identifies BCL2 and FAM19A2 as Novel Insulin Sensitivity Loci. Diabetes. 2016;65:3200–3211. doi: 10.2337/db16-0199. [DOI] [PMC free article] [PubMed] [Google Scholar]
- 11.Horikoshi M, et al. Discovery and Fine-Mapping of Glycaemic and Obesity-Related Trait Loci Using High-Density Imputation. PLoS genetics. 2015;11:e1005230. doi: 10.1371/journal.pgen.1005230. [DOI] [PMC free article] [PubMed] [Google Scholar]
- 12.Mahajan A, et al. Identification and functional characterization of G6PC2 coding variants influencing glycemic traits define an effector transcript at the G6PC2-ABCB11 locus. PLoS genetics. 2015;11:e1004876. doi: 10.1371/journal.pgen.1004876. [DOI] [PMC free article] [PubMed] [Google Scholar]
- 13.Hwang JY, et al. Genome-wide association meta-analysis identifies novel variants associated with fasting plasma glucose in East Asians. Diabetes. 2015;64:291–298. doi: 10.2337/db14-0563. [DOI] [PMC free article] [PubMed] [Google Scholar]
- 14.Chen P, et al. Multiple nonglycemic genomic loci are newly associated with blood level of glycated hemoglobin in East Asians. Diabetes. 2014;63:2551–2562. doi: 10.2337/db13-1815. [DOI] [PMC free article] [PubMed] [Google Scholar]
- 15.Scott RA, et al. Large-scale association analyses identify new loci influencing glycemic traits and provide insight into the underlying biological pathways. Nature genetics. 2012;44:991–1005. doi: 10.1038/ng.2385. [DOI] [PMC free article] [PubMed] [Google Scholar]
- 16.Spanakis EK, Golden SH. Race/ethnic difference in diabetes and diabetic complications. Current diabetes reports. 2013;13:814–823. doi: 10.1007/s11892-013-0421-9. [DOI] [PMC free article] [PubMed] [Google Scholar]
- 17.Tillin T, et al. Insulin resistance and truncal obesity as important determinants of the greater incidence of diabetes in Indian Asians and African Caribbeans compared with Europeans: the Southall And Brent REvisited (SABRE) cohort. Diabetes care. 2013;36:383–393. doi: 10.2337/dc12-0544. [DOI] [PMC free article] [PubMed] [Google Scholar]
- 18.Whincup PH, et al. Early emergence of ethnic differences in type 2 diabetes precursors in the UK: the Child Heart and Health Study in England (CHASE Study) PLoS medicine. 2010;7:e1000263. doi: 10.1371/journal.pmed.1000263. [DOI] [PMC free article] [PubMed] [Google Scholar]
- 19.Auton A, et al. A global reference for human genetic variation. Nature. 2015;526:68–74. doi: 10.1038/nature15393. [DOI] [PMC free article] [PubMed] [Google Scholar]
- 20.Willer CJ, Li Y, Abecasis GR. METAL: fast and efficient meta-analysis of genomewide association scans. Bioinformatics (Oxford, England) 2010;26:2190–2191. doi: 10.1093/bioinformatics/btq340. [DOI] [PMC free article] [PubMed] [Google Scholar]
- 21.Yang J, Lee SH, Goddard ME, Visscher PM. GCTA: a tool for genome-wide complex trait analysis. American journal of human genetics. 2011;88:76–82. doi: 10.1016/j.ajhg.2010.11.011. [DOI] [PMC free article] [PubMed] [Google Scholar]
- 22.Yang J, et al. Conditional and joint multiple-SNP analysis of GWAS summary statistics identifies additional variants influencing complex traits. Nature genetics. 2012;44:369–375. s361–363. doi: 10.1038/ng.2213. [DOI] [PMC free article] [PubMed] [Google Scholar]
- 23.Genome-wide association study of 14,000 cases of seven common diseases and 3,000 shared controls. Nature. 2007;447:661–678. doi: 10.1038/nature05911. [DOI] [PMC free article] [PubMed] [Google Scholar]
- 24.Mahajan A, et al. Trans-ancestry genetic study of type 2 diabetes highlights the power of diverse populations for discovery and translation. medRxiv. 2020:2020.2009.2022.20198937. doi: 10.1101/2020.09.22.20198937. [DOI] [PMC free article] [PubMed] [Google Scholar]
- 25.Mahajan A, et al. Fine-mapping type 2 diabetes loci to single-variant resolution using high-density imputation and islet-specific epigenome maps. Nature genetics. 2018;50:1505–1513. doi: 10.1038/s41588-018-0241-6. [DOI] [PMC free article] [PubMed] [Google Scholar]
- 26.Spracklen CN, et al. Identification of type 2 diabetes loci in 433,540 East Asian individuals. Nature. 2020;582:240–245. doi: 10.1038/s41586-020-2263-3. [DOI] [PMC free article] [PubMed] [Google Scholar]
- 27.Vujkovic M, et al. Discovery of 318 new risk loci for type 2 diabetes and related vascular outcomes among 1.4 million participants in a multi-ancestry meta-analysis. Nature genetics. 2020;52:680–691. doi: 10.1038/s41588-020-0637-y. [DOI] [PMC free article] [PubMed] [Google Scholar]
- 28.Luo Y, et al. Transcription factor Ets1 regulates expression of thioredoxin-interacting protein and inhibits insulin secretion in pancreatic beta-cells. PloS one. 2014;9:e99049. doi: 10.1371/journal.pone.0099049. [DOI] [PMC free article] [PubMed] [Google Scholar]
- 29.Braccini L, et al. PI3K-C2gamma is a Rab5 effector selectively controlling endosomal Akt2 activation downstream of insulin signalling. Nature communications. 2015;6:7400. doi: 10.1038/ncomms8400. [DOI] [PMC free article] [PubMed] [Google Scholar]
- 30.Ng NHJ, et al. Tissue-Specific Alteration of Metabolic Pathways Influences Glycemic Regulation. bioRxiv. 2019:790618. doi: 10.1101/790618. [DOI] [Google Scholar]
- 31.Aschard H, Vilhjalmsson BJ, Joshi AD, Price AL, Kraft P. Adjusting for heritable covariates can bias effect estimates in genome-wide association studies. American journal of human genetics. 2015;96:329–339. doi: 10.1016/j.ajhg.2014.12.021. [DOI] [PMC free article] [PubMed] [Google Scholar]
- 32.Lee JJ, et al. Gene discovery and polygenic prediction from a genome-wide association study of educational attainment in 1.1 million individuals. Nature genetics. 2018;50:1112–1121. doi: 10.1038/s41588-018-0147-3. [DOI] [PMC free article] [PubMed] [Google Scholar]
- 33.Nolte IM, et al. Missing heritability: is the gap closing? An analysis of 32 complex traits in the Lifelines Cohort Study. European journal of human genetics : EJHG. 2017;25:877–885. doi: 10.1038/ejhg.2017.50. [DOI] [PMC free article] [PubMed] [Google Scholar]
- 34.Ge T, Chen CY, Ni Y, Feng YA, Smoller JW. Polygenic prediction via Bayesian regression and continuous shrinkage priors. Nature communications. 2019;10:1776. doi: 10.1038/s41467-019-09718-5. [DOI] [PMC free article] [PubMed] [Google Scholar]
- 35.Dastani Z, et al. Novel loci for adiponectin levels and their influence on type 2 diabetes and metabolic traits: a multi-ethnic meta-analysis of 45,891 individuals. PLoS genetics. 2012;8:e1002607. doi: 10.1371/journal.pgen.1002607. [DOI] [PMC free article] [PubMed] [Google Scholar]
- 36.Martin AR, et al. Clinical use of current polygenic risk scores may exacerbate health disparities. Nature genetics. 2019;51:584–591. doi: 10.1038/s41588-019-0379-x. [DOI] [PMC free article] [PubMed] [Google Scholar]
- 37.Gaulton KJ, et al. Genetic fine mapping and genomic annotation defines causal mechanisms at type 2 diabetes susceptibility loci. Nature genetics. 2015;47:1415–1425. doi: 10.1038/ng.3437. [DOI] [PMC free article] [PubMed] [Google Scholar]
- 38.Spracklen CN, et al. Identification and functional analysis of glycemic trait loci in the China Health and Nutrition Survey. PLoS genetics. 2018;14:e1007275. doi: 10.1371/journal.pgen.1007275. [DOI] [PMC free article] [PubMed] [Google Scholar]
- 39.Varshney A, et al. Genetic regulatory signatures underlying islet gene expression and type 2 diabetes. Proceedings of the National Academy of Sciences of the United States of America. 2017;114:2301–2306. doi: 10.1073/pnas.1621192114. [DOI] [PMC free article] [PubMed] [Google Scholar]
- 40.Kichaev G, et al. Leveraging Polygenic Functional Enrichment to Improve GWAS Power. American journal of human genetics. 2019;104:65–75. doi: 10.1016/j.ajhg.2018.11.008. [DOI] [PMC free article] [PubMed] [Google Scholar]
- 41.Shriner D, Rotimi CN. Whole-Genome-Sequence-Based Haplotypes Reveal Single Origin of the Sickle Allele during the Holocene Wet Phase. American journal of human genetics. 2018;102:547–556. doi: 10.1016/j.ajhg.2018.02.003. [DOI] [PMC free article] [PubMed] [Google Scholar]
- 42.Kramer HJ, et al. African Ancestry-Specific Alleles and Kidney Disease Risk in Hispanics/Latinos. Journal of the American Society of Nephrology : JASN. 2017;28:915–922. doi: 10.1681/asn.2016030357. [DOI] [PMC free article] [PubMed] [Google Scholar]
- 43.Ravenhall M, et al. Novel genetic polymorphisms associated with severe malaria and under selective pressure in North-eastern Tanzania. PLoS genetics. 2018;14:e1007172. doi: 10.1371/journal.pgen.1007172. [DOI] [PMC free article] [PubMed] [Google Scholar]
- 44.Hodonsky CJ, et al. Genome-wide association study of red blood cell traits in Hispanics/Latinos: The Hispanic Community Health Study/Study of Latinos. PLoS genetics. 2017;13:e1006760. doi: 10.1371/journal.pgen.1006760. [DOI] [PMC free article] [PubMed] [Google Scholar]
- 45.Gurdasani D, et al. Uganda Genome Resource Enables Insights into Population History and Genomic Discovery in Africa. Cell. 2019;179:984–1002.:e1036. doi: 10.1016/j.cell.2019.10.004. [DOI] [PMC free article] [PubMed] [Google Scholar]
- 46.Rees MG, et al. Cellular characterisation of the GCKR P446L variant associated with type 2 diabetes risk. Diabetologia. 2012;55:114–122. doi: 10.1007/s00125-011-2348-5. [DOI] [PMC free article] [PubMed] [Google Scholar]
- 47.Bonomo JA, et al. The ras responsive transcription factor RREB1 is a novel candidate gene for type 2 diabetes associated end-stage kidney disease. Human molecular genetics. 2014;23:6441–6447. doi: 10.1093/hmg/ddu362. [DOI] [PMC free article] [PubMed] [Google Scholar]
- 48.Wessel J, et al. Low-frequency and rare exome chip variants associate with fasting glucose and type 2 diabetes susceptibility. Nature communications. 2015;6 doi: 10.1038/ncomms6897. 5897. [DOI] [PMC free article] [PubMed] [Google Scholar]
- 49.Scott RA, et al. A genomic approach to therapeutic target validation identifies a glucose-lowering GLP1R variant protective for coronary heart disease. Science translational medicine. 2016;8 doi: 10.1126/scitranslmed.aad3744. 341ra376. [DOI] [PMC free article] [PubMed] [Google Scholar]
- 50.Nai A, et al. TMPRSS6 rs855791 modulates hepcidin transcription in vitro and serum hepcidin levels in normal individuals. Blood. 2011;118:4459–4462. doi: 10.1182/blood-2011-06-364034. [DOI] [PubMed] [Google Scholar]
- 51.Soranzo N, et al. Common variants at 10 genomic loci influence hemoglobin A(1)(C) levels via glycemic and nonglycemic pathways. Diabetes. 2010;59:3229–3239. doi: 10.2337/db10-0502. [DOI] [PMC free article] [PubMed] [Google Scholar]
- 52.Sarnowski C, et al. Impact of Rare and Common Genetic Variants on Diabetes Diagnosis by Hemoglobin A1c in Multi-Ancestry Cohorts: The Trans-Omics for Precision Medicine Program. American journal of human genetics. 2019;105:706–718. doi: 10.1016/j.ajhg.2019.08.010. [DOI] [PMC free article] [PubMed] [Google Scholar]
- 53.Kundaje A, et al. Integrative analysis of 111 reference human epigenomes. Nature. 2015;518:317–330. doi: 10.1038/nature14248. [DOI] [PMC free article] [PubMed] [Google Scholar]
- 54.Nagel M, et al. Meta-analysis of genome-wide association studies for neuroticism in 449,484 individuals identifies novel genetic loci and pathways. Nature genetics. 2018;50:920–927. doi: 10.1038/s41588-018-0151-7. [DOI] [PubMed] [Google Scholar]
- 55.Savage JE, et al. Genome-wide association meta-analysis in 269,867 individuals identifies new genetic and functional links to intelligence. Nature genetics. 2018;50:912–919. doi: 10.1038/s41588-018-0152-6. [DOI] [PMC free article] [PubMed] [Google Scholar]
- 56.Schmidt EM, et al. GREGOR: evaluating global enrichment of trait-associated variants in epigenomic features using a systematic, data-driven approach. Bioinformatics (Oxford, England) 2015;31:2601–2606. doi: 10.1093/bioinformatics/btv201. [DOI] [PMC free article] [PubMed] [Google Scholar]
- 57.Parker SC, et al. Chromatin stretch enhancer states drive cell-specific gene regulation and harbor human disease risk variants. Proceedings of the National Academy of Sciences of the United States of America. 2013;110:17921–17926. doi: 10.1073/pnas.1317023110. [DOI] [PMC free article] [PubMed] [Google Scholar]
- 58.Pickrell JK. Joint analysis of functional genomic data and genome-wide association studies of 18 human traits. American journal of human genetics. 2014;94:559–573. doi: 10.1016/j.ajhg.2014.03.004. [DOI] [PMC free article] [PubMed] [Google Scholar]
- 59.Iotchkova V, et al. GARFIELD classifies disease-relevant genomic features through integration of functional annotations with association signals. Nature genetics. 2019;51:343–353. doi: 10.1038/s41588-018-0322-6. [DOI] [PMC free article] [PubMed] [Google Scholar]
- 60.van de Bunt M, et al. Transcript Expression Data from Human Islets Links Regulatory Signals from Genome-Wide Association Studies for Type 2 Diabetes and Glycemic Traits to Their Downstream Effectors. PLoS genetics. 2015;11:e1005694. doi: 10.1371/journal.pgen.1005694. [DOI] [PMC free article] [PubMed] [Google Scholar]
- 61.Civelek M, et al. Genetic Regulation of Adipose Gene Expression and Cardio-Metabolic Traits. American journal of human genetics. 2017;100:428–443. doi: 10.1016/j.ajhg.2017.01.027. [DOI] [PMC free article] [PubMed] [Google Scholar]
- 62.Scott LJ, et al. The genetic regulatory signature of type 2 diabetes in human skeletal muscle. Nature communications. 2016;7:11764. doi: 10.1038/ncomms11764. [DOI] [PMC free article] [PubMed] [Google Scholar]
- 63.Ben Harouch S, Klar A, Falik Zaccai TC. GeneReviews((R)) In: Adam MP, et al., editors. GeneReviews is a registered trademark of the University of Washington, Seattle. University of Washington; Seattle: 1993. University of Washington, Seattle All rights reserved. [Google Scholar]
- 64.Agus DB, et al. Vitamin C crosses the blood-brain barrier in the oxidized form through the glucose transporters. The Journal of clinical investigation. 1997;100:2842–2848. doi: 10.1172/jci119832. [DOI] [PMC free article] [PubMed] [Google Scholar]
- 65.Wolking S, et al. Focal epilepsy in glucose transporter type 1 (Glut1) defects: case reports and a review of literature. Journal of neurology. 2014;261:1881–1886. doi: 10.1007/s00415-014-7433-5. [DOI] [PubMed] [Google Scholar]
- 66.Guallar D, et al. RNA-dependent chromatin targeting of TET2 for endogenous retrovirus control in pluripotent stem cells. Nature genetics. 2018;50:443–451. doi: 10.1038/s41588-018-0060-9. [DOI] [PMC free article] [PubMed] [Google Scholar]
- 67.Bian F, et al. TET2 facilitates PPARgamma agonist-mediated gene regulation and insulin sensitization in adipocytes. Metabolism: clinical and experimental. 2018;89:39–47. doi: 10.1016/j.metabol.2018.08.006. [DOI] [PMC free article] [PubMed] [Google Scholar]
- 68.Yoo Y, et al. TET-mediated hydroxymethylcytosine at the Ppargamma locus is required for initiation of adipogenic differentiation. International journal of obesity (2005) 2017;41:652–659. doi: 10.1038/ijo.2017.8. [DOI] [PubMed] [Google Scholar]
- 69.Lees JA, et al. Science. Vol. 355. New York, N.Y: 2017. Lipid transport by TMEM24 at ER-plasma membrane contacts regulates pulsatile insulin secretion. [DOI] [PMC free article] [PubMed] [Google Scholar]
- 70.Pottekat A, et al. Insulin biosynthetic interaction network component, TMEM24, facilitates insulin reserve pool release. Cell reports. 2013;4:921–930. doi: 10.1016/j.celrep.2013.07.050. [DOI] [PMC free article] [PubMed] [Google Scholar]
- 71.Androulakis II, et al. Patients with apparently nonfunctioning adrenal incidentalomas may be at increased cardiovascular risk due to excessive cortisol secretion. The Journal of clinical endocrinology and metabolism. 2014;99:2754–2762. doi: 10.1210/jc.2013-4064. [DOI] [PubMed] [Google Scholar]
- 72.Altieri B, et al. Adrenocortical tumors and insulin resistance: What is the first step? International journal of cancer. 2016;138:2785–2794. doi: 10.1002/ijc.29950. [DOI] [PubMed] [Google Scholar]
- 73.Johansson M, et al. The influence of obesity-related factors in the etiology of renal cell carcinoma-A mendelian randomization study. PLoS medicine. 2019;16:e1002724. doi: 10.1371/journal.pmed.1002724. [DOI] [PMC free article] [PubMed] [Google Scholar]
- 74.Diamanti-Kandarakis E, Dunaif A. Insulin resistance and the polycystic ovary syndrome revisited: an update on mechanisms and implications. Endocrine reviews. 2012;33:981–1030. doi: 10.1210/er.2011-1034. [DOI] [PMC free article] [PubMed] [Google Scholar]
- 75.Morris AP, et al. Large-scale association analysis provides insights into the genetic architecture and pathophysiology of type 2 diabetes. Nature genetics. 2012;44:981–990. doi: 10.1038/ng.2383. [DOI] [PMC free article] [PubMed] [Google Scholar]
- 76.Leong A, et al. Mendelian Randomization Analysis of Hemoglobin A(1c) as a Risk Factor for Coronary Artery Disease. Diabetes care. 2019;42:1202–1208. doi: 10.2337/dc18-1712. [DOI] [PMC free article] [PubMed] [Google Scholar]
- 77.Duncan L, et al. Analysis of polygenic risk score usage and performance in diverse human populations. Nature communications. 2019;10 doi: 10.1038/s41467-019-11112-0. 3328. [DOI] [PMC free article] [PubMed] [Google Scholar]
- 78.Mostafavi H, et al. Variable prediction accuracy of polygenic scores within an ancestry group. eLife. 2020;9 doi: 10.7554/eLife.48376. [DOI] [PMC free article] [PubMed] [Google Scholar]
- 79.Choi SW, Mak TS, O’Reilly PF. Tutorial: a guide to performing polygenic risk score analyses. Nature protocols. 2020;15:2759–2772. doi: 10.1038/s41596-020-0353-1. [DOI] [PMC free article] [PubMed] [Google Scholar]
- 80.D’Orazio P, et al. Approved IFCC recommendation on reporting results for blood glucose (abbreviated) Clinical chemistry. 2005;51:1573–1576. doi: 10.1373/clinchem.2005.051979. [DOI] [PubMed] [Google Scholar]
- 81.Voight BF, et al. The metabochip, a custom genotyping array for genetic studies of metabolic, cardiovascular, and anthropometric traits. PLoS genetics. 2012;8:e1002793. doi: 10.1371/journal.pgen.1002793. [DOI] [PMC free article] [PubMed] [Google Scholar]
- 82.Abecasis GR, et al. An integrated map of genetic variation from 1,092 human genomes. Nature. 2012;491:56–65. doi: 10.1038/nature11632. [DOI] [PMC free article] [PubMed] [Google Scholar]
- 83.Li Y, Willer CJ, Ding J, Scheet P, Abecasis GR. MaCH: using sequence and genotype data to estimate haplotypes and unobserved genotypes. Genetic epidemiology. 2010;34:816–834. doi: 10.1002/gepi.20533. [DOI] [PMC free article] [PubMed] [Google Scholar]
- 84.Pei YF, Zhang L, Li J, Deng HW. Analyses and comparison of imputation-based association methods. PloS one. 2010;5:e10827. doi: 10.1371/journal.pone.0010827. [DOI] [PMC free article] [PubMed] [Google Scholar]
- 85.Winkler TW, et al. Quality control and conduct of genome-wide association meta-analyses. Nature protocols. 2014;9:1192–1212. doi: 10.1038/nprot.2014.071. [DOI] [PMC free article] [PubMed] [Google Scholar]
- 86.Devlin B, Roeder K. Genomic control for association studies. Biometrics. 1999;55:997–1004. doi: 10.1111/j.0006-341x.1999.00997.x. [DOI] [PubMed] [Google Scholar]
- 87.Morris AP. Transethnic meta-analysis of genomewide association studies. Genetic epidemiology. 2011;35:809–822. doi: 10.1002/gepi.20630. [DOI] [PMC free article] [PubMed] [Google Scholar]
- 88.Bulik-Sullivan BK, et al. LD Score regression distinguishes confounding from polygenicity in genome-wide association studies. Nature genetics. 2015;47:291–295. doi: 10.1038/ng.3211. [DOI] [PMC free article] [PubMed] [Google Scholar]
- 89.Dastani Z, et al. Novel loci for adiponectin levels and their influence on type 2 diabetes and metabolic traits: a multi-ethnic meta-analysis of 45,891 individuals. PLoS genetics. 2012;8:e1002607. doi: 10.1371/journal.pgen.1002607. [DOI] [PMC free article] [PubMed] [Google Scholar]
- 90.Benner C, et al. FINEMAP: efficient variable selection using summary data from genome-wide association studies. Bioinformatics (Oxford, England) 2016;32:1493–1501. doi: 10.1093/bioinformatics/btw018. [DOI] [PMC free article] [PubMed] [Google Scholar]
- 91.Astle WJ, et al. The Allelic Landscape of Human Blood Cell Trait Variation and Links to Common Complex Disease. Cell. 2016;167:1415–1429.:e1419. doi: 10.1016/j.cell.2016.10.042. [DOI] [PMC free article] [PubMed] [Google Scholar]
- 92.Canela-Xandri O, Rawlik K, Tenesa A. atlas of genetic associations in UK Biobank. Nature genetics. 2018;50:1593–1599. doi: 10.1038/s41588-018-0248-z. [DOI] [PMC free article] [PubMed] [Google Scholar]
- 93.Benyamin B, et al. Novel loci affecting iron homeostasis and their effects in individuals at risk for hemochromatosis. Nature communications. 2014;5 doi: 10.1038/ncomms5926. 4926. [DOI] [PMC free article] [PubMed] [Google Scholar]
- 94.Binesh N, Rezghi M. Fuzzy clustering in community detection based on nonnegative matrix factoriztion with two novel evaluation criteria. Applied Soft Computing. 2018;69:689–703. [Google Scholar]
- 95.Scott RA, et al. An Expanded Genome-Wide Association Study of Type 2 Diabetes in Europeans. Diabetes. 2017;66:2888–2902. doi: 10.2337/db16-1253. [DOI] [PMC free article] [PubMed] [Google Scholar]
- 96.Ernst J, et al. Mapping and analysis of chromatin state dynamics in nine human cell types. Nature. 2011;473:43–49. doi: 10.1038/nature09906. [DOI] [PMC free article] [PubMed] [Google Scholar]
- 97.Mikkelsen TS, et al. Comparative epigenomic analysis of murine and human adipogenesis. Cell. 2010;143:156–169. doi: 10.1016/j.cell.2010.09.006. [DOI] [PMC free article] [PubMed] [Google Scholar]
- 98.Ernst J, Kellis M. ChromHMM: automating chromatin-state discovery and characterization. Nature methods. 2012;9:215–216. doi: 10.1038/nmeth.1906. [DOI] [PMC free article] [PubMed] [Google Scholar]
- 99.Battle A, Brown CD, Engelhardt BE, Montgomery SB. Genetic effects on gene expression across human tissues. Nature. 2017;550:204–213. doi: 10.1038/nature24277. [DOI] [PMC free article] [PubMed] [Google Scholar]
- 100.Zhernakova DV, et al. Identification of context-dependent expression quantitative trait loci in whole blood. Nature genetics. 2017;49:139–145. doi: 10.1038/ng.3737. [DOI] [PubMed] [Google Scholar]
- 101.Westra HJ, et al. Systematic identification of trans eQTLs as putative drivers of known disease associations. Nature genetics. 2013;45:1238–1243. doi: 10.1038/ng.2756. [DOI] [PMC free article] [PubMed] [Google Scholar]
- 102.Joehanes R, et al. Integrated genome-wide analysis of expression quantitative trait loci aids interpretation of genomic association studies. Genome biology. 2017;18:16. doi: 10.1186/s13059-016-1142-6. [DOI] [PMC free article] [PubMed] [Google Scholar]
- 103.Pers TH, et al. Biological interpretation of genome-wide association studies using predicted gene functions. Nature communications. 2015;6 doi: 10.1038/ncomms6890. 5890. [DOI] [PMC free article] [PubMed] [Google Scholar]
Associated Data
This section collects any data citations, data availability statements, or supplementary materials included in this article.
Supplementary Materials
Data Availability Statement
Ancestry-specific and overall meta-analysis summary level results are available through the MAGIC website (https://www.magicinvestigators.org/). Summary statistics are also available through the GWAS catalogue (https://www.ebi.ac.uk/gwas/) with the following accession codes: GCST90002225, GCST90002226, GCST90002227, GCST90002228, GCST90002229, GCST90002230, GCST90002231, GCST90002232, GCST90002233, GCST90002234, GCST90002235, GCST90002236, GCST90002237, GCST90002238, GCST90002239, GCST90002240, GCST90002241, GCST90002242, GCST90002243, GCST90002244, GCST90002245, GCST90002246, GCST90002247, and GCST90002248.
Source code implementing methods described in the paper are publicly available on https://zenodo.org/badge/latestdoi/346687844.


