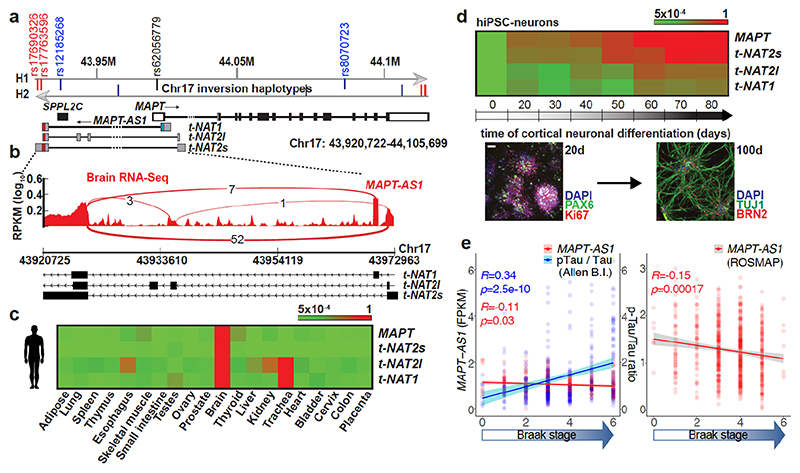
Fig. 1. MAPT-AS1 is brain-enriched, expressed during neuronal differentiation and inversely correlated to tau pathology.
a, MAPT-AS1 and MAPT genes (hg19). Grey arrows indicate inverted H1/H2 haplotypes, with haplotype-tagging SNPs (blue); PD-linked rs12185268; PSP and PD-associated rs8070723 SNPs in MAPT 5’UTR (black) and MAPT-AS1 (red). MAPT coding-exons are in black; UTRs in white; MAPT-AS1 exons in grey; MIR in red, AS exonic-overlap in blue. b, Sashimi-plot of brain RNA-seq (log10RPKM) with splice-junctions counts. c, MAPT and MAPT-AS1 relative expression by qRT-PCR (2–ΔΔCt/2–ΔΔCt max) in human tissues and (d) during iPSC differentiation into cortical neurons (0-80 days), scale bar =40 μm, n=3 independent experiments e, Linear regression: mean MAPT-AS1 expression from brain RNA-seq (red line) inversely correlates with mean tau pathology (blue line; phospho-tau(AT8):total-tau, Luminex-immunoassay) and Braak-stage in Allen (left) and ROS-MAP (right) cohorts, error bars:95%CI, R:Pearson’s correlation coefficient, (two-sided p-value, t-distribution with n-2 def).

