Abstract
Vein of Galen malformation is a rare congenital pathological intracranial arteriovenous shunt which carries 30% risk of death before 28 days-of-age. Treatment is by high risk minimally invasive endovascular glue embolization of shunt feeding arteries under angiographic control. A tool to support intra-operative decision making would be useful. We present a novel method for visualizing angiography data to demonstrate the effect of the intervention based upon change the after embolization in the delay in time of peak contrast density relative to the injected artery and a novel method for quantifying the immediate effect of embolization on the hemodynamics of the shunt. The method is demonstrated on the angiograms of five neonates who underwent embolization. We show consistent results including a post-embolization increase in the delay in time of peak contrast density relative to the injected artery at the venous outflow in keeping with reduced shunting and redistribution of blood following embolization.
Index Terms: Vein of Galen malformation, embolization, quantitative angiography, vessel flow
1. Introduction
Vein of Galen malformation is a rare congenital (approximately 1 in 25,000 deliveries) intra-cranial arteriovenous malformation, which results in blood being shunted away from brain parenchyma. Untreated it is almost universally fatal secondary to high output cardiac failure and/or neurological damage. Treatment is by intra-cranial endovascular embolization, often starting in the neonatal period, to slow flow through the malformation and help blood to be redistributed to the parenchyma a number of feeding arteries are closed with glue.
Currently the immediate effect of embolization is monitored by the visual inspection of flow through the malformation on angiography post embolization. The first embolization procedure is the most technically difficult (due to high flow, patient and therefore cerebral vessel size and fragility) and the most critical. Each vessel closure carries the risk intra-cranial haemorrhage and death. Even with embolization mortality is 30% often related to peri-procedural intracranial haemorrhage [1]. There is currently no technique that can inform the risk-benefit balance of sufficient treatment to preserve life against risk of bleeding. Therefore, a measure of effect of embolization is critical in this group and a method for quantifying the effect of treatment would be useful in guiding decision making intra-procedurally and may be useful for prognostication.
The contributions of this paper are two-fold. First, we present a novel method for visualizing angiography data to demonstrate the effect of radiological intervention. Secondly, we present a novel method for quantifying the immediate effect of embolization on the hemodynamics of the shunt.
2. Materials and Methods
2.1. Image Acquisition
This study retrospectively analyzed anonymized angiography studies previously obtained in the course of normal care and was exempt from ethics board review. Operations were performed by one of two interventional neuroradiologists of at least 5 years post fellowship experience, under general anesthesia, with neuromuscular relaxation, on a bi-plane Siemens Artis Zee (Siemens Healthcare, Erlangen, Germany) machine. Pre- and post-embolization angiograms were acquired with: the X-ray detectors and table in the same positions, ventilation suspended, hand injection of 2-3 cc of Omnipaque™ 240 (iohexol) (GE Healthcare, Chicago, Illinois, USA) through a 4 French catheter with its tip positioned in the internal carotid or vertebral arteries, and depending on operator preference a field of view of 22 cm (1024 x 1024 pixels) or 32 cm (1440 x 1440 pixels) and a variable frame rate of 4, 7.5 or 15 frames/second up to four seconds then 1 frame/second.
We test our proposed method on lateral and frontal projection pre- and post-embolization angiograms taken at the first embolization of vein of Galen malformation in 5 babies ≤ 2 weeks old.
2.2. Data Analysis
The pre- and post-embolization angiograms were anonymized and processed using in house software developed in MATLAB R2016b (MathWorks®, The MathWorks, Natick, MA, USA) on a laptop computer with 16 GB memory and 3.1 GHz Intel Core i7 processor.
2.2.1. Registration & Region of Interest Selection
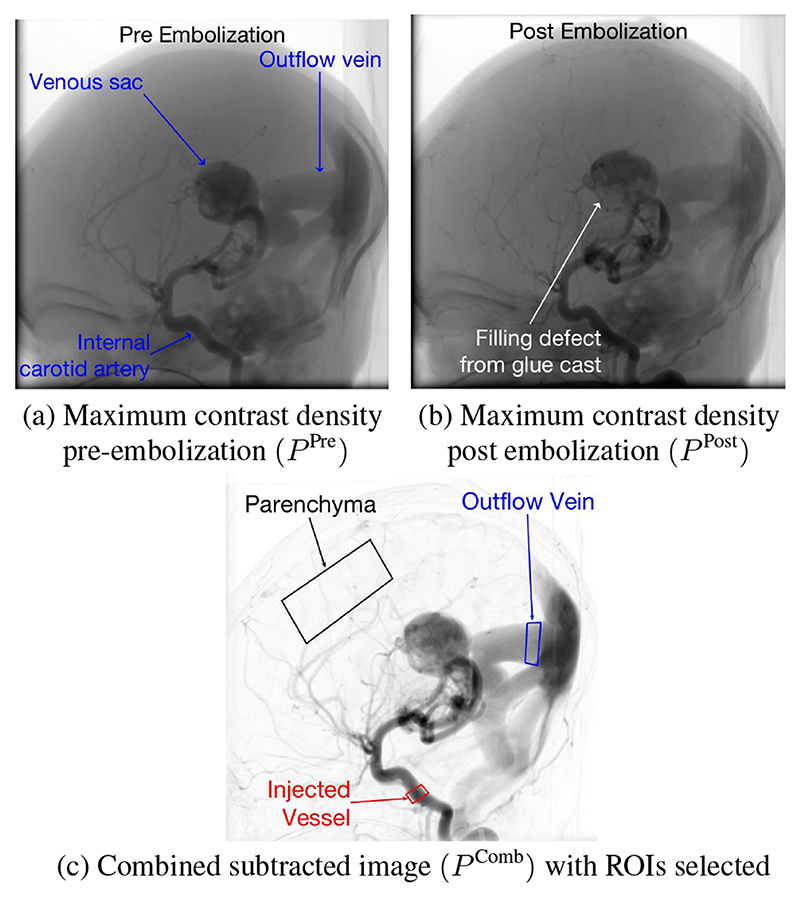
Image registration was performed to account for small variations in table and detector positioning or small patient movements on the table due to operator-patient contact. The angiograms are 2D representations of 3D structures therefore the motion is expected to be non-rigid and an affine registration most robust. To achieve the best registration, un-subtracted maximum contrast density images were used to make use of the bony features of the calvarium and features from all contrast agent opacified vessels. Initially, single images of maximum contrast agent density for the pre- and post-embolization angiograms (P Pre and P Post) (Fig. 1a,b) were produced as follows:
| (1) |
where i and j represent the pixel location in image domain Ω, A is the angiogram and f is the frame number in the angiogram. Affine registration of P Pre and P Post was performed. The transformation derived from image registration was used to re-sample P Post and A Post to produce registered P Post (P Reg-Post) and registered A Post (A Reg-Post).
Fig. 1. Registration and ROI selection.
To allow best visualization of the vessels and selection of regions of interest (ROI), a combined subtracted image (Fig. 1c) was then produced as follows:
| (2) |
ROIs were selected from P Comb in the injected artery feeding the shunt (ROIInj), the outflow vein (ROIout) and the parenchyma (ROIBrain) (Fig. 1c).
The pre- and post-embolization angiograms (A Pre and A Reg,Post) and ROI’s were all down sampled to 500 x 500 pixels using bicubic interpolation to improve convergence speed.
Time-Density Curves (TDC) were analyzed on a pixel-by-pixel basis. The neonatal heart rate is typically 110-160 beats per minute, and in these patients is often higher secondary to high output cardiac failure. Therefore, the pulsatile effect of the cardiac cycle on the contrast bolus results in noise in the acquired temporal contrast agent density curves. A low-pass filter was applied to remove the influence of the heart rate on the relatively low sampling frequency. The smoothing filter was Gaussian with a standard-deviation of 0.25 seconds chosen by visual inspection.
2.2.2. Visualization
To produce a robust estimate of the peak contrast agent density at each pixel location, a cubic interpolation of Aij(f) (adjusted to account for variable frame rate) was performed yielding contrast maxima and minima at points of inflexion and estimates of the time-to-peak (TTP) and Aij(f′) for any arbitrary frame:
| (3) |
where TTP is the time with the highest pixel density.
Some areas in the angiograms received no substantial contrast agent opacification. In these regions, TTP was noisy due to intraangiography motion, X-ray scatter and quantum mottle. This noise was filtered by setting a threshold of 25 units on the machine exported gray scale based upon the levels seen in non-tissue containing areas. Where the TTP was less than this threshold it was set to undefined. We calculated mean time to peak in the ROIInj and used this to calculate the delay in time to peak relative to ROIInj:
| (4) |
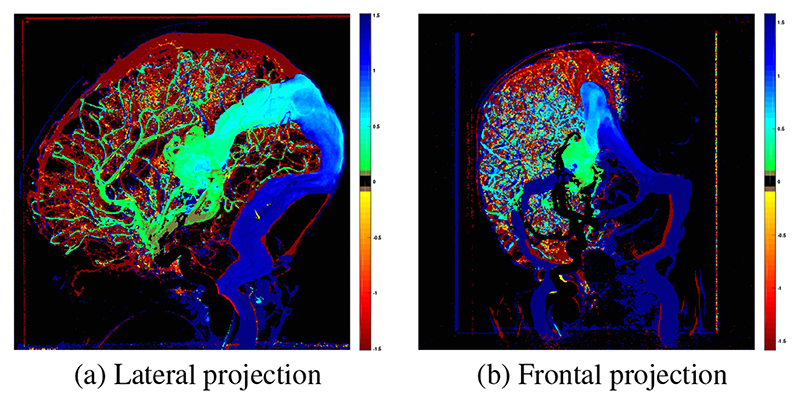
where DTPij is the relative time to peak density and represents the time taken for contrast agent to travel from the ROIInj to pixel (i,j). The final novel colour map of the ΔDTPij was produced by subtracting from (Fig. 2).
Fig. 2.
Example map of Δ DTP. Green - blue indicates longer DTP, yellow - red indicates shorter DTP and black indicates no change in DTP post-embolization. Contrast injections were performed in the right internal carotid artery therefore no change is seen in the left hemisphere on the frontal projection.
2.2.3. Flow Quantification
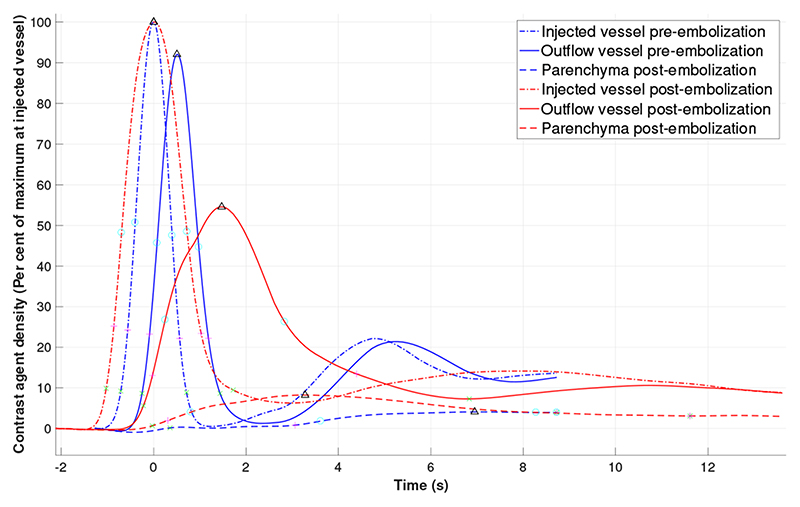
For the A Pre and A Reg-Post the mean contrast agent density at ROIInj was calculated to generate TDCs for ROIInj. TDCs were also generated for ROIOut and ROIBrain. For each TDC, f′ was adjusted by subtracting DTP ROI. The baseline for each TDC was calculated by averaging the contrast agent density over the first 10 interpolated images and this was subtracted from each curve to adjust the baselines.
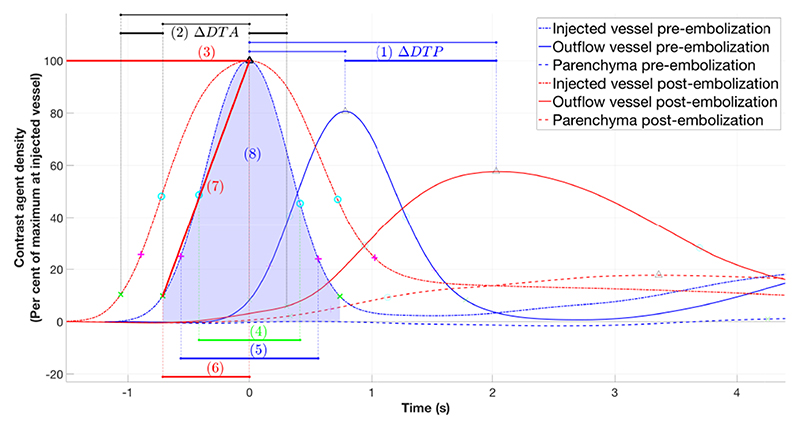
The following parameters from the TDC for each ROI were reported (Fig. 3):
The DTP between ROIInj to ROIOut pre- and post-embolization and the ΔDTP;
The delay in time of arrival of contrast agent (DTA) between ROIOut and at ROIInj pre- and post-embolization and the ΔDTA, where contrast agent arrival was considered to have occurred when the contrast agent density reached 10% of the maximum value in that ROI;
Peak contrast agent density (as a % of the peak contrast density at ROIInj);
Full width at half maximum;
Full width at quarter maximum [2];
Wash in time, defined as the time needed for contrast agent density to change from 10% to 100% [2];
Gradient of wash in [2];
Area under the curve, taking the curve from a density threshold of 10% of the peak contrast agent density either side of the peak contrast agent density.
Fig. 3. Curves with parameters 1-8 demonstrated.
To control for differences in the intra-operative contrast injections which were performed by hand for each parameter we report the post-embolization ROIInj normalized to the pre-embolization ROIInj.
3. Results
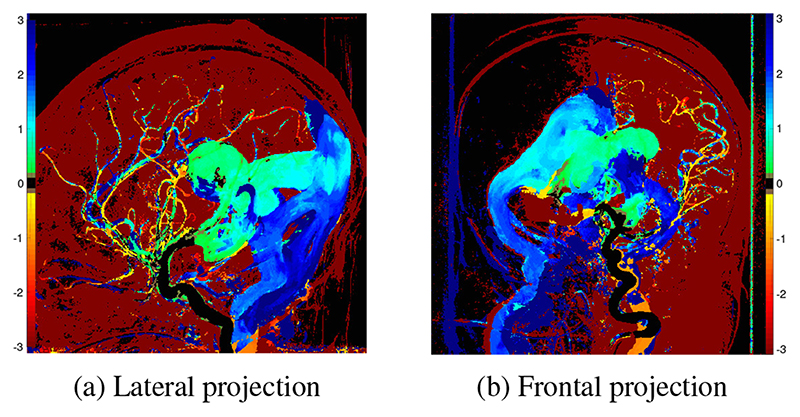
TDCs and a color map of ΔDTP were successfully generated for the lateral and frontal projection angiogram for each patient (Fig. 2 & 4). In keeping with the physiological aim of embolization, these clearly demonstrate slowing of flow of the blood from the injected vessel through the shunt to the outflow veins. Additionally, increase in speed of transit of blood from the injected vessel to the parenchyma is seen. The frontal projections (Fig. 2b & 4b) demonstrate single hemisphere changes on the side of the injected vessel.
Fig. 4.
Map of ΔDTP as a result of embolization derived from lateral projection angiograms in a 1-day-old patient (patient 1). Color scale as per Fig. 2.
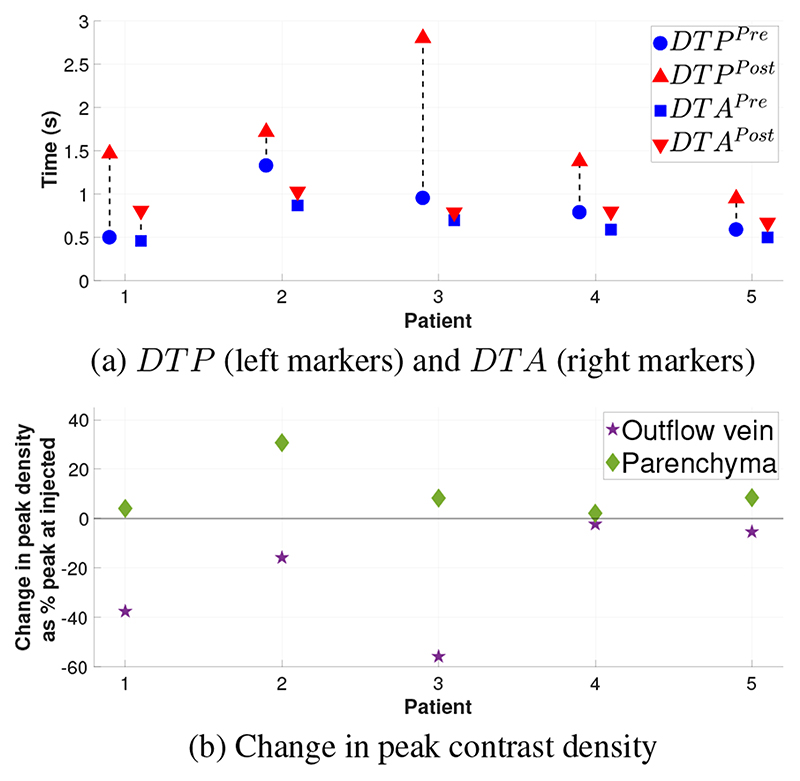
TDCs for each ROI pre- and post-embolization were generated (Fig. 3 & 5). Due to intra-cranial anatomical relationships, the lateral projections provide the clearer views of the injected blood vessel, the venous sac where the pathological arterio-venous connections lie and the outflow veins. Therefore, the TDC derived data from the lateral projections are presented in Table. 1. The TDCs (Fig. 3 & 5) show there is a increase DTP post-embolization. This increase is consistent for all patients, ranging from increase by 29% to 197% of pre-embolization time. There is a consistent but smaller increase in the DTA (Fig. 6a). There is a consistent increase in the full width at half and quarter maximum. This is consistent with increased dispersion of the contrast bolus caused by increased resistance to flow as more blood is directed to normal vessels in the parenchyma. Similarly and in keeping with the desired re-distribution of blood flow, contrast density is increased in the brain parenchyma and reduced in the outflow vein in all patients (Fig. 6b). The patient who did not recover from heart failure (patient 5), had the smallest post-embolization DTP (Fig. 6a) and the smallest ΔDTP suggesting there may be a threshold to be reached.
Fig. 5. TDCs from lateral projection angiogram from patient 1.
Table 1. Selected data derived from lateral projection angiograms in 5 neonates. Unless otherwise stated, all data shown is at the outflow vein as % of the injected vessel pre-embolization.
| Patient | 1 | 2 | 3 | 4 | 5 | |
|---|---|---|---|---|---|---|
| Age at embolization (days) | 1 | 4 | 1 | 14 | 6 | |
| Number of vessels embolized | 3 | 6 | 5 | 3 | 5 | |
| Injected artery | Left carotid | Right carotid | Left carotid | Left carotid | Left vertebral | |
| Pre-embolization heart failure | Yes | Yes | Yes | Yes | Yes | |
| Resolution of hear failure post embolization | Yes | Yes | Yes | Yes | No | |
| 1. DTP between ROIInj to ROIOut | Pre embolization | 0.50 | 1.33 | 0.96 | 0.79 | 0.59 |
| Post embolization | 1.47 | 1.72 | 2.81 | 1.38 | 0.95 | |
| ΔDTP (in seconds) | 0.97 | 0.39 | 1.85 | 0.59 | 0.36 | |
| ΔDTP as % of Pre-embolization | 192.28% | 29.17% | 197.24% | 75.47% | 62.03% | |
| 2. DTA between ROIOut and ROIInj | ΔDTA as % of Pre-embolization | 75.40% | 17.58% | 22.05% | 35.00% | 34.33% |
| 3. Peak Density (outflow vessel) | Change | -37.50 | -15.77 | -55.77 | -2.23 | -5.35 |
| 4. Full width at half maximum | Pre embolization | 112.96 | 273.28 | 176.96 | 155.32 | 129.25 |
| Post embolization | 182.35 | 280.56 | 379.50 | 262.31 | 177.69 | |
| Change | 69.39 | 7.28 | 202.55 | 106.99 | 48.45 | |
| 5. Full width at quarter maximum [2] | Pre embolization | 113.16 | 260.49 | 219.47 | 165.15 | 128.39 |
| Post embolization | 233.82 | 364.71 | 272.65 | 385.16 | 245.29 | |
| Change | 120.67 | 104.21 | 53.19 | 220.01 | 116.90 | |
| 6. Wash in time [2] | Pre embolization | 106.25 | 164.58 | 139.66 | 131.71 | 113.64 |
| Post embolization | 164.86 | 186.21 | 332.40 | 175.00 | 138.00 | |
| Change | 58.61 | 21.62 | 192.73 | 43.29 | 24.36 | |
| 7. Gradient of wash in [2] | Pre embolization | 86.49 | 38.10 | 51.38 | 29.71 | 68.92 |
| Post embolization | 32.92 | 24.96 | 4.92 | 21.16 | 52.92 | |
| Change | -53.57 | -13.14 | -46.46 | -8.55 | -16.00 | |
| 8. Area under the curve | Pre embolization | 105.61 | 169.44 | 128.87 | 63.42 | 97.99 |
| Post embolization | 117.23 | 165.26 | 32.80 | 105.86 | 165.60 | |
| Change | 11.62 | -4.18 | -96.07 | 42.44 | 67.61 | |
| 9. Peak Density (Parenchyma) | Change | 4.13 | 30.72 | 8.30 | 2.18 | 8.49 |
Fig. 6.
(a) DTP and DTA between ROIOut and ROIInj, pre-embolization and post-embolization. (b) Change in peak contrast agent density at ROIOut and ROIBrain post embolization.
4. Discussion
This work has developed an intra-operative method for viewing and quantifying the effect of glue embolization of vein of Galen malformation using angiography. Our method is portable and the processing time of 6 - 8 minutes on a standard laptop computer is acceptable given the clinical context in which it will be used. Angiography allows rapid acquisition of quantitative data and provides better temporal resolution than MRA techniques [2] and remains the gold standard for assessment of intracranial arteriovenous malformations. It provides the best definition of angioarchitectural characteristics and anatomy. At present the standard mechanism for assessment is visual inspection of sequential digitally subtracted images. As a result, the role of angiography in the hemodynamic evaluation is poorly understood. Current commercially available angiography quantification postprocessing software, like syngo iFlow (Siemens Healthineers, Erlangen, Germany) and AngioViz (GE Healthcare, Chicago, Illinois) are limited by variability in flow, vessel size, amount of contrast injected, and frame rate [2]. There has been little work to validate these measures against true flow measurements, or indeed outcome. However, early studies suggest that color-coded digital subtraction angiography improves the ability to visualize differences and quantitative changes in blood flow and may help the management of intracranial vascular diseases and serve as a good hemodynamic marker to monitor therapeutic effects of embolization [3, 4]. Brinozzi et al. [2] report a technique which identifies various intensity plots, including the maximum gray intensity in consecutive DICOM images. This was used to calculate contrast agent wash in and wash out times and were reported to correlate with quantitative MRA [2]. Our method uses times relative to a reference point as in [5], accounts for variation in the contrast injections, and combines pre- and post-embolization angiograms to quantify effect of treatment. It is therefore not affected by fluoroscopic equipment used, contrast agent concentration and quantity or contrast wash-away. Results achieved are as expected based on the intended physiological changes. Clinical validation of the method and results will be undertaken.
Regarding vein of Galen malformations, a meta-analysis including more than 500 patients has reported that patients who undergo treatment during the neonatal period are less likely to have a good neurologic outcome than those who were treated later in life [6]. The cause for this multifactorial, and is postulated to be due to poorer cardiologic status at presentation, increased severity of disease and differences other differences in physiology. Triaging patients to neonatal or later treatment is carried out base on clinical evaluation including review of MR imaging [1]. A method for quantification of the shunt hemodynamics on early neonatal MR arterial spin labelled angiography and may be a useful adjunct to the current clinical triage system. Similarly, quantification of changes in shunt flow on pre-embolization and follow up MRI using a similar method to that described may provide to quantify shunt status and help guide timing of re-embolization.
In conclusion, this work has developed a novel presentation of angiographic images and a method to quantify effects of minimally invasive treatments of intra-cranial blood flow for intra-operative use in a complex clinical scenario. This technique is likely to be useful for intra-operative decision making and may be useful for the treatment of other intra-cranial and peripheral arterial-venous malformations and treatments which acutely disrupt the vascular supply of blood to tissue for example choroid plexus papilloma embolization.
References
- [1].Lecce Francesca, Robertson Fergus, Rennie Adam, Heuchan Anne-Marie, Lister Paula, Bhate Sanjay, Bhattacharya Jo, Brew Stefan, Kanagarajah Lakshmi, Kuczynski Adam, Peters Mark J, et al. Cross-Sectional Study of a United Kingdom Cohort of Neonatal Vein of Galen Malformation. Annals of Neurology. 2018 Aug; doi: 10.1002/ana.25316. [DOI] [PMC free article] [PubMed] [Google Scholar]
- [2].Brunozzi Denise, Hussein Ahmed E, Shakur Sophia F, Linninger Andreas, Hsu Chih-Yang, Charbel Fady T, Alaraj Ali. Contrast Time-Density Time on Digital Subtraction Angiography Correlates With Cerebral Arteriovenous Malformation Flow Measured by Quantitative Magnetic Resonance Angiography, Angioarchitecture, and Hemorrhage. Neurosurgery. 2017 Jul; doi: 10.1093/neuros/nyx351. [DOI] [PubMed] [Google Scholar]
- [3].Lin Chung-Jung, Luo Chao-Bao, Hung Sheng-Che, Guo Wan-Yuo, Chang Feng-Chi, Beilner Janina, Kowarschik Markus, Chu Wei-Fa, Chang Cheng-Yen. Application of color-coded digital subtraction angiography in treatment of indirect carotid-cavernous fistulas: Initial experience. Journal of the Chinese Medical Association. 2013 Apr;76(4):218–224. doi: 10.1016/j.jcma.2012.12.009. [DOI] [PubMed] [Google Scholar]
- [4].Lin CJ, Hung SC, Guo WY, Chang FC, Luo CB, Beilner J, Kowarschik M, Chu WF, Chang CY. Monitoring Peri-Therapeutic Cerebral Circulation Time: A Feasibility Study Using Color-Coded Quantitative DSA in Patients with Steno-Occlusive Arterial Disease. American Journal of Neuroradiology. 2012 Oct;33(9):1685–1690. doi: 10.3174/ajnr.A3049. [DOI] [PMC free article] [PubMed] [Google Scholar]
- [5].Horz Tim, Kowarschik Markus. Temporal difference encoding for angiographic image sequences. 2015 Jan [Google Scholar]
- [6].Brinjikji W, Krings T, Murad MH, Rouchaud A, Meila D. Endovascular Treatment of Vein of Galen Malformations: A Systematic Review and Meta-Analysis. American Journal of Neuroradiology. 2017 Dec;38(12):2308–2314. doi: 10.3174/ajnr.A5403. [DOI] [PMC free article] [PubMed] [Google Scholar]


