Abstract
The mammalian circadian system consists of a central clock in the brain that synchronizes clocks in peripheral tissues. While the hierarchy between the central and peripheral clocks is established, little is known regarding the specificity and functional organization of peripheral clocks. Here, we employ altered feeding paradigms in conjunction with liver-clock mutant mice to map disparities and interactions between peripheral rhythms. We find that peripheral clocks largely differ in their responses to feeding-time. Disruption of the liver-clock, despite its prominent role in nutrient processing, does not affect rhythmicity of clocks in other peripheral tissues. Yet, unexpectedly, liver-clock disruption strongly modulates peripheral tissues’ transcriptional rhythmicity, primarily upon daytime feeding. Concomitantly, liver-clock mutant mice exhibit impaired glucose and lipid homeostasis, which are aggravated by daytime feeding. Overall, our findings suggest that, upon nutrient challenge, the liver-clock buffers the effect of feeding-related signals on rhythmicity of peripheral tissues, irrespective of their clocks.
Keywords: Circadian clocks, Day Feeding, Hepatic clock, RNA-seq, Metabolism, Homeostasis, Glucose, Bmal1 Liver-specific Knockout
Introduction
Circadian clocks oscillate in light-sensitive organisms with a period of ≈24 h and coordinate a wide variety of behavioral, physiological and molecular functions with the geophysical time. In mammals, these clocks are present in virtually every cell of the body and function in a cell autonomous and self-sustained manner1. The mammalian circadian system is viewed as hierarchal; a central clock in the suprachiasmatic nucleus (SCN) of the brain coordinates millions of clocks in peripheral tissues2–4. In order to remain aligned with the geophysical time, circadian clocks are synchronized with the environment through various timing cues, a.k.a. zeitgebers. The central and peripheral clocks are believed to rely on a similar core clock machinery: a network of transcription-translation feedback loops of different core clock genes (e.g., Arntl (Bmal1), Clock, Per1,2,3, Cry1,2 and Nr1d1,2 (Reverbα, β)). They, however, differ in their compliance to different zeitgebers: while the principal zeitgeber for the central clock is light, food consumption is widely considered as a dominant timing cue for peripheral clocks5, 6. This largely accepted view relies on experiments whereby rodents had access to food exclusively during the light or the dark phase (daytime feeding (DF) or nighttime feeding (NF), respectively) for several days. Upon DF, the phase of the central clock in the brain is unaffected, but the clock in the liver and several other tissues is phase-inverted compared to NF or freely fed (ad libitum, AL) animals7–11. Therefore, DF is considered to uncouple clocks in peripheral tissues from the central clock in the SCN.
The dichotomy between the central and peripheral clocks essentially regards peripheral clocks as a uniform group. Indeed, clocks in peripheral tissues share the same “clockwork”. However, given their tissue-specific roles 12, 13, it is conceivable that they would differ in their signaling inputs as well as output pathways. At the same time, clocks in different peripheral organs are expected to function, and therefore respond to external inputs, in coordination with each other. This conundrum raises several key questions regarding the organization principles within the peripheral circadian system: Do clocks in all tissues respond to a given zeitgeber similarly, or rather exhibit tissue-specificity? What is the effect of the clock in one tissue on the clock of another tissue? To what extent tissue rhythmicity is controlled by its endogenous clock vs. clocks in other tissues or systemic cues?
In this study, we aimed to identify interactions between clocks and rhythmicity of different peripheral tissues. In view of the central role of the liver-clock in nutrient processing and its prominent response to DF 7, 8, 14, 15, we hypothesized that the liver-clock might regulate the rhythmicity of other peripheral tissues in response to feeding-time. To this end, we applied different feeding paradigms in conjunction with liver-specific clock mutant mice, and performed around-the-clock transcriptomic profiling on various tissues.
Intriguingly, we found that clocks in different tissues largely differ in their response to DF, from phase-inversion to no response or even loss-of-rhythmicity. Furthermore, transcriptomic profiling revealed that the feeding effect on rhythmic gene expression is tissue-specific and does not necessarily align with the phase of the local clock. Importantly, we found that the liver-clock strongly modulate the effect of DF on rhythms of other tissues, without carrying major effects on their clocks. Concomitantly, we uncovered that blood nutrient homeostasis, in particular glucose, is altered in liver-clock deficient mice, especially in response to DF. Our findings shed light on the interactions between peripheral rhythms in vivo, and suggest that the liver-clock control rhythmicity of other peripheral tissues upon nutritional challenge, irrespective of their clocks.
Results
Feeding time differentially affects clocks in peripheral tissues
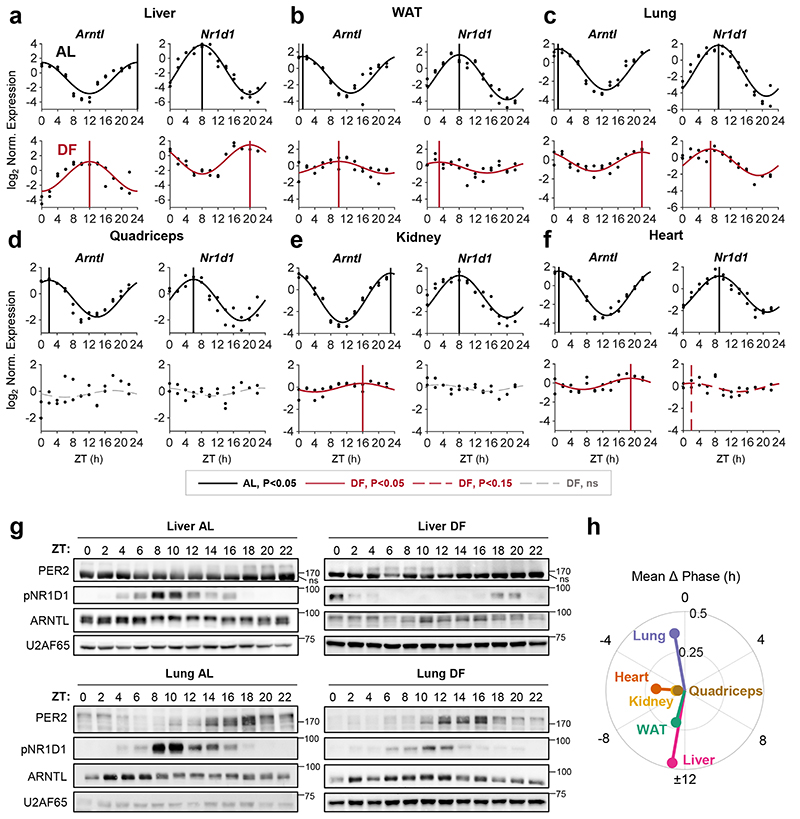
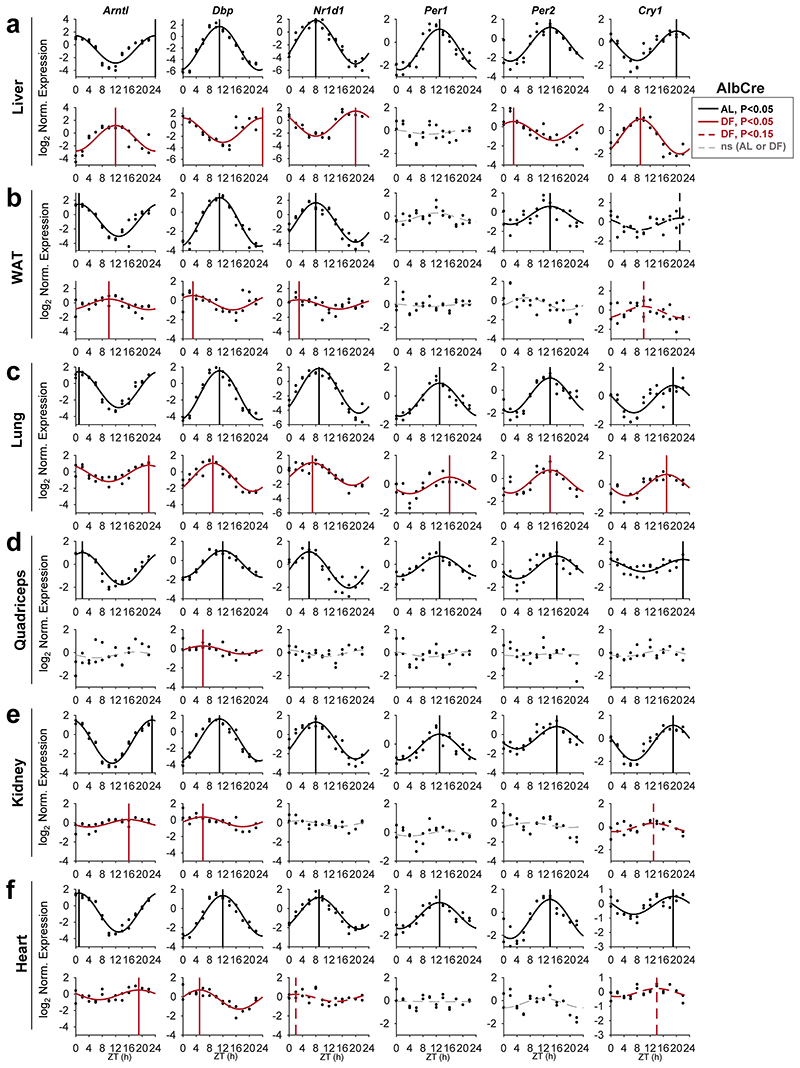
To address the role of the liver in the response of peripheral clocks to feeding, we first characterized the effect of feeding time on clocks in different tissues. Mice were housed under 12 h Light-Dark regimen and had access to food either exclusively during the light phase (DF) or throughout the entire day (ad libitum, AL). Previous studies that employed DF mostly up to two weeks suggested that a longer duration might be needed for complete entrainment in some tissues 7, 10, 15–18. Thus, to reach stable effect, mice underwent DF for 30 days. Subsequently, animals were sacrificed at 2 h intervals throughout 24 h and expression levels of the different core clock genes (Arntl, Dbp, Nr1d1, Per1, Per2, and Cry1) were analyzed for the indicated tissues (i.e., liver, white adipose tissue (WAT), lung, quadriceps, kidney and heart), (Fig. 1, Extended Data Fig. 1). JTK_CYCLE test was used to determine their rhythmicity and estimate their phases 19 (Supplementary Data 1). In line with previous reports 7, 9, 15, the expression of liver clock genes was 12 h phase-shifted upon DF (Fig. 1a, Extended Data Fig. 1a). A similar response was observed for WAT (Fig. 1b, Extended Data Fig. 1b). By contrast, the phases of clock genes in the lung were barely affected (Fig. 1c, Extended Data Fig. 1c). Other tissues such as the kidney (Fig. 1e, Extended Data Fig. 1e) and heart (Fig. 1f, Fig. Extended Data 1f) exhibited an intermediate effect (~4-8 h phase shift). The phase coherence between clock genes within a given tissue was generally preserved in day fed animals. Nevertheless, we did observe some gene-specific effects, especially in the WAT, where Arntl was phase delayed while other clock genes were mostly phase advanced. We also noticed a marked reduction in the amplitude of clock genes upon DF in all tissues. Notably, the rhythmicity of almost all clock genes was lost in the quadriceps (Fig. 1d, Fig. Extended Data 1d). The prominent effect of DF on the phase of clock genes in liver compared to the lung was also evident at their protein levels (Fig. 1g).
Figure 1. Feeding differentially affects clocks in peripheral tissues.
(a-f) Quantitative PCR results from mice (AlbCre) fed either ad libitum (AL) or exclusively during the light-phase (DF) for 30 days. Samples were collected at 2 h intervals for 24 h (n=2 biologically independent mice per time point). Presented are the clock genes Arntl (a.k.a Bmal1) and Nr1d1 (a.k.a. Rev-erbα) from the (a) Liver, (b) White Adipose Tissue (WAT), (c) Lung, (d) Quadriceps muscle, (e) Kidney, and (f) Heart. Dots mark individual measurements in each Zeitgeber Time (ZT). Significant rhythms according to JTK_CYCLE (P<0.05) are denoted by continuous cosine fit curve, with a vertical line representing the phase; dashed red curves represent rhythms with P<0.15; dashed gray curves represent non-significant (ns) rhythms. (g) Immunoblot analysis of core clock proteins from livers and lungs of mice fed either AL or DF. Presented are pooled samples of n=2 per time point. U2AF65 served as loading control (ns: non-specific band; size markers are given in kD). (h) Polar plot summary of the effects of DF on clock gene expression. Each vector represents the mean response of a single tissue. The vector’s angle represents the mean phase-shift in response to DF among all the rhythmic clock genes in the tissue. The vector’s length indicates the relative change in amplitude in response to DF (length of 1 represents no change in amplitude).
Collectively, our analysis indicated that feeding-time affects clock-rhythmicity in a tissue-specific manner. While the clocks of some tissues (liver, WAT) were strongly phase-shifted, other tissues were only partially shifted (kidney), showed no response (lung) or even exhibited loss-of-rhythmicity (quadriceps), (Fig. 1h). Thus, it appears that DF not only uncouples peripheral clocks from the central clock, but also uncouples clocks of different peripheral tissues.
Feeding-time affects peripheral tissues’ rhythmicity in a tissue-specific manner
In principle, daily rhythmicity can be driven either by endogenous clocks, or by exogenous signals (e.g., feeding, light)11, 20–23. Our finding that clocks in peripheral tissues differently responded to feeding-time prompted us to examine whether daily rhythms in these tissues will follow the tissue-clock, or rather the feeding time or other systemic cues. A mixed effect emerging from both shall not be excluded. Hence, we performed around-the-clock transcriptomic analyses to identify transcripts with a 24 h rhythmicity and their respective parameters (i.e., phase, amplitude). We centered on the liver and WAT as their clocks strongly responded to DF, and on the lung whose clock was not shifted (Fig. 1 and Extended Data Fig. 1).
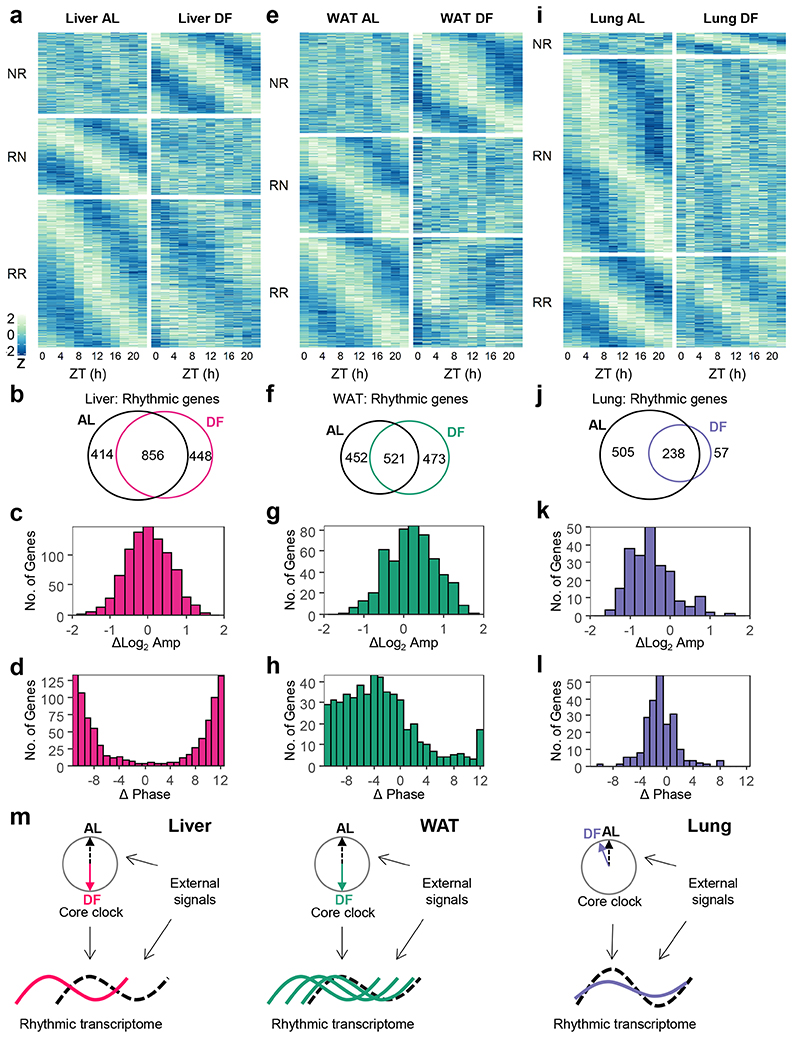
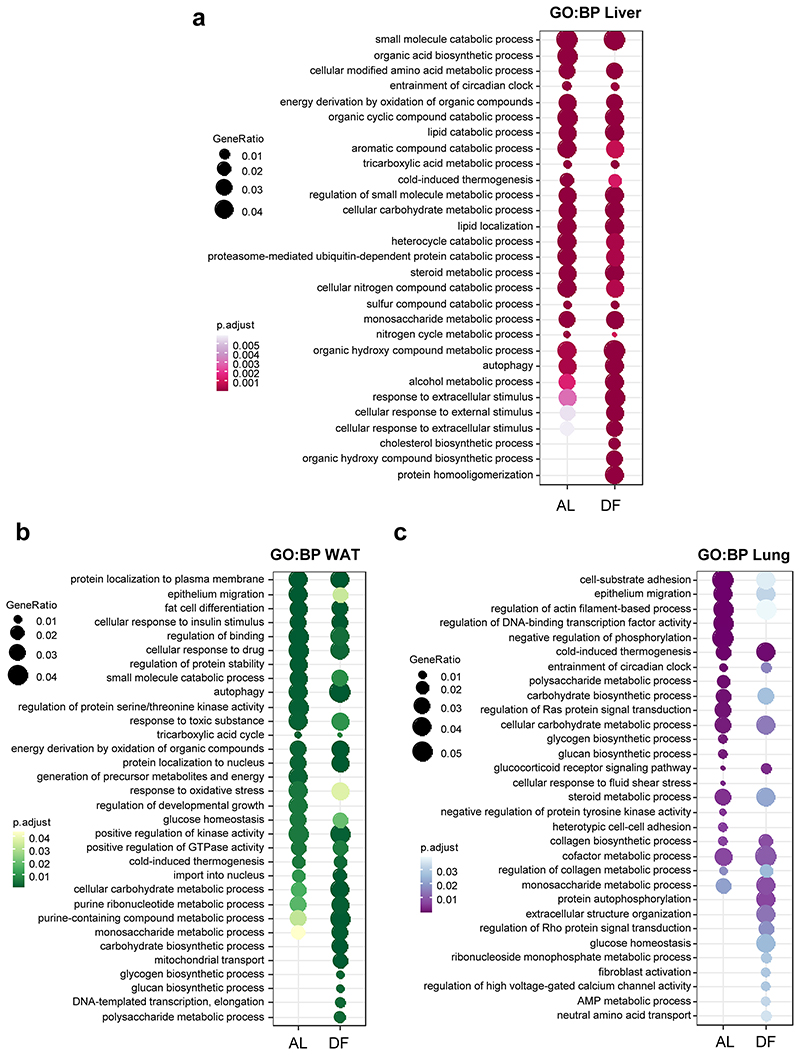
In the liver, a comparable number of genes were rhythmic in AL and DF, with high overlap, and similar amplitude (Fig. 2a-c). The rhythmic genes in AL were enriched for metabolic processes (e.g., lipids, amino acids, and carbohydrates), (Extended Data Fig. 2a). In correspondence with the 12 h phase-shift in the liver’s clock upon DF, we observed on average 12 h shift in the rhythmic transcriptome (Fig. 2d), with similar functional annotations (Extended Data Fig. 2a). We concluded that both the liver-clock and the rhythmic transcriptome remain aligned with feeding-time.
Figure 2. Daytime-restricted feeding affects the rhythmic transcriptome in a tissue-specific manner.
Rhythmic transcriptome analyses of (a-d) Liver, (e-h) White Adipose Tissue (WAT), and (i-l) Lung from mice fed either ad libitum (AL) or exclusively during the light-phase (DF) for 30 days. (a, e, and i) Heatmap of expression profiles of genes that were non-rhythmic in AL and rhythmic in DF (NR, Qmin <0.05, PHR,AL>0.05, PHR,DF≤0.05, JTK_CYCLE and Harmonic Regression, see also Methods section); genes that were rhythmic in AL and non-rhythmic in DF (RN, Qmin <0.05, PHR,AL≤0.05, PHR,DF>0.05); and genes that were rhythmic in both (RR, Qmin <0.05, PHR,AL≤0.05, PHR,DF≤0.05). Data is presented as z-scores of the average expression in each ZT. (b, f, and j) Venn diagrams representing the overlap between rhythmic genes in AL or in DF. (c, g, and k) Histogram representing the distribution of amplitude-differences between DF and AL, of the common rhythmic genes in both conditions. (d, h, and l) Histogram representing the distribution of phase differences between DF and AL for the common rhythmic genes in both conditions. (m) Graphical depiction of the main findings. The transcript rhythmicity is driven both by the tissue’s internal core clock and by various external signals. Upon DF, which affects external rhythmicity, the core clock in the different tissues is differentially phase-shifted. The effect on the rhythmic transcriptome is tissue-specific as well: the liver transcriptome is phase-inverted, the lung transcriptome is mildly affected, while the WAT transcriptome exhibits wide phase-shift distribution.
In WAT, roughly the same number of genes were rhythmic in AL and DF, yet their composition largely differed (~50% overlap), (Fig. 2e-f). These common rhythmic genes showed a tendency for increased amplitudes in DF (Fig. 2g). Both in AL and DF they were enriched for metabolic pathways (e.g., insulin response, lipid and nucleotide metabolism), (Extended Data Fig. 2b). While the clock in the WAT was phase-inverted in response to DF (Fig. 1b and Extended Data Fig. 1), the rhythmic transcriptome was mostly phase-advanced, with a broad range of phases spanning over 12 h (Median = -5.5), (Fig. 2h). In conclusion, some of the WAT rhythmic transcripts were aligned with its clock and feeding-time (similar to the liver), while others were only partially or not shifted at all. The latter are most likely affected by light-related or SCN-driven signals.
In the lung, we found that DF decreased the size of the rhythmic transcriptome (Fig. 2i-j) with a strong reduction in the amplitude of the common rhythmic genes (Fig. 2k). Importantly, the phases of these common genes were similar (Fig. 2l) and stayed aligned with the lung’s clock. The enrichment analysis revealed several common terms that are related to tissue organization (collagen metabolism, cell-cell adhesion) and circadian entrainment. Some unique terms were exclusively enriched for DF such as glucose homeostasis and nucleotide metabolism. Thus, in the lung the phases of the core clock (Fig. 1c, Extended Data Fig. 1c) and the rhythmic transcriptome are not affected by feeding-related signals.
Taken together these analyses suggest that the effect of feeding time on transcript rhythmicity is tissue-specific, and does not necessarily correspond to the effect on the tissue’s clock (Fig. 2m).
The liver-clock does not affect rhythmicity of other peripheral clocks
The liver-clock plays a central role in nutrient processing24. Concurrently, circadian clocks respond to various metabolites and metabolic-related signals25. We, therefore, hypothesized that the liver-clock might serve as a relay between feeding and clocks in other peripheral tissues through nutrient related signals. As such, the liver-clock might facilitate the response to feeding, and in its absence the response of clocks in other peripheral tissues is expected to be attenuated. Alternatively, the liver might function as homeostatic buffering mechanism to counterbalance unwarranted effects of nutritional perturbations. In such a case, the response of other peripheral clocks should be exacerbated in liver-clock deficient animals. These effects may as well show tissue-specificity.
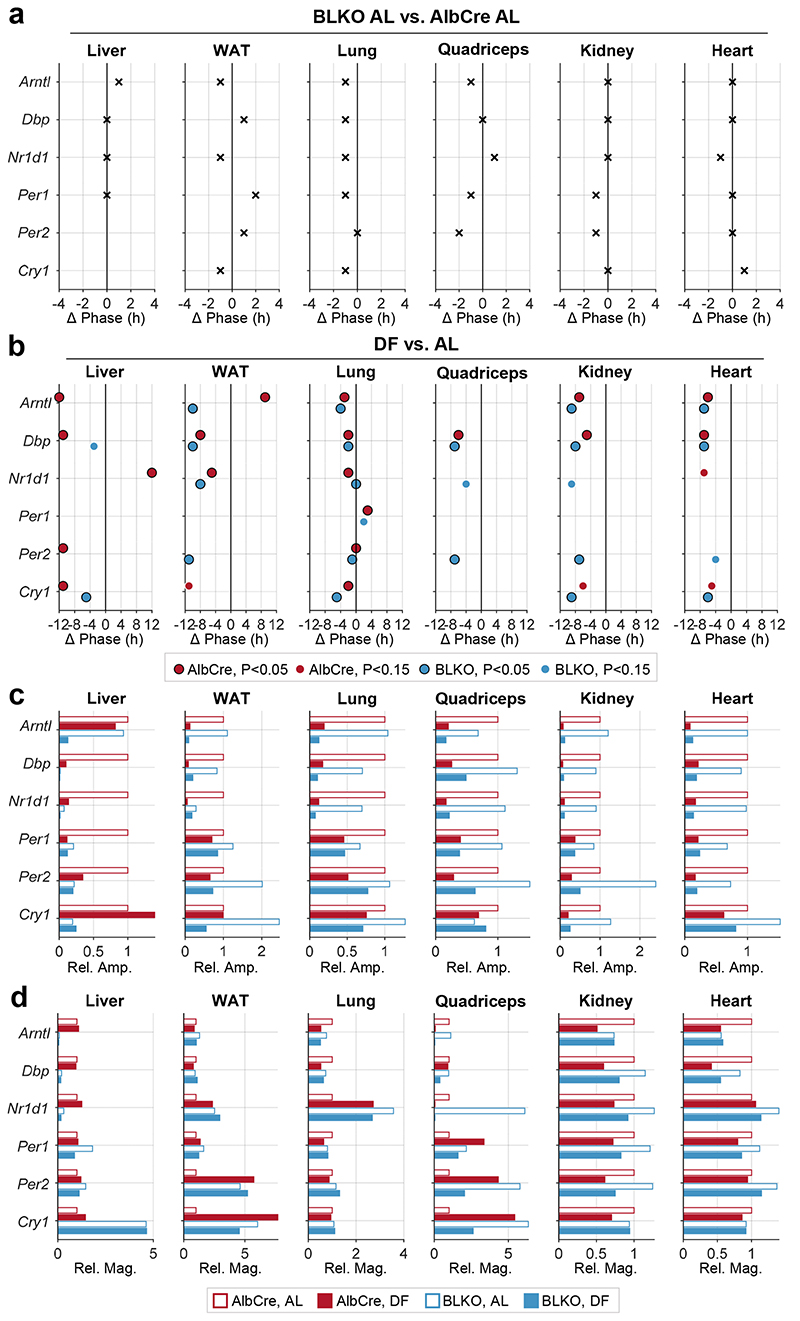
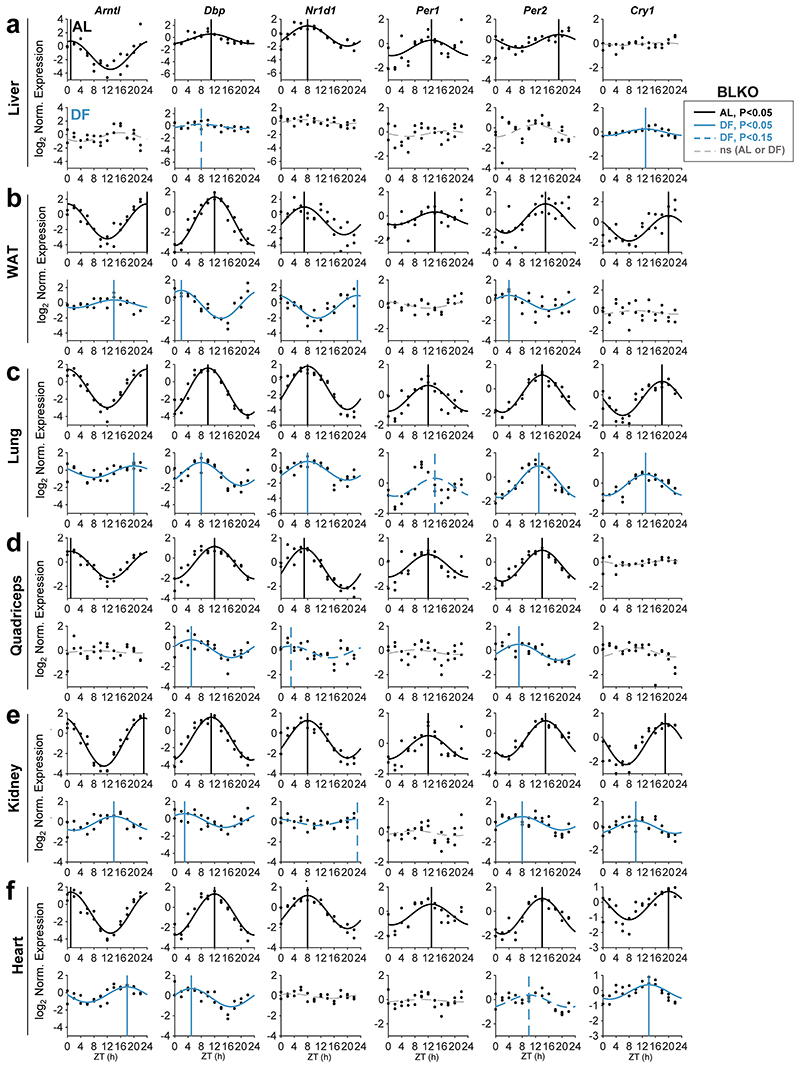
To test these hypotheses, we applied the same experimental design as detailed above, this time with hepatocyte-specific Bmal1 knockout mice (Alb-Cre +, Bmal1 fl/fl, abbreviated as BLKO). These mice, which lack a functional circadian clock in hepatocytes, show some residual rhythms in clock gene expression in the liver, most likely due to the presence of non-hepatocyte cell types 21, 26, 27 (Extended Data Fig. 3a). The phases of clock genes in the different organs were comparable in AlbCre controls and BLKO mice fed ad libitum (Fig 3a, and Extended Data Fig. 3) and were similarly shifted upon DF, with few minor differences (e.g., Kidney’s Arntl and Dbp; WAT’s Dbp and Nr1D1), (Fig 3b). Likewise, the amplitude reduction in clock rhythmicity upon daytime feeding did not differ much between the two mouse strains (Fig 3c). We also examined the effect on the magnitude of clock gene expression (i.e., mean expression level) and overall did not find marked changes between the different conditions (Fig. 3d). As expected, Arntl levels in the liver of BLKO mice were markedly reduced (Fig. 3d). Notably, the mean expression levels of several genes in the quadriceps were dramatically downregulated under DF, and to some extent differed between BLKO and AlbCre mice. Overall, these experiments indicate that the liver-clock affects neither the rhythmicity of other peripheral clocks, nor their entrainment by feeding.
Figure 3. The liver-clock does not affect clock-rhythmicity in other peripheral tissues.
Control mice (AlbCre) and liver-clock mutant mice (Alb-Cre+ Bmal1fl/fl, (BLKO)) were fed either ad libitum (AL) or exclusively during the light-phase (DF) for 30 days. (a) Phase differences in clock gene-rhythmicity between BLKO and AlbCre mouse strains, in AL fed animals, based on qPCR analysis as detailed in Fig. 1 (JTK_CYCLE P<0.05). (b) Phase differences in clock gene rhythmicity between DF and AL conditions, in either AlbCre or BLKO mice. Only significantly rhythmic genes for the relevant condition are included and represented with a dot (JTK_CYCLE P<0.05 or P<0.15, as denoted in the figure). (c) Bar plot representation of the relative change in amplitude upon DF, in either AlbCre or BLKO (note the linear scale, versus the log scale in Fig. 1, and Extended Data Fig. 1 and 3). (d) Bar plot representation of the relative change in magnitude upon DF, in either AlbCre or BLKO. (For the relevant clock gene expression profiles, see Extended Data Fig. 1 and 3).
The liver-clock alters the phase of WAT and lung transcriptome upon day feeding
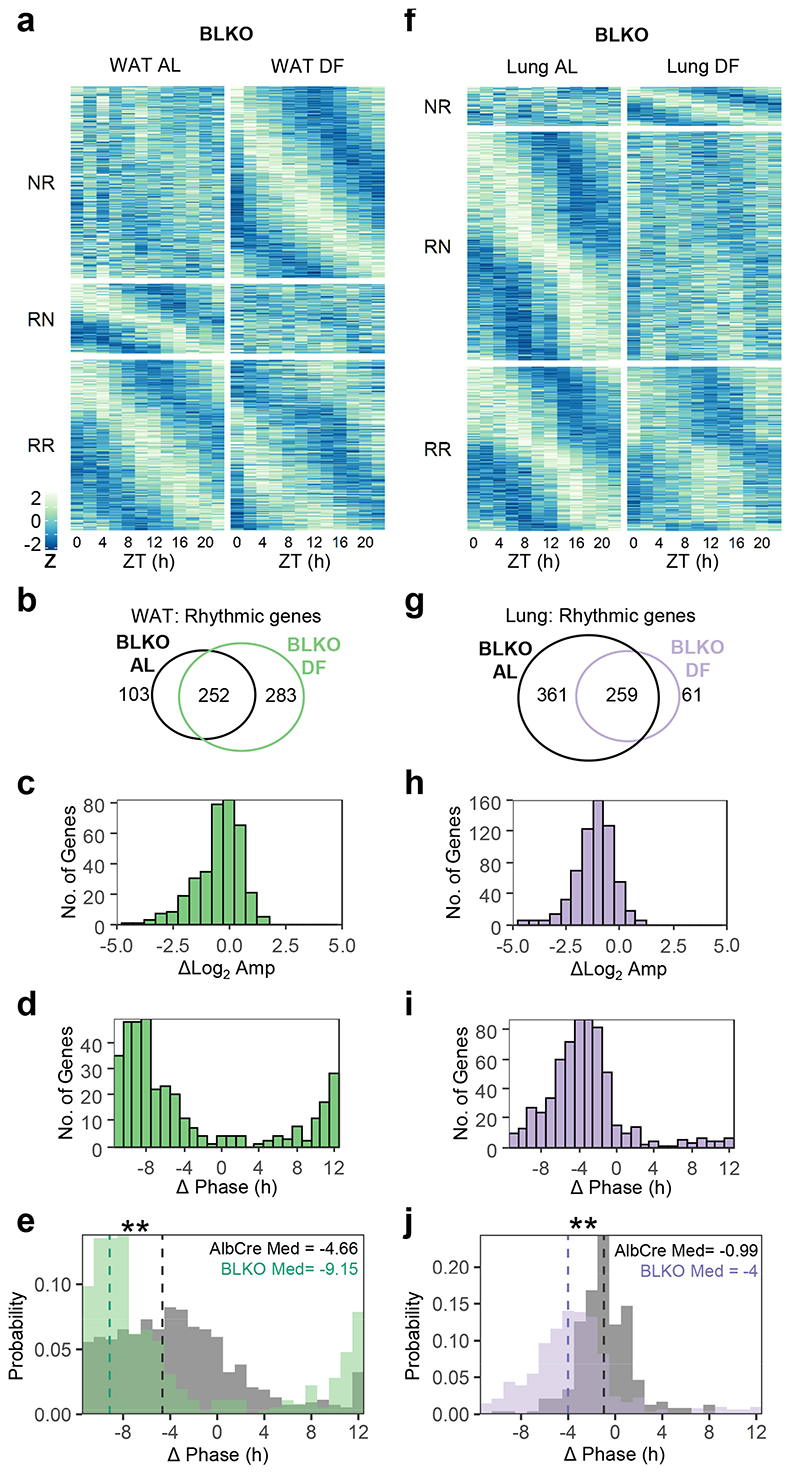
As detailed above, we found that the liver-clock is not necessary for the entrainment of peripheral clocks by feeding. Yet, it might still affect the rhythmicity of other peripheral tissues, irrespective of their clocks. Here again, the hepatic clock could either facilitate or buffer the effect of feeding. The rhythmic transcriptome of the WAT was strongly affected by feeding time (Fig. 2h). Therefore, we first performed around-the-clock transcriptome analysis of WAT, from AL and DF fed BLKO mice. Upon DF, there was a substantial gain-of-rhythmicity (Fig. 4a-c). Remarkably, the phase-shift distribution of the common rhythmic genes was much narrower, and more skewed towards complete inversion in BLKO compared to control mice (Fig. 4d-e). Hence, the response of the WAT rhythmic transcriptome to DF is dependent on the liver-clock. Consequently, in the absence of a functional liver-clock, the WAT’s rhythmic transcriptome is better aligned with its clock and feeding time.
Figure 4. The liver-clock modulates the response of WAT and lung rhythmic transcriptome to daytime feeding.
Around-the-clock transcriptomic analysis of WAT (a-e) and Lung (f-j) from liver-clock mutant mice (BLKO) fed either ad libitum (AL) or exclusively during the light-phase (DF) for 30 days. (a,f) Heatmap of expression profiles of genes that were non-rhythmic in AL and rhythmic in DF (NR, Qmin <0.05, PHR,AL>0.05, PHR,DF≤0.05, JTK_CYCLE and Harmonic regression, see also Method section), genes that were rhythmic in AL and non-rhythmic in DF (RN, Qmin <0.05, PHR,AL≤0.05, PHR,DF>0.05) and genes that were rhythmic in both (RR, Qmin <0.05, PHR,AL≤0.05, PHR,DF≤0.05). Data is presented as z-scores of the average expression in each ZT. (b, g) Venn diagrams representing the overlap between rhythmic genes in AL or in DF. (c, h) Histogram representing the distribution of amplitude-differences between DF and AL, of the common rhythmic genes in both conditions (d, i) Histogram representing the distribution of phase-differences between DF and AL for the common rhythmic genes in both conditions. (e, j) Comparison between the phase-differences distribution in BLKO and AlbCre. (**P<0.001, Watson two-sample test, test statistic (WAT) = 3.4163, test statistic (lung) = 4.4629). Vertical dashed lines represent the circular-median phase-differences.
In contrast to the WAT, the phase of lung’s rhythmic transcriptome was not affected by DF in control mice (Fig. 2l). In lungs of BLKO mice we noticed a considerable degree of loss-of-rhythmicity and decreased amplitude upon DF (Fig. 4f-h), similar to control mice (Fig. 2j). However, unlike control mice, the common rhythmic genes were clearly shifted in BLKO mice (Fig. 4i-j). We, therefore, concluded that the response of the lung’s rhythmic transcriptome to DF is affected by the liver-clock. Yet, contrary to WAT, in the absence of the liver-clock, the lung’s clock and its rhythmic transcriptome in DF animals are not aligned.
The liver-clock shapes WAT and lung rhythmic transcriptome upon day feeding
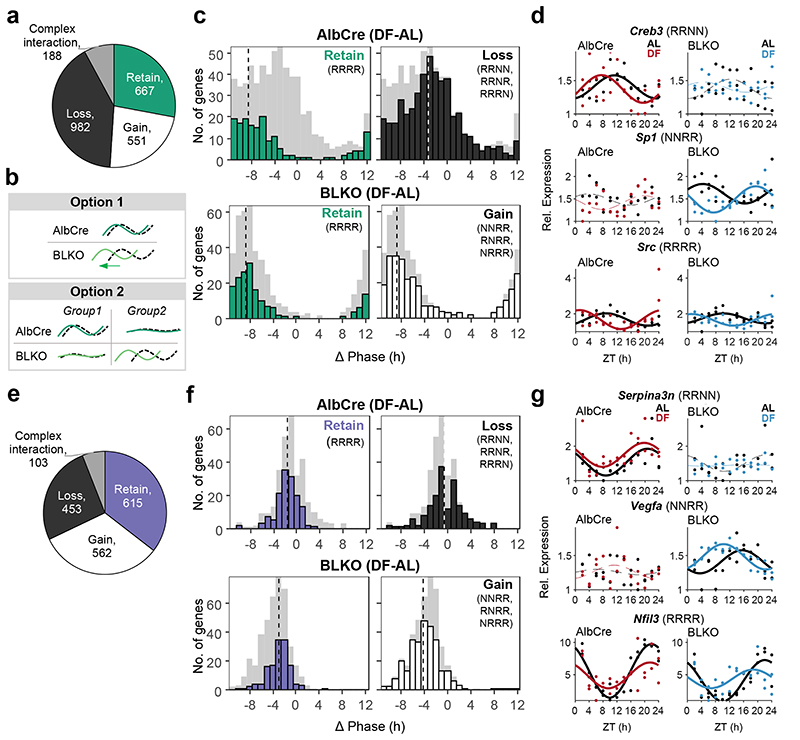
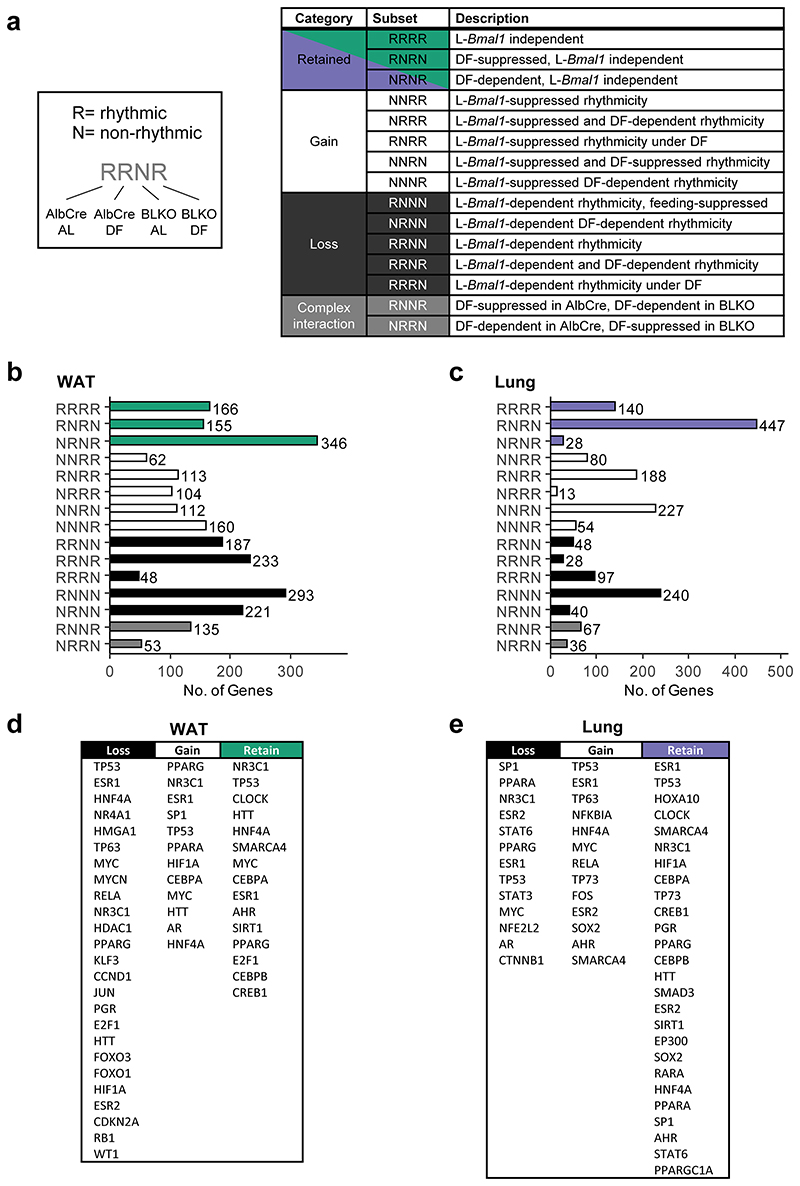
To better understand the interaction between the liver-clock and rhythmicity of other tissues, we compared all four conditions per tissue. Excluding genes that were arrhythmic in all four conditions, this 2-by-2 comparison yielded a total of 15 different gene subsets with distinct rhythmic behaviors, denoted by 4-letter nomenclature (e.g., RRNN is Rhythmic in AlbCre AL, Rhythmic in AlbCre DF, Non rhythmic in BLKO AL, and Non rhythmic in BLKO DF, see Extended Data Fig. 4a). For simplicity, these subsets were clustered together into categories based on the effect of BLKO on transcript rhythmicity. Namely, loss of rhythmicity in BLKO (“Loss”), gain of rhythmicity in BLKO (“Gain”), retained rhythmicity in BLKO (“Retain”), or complex interaction between BLKO and DF (Extended Data Fig. 4b). Of note, gain or loss of rhythmicity can occur either under AL or under DF. We found that in WAT, the majority of genes either loss or gained rhythmicity in BLKO compared to AlbCre, (Fig. 5a) signifying a major effect of the liver-clock on WAT rhythmicity. Specifically upon DF, gain of rhythmicity was more common than loss of rhythmicity in the WAT (Extended Data Fig. 4b, compare RNRN to NRNR).
Figure 5. The liver-clock affects the composition of lung and WAT rhythmic transcriptome.
The rhythmic transcriptome was distributed into categories according to the gene’s behavior in each condition and genotype (see also Extended Data Fig. 4). (a) Pie chart representing the distribution of genes between the categories in WAT. (b) Schematic depiction of the two options that might account for the differences in phase distribution between the genotypes (see text for details). (c) WAT’s phase differences histograms for AlbCre (upper panels) and BLKO (lower panels), subdivided to the different categories (namely “Retain”, “Gain” and “Loss”). The dashed vertical lines signify the circular median phase-shift for each distribution. (d) RNA-seq expression profiles of representative genes for each category in WAT. Data is presented relative to the minimum of each panel. (Continuous cosine fit curve: Qmin <0.05, PHR<0.05 for the relevant condition; dashed curve: rhythmicity not significant; JTK_CYCLE and Harmonic Regression, see also Method section). (e) Pie chart representing the distribution of genes between the categories in lung. (f) Lung’s phase differences histograms for AlbCre (upper panels) and BLKO (lower panels), subdivided to the different categories (namely “Retain”, “Gain” and “Loss”). The dashed vertical lines signify the circular median phase-shift for each distribution. (g) RNA-seq expression profiles of representative genes for each category in lung. Data is presented relative to the minimum of each panel. (Continuous cosine fit curve: Qmin <0.05, P<0.05 for the relevant condition; dashed curve: rhythmicity not significant).
The effect of the liver-clock on the phase-shift distribution in response to DF (Fig. 4e and 4j) can stem from two distinct behaviors (Fig. 5b). One option is that the same genes that were mildly shifted upon DF in control mice are shifted more strongly in BLKO mice. Another option is that genes that were mildly shifted in the AlbCre lost rhythmicity in BLKO, whereas a different subset of rhythmic genes emerged in BLKO mice and was strongly shifted by DF. In short, we asked whether same or different subsets of genes are phase-shifted between the two genotypes.
To discriminate between these two alternatives, we sub-divided the phase-difference histograms according to above-detailed categories. This analysis revealed that in AlbCre, the “Loss” category shows mild shifts compared to the “Retain” category (Fig. 5c, compare upper right and left panels). In BLKO, the “Retain” category has similar phase-shifts to those observed in AlbCre (Fig. 5c, compare upper and lower left panels) and the “Gain” category show pronounced phase shifts (Fig. 5c, lower right panel). Our analysis clearly indicated that the prominent shifts in gene expression in DF-BLKO mice stems from the emergence of new subset of rhythmic genes in these animals that are strongly shifted by feeding, alongside the loss of rhythmicity of genes that were mildly shifted by feeding in AlbCre mice (i.e., option 2 in Fig 5b).
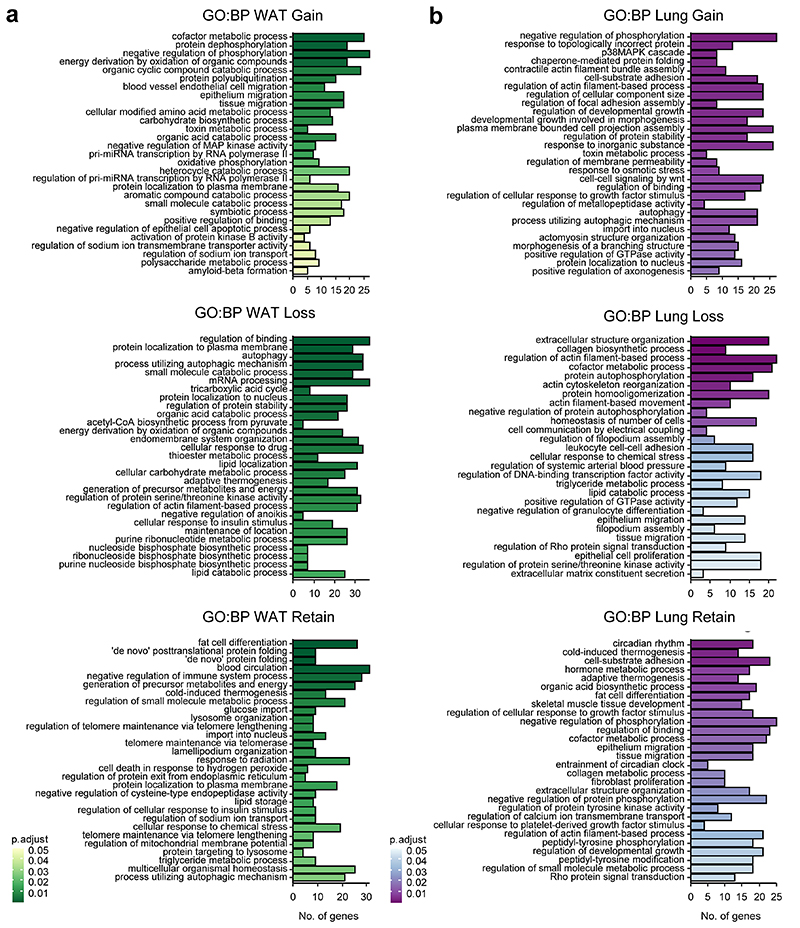
The “Loss” and “Gain” gene categories in WAT functionally differed from to the “Retain” group (Extended Data Fig. 5a). For example, the “Retain” category was enriched for genes involved in fat cell differentiation and thermogenesis. On the other hand, the “Loss” category was more enriched for cytoskeleton remodeling, as well as lipid and nucleotide metabolic processes. Representative genes for the different profiles are depicted in Fig 5d. Analysis of upstream regulators of each category predicted the potential involvement of prominent metabolic sensors such as PPARs, HIF1A and HNF in the “Gain” and “Loss” categories (Extended Data Fig. 4d).
In the lung, similar trends emerged. The rhythmicity of most genes was affected by BLKO, while only a quarter of the genes retained their rhythmicity in both genotypes (Fig. 5e). Contrary to the WAT, in the lung loss of rhythmicity due to DF was much more prominent than gain of rhythmicity (Extended Data Fig. 4c). The “Retain” category overall showed very similar phase-shifts in AlbCre and BLKO (about -2), (Fig. 5f). This is in contrast to both the “Loss” category, which on average showed milder shifts (in AlbCre), and the “Gain” category that presented stronger shifts (in BLKO), (Fig. 5f). Although the effect size and distribution of the different subsets vary from the WAT, it is clear also in the case of the lung that the difference in phase shifts between the genotypes is largely due to different subsets of genes.
The gene sub-setting revealed differential functional enrichment between the categories also in the lung (Extended Data Fig. 5b). Tissue dynamics (e.g., extracellular matrix formation) and lipid metabolism related genes were prevalent in the “Loss” category, while the “Retain” category was enriched for rhythm regulation and cold-responsive genes. Archetypic examples are presented in Fig. 5g. in both WAT and Lung the “Retain” category contained many of the circadian regulatory genes, and their behaviors were consistent with the profiles shown above (Fig. 3). It might be that this subset of genes is regulated by the tissue-endogenous clock, and therefore behave similarly to the clock genes. In summary, we show that the liver-clock carries a prominent effect on the composition of the rhythmic transcriptomes of other tissues. The effects of the liver-clock on the phase response to DF stems primarily from these differences in gene composition.
Liver-clock mutant mice exhibit impaired glucose homeostasis upon day feeding
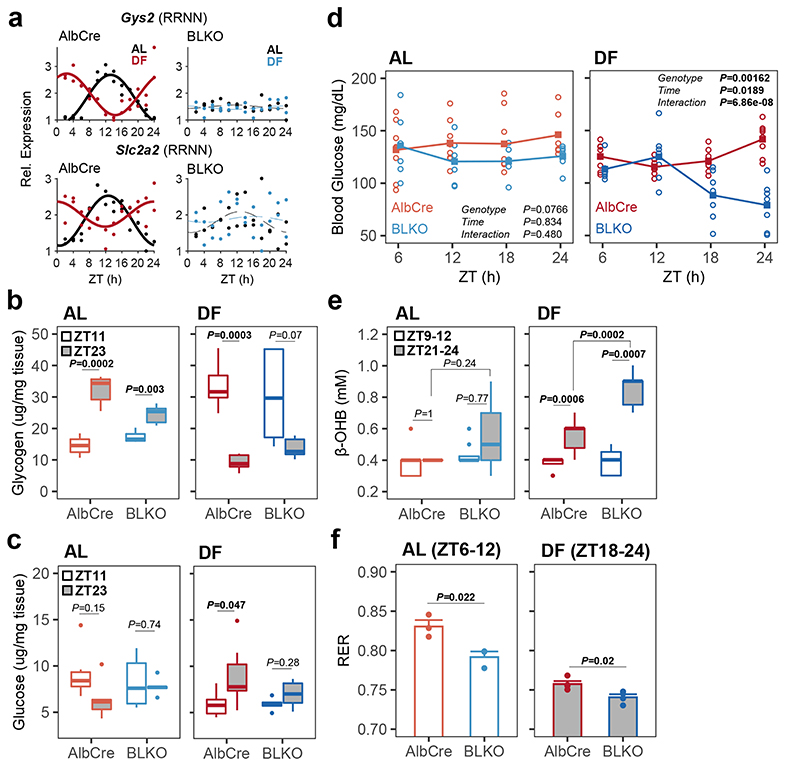
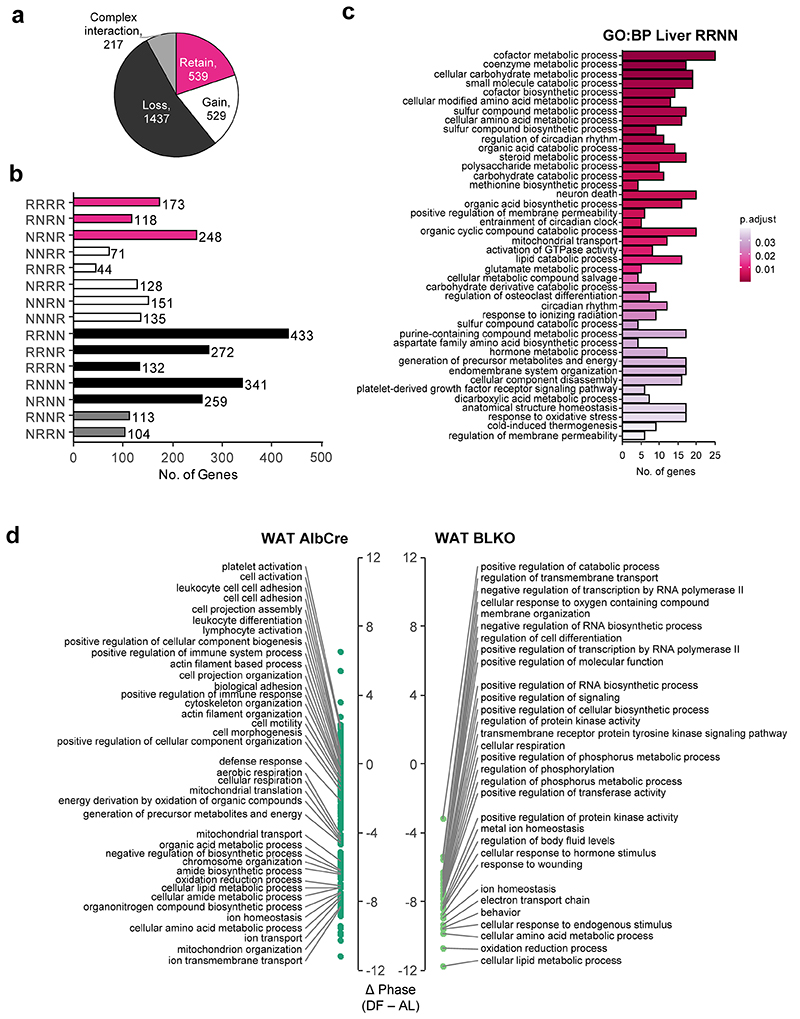
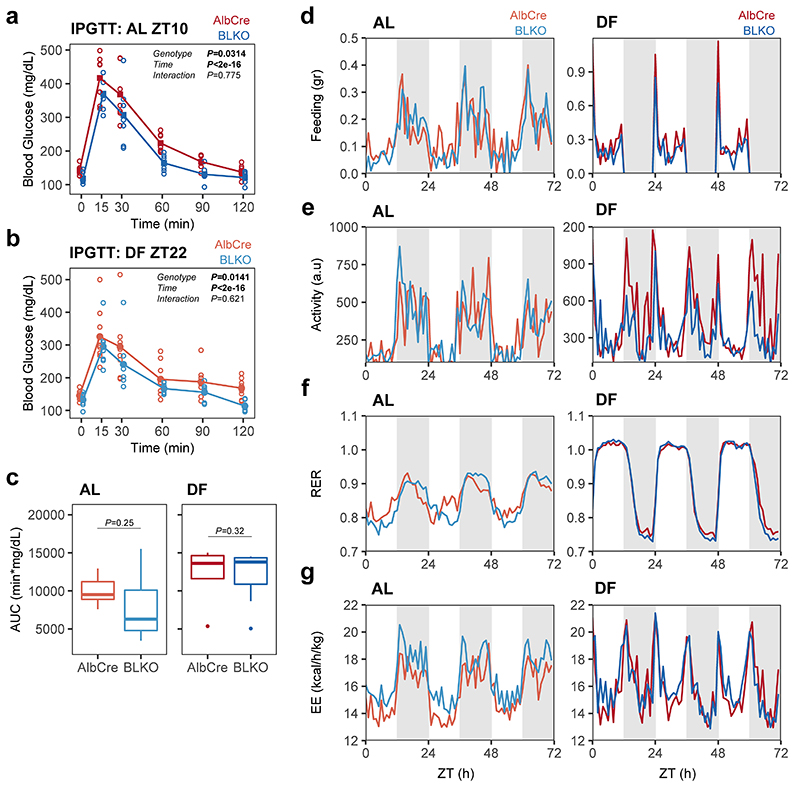
To gain insight on potential mechanisms implicated in the communication between the liver-clock and peripheral tissues, we examined the liver rhythmic transcriptome of BLKO mice. We compared the effects of genotype and feeding regimen on liver rhythmicity and, as expected, found that many genes lost rhythmicity in BLKO mice (Extended Data Fig. 6a-b). Under the premise that the liver-clock functions as a buffering mechanism, we were particularly interested in genes which were rhythmic in AlbCre, phase-inverted upon DF, and arrhythmic in BLKO (i.e., the RRNN subset). This subset of genes may account for the effect of the liver-clock on other tissues. Enrichment analysis revealed that this group is highly enriched for carbohydrate metabolism (Extended Data Fig. 6c). Specifically, we observed in BLKO livers loss-of-rhythmicity of key genes responsible for glucose homeostasis such as the glycogen synthase Gys2, and the glucose transporter Slc2a2 (a.k.a. Glut2), (Fig 6a). Measurements of liver glycogen content showed daily variance in AlbCre, with zenith levels at the end of the dark phase22, 28, which were inverted upon DF (Fig. 6b). However, BLKO mice showed shallower daily rhythms in AL that were not significant upon DF (Fig. 6b). These effects were largely mirrored by glucose liver content (Fig. 6c). Next, we examined whether blood glucose levels are affected in BLKO mice. Blood glucose measurements around-the-clock revealed that upon DF, BLKO mice have substantially lower glucose levels during the fasting-phase (Fig. 6d). Hence, loss of Bmal1 in the liver induced daily rhythms in blood glucose levels, which are otherwise relatively constant. Differences in insulin resistance are unlikely to be a major cause for the observed phenotype as glucose tolerance tests were comparable between the different genotypes (Extended Data Fig. 7a-c). Thus, disruption of liver glucose and glycogen metabolism is likely to play a role in the observed blood glucose rhythms in BLKO mice upon DF.
Figure 6. Impaired glucose homeostasis in liver-clock deficient mice in response to day feeding.
(a) RNA-seq expression profiles of liver Gys2 and Slc2a2 (a.k.a. Glut2) in AlbCre and BLKO mice fed either ad libitum (AL) or day fed (DF), (continuous cosine fit curve: Qmin<0.05, P<0.05 for the relevant condition; dashed curve: rhythmicity not significant). (b) Liver glycogen content, and (c) Liver glucose content (two-sided Welch’s t-test; AlbCre AL n=5 mice per ZT; AlbCre DF ZT11 n=6 mice, ZT23 n=7 mice; BLKO AL ZT11 n=6 mice, ZT23 n=5 mice; BLKO DF n=5 mice per ZT). (two-sided (d) Basal blood glucose levels, measured at four time points around the clock in all four conditions, on the fourth week of the feeding regimen (circles - individual mice, lines - mean levels; 2-way ANOVA with repeated measures design; AlbCre AL n=7 mice, DF n=8 mice; BLKO AL n=6 mice, DF n=7 mice). (e) Blood β-hydroxybutyrate (β-OHB) levels, measured in the indicated times for each condition (two-sided paired samples Student’s t-test for the time effect in each condition; two-sided Welch’s t-test for the rest; Bonferroni corrected P; AlbCre AL n=7 mice, DF n=8 mice; BLKO AL n=8 mice, DF n=7 mice). (In all boxplots: middle line= median, box= 25th to 75th Inter Quantile Range (IQR), whiskers= the largest/smallest value no greater/smaller than 1.5*IQR, outlier points= measurements outside this range). (f) Average Respiratory Exchange Rate (RER) in the last 6 h of the fasting phase in each condition, calculated from metabolic cages measurements of three consecutive days (Mean ± SEM; two-sided Student’s t-test; n=3 mice per genotype in AL, n=4 mice per genotype in DF).
This fasting-state hypoglycemia was accompanied by additional related metabolic changes. Ketone bodies accumulated to a higher level in DF BLKO compared to control mice at the end of the fasting-phase (Fig 6e). Concomitantly, the Respiratory Exchange Rate (RER) was lower in BLKO compared to AlbCre, indicative for increased utilization of lipids over carbohydrates towards the end of the fasting-phase (Fig. 6f and Extended Data Fig. 7f). The altered glucose metabolism in liver and blood of BLKO mice is expected to facilitate additional metabolic changes in energy utilization of other tissues. Along this line, our transcriptomic analysis revealed that in the WAT the “Gain” category was enriched for genes involved in oxidative phosphorylation (Extended Data Fig. 5a). In addition, a Phase Set Enrichment Analysis (PSEA) of the WAT revealed that the phases of functional terms related to cellular respiration and lipid metabolism are more shifted in BLKO than in AlbCre in response to DF (Extended Data Fig. 6d). This could represent an increased reliance on beta-oxidation and oxidative phosphorylation, due to the fasting-phase hypoglycemia.
In summary, we propose that impaired hepatic glucose metabolism in liver-clock deficient mice upon day feeding disrupts blood glucose homeostasis, which seems to affect rhythmicity of other peripheral tissues.
Liver-clock mutant mice exhibit altered metabolism upon day feeding
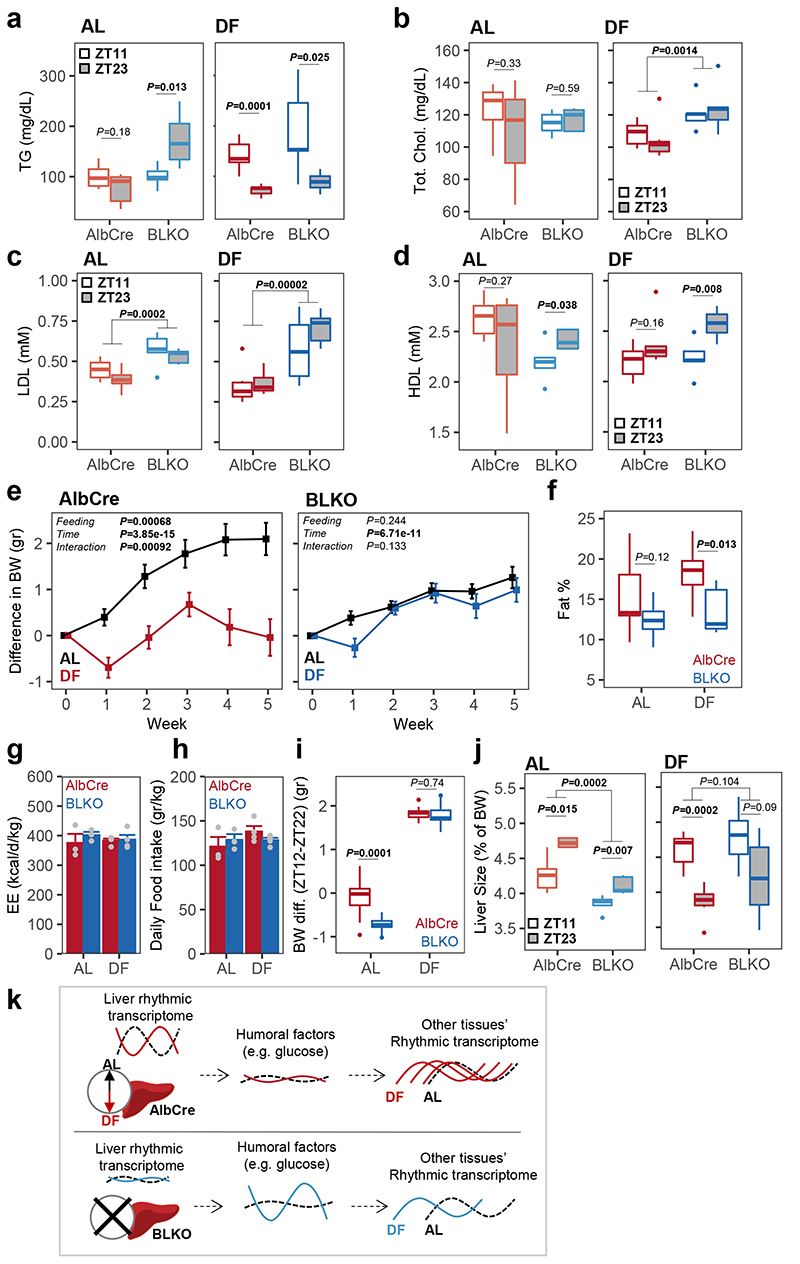
Lastly, we were interested in the overall effects of prolonged DF on AlbCre and BLKO mice, both generally and with respect to their temporal variance. First, we examined the effect of BLKO on plasma lipid composition. Triglycerides (TGs) showed a time-difference in AlbCre only under DF (with higher levels in the fed-state), while in BLKO rhythmicity was apparent already in AL (Fig. 7a). Total cholesterol and Low-Density Lipoprotein (LDL) levels did not vary between the tested time points, yet they exhibited elevated levels in BLKO compared to AlbCre (Fig. 7b-c). On the other hand, HDL exhibited temporal differences exclusively in BLKO, but not in AlbCre mice (Fig. 7d). These results suggest an impaired lipid and cholesterol homeostasis in BLKO, which might be due to liver-intrinsic mechanisms as well as its crosstalk with other organs. Beside the above-mentioned time-dependent variations, the blood lipids did not differ significantly in their mean levels between AL and DF, neither in AlbCre nor in BLKO (P>0.05, two-sample Student’s t-test).
Figure 7. The liver-clock affects body weight and composition in response to day feeding.
(a-d) Plasma parameters measured after 30 days of either ad libitum (AL) or day fed (DF): (a) triglycerides (TG); (b) Total cholesterol (Chol.); (c) Low Density Lipoproteins (LDL); (d) High Density Lipoproteins (HDL), (two-sided Student’s t-test; AlbCre AL n=6 per ZT; AlbCre DF ZT11 n=6 mice in ZT11, and n=7 mice in ZT23; BLKO AL n=6 in ZT11, and n=5 in ZT23; BLKO DF n=5 in ZT11, and n=6 in ZT23). (e) Weekly change in mice body weight (BW) from the initial weight throughout the experiment. (Mean ± SEM; 2-way ANOVA with repeated measures design; AlbCre AL n=12, DF n=13; BLKO AL n=11, DF n=10). (f) Percentage of whole body fat, as was measured on the fifth week (two-sided Student’s t-test; AlbCre AL n=9 mice, DF n=8 mice; BLKO AL n=7 mice, DF n=9 mice). (g) Daily Energy Expenditure (EE), and (h) daily food consumption, calculated from metabolic cages measurements of three consecutive days (Mean ± SEM; non-significant by two-way ANOVA; n=3 mice per genotype in AL, n=4 mice per genotype in DF). (i) The daily difference in BW between ZT12 and ZT22 in each condition (two-sided paired samples Student’s t-test; AlbCre AL n=12, DF n=13; BLKO AL n=11, DF n=10). (j) Livers weight as a percentage from total body weight (BW), at two opposing time points (two-sided Student’s t-test; AlbCre AL n=5 mice per ZT; AlbCre DF n=6 mice in ZT11, and n=7 mice in ZT23; BLKO AL n=6 in ZT11, and n=5 in ZT23; BLKO DF n=5 in ZT11, and n=6 in ZT23). (In boxplots: middle line= median, box= 25th to 75th Inter Quantile Range (IQR), whiskers= largest/smallest value up to 1.5*IQR, outlier points= data outside that range). (k) Schematic model summarizing the main findings. In AlbCre mice, the liver clock is functional and drive downstream transcriptional rhythms that coordinate liver functions and are inverted under DF. This activity suppresses daily fluctuations in blood-borne metabolites such as glucose. Consequently, transcriptional rhythms in other peripheral tissues response only mildly to DF. In contrast, in liver-clock deficient mice (BLKO) many transcripts lose their rhythmicity. The buffering effect of the liver on blood-glucose fluctuations decrease and robust rhythms appear under DF. These de novo rhythms in blood factors potentially account for the different effect of DF on the rhythmic transcriptome of other tissues in liver-clock deficient animals.
The differences in blood glucose and lipids between AlbCre and BLKO mice prompted us to test whether these mice differ as well in their body weight and composition. We found that AlbCre mice fed AL gained more weight compared to DF animals (Fig. 7e), consistent with a previous report9. Remarkably, BLKO mice, showed no difference in weight-gain between the feeding regimens, and in general gained less weight than AlbCre mice fed AL (Fig. 7e). Furthermore, the BLKO mice gained less fat under DF, compared to AlbCre mice (Fig. 7f). Intriguingly, the Energy Expenditure (EE) and total food consumption were similar across the conditions (Fig. 7g-h and Extended Data Fig. 7d and g). The observed differences in body weight and composition might be related to changes in gene expression of lipid-related metabolic pathways (e.g., “lipid catabolic process” and “lipid localization”) and tissue-dynamics (e.g., “cell migration” “autophagy” and “fat differentiation”) in WAT (Extended Data Fig. 5–6).
Next, we examined the daily difference in body weight between the end of the dark- and light-phases. When fed ad libitum, AlbCre mice showed no significant difference, while BLKO mice exhibited lower body weight (≈1 gram) at the end of the light phase (Fig 7i). Under DF, both strains showed higher weight (≈2 grams) at the end of the light phase, as might be expected due to the food restriction. Interestingly, this pattern corresponded to the daily variance in triglycerides (Fig. 7a). In addition, we observed considerable daily changes specifically in liver size29, 30, which were drastically reduced in BLKO (Fig 7j) in accord with liver glycogen levels (Fig 6b). This finding suggests a primary role for the liver endogenous clock in controlling its overall size.
The observed metabolic and physiologic changes broadly corresponded to changes in gene expression both in liver (e.g., lipid metabolism, cholesterol metabolism, carbohydrate metabolism gene pathways) and WAT (e.g., carbohydrate metabolism, mitochondrial respiration and energy utilization related pathways), (Extended Data Fig. 2, 5, and 6).
Taken together, our data reveal that liver-specific deletion of Bmal1 influences a plethora of physiologic and metabolic parameters, hinting towards the importance of the liver clock in regulation of these parameters to buffer against nutritional challenges.
Discussion
Our findings indicate that feeding-time differently affects clocks in peripheral tissues. Previous studies that analyzed peripheral tissues concluded that daytime-restricted feeding uncouples peripheral circadian oscillators from the central clock7–9. While some differences between tissues were observed in the past 7–9, 16, 31–34, they often were attributed to kinetics differences in their response to DF. The longer duration (i.e., 30 days), high sampling resolution, and broad tissue collection in the current study, clearly show that tissues differ in their entrainment by daytime feeding, and display a wide range of behaviors. Our results add to recent data suggesting tissue-specificity of peripheral clocks in response to other zeitgebers such as oxygen14 and stress35. Taken together, these findings revise the traditional view of peripheral clocks as a uniform group, at least in respect to their input mechanisms, and suggest that tissue-specificity to zeitgebers is the rule rather than the exception.
It is conceivable that clocks in peripheral tissues evolved in a way that they harness the most dominant and relevant signaling pathways in a given tissue, to optimize their ability to sense environmental changes. In the case of the liver, as expected from a major metabolic hub that is engaged in nutrient processing, its clock is highly responsive to changes in feeding-time. The clock in the lung, by contrast, is much less affected by the feeding time. However, it is responsive to changes in oxygen levels14 consistent with its role in oxygen uptake. These disparities are mostly evident under non-physiological interventions (e.g., daytime feeding, hypoxic exposure), as normally the different timing cues are more-or-less aligned with each other.
Different underlying mechanisms can conceptually account for the tissue-specific entrainment. Tissues can differ in their sensitivity or their level of exposure to a given signal and hence respond differently. When dealing with a conjunction of signals the picture becomes more complex, as they may interact with each other in various manners. The DF paradigm is, by its nature, a conflicting signals paradigm, as the light- and the SCN-related signals have one phase, while the food-related signals have an opposing phase36, 37. Moreover, food ingestion by itself instigates the activation of myriad of metabolic, endocrine, physiologic, and behavioral signals, all of which are potential zeitgebers 38–42. The interaction between different signals can lead to various outcomes that go beyond the additive effects of each signal. Consequently, it can explain differences in phase-shift (direction and extent), clock gene-specific effects, as well as loss-of-rhythmicity.
Throughout the study, we indeed encountered several cases of loss-of-rhythmicity upon DF. For example, the clock genes in the quadriceps muscle lost their rhythmicity upon day-feeding. These cases were well defined statistically, though their interpretation is not straightforward. One option is that statistical loss-of-rhythmicity is a result of amplitude reduction. Another option is that it is a result of desynchrony, either between cells in the same organ, or between individual mice that were used to reconstruct the daily profile. The recent advances in technologies for longitudinal measurements of rhythmicity in individual freely moving animals43, 44, can open the possibility to discriminate between these different scenarios in the future.
An intriguing point that clearly emerges from the current study is the poor association between the response of the clock (as determined by the profile of the core clock genes), and the tissue’s rhythmic transcriptome. The naïve view of the clock as the principal orchestrator of tissue rhythmicity assumes that overall changes in the phase of cellular rhythmicity are directed by the cellular clock. However, this view is contrasted by instances whereby the shift in the bulk of the rhythmic transcriptome does not correspond to the effect on the clock in the tissue (e.g., WAT in control mice, Lung in BLKO mice). This implies that a given timing-cue can differently act on the clock and on other rhythmic transcripts in the same tissue. Obviously, gene expression can be directly modulated by external signals, yet in the context of rhythmic expression, it is conceivable that the clock will play a role. Hence, it raises questions regarding the exact relationship of the core clock with other signals in controlling rhythmicity in gene expression. A direct practical implication of this observation is that one should be cautious when defining tissue rhythmicity solely based on the phase of its clock genes. Importantly, our results point towards functional organization of rhythmicity of peripheral tissues and particularly highlight the biological significance of the liver-clock. As aforementioned, rhythmicity of clock genes in the tested peripheral tissues is not affected by the liver-clock, irrespective of the feeding regimen. By contrast, the liver-clock strongly shapes both the phase and composition of their rhythmic transcriptome under AL and in response to DF. Specifically, we observed more prominent phase shifts upon DF in liver-clock mutant mice compared to control animals. Our in-depth analyses, unexpectedly, demonstrated that this is generally due to gain-of rhythmicity of strongly responsive genes and loss-of rhythmicity of mildly responsive genes rather more pronounced shifts of the same subset of genes. This led to a non-trivial association whereby the extent of phase-shift of a gene in control animals upon DF, can predict its rhythmicity in liver-clock mutant mice and vice versa. Although the subset of genes that lose rhythmicity in BLKO mice, are clearly dependent on liver-Bmal1, this by no means indicates that their oscillations are driven by the liver-clock. In fact, their phases are not inverted by DF, as would be expected based on the liver-clock. Thus, although their rhythmicity is liver-Bmal1 dependent, their phase might be dictated more profoundly by extra-hepatic cues such as light- or SCN-related signal(s). It is worthwhile to point out that whatever the nature of the signaling mechanisms that govern these effects, they are not considered as zeitgebers, as the clocks do not respond to them.
Our findings are consistent with the idea that the liver-clock functions as a homeostatic mechanism, a concept that was originally proposed by Weitz and colleagues26, and gained further attention more recently27, 45. According to this view (Fig 7k), the liver role is to preserve nutritional homeostasis46, through a timely regulation of anabolic and catabolic processes. For example, the liver will produce and secrete glucose mainly during the rest phase, while during the active phase glucose will be absorbed and stored47–49. In general, nutritional availability should be maintained at sufficient levels to support not only the liver but other tissues as well. Hence, when feeding is phase-inverted, the liver clock and its rhythmic processes must invert as well, to ensure constant blood concentration of nutrients. In the absence of the liver-clock, nutrient homeostasis is derailed leading to larger perturbations in nutrient concentrations, which likely affect rhythmicity in other tissues throughout the body. This hypothesis is supported by our observation that blood glucose levels oscillate in BLKO mice in DF but not in control mice. Shallow rhythms in blood glucose levels were previously reported in BLKO already under AL26, while in our experiment they were relatively constant; this difference might stem from different sampling time. It is conceivable that impaired hepatic rhythms in glucose and glycogen metabolism lead to altered daily blood glucose levels. Along this line, and consistent with our results it was recently shown that liver-Bmal1 is sufficient to drive oscillations in hepatic-glycogen levels and related gene expression under light-dark cycles22. Gain of rhythmicity in other systemic parameters were observed, further supporting the role of the liver-clock as a homeostatic mechanism, viz. body weight, triglycerides, HDL, and ketone bodies.
The effect of the liver-clock on rhythmicity of other peripheral tissue is likely conveyed through a plethora of signaling molecules (e.g., metabolites, peptides, hormones). We propose that glucose might serve as a strong candidate in this conjunction, as we observed pronounced changes in glucose levels and rhythmicity in blood of liver-clock mutant mice upon DF. These changes correspond to changes in gene expression of other peripheral tissues such as the WAT that are consistent with altered glucose availability. While changes in gene expression, in conjunction with the predicted upstream metabolic regulators (e.g., PPARs, HIF1A and HNF), correlate with the observed metabolic and physiologic phenotype, they do not serve as evidence for causality. Future studies, utilizing loss-of-function and tissue-specific knockout models, are expected to shed important mechanistic insight in this regard. Given the intricate interaction between different tissues and the wide metabolic and physiologic effects that we observed in liver-clock mutant mice, it is likely that many other signaling molecules participate in the communication between the liver and other peripheral tissues and act together to modulate their rhythmicity.
In essence, our study sheds light on the in vivo interactions between rhythmic processes in peripheral tissues, and highlight the role of the liver-clock in coordinating rhythmicity of peripheral tissues in response to feeding, irrespective of their clocks. These findings might be relevant for a wide variety of metabolic pathologies for which dysregulation of inter organ communication has been shown50.
Methods
Contact for reagent and resource sharing
Further information and requests for resources and reagents should be directed to and will be fulfilled by the Lead Contact, Gad Asher (gad.asher@weizmann.ac.il)
Animals
All animal experiments and procedures were conducted in conformity with the Weizmann Institute Animal Care and Use Committee (IACUC) guidelines. Three to four months-old male C57BL/6 Alb-Cre + mice (denoted throughout as “AlbCre”; Jackson Laboratories) or Alb-Cre+ Bmal1fl/fl mice (denoted as “BLKO”)14, 26 were used. Animals were housed in an SPF animal facility, at ambient temperature of 22°C and 50% humidity, under a 12 h light-dark regimen (LD). Lights were controlled by Circadian Cabinets (Actimetrics). Mice were fed either ad libitum (AL) or exclusively during the light phase (Daytime-restricted Feeding, DF), for 30 days. The mice were fed with normal chow (2018 Teklad Global 18% Protein Rodent Diet, Envigo).
In the first experiment, following the feeding intervention mice were euthanized by cervical dislocation every 2 h for a total of 24 h (n=2 animals per time point), and tissues were harvested.
In a second experiment, the same design was applied, only this time mice were assigned to different assays throughout the 30 days period (i.e., weekly body weight monitoring, body composition, blood glucose and ketone measurements, and IPGTT). A total of 25 AlbCre and 23 BLKO mice were used. At the end of the experiment, mice were euthanized at two opposing ZTs (namely ZT11 and ZT23, n=5-7 per time-point per condition), and their plasma and tissues were collected.
RNA extraction
Tissues were snap-frozen in liquid nitrogen immediately after dissection and stored at −80°C until used. For RNA extraction, the tissues were soaked in TRI-reagent (Sigma) and were homogenized in Bead Ruptor24e (OMNI) with stainless steel beads, and then proceeded by a standard TRI-reagent based RNA extraction protocol. RNA concentration was determined using NanoDrop™ 2000 Spectrophotometer (Thermo Fisher Scientific). RNA quality was validated using 2200 TapeStation (Agilent).
Quantitative PCR
Synthesis of cDNA was performed using qScript cDNA SuperMix (Quanta Biosciences). Real-time quantitative PCR measurements were performed using SYBR green probes with LightCycler II machine (Roche) and analyzed according to the 2-ΔΔCt method. The first normalization was to the geometrical mean of two housekeeping genes: Rplp0 and Hprt. The second normalization was to the mean expression of each condition. Log2 transformation was applied to all data for presentation purposes.
Primers are detailed in Supplementary Table 1. The Arntl primers were designed specifically for the floxed site in the hepatocytes of Alb-Cre+ Bmal1fl/fl, in order to evaluate the knockout.
Rhythmicity of qPCR profiles was determined using the JTK_CYCLE test19, via MetaCycle51. A cosine was fitted to the log2-normalized data using the ‘fit’ function in MATLAB, according to the phases extracted from JTK. Amplitudes were calculated as the difference between the peak and the trough of the fits, which is the fold-change on a linear scale.
For magnitude (mean expression) comparison, samples from all time points for each condition were pooled, and analyzed together on the same Real-time PCR plate.
MARS-seq library preparation, sequencing, and processing
We used a derivation of the MARS-seq as described 52, originally developed for single-cell RNA-seq to produce expression libraries, and exclusively sequencing the 3’-end of the transcripts. The prepared bulk MARS-seq libraries were sequenced with high-output 75bp kits (FC-404-2005, Illumina) on NextSeq 500/550 Illumina sequencer.
Processing of raw sequencing data into read counts was performed via the User-friendly Transcriptome Analysis Pipeline (UTAP) 53. In short, Reads were trimmed using cutadapt 54 and mapped to genome (/shareDB/iGenomes/Mus_musculus/UCSC/mm10/Sequence/STAR_index) using STAR 55 (default parameters). The pipeline quantifies the genes annotated in RefSeq (that have expanded with 1000 bases toward 5’ edge and 100 bases toward 3’ bases). Counting (UMI counts) was done using HTSeq-count in union mode 56. Normalization of the counts was performed using DESeq2 57 with the parameters: betaPrior=True, cooksCutoff=FALSE, independentFiltering=FALSE.
The raw fastq files and summary tables are available on GEO database (accession number GSE159135).
RNA-seq statistical analysis
Lowly expressed genes were filtered out, according to the following: only genes with at least two reads in at least half of the samples in each condition were retained, and only genes detected in all four conditions were used. This procedure removed about 5-15% of genes per condition, in either of the tissues.
For determining gene rhythmicity, and differential rhythmicity between two conditions, a two-stage approach was used. In the first stage, JTK_CYCLE was performed on each condition (via MetaCycle), and the p-values (ADJ.P) were retrieved. Then, the minimal p-value for each gene was determined (i.e. the p-value of the most significant condition was chosen). On this Pmin, a Benjamini-Hochberg FDR was calculated (Qmin) (fdrtool R package58). A gene with Qmin<0.05 was defined as rhythmic in at least one condition. In the second stage, harmonic regression test (HarmonicRegression R package59) was performed on the genes that passed the first selection, and p-values were retrieved (PHR). A gene was defined as rhythmic in a certain condition if PHR<0.05 on this condition (and Qmin<0.05). This approach is similar to previous reports60, 61, and is advantageous for the correct determination of differential gene rhythmicity. Phases and amplitudes were retrieved from the harmonic regression test results. Full results of rhythmicity analysis can be found in Supplementary Data 2.
Circular statistics was performed using the “circular” R package62. Differential circular distribution was tested by Watson two-sample test63.
Gene enrichment testing
For enrichment tests, Gene lists were first converted from SYMBOL to EntrezID. Over-representation of GO64, 65 terms was tested using the ClusterProfiler package66, with default settings. The full enrichment tests results can be found in Supplementary Data 3.
“Upstream regulators” analysis was performed using the Ingenuity Pathway Analysis (IPA) software (QIAGEN) with default settings, and the full results can be found in Supplementary Data 4.
Phase Set Enrichment analysis (PSEA) was performed using the PSEA Java interface (v1.1) with default settings67. To produce the input tables, mouse gene symbols were converted to human symbols using biomaRt68, and phases were retrieved from the harmonic regression test abovementioned. GO terms were retrieved from MSigDB (c5.go.bp.v7.2.symbols.gmt)69. The full PSEA results can be found in Supplementary Data 5.
Protein extraction and immunoblot analysis
Tissues were snap-frozen in liquid nitrogen immediately after dissection and stored at −80°C until used. For total protein extraction, tissues were homogenized by Bead Ruptor24e (OMNI) with stainless steel beads, in ice-cold RIPA buffer (150 mM NaCl, 1% NP-40, 0.5% Na-deoxycholate, 0.1% SDS, 50 mM Tris-HCl pH 8, and 1 mM dithiothreitol), supplemented with: protease inhibitors cocktail (1 mM N-(a-aminoethyl) benzene-sulfonyl fluoride, 40 mM bestatin, 15 mM E65, 20 mM leupeptin, and 15 mM pepstatin) (Sigma), PMSF (1:200), Vannadate (1:500), NaF (1:1000). The extracts were centrifuged at 16,200 x g for 15 min at 4°C.
Protein concentration was determined by the BCA assay (Thermofisher), and equalized between samples. Then, samples were heated at 95°C for 5 min in Laemmli sample buffer and analyzed by SDS-PAGE and immunoblot. Antibodies that were used: Rabbit anti-ARNTL15, anti-PER215, anti-p-NR1D1 (Cell Signaling Technology), and Mouse anti-U2AF (Sigma). All antibodies were used diluted 1:1000 in suitable buffer (PBS-T supplemented with 5% BSA, 0.02% sodium azid, and phenol red).
Blood measurements
Blood glucose was measured using Contour glucometer (Bayer). The blood was drawn from a tale-tip cut. Basal glucose measurements were taken in 6 h intervals and done in duplicates.
For IPGTT, a standard protocol was used. Briefly, mice were food-deprived for 2 h (for the AL ZT10 group) or 10 h (for the DF ZT22 group) prior to the test. Then, a basal measurements (time 0) were taken, followed by intraperitoneal (IP) injection of glucose in a dose of 2 gr/kg. Subsequent blood measurements were taken 15, 30, 60, 90 and 120 min after the injection.
Beta-hydroxybutyrate (β-OHB) was measured using FreeStyle Optium Neo with β-ketone strips (Abbot), in blood taken from a tale-tip cut.
Plasma measurements
Plasma triglycerides, total cholesterol, LDL, HDL, were measured using the Cobas c111 instrument (Roche) according to the manufacturer’s protocols.
Glycogen measurements
Liver pieces were weighted, and homogenized in water using Bead Ruptor24e (OMNI) with stainless steel beads. The extracts were boiled for 10 min, and then were centrifuged for 15 min in 21,000 x g (4°C). Next, glycogen content was quantified using an enzymatic colorimetric kit (Sigma), with equal tissue concentration (30 ug / well). The background glucose measurements (i.e., taken without hydrolysis of the glycogen) were used for background subtraction, as well as for measuring the tissue glucose content.
Body composition
Whole body fat was determined using Minispec LF50 Body Composition Analyzer (Bruker, Germany), at ZT10-12 for all conditions.
Metabolic cages
Mice oxygen consumption rate, carbon dioxide release, spontaneous locomotor activity and food consumption were simultaneously monitored for individually housed mice using the Phenomaster metabolic cages (TSE System). Several adaptation days to the new housing conditions preceded each experiment. Data were collected at 15 min intervals. Respiratory Exchange Rate (RER) and Energy Expenditure (EE) were automatically calculated from the oxygen and carbon dioxide measurements by the instrument’s software.
Software and statistics
All the statistical analyses and data visualization were performed with either R (v4.0.1) or MATLAB 2020a (MathWorks). Data visualization with R was performed using the ggplot270 and ComplexHeatmap71 packages. In all boxplots: middle line= median, box= 25th to 75th Inter Quantile Range (IQR), whiskers= the largest/smallest value no greater/smaller than 1.5*IQR, outlier points= measurements outside this range. In all bar and line plots, data is mean ± SEM.
Extended Data
Extended Data Fig. 1. Feeding differentially affects clocks in peripheral tissues.
Quantitative PCR results from mice (AlbCre) fed either ad libitum (AL) or exclusively during the light-phase (DF) for 30 days. Samples were collected at 2 h intervals for 24 h (n=2 biologically independent mice per time point). Presented are representative clock genes from the (a) Liver, (b) White Adipose Tissue (WAT), (c) Lung, (d) Quadriceps muscle, (e) Kidney, and (f) Heart. Dots mark individual measurements in each Zeitgeber Time (ZT). Significant rhythms according to JTK_CYCLE are denoted by cosine fit curve according to the captions, with a vertical line representing the phase; dashed curves represent non-significant (ns) rhythms. Note that the profiles for Arntl and Nr1d1 are re-plotted from Fig. 1a-f and are included here as well to enable side-by-side comparison with other clock genes in each tissue.
Extended Data Fig. 2. Daytime-restricted feeding affects the rhythmic transcriptome in a tissue-specific manner.
Gene Ontology (GO) Biological Processes (BP) enrichment analysis of rhythmic genes in mice fed either ad libitum (AL) or exclusively during the light-phase (DF) for 30 days. (a) Liver, (b) WAT, and (c) Lung (P<0.05, over-representation test).
Extended Data Fig. 3. The liver-clock does not affect clock-rhythmicity in other peripheral tissues.
Quantitative PCR results of clock gene expression of liver-clock mutant mice (BLKO), fed either ad libitum (AL, upper panels) or exclusively during the light-phase (DF, lower panels) for 30 days. Samples were collected at 2 h intervals for 24 h (n=2 biologically independent mice per time point). Presented are representative clock genes from the (a) Liver, (b) White Adipose Tissue (WAT), (c) Lung, (d) Quadriceps muscle, (e) Kidney, and (f) Heart. Dots mark individual measurements in each Zeitgeber Time (ZT). Significant rhythms according to JTK_CYCLE are denoted by cosine fit curve according to the captions, with a vertical line representing the phase; dashed curves represent non-significant (ns) rhythms.
Extended Data Fig. 4. The liver-clock affects the composition of lung and WAT rhythmic transcriptome.
(a) The transcriptomic data of either WAT or lung was subdivided into 15 subsets, based on their rhythmicity in each of the four conditions (AlbCre AL, AlbCre DF, BLKO AL, BLKO DF). For each condition a gene is consider rhythmic if overall Qmin <0.05, and PHR<0.05 in this condition (JTK_CYCLE and Harmonic Regression, see also Methods section). Depicted is a tabular summary of all the subsets and categories (L-Bmal1= Liver-Bmal1). (b, c) Bar plot representation of the size of each subset in WAT (b) and lung (c), with coloration according to the categories as in (a). (d, e) Ingenuity Upstream Regulators analysis for each category in WAT (d) and lung (e) (presented are transcriptional regulators, P<0.001, and at least 20 targets in the category).
Extended Data Fig. 5. Enrichment analysis for functional annotations of the different rhythmic categories.
Gene Ontology (GO) Biological Processes (BP) enrichment analysis of rhythmic genes which either loss their rhythmicity in BLKO (“Loss”), or gained rhythmicity in BLKO (“Gain”), or where not affected by BLKO (“Retain”) in (a) WAT and (b) Lung. (P<0.05, over-representation test).
Extended Data Fig. 6. Impaired glucose homeostasis in liver-clock deficient mice in response to day feeding.
(a-c) Around-the-clock transcriptomic analysis of livers from either AlbCre control mice or liver-clock deficient mice (BLKO) fed either ad libitum (AL) or exclusively during the light-phase (DF) for 30 days. (a) Pie chart representing the distribution of genes between the different rhythmicity categories (see Fig. S4 for details). (b) Bar-plot representing the sizes of each rhythmicity subset (see Fig. S4 for details). (c) Gene Ontology (GO) Biological Processes (BP) enrichment analysis of rhythmic genes from the RRNN subset (P<0.05, over-representation test). (d) Phase Set Enrichment Analysis of GO terms in WAT of AlbCre (left panel) or BLKO (right panel) mice. Only terms that are significantly phase-enriched in both ad libitum (AL) and day fed animals (DF) are presented (P<0.05, Kuiper test), and the phase differences between the two regimens are depicted.
Extended Data Fig. 7. Behavioral and metabolic characterization of control and liver-clock deficient mice.
(a) Intra-Peritoneal Glucose Tolerance Test (IPGTT) analysis AlbCre or BLKO mice fed ad libitum (AL), performed at ZT10 after 2 h of food deprivation (Circles - individual mice, lines - mean levels; 2-way ANOVA with repeated measures design; AlbCre n=9 mice, BLKO n=8 mice). (b) IPGTT results from day-fed (DF) AlbCre or BLKO mice, performed at ZT22 (due to the daytime feeding, these mice were food deprived for 10 h), (Circles - individual mice, lines - mean levels; 2-way ANOVA with repeated measures design; n=7 mice per condition). (c) Area Under the glucose Curve (AUC), as calculated for the data in (a-b), (two-sided Student’s t-test, n as in (a) and (b); boxplots: middle line= median, box= 25th to 75th Inter Quantile Range (IQR), whiskers= the largest/smallest value no greater/smaller than 1.5*IQR, outlier points= measurements outside this range). (d-g) Mice fed either ad libitum (AL) or exclusively during the light-phase (DF) for 4 weeks and were analyzed in metabolic cages for three consecutive days under the same feeding regimens. (d) Food consumption, (e) Activity, (f) Respiratory Exchange Rate (RER), and (g) Energy expenditure (EE) are presented. The data is presented as average of individual mice (n=3 mice per genotype in AL, n=4 mice per genotype in DF), with 1 h binning of the data (original measurement were taken every 15 minutes).
Supplementary Material
Quantitative PCR primers
Editor Summary.
Little is known regarding the specificity and functional organization of peripheral clocks in mammals. Manella et al. find that the liver-clock is responsible for buffering the effects of nutrient challenges on rhythmicity of other peripheral tissues.
Acknowledgments
We are grateful to all the members of the Asher lab for their comments on the manuscript. We thank Leviel Flur and Eran Elinav for their aid with plasma measurements, and Yael Kuperman for her assistance with the metabolic cages. G.A. is supported by the European Research Council (ERC-2017 CIRCOMMUNICATION 770869), Abisch Frenkel Foundation for the Promotion of Life Sciences, Adelis Foundation, Susan and Michael Stern. E.S. received a Martin Kushner Schnur and Armando and Maria Jinich postdoctoral fellowship for Mexican citizens.
Footnotes
Author Contributions Statement
Conceptualization: G.M. and G.A.; Investigation: G.M., E.S., R.A., V.D., S.E., M.G., and Y.A.; Visualization: G.M.; Data Curation: G.M.; Software: G.M.; Funding: G.A.; Writing–Review & Editing: G.M. and G.A.
Competing Interests Statement
The authors declare no competing interests.
Data Availability
RNA-sequencing data is available from the GEO database (accession number GSE159135).
Figures 1 and 3, and Extended Data Figures 1 and 3, are associated with the statistical analysis available in Supplementary Data 1. In addition, the unprocessed blots of Figure 1g are available as Source Data.
Figures 2, 4, 5, 6a, and Extended Data Figures 4 and 6 are associated with the RNA-seq data (raw and processed data accessible through GEO), and with the statistical analysis available in Supplementary Data 2.
Extended Data Figures 2, 5, and 6c are associated with the complete results presented in Supplementary Data 3.
Extended Data Figure 4d-e are associated with the complete results presented in Supplementary Data 4.
Extended Data Figure 6d is associated with the complete results presented in Supplementary Data 5.
All other data that support the findings of this study are available from the corresponding author upon request.
References
- 1.Schibler U, et al. Clock-Talk: Interactions between Central and Peripheral Circadian Oscillators in Mammals. Cold Spring Harb Symp Quant Biol. 2015;80:223–232. doi: 10.1101/sqb.2015.80.027490. [DOI] [PubMed] [Google Scholar]
- 2.Mohawk JA, Green CB, Takahashi JS. Central and peripheral circadian clocks in mammals. Annu Rev Neurosci. 2012;35:445–462. doi: 10.1146/annurev-neuro-060909-153128. [DOI] [PMC free article] [PubMed] [Google Scholar]
- 3.Albrecht U. Timing to perfection: the biology of central and peripheral circadian clocks. Neuron. 2012;74:246–260. doi: 10.1016/j.neuron.2012.04.006. [DOI] [PubMed] [Google Scholar]
- 4.Dibner C, Schibler U, Albrecht U. The mammalian circadian timing system: organization and coordination of central and peripheral clocks. Annu Rev Physiol. 2010;72:517–549. doi: 10.1146/annurev-physiol-021909-135821. [DOI] [PubMed] [Google Scholar]
- 5.Reinke H, Asher G. Crosstalk between metabolism and circadian clocks. Nat Rev Mol Cell Biol. 2019;20:227–241. doi: 10.1038/s41580-018-0096-9. [DOI] [PubMed] [Google Scholar]
- 6.Pickel L, Sung HK. Feeding Rhythms and the Circadian Regulation of Metabolism. Front Nutr. 2020;7:39. doi: 10.3389/fnut.2020.00039. [DOI] [PMC free article] [PubMed] [Google Scholar]
- 7.Damiola F, et al. Restricted feeding uncouples circadian oscillators in peripheral tissues from the central pacemaker in the suprachiasmatic nucleus. Genes Dev. 2000;14:2950–2961. doi: 10.1101/gad.183500. [DOI] [PMC free article] [PubMed] [Google Scholar]
- 8.Mukherji A, Kobiita A, Chambon P. Shifting the feeding of mice to the rest phase creates metabolic alterations, which, on their own, shift the peripheral circadian clocks by 12 hours. Proc Natl Acad Sci U S A. 2015;112:E6683–6690. doi: 10.1073/pnas.1519735112. [DOI] [PMC free article] [PubMed] [Google Scholar]
- 9.Mukherji A, et al. Shifting eating to the circadian rest phase misaligns the peripheral clocks with the master SCN clock and leads to a metabolic syndrome. Proc Natl Acad Sci U S A. 2015;112:E6691–6698. doi: 10.1073/pnas.1519807112. [DOI] [PMC free article] [PubMed] [Google Scholar]
- 10.Stokkan KA, Yamazaki S, Tei H, Sakaki Y, Menaker M. Entrainment of the circadian clock in the liver by feeding. Science. 2001;291:490–493. doi: 10.1126/science.291.5503.490. [DOI] [PubMed] [Google Scholar]
- 11.Vollmers C, et al. Time of feeding and the intrinsic circadian clock drive rhythms in hepatic gene expression. Proc Natl Acad Sci U S A. 2009;106:21453–21458. doi: 10.1073/pnas.0909591106. [DOI] [PMC free article] [PubMed] [Google Scholar]
- 12.Yeung J, Naef F. Rhythms of the Genome: Circadian Dynamics from Chromatin Topology, Tissue-Specific Gene Expression, to Behavior. Trends Genet. 2018;34:915–926. doi: 10.1016/j.tig.2018.09.005. [DOI] [PubMed] [Google Scholar]
- 13.Ruben MD, et al. A database of tissue-specific rhythmically expressed human genes has potential applications in circadian medicine. Sci Transl Med. 2018;10 doi: 10.1126/scitranslmed.aat8806. [DOI] [PMC free article] [PubMed] [Google Scholar]
- 14.Manella G, et al. Hypoxia induces a time- and tissue-specific response that elicits intertissue circadian clock misalignment. Proc Natl Acad Sci U S A. 2020;117:779–786. doi: 10.1073/pnas.1914112117. [DOI] [PMC free article] [PubMed] [Google Scholar]
- 15.Asher G, et al. Poly(ADP-ribose) polymerase 1 participates in the phase entrainment of circadian clocks to feeding. Cell. 2010;142:943–953. doi: 10.1016/j.cell.2010.08.016. [DOI] [PubMed] [Google Scholar]
- 16.Bray MS, et al. Quantitative analysis of light-phase restricted feeding reveals metabolic dyssynchrony in mice. Int J Obes (Lond) 2013;37:843–852. doi: 10.1038/ijo.2012.137. [DOI] [PMC free article] [PubMed] [Google Scholar]
- 17.Gilbert MR, Douris N, Tongjai S, Green CB. Nocturnin expression is induced by fasting in the white adipose tissue of restricted fed mice. PLoS One. 2011;6:e17051. doi: 10.1371/journal.pone.0017051. [DOI] [PMC free article] [PubMed] [Google Scholar]
- 18.Zvonic S, et al. Characterization of peripheral circadian clocks in adipose tissues. Diabetes. 2006;55:962–970. doi: 10.2337/diabetes.55.04.06.db05-0873. [DOI] [PubMed] [Google Scholar]
- 19.Hughes ME, Hogenesch JB, Kornacker K. JTK_CYCLE: an efficient nonparametric algorithm for detecting rhythmic components in genome-scale data sets. J Biol Rhythms. 2010;25:372–380. doi: 10.1177/0748730410379711. [DOI] [PMC free article] [PubMed] [Google Scholar]
- 20.Greenwell BJ, et al. Rhythmic Food Intake Drives Rhythmic Gene Expression More Potently than the Hepatic Circadian Clock in Mice. Cell Rep. 2019;27:649–657.:e645. doi: 10.1016/j.celrep.2019.03.064. [DOI] [PubMed] [Google Scholar]
- 21.Kornmann B, Schaad O, Bujard H, Takahashi JS, Schibler U. System-driven and oscillator-dependent circadian transcription in mice with a conditionally active liver clock. PLoS Biol. 2007;5:e34. doi: 10.1371/journal.pbio.0050034. [DOI] [PMC free article] [PubMed] [Google Scholar]
- 22.Koronowski KB, et al. Defining the Independence of the Liver Circadian Clock. Cell. 2019;177:1448–1462.:e1414. doi: 10.1016/j.cell.2019.04.025. [DOI] [PMC free article] [PubMed] [Google Scholar]
- 23.Welz PS, et al. BMAL1-Driven Tissue Clocks Respond Independently to Light to Maintain Homeostasis. Cell. 2019;178:1029. doi: 10.1016/j.cell.2019.07.030. [DOI] [PMC free article] [PubMed] [Google Scholar]
- 24.Reinke H, Asher G. Circadian Clock Control of Liver Metabolic Functions. Gastroenterology. 2016;150:574–580. doi: 10.1053/j.gastro.2015.11.043. [DOI] [PubMed] [Google Scholar]
- 25.Asher G, Sassone-Corsi P. Time for food: the intimate interplay between nutrition, metabolism, and the circadian clock. Cell. 2015;161:84–92. doi: 10.1016/j.cell.2015.03.015. [DOI] [PubMed] [Google Scholar]
- 26.Lamia KA, Storch KF, Weitz CJ. Physiological significance of a peripheral tissue circadian clock. Proc Natl Acad Sci U S A. 2008;105:15172–15177. doi: 10.1073/pnas.0806717105. [DOI] [PMC free article] [PubMed] [Google Scholar]
- 27.Guan D, et al. The hepatocyte clock and feeding control chronophysiology of multiple liver cell types. Science. 2020;369:1388–1394. doi: 10.1126/science.aba8984. [DOI] [PMC free article] [PubMed] [Google Scholar]
- 28.Doi R, Oishi K, Ishida N. CLOCK regulates circadian rhythms of hepatic glycogen synthesis through transcriptional activation of Gys2. J Biol Chem. 2010;285:22114–22121. doi: 10.1074/jbc.M110.110361. [DOI] [PMC free article] [PubMed] [Google Scholar]
- 29.Diaz-Munoz M, et al. Daytime food restriction alters liver glycogen, triacylglycerols, and cell size. A histochemical, morphometric, and ultrastructural study. Comp Hepatol. 2010;9:5. doi: 10.1186/1476-5926-9-5. [DOI] [PMC free article] [PubMed] [Google Scholar]
- 30.Sinturel F, et al. Diurnal Oscillations in Liver Mass and Cell Size Accompany Ribosome Assembly Cycles. Cell. 2017;169:651–663.:e614. doi: 10.1016/j.cell.2017.04.015. [DOI] [PMC free article] [PubMed] [Google Scholar]
- 31.Wang H, et al. Time-Restricted Feeding Shifts the Skin Circadian Clock and Alters UVB-Induced DNA Damage. Cell Rep. 2017;20:1061–1072. doi: 10.1016/j.celrep.2017.07.022. [DOI] [PMC free article] [PubMed] [Google Scholar]
- 32.Minami Y, Horikawa K, Akiyama M, Shibata S. Restricted feeding induces daily expression of clock genes and Pai-1 mRNA in the heart of Clock mutant mice. FEBS Lett. 2002;526:115–118. doi: 10.1016/s0014-5793(02)03159-9. [DOI] [PubMed] [Google Scholar]
- 33.Opperhuizen AL, et al. Feeding during the resting phase causes profound changes in physiology and desynchronization between liver and muscle rhythms of rats. Eur J Neurosci. 2016;44:2795–2806. doi: 10.1111/ejn.13377. [DOI] [PubMed] [Google Scholar]
- 34.Reznick J, et al. Altered feeding differentially regulates circadian rhythms and energy metabolism in liver and muscle of rats. Biochim Biophys Acta. 2013;1832:228–238. doi: 10.1016/j.bbadis.2012.08.010. [DOI] [PubMed] [Google Scholar]
- 35.Tahara Y, et al. Entrainment of the mouse circadian clock by sub-acute physical and psychological stress. Sci Rep. 2015;5:11417. doi: 10.1038/srep11417. [DOI] [PMC free article] [PubMed] [Google Scholar]
- 36.Woller A, Gonze D. Modeling clock-related metabolic syndrome due to conflicting light and food cues. Sci Rep. 2018;8:13641. doi: 10.1038/s41598-018-31804-9. [DOI] [PMC free article] [PubMed] [Google Scholar]
- 37.Bae SA, Androulakis IP. The Synergistic Role of Light-Feeding Phase Relations on Entraining Robust Circadian Rhythms in the Periphery. Gene Regul Syst Bio. 2017;11:1177625017702393. doi: 10.1177/1177625017702393. [DOI] [PMC free article] [PubMed] [Google Scholar]
- 38.Adamovich Y, Ladeuix B, Golik M, Koeners MP, Asher G. Rhythmic Oxygen Levels Reset Circadian Clocks through HIF1alpha. Cell Metab. 2017;25:93–101. doi: 10.1016/j.cmet.2016.09.014. [DOI] [PubMed] [Google Scholar]
- 39.Adamovich Y, et al. Oxygen and Carbon Dioxide Rhythms Are Circadian Clock Controlled and Differentially Directed by Behavioral Signals. Cell Metab. 2019 doi: 10.1016/j.cmet.2019.01.007. [DOI] [PubMed] [Google Scholar]
- 40.Buhr ED, Yoo SH, Takahashi JS. Temperature as a universal resetting cue for mammalian circadian oscillators. Science. 2010;330:379–385. doi: 10.1126/science.1195262. [DOI] [PMC free article] [PubMed] [Google Scholar]
- 41.Pezuk P, Mohawk JA, Wang LA, Menaker M. Glucocorticoids as entraining signals for peripheral circadian oscillators. Endocrinology. 2012;153:4775–4783. doi: 10.1210/en.2012-1486. [DOI] [PMC free article] [PubMed] [Google Scholar]
- 42.Crosby P, et al. Insulin/IGF-1 Drives PERIOD Synthesis to Entrain Circadian Rhythms with Feeding Time. Cell. 2019;177:896–909.:e820. doi: 10.1016/j.cell.2019.02.017. [DOI] [PMC free article] [PubMed] [Google Scholar]
- 43.Hamada T, et al. In vivo imaging of clock gene expression in multiple tissues of freely moving mice. Nat Commun. 2016;7:11705. doi: 10.1038/ncomms11705. [DOI] [PMC free article] [PubMed] [Google Scholar]
- 44.Sinturel F, et al. Circadian hepatocyte clocks keep synchrony in the absence of a master pacemaker in the suprachiasmatic nucleus or other extrahepatic clocks. Genes Dev. 2021;35:329–334. doi: 10.1101/gad.346460.120. [DOI] [PMC free article] [PubMed] [Google Scholar]
- 45.Matsumura T, et al. Liver-specific dysregulation of clock-controlled output signal impairs energy metabolism in liver and muscle. Biochem Biophys Res Commun. 2021;534:415–421. doi: 10.1016/j.bbrc.2020.11.066. [DOI] [PubMed] [Google Scholar]
- 46.van den Berghe G. The role of the liver in metabolic homeostasis: implications for inborn errors of metabolism. J Inherit Metab Dis. 1991;14:407–420. doi: 10.1007/BF01797914. [DOI] [PubMed] [Google Scholar]
- 47.Gachon F, Loizides-Mangold U, Petrenko V, Dibner C. Glucose Homeostasis: Regulation by Peripheral Circadian Clocks in Rodents and Humans. Endocrinology. 2017;158:1074–1084. doi: 10.1210/en.2017-00218. [DOI] [PubMed] [Google Scholar]
- 48.Gatfield D, Schibler U. Circadian glucose homeostasis requires compensatory interference between brain and liver clocks. Proc Natl Acad Sci U S A. 2008;105:14753–14754. doi: 10.1073/pnas.0807861105. [DOI] [PMC free article] [PubMed] [Google Scholar]
- 49.Kalsbeek A, la Fleur S, Fliers E. Circadian control of glucose metabolism. Mol Metab. 2014;3:372–383. doi: 10.1016/j.molmet.2014.03.002. [DOI] [PMC free article] [PubMed] [Google Scholar]
- 50.Priest C, Tontonoz P. Inter-organ cross-talk in metabolic syndrome. Nat Metab. 2019;1:1177–1188. doi: 10.1038/s42255-019-0145-5. [DOI] [PubMed] [Google Scholar]
- 51.Wu G, Anafi RC, Hughes ME, Kornacker K, Hogenesch JB. MetaCycle: an integrated R package to evaluate periodicity in large scale data. Bioinformatics. 2016;32:3351–3353. doi: 10.1093/bioinformatics/btw405. [DOI] [PMC free article] [PubMed] [Google Scholar]
- 52.Jaitin DA, et al. Massively parallel single-cell RNA-seq for marker-free decomposition of tissues into cell types. Science. 2014;343:776–779. doi: 10.1126/science.1247651. [DOI] [PMC free article] [PubMed] [Google Scholar]
- 53.Kohen R, et al. UTAP: User-friendly Transcriptome Analysis Pipeline. BMC Bioinformatics. 2019;20:154. doi: 10.1186/s12859-019-2728-2. [DOI] [PMC free article] [PubMed] [Google Scholar]
- 54.Martin M. Cutadapt removes adapter sequences from high-throughput sequencing reads. 2011;17:3. (2011) [Google Scholar]
- 55.Dobin A, et al. STAR: ultrafast universal RNA-seq aligner. Bioinformatics. 2013;29:15–21. doi: 10.1093/bioinformatics/bts635. [DOI] [PMC free article] [PubMed] [Google Scholar]
- 56.Anders S, Pyl PT, Huber W. HTSeq--a Python framework to work with high-throughput sequencing data. Bioinformatics. 2015;31:166–169. doi: 10.1093/bioinformatics/btu638. [DOI] [PMC free article] [PubMed] [Google Scholar]
- 57.Love MI, Huber W, Anders S. Moderated estimation of fold change and dispersion for RNA-seq data with DESeq2. Genome Biol. 2014;15:550. doi: 10.1186/s13059-014-0550-8. [DOI] [PMC free article] [PubMed] [Google Scholar]
- 58.Strimmer K. fdrtool: a versatile R package for estimating local and tail area-based false discovery rates. Bioinformatics. 2008;24:1461–1462. doi: 10.1093/bioinformatics/btn209. [DOI] [PubMed] [Google Scholar]
- 59.Luck S, Thurley K, Thaben PF, Westermark PO. Rhythmic degradation explains and unifies circadian transcriptome and proteome data. Cell Rep. 2014;9:741–751. doi: 10.1016/j.celrep.2014.09.021. [DOI] [PubMed] [Google Scholar]
- 60.Wang X, et al. An R package suite for microarray meta-analysis in quality control, differentially expressed gene analysis and pathway enrichment detection. Bioinformatics. 2012;28:2534–2536. doi: 10.1093/bioinformatics/bts485. [DOI] [PMC free article] [PubMed] [Google Scholar]
- 61.Singer JM, Hughey JJ. LimoRhyde: A Flexible Approach for Differential Analysis of Rhythmic Transcriptome Data. J Biol Rhythms. 2019;34:5–18. doi: 10.1177/0748730418813785. [DOI] [PMC free article] [PubMed] [Google Scholar]
- 62.Lund CA.a.U. 2017 [Google Scholar]
- 63.Jammalamadaka SR, Sengupta A. Topics in circular statistics. World Scientific; River Edge, NJ: 2001. [Google Scholar]
- 64.Ashburner M, et al. Gene ontology: tool for the unification of biology. The Gene Ontology Consortium. Nat Genet. 2000;25:25–29. doi: 10.1038/75556. [DOI] [PMC free article] [PubMed] [Google Scholar]
- 65.The Gene Ontology C. The Gene Ontology Resource: 20 years and still GOing strong. Nucleic Acids Res. 2019;47:D330–D338. doi: 10.1093/nar/gky1055. [DOI] [PMC free article] [PubMed] [Google Scholar]
- 66.Yu G, Wang LG, Han Y, He QY. clusterProfiler: an R package for comparing biological themes among gene clusters. OMICS. 2012;16:284–287. doi: 10.1089/omi.2011.0118. [DOI] [PMC free article] [PubMed] [Google Scholar]
- 67.Zhang R, Podtelezhnikov AA, Hogenesch JB, Anafi RC. Discovering Biology in Periodic Data through Phase Set Enrichment Analysis (PSEA) J Biol Rhythms. 2016;31:244–257. doi: 10.1177/0748730416631895. [DOI] [PubMed] [Google Scholar]
- 68.Durinck S, Spellman PT, Birney E, Huber W. Mapping identifiers for the integration of genomic datasets with the R/Bioconductor package biomaRt. Nat Protoc. 2009;4:1184–1191. doi: 10.1038/nprot.2009.97. [DOI] [PMC free article] [PubMed] [Google Scholar]
- 69.Subramanian A, et al. Gene set enrichment analysis: a knowledge-based approach for interpreting genome-wide expression profiles. Proc Natl Acad Sci U S A. 2005;102:15545–15550. doi: 10.1073/pnas.0506580102. [DOI] [PMC free article] [PubMed] [Google Scholar]
- 70.Wickham H. Use R! 2nd. Springer International Publishing : Imprint: Springer; Cham: 2016. 1 online resource (XVI, 260 pages 232 illustrations, 140 illustrations in color. [Google Scholar]
- 71.Gu Z, Eils R, Schlesner M. Complex heatmaps reveal patterns and correlations in multidimensional genomic data. Bioinformatics. 2016;32:2847–2849. doi: 10.1093/bioinformatics/btw313. [DOI] [PubMed] [Google Scholar]
Associated Data
This section collects any data citations, data availability statements, or supplementary materials included in this article.
Supplementary Materials
Quantitative PCR primers
Data Availability Statement
RNA-sequencing data is available from the GEO database (accession number GSE159135).
Figures 1 and 3, and Extended Data Figures 1 and 3, are associated with the statistical analysis available in Supplementary Data 1. In addition, the unprocessed blots of Figure 1g are available as Source Data.
Figures 2, 4, 5, 6a, and Extended Data Figures 4 and 6 are associated with the RNA-seq data (raw and processed data accessible through GEO), and with the statistical analysis available in Supplementary Data 2.
Extended Data Figures 2, 5, and 6c are associated with the complete results presented in Supplementary Data 3.
Extended Data Figure 4d-e are associated with the complete results presented in Supplementary Data 4.
Extended Data Figure 6d is associated with the complete results presented in Supplementary Data 5.
All other data that support the findings of this study are available from the corresponding author upon request.


