Abstract
Group 2 innate lymphoid cells (ILC2) are essential to maintain tissue homeostasis. In cancer, ILC2 can harbor both pro- and anti-tumorigenic functions but we know very little about their underlying mechanisms, nor whether they could be clinically relevant or targeted to improve patient outcomes. Here, we found that high ILC2 infiltration in human melanoma was associated with a good clinical prognosis. ILC2 are critical producers of the cytokine granulocyte-macrophage colony-stimulating factor (GM-CSF) which coordinate the recruitment and activation of eosinophils to enhance anti-tumor responses. Tumor-infiltrating ILC2 expressed programmed cell death protein-1 (PD-1), which limited their intratumoral accumulation, proliferation and anti-tumor effector functions. This inhibition could be overcome in vivo by combining IL-33-driven ILC2 activation with PD-1 blockade to significantly increase anti-tumor responses. Together, our results identified ILC2 as a critical immune cell type involved in melanoma immunity and revealed a potential synergistic approach to harness ILC2 function for anti-tumor immunotherapies.
Introduction
The damaging effects of sun (UV) exposure constitutes a major risk factor for the development of melanoma. Control of melanoma tumor growth and suppression of transplanted tumors is thought to be mediated largely by adaptive immune cells, particularly tissue-resident CD8+CD69+CD103+ TRM 1, 2. This is despite the fact that the skin also contains other immune cell types. These include innate lymphoid cells (ILCs), particularly the group 2 ILCs (ILC2s). These cells are strategically positioned to mediate immune protection against infections and skin cancers such as melanoma3 but remain largely unexplored as a therapeutic target.
Multiple studies have shown that ILC2s accumulate in cancers. These include breast4, gastric5 and pancreatic6 cancers. They produce interleukin (IL)-4 and IL-13 which can promote the expansion of myeloid-derived suppressor cells7 and the establishment of tumors8. ILC2s also secrete amphiregulin which is necessary for tissue repair and to control local inflammation9, but which paradoxically, can promote tissue invasion and metastasis of epidermal growth factor receptor-expressing tumors10. In acute promyelocytic leukemia, prostate and bladder cancers, ILC2s have been similarly shown to orchestrate an immunosuppressive tumor microenvironment which is associated with an extremely poor prognosis7, 11. In contrast, in pancreatic6, lung12, and colorectal13 cancers, ILC2s were associated with increased tumor protection, enhanced anti-tumor immunity and reduced metastatic dissemination.
The role of ILC2s within the melanoma tumor environment remains enigmatic. While some studies have shown that ILC2s accumulate in melanoma tumors following IL-33 treatment and this suppressed tumor growth, decreased lung metastases and improved mouse survival14, 15, others suggest that IL-33-activated ILC2 also inhibit CD8+ T cell and NK cell anti-tumor functions16, 17. In both scenarios, pro- or anti-tumor responses have consistently been associated with increased eosinophil infiltration, mediated in part through ILC2–IL-5-driven recruitment during inflammation18. Like ILC2, eosinophils can drive pleiotropic outcomes depending on the tumor type, but emerging evidence suggests that they may play a key role in promoting anti-tumor responses in melanoma18, 19, 20. Several ILC2-independent mechanisms have been described in this setting19, however, the cellular and molecular mechanisms that underpin ILC2-dependent eosinophil tumor infiltration and anti-tumor functions have not been fully elucidated. Indeed, the emergence of both pro-tumoral and anti-tumoral roles of ILC2 in cancer poses a major contradiction in understanding how ILC2 may be harnessed in immune therapies21.
Here, we show that ILC2-derived GM-CSF could drive eosinophil recruitment to melanoma tumors and enhance anti-tumor immunity. Concurrently, tumor-infiltrating ILC2 expressed PD-1 which dampened ILC2-dependent anti-tumor protection. Administration of IL-33 combined with PD-1 blockade increased ILC2 and eosinophil recruitment and enhanced anti-tumor responses. In human melanomas, gene signature mapping identified a strong correlation between the accumulation of tumor-infiltrating ILC2 and eosinophils and better survival of melanoma patients. Collectively, these data highlight mechanisms driving both pro- and anti-tumorigenic pathways within the ILC2–eosinophil axis necessary for the establishment of melanoma tumors, and identifies how targeting these pathways can be coupled to increase anti-tumor immunity.
Results
Multiple ILC subsets infiltrate melanoma tumors
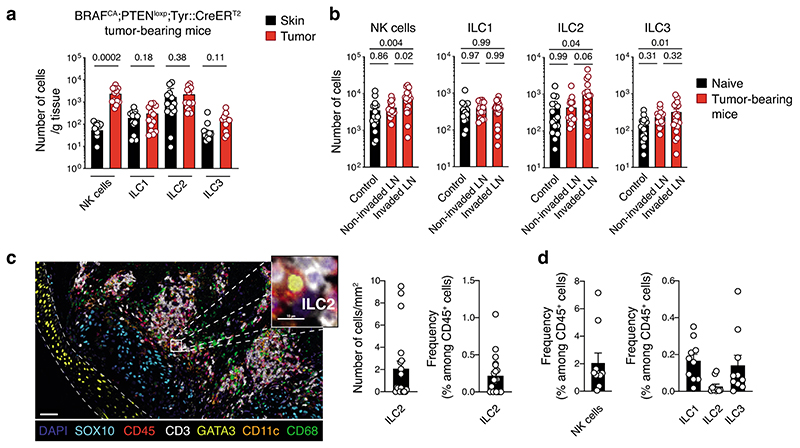
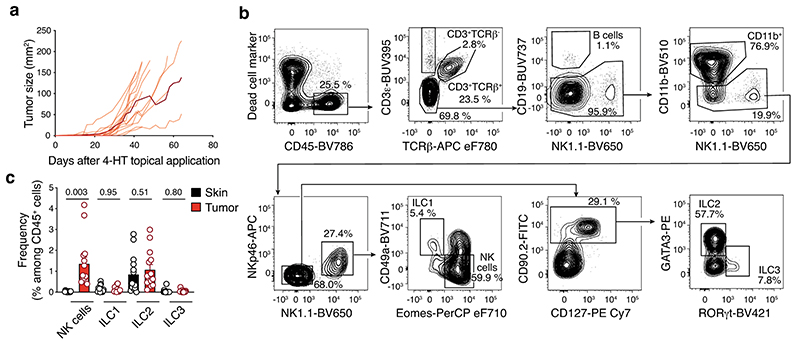
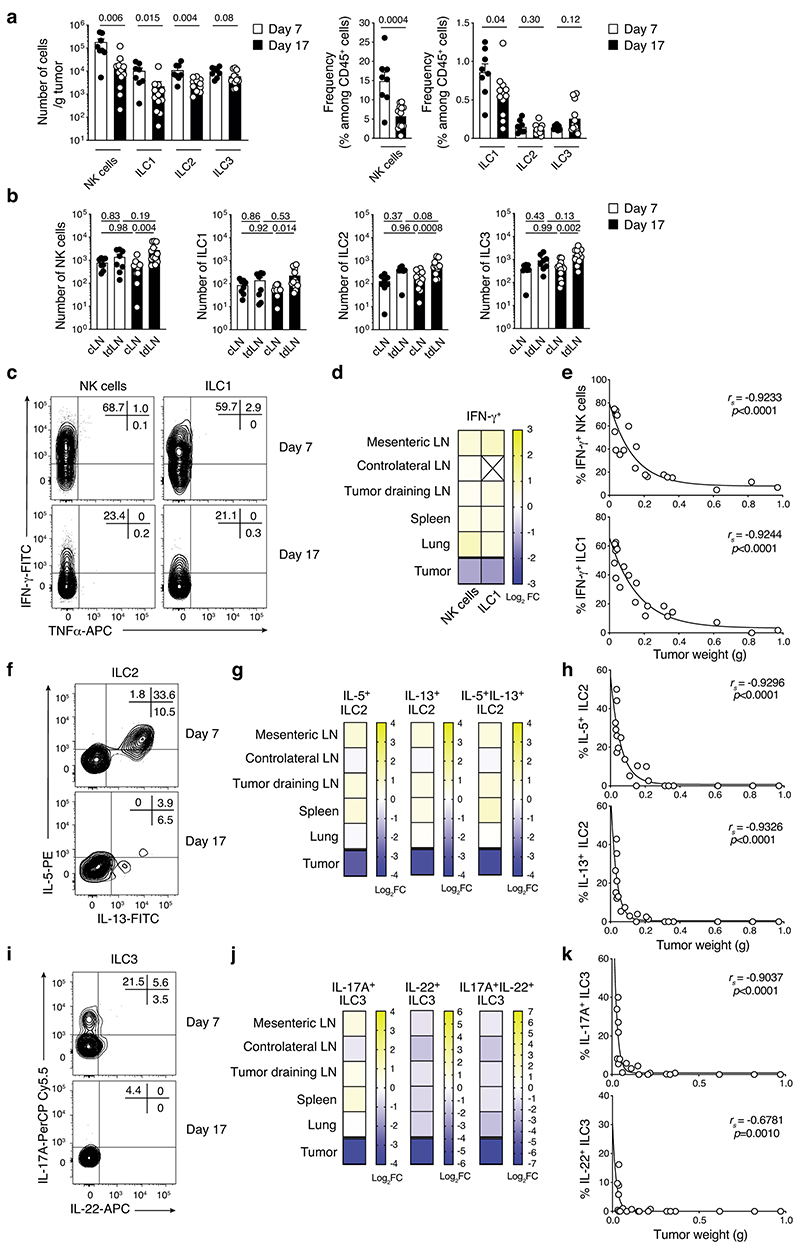
To investigate how ILC affect melanoma formation, we first characterized ILC infiltrating tumors that develop in BRAFCA;PTENloxp;Tyr::CreERT2 mice. In this strain, topical application of 4-hydroxytamoxifen induces primary malignant melanoma formation (Extended Data Fig. 1a), mimicking human disease22. There was an infiltration of NK cells, ILC1, ILC2 and ILC3 within the tumor, and NK cells and ILC2 in the draining lymph nodes (Fig. 1a,b and Extended Data Fig. 1b,c). Together with NK cells, ILC2 represented the most abundant ILC subset in tumors (Fig. 1a and Extended Data Fig. 1c). Next, we analyzed additional melanoma tumor models injected orthotopically into the skin of mice. Similar to the BRAFCA;PTENloxp;Tyr::CreERT2 model, all ILC subsets were found to infiltrate the B16-OVA23 and SM1WT124 tumors 8 and 6 days after tumor cell inoculation, respectively, and accumulated in tumor-draining lymph nodes (Supplementary Fig. 1). While NK cells were the most highly represented ILC subset within these tumors, ~ 1% of the tumor-infiltrating leukocytes were non-NK ILCs (Supplementary Fig. 1). Temporal analyses of Ret melanoma25 development showed that the composition and function of the immune cells changed drastically with reduced tumor-infiltrating NK cells, ILC1, ILC2 and ILC3 (~10-fold, Extended Data Fig. 2a) while ILCs accumulated in tumor-draining lymph nodes (Extended Data Fig. 2b). This decrease in ILCs was accompanied by reduced IFN-γ (Extended Data Fig. 2c-e), IL-5, IL-13 (Extended Data Fig. 2f-h), IL-17A and IL-22-producing cells (Extended Data Fig. 2i-k) at day 17 after Ret tumor cell inoculation compared with non-tumor tissues. This was mediated by the tumor microenvironment itself as ILCs in other organs were unaffected (Extended Data Fig. 2d,g and j). We then investigated ILC infiltration in two exploratory cohorts of human primary and metastatic melanoma to determine whether a similar pattern occurred in human tumors (Supplementary Table 1). Using seven-color multiplex immunochemistry, we identified ILC2 within primary melanoma tumors represented ~0.2% of the CD45+ tumor immune infiltrate (Fig. 1c), confirming that similar to preclinical mouse models, ILC2 infiltrate primary human tumors. Next, we analyzed ten metastatic tumors from stage III/IV melanoma patients (Supplementary Table 1) using mass cytometry (Supplementary Fig. 2). This revealed that ILC1, ILC2, ILC3 and NK cells infiltrated melanoma metastases, and non-NK cell ILCs represented 0.5% of the tumor immune infiltrate (Fig. 1d). Collectively, these results indicate that all ILC subsets infiltrate both murine and human melanoma tumors.
Fig. 1. Innate lymphoid cells infiltrate murine and human melanoma tumors.
a and b, Analyses of skin, tumors and lymph nodes of BRAFCA;PTENloxp;Tyr::CreERT2 mice. a, Number of NK cells, ILC1, ILC2 and ILC3 within skin and tumors. Skin was collected from the flank on the opposite side to tumor induction. Data pooled from 4 independent experiments (n=14 mice; 2-5 mice/experiment). b, Number of NK cells, ILC1, ILC2 and ILC3 from control, non-invaded and tumor-invaded axillary and inguinal lymph nodes (LN). Control axillary and inguinal LN were collected from naïve mice. LN identified as being tumor-invaded were black and hyperplasic; non-invaded LN were white and similar in size to control LN. Data pooled from 4 independent experiments (n=16-19 mice; 2-5 mice/group/experiment). c, Multiplex immunohistochemistry staining of human primary melanoma tumors. Representative multiplex immunohistochemistry staining of primary melanoma tumor with ILC2 infiltration (left, scale bar 50 μm). Inset, magnified tumor infiltrated ILC2 is shown (scale bar, 10 μm). ILC2 were identified as CD45+CD3-GATA3+. Density and frequency of ILC2 in primary melanoma tumors (right). d, Frequency of NK cells, ILC1, ILC2 and ILC3 in ten human melanoma metastatic tumors as identified using the gating strategy provided in Supplementary Fig. 4 by mass cytometry. Patient characteristics relating to c and d are detailed in Supplementary Table 1. a-d, Each circle represents one mouse or human sample and data show the mean ± s.e.m. a and b, Statistical analyses were performed using paired (a) or ANOVA with Tukey’s multiple comparison test (b). p-values are indicated.
ILC2 mediate anti-tumor immune responses
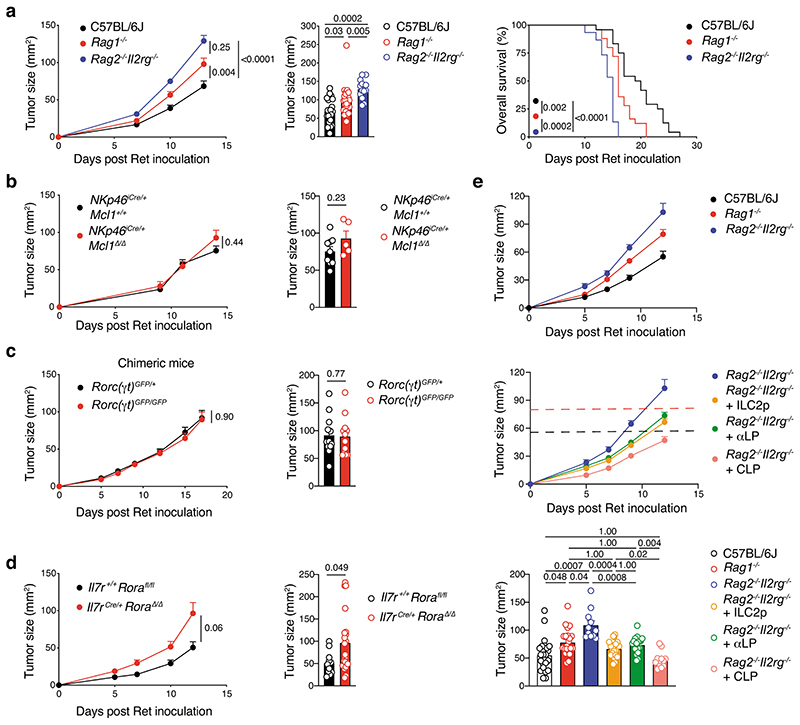
Next, we evaluated the requirement for individual ILC subsets in anti-melanoma immunity. Ret tumor growth and mouse survival in immunocompetent C57BL/6J mice was compared with Rag1–/– mice that lack adaptive T and B lymphocytes, and Rag2–/–Il2rg–/– mice that lack both innate and adaptive lymphoid cells. In Rag1–/– mice, Ret tumors grew quickly reaching a larger size compared with C57BL/6J mice within the first two weeks after inoculation and mice had poorer survival (Fig. 2a), indicating that adaptive lymphocytes play an important role in immunity to melanoma as expected. However, tumors grew even more rapidly in Rag2–/–Il2rg–/– mice and mice succumbed more quickly compared with Rag1–/– mice (16 days vs 21 days) or C57BL/6J mice (27 days) (Fig. 2a). These results suggest that ILCs are also involved in protection against melanoma.
Fig. 2. ILC2-dependent anti-melanoma immunity.
a, C57BL/6J, Rag1–/– and Rag2–/–Il2rg–/– mice were inoculated with Ret tumor cells. Tumor growth curves (a, left panel), tumor size at day 13 post tumor inoculation (a, middle panel) and survival (a, right panel) are shown. Data pooled from 3-4 independent experiments with 4-7 mice/group/experiment (C57BL/6J, n=24 mice; Rag1–/–, n=25 mice; Rag2–/–Il2rg–/–, n=15 mice). b, Tumor growth curves (left panel) and tumor size at day 14 (right panel) in NKp46iCre/+Mcl1+/+ control and NKp46iCre/+Mcl1 Δ/Δ mice inoculated with Ret tumor cells. Data pooled from 2 independent experiments (NKp46iCre/+Mcl1+/+, n = 9; NKp46iCre/+Mcl1Δ/Δ, n = 5; 2-7 mice/genotype/experiment). c, Tumor growth curves (left panel) and tumor size at day 17 (right panel) in Rorc(γt)GFP/+ → Ly5.1+/+ and Rorc(γt)GFP/GFP → Ly5.1+/+ bone marrow chimeric mice inoculated with Ret tumor cells 6-8 weeks after reconstitution of the hematopoietic compartment. Data pooled from 2 independent experiments (Rorc(γt)GFP/+ → Ly5.1+/+, n=12 mice; Rorc(γt)GFP/GFP → Ly5.1+/+, n=12 mice; 6 mice/genotype/experiment). d, Tumor growth curves (left panel) and day 12 tumor size (right panel) in Il7r+/+Rorafl/fl littermate control and Il7rCre/+RoraΔ/Δ mice inoculated with Ret tumor cells. Data pooled from 3 independent experiments (Il7r+/+Rorafl/fl, n = 11; Il7rCre/+RoraΔ/Δ, n = 21; 2-12 mice/genotype/experiment). e, Tumor growth curves (upper panels) and day 12-13 tumor size (lower panel) of Ret tumor cells injected in C57BL/6J, Rag1–/– mice and Rag2–/–Il2rg–/– mice, or Rag2–/–Il2rg–/– recipients reconstituted for 6 to 10 weeks with purified bone marrow-derived ILC2p (2-2.5×10³ cells/mouse), αLP (2-3×10³ cells/mouse) or CLP (5×10³ cells/mouse). Data are pooled from 4 independent experiments (C57BL/6J, n=24 mice; Rag1–/–, n=22 mice; Rag2–/–Il2rg–/–, n=11 mice; Rag2–/–Il2rg–/– + ILC2p, n=20 mice; Rag2–/–Il2rg–/– + αLP, n=18 mice; Rag2–/–Il2rg–/– + CLP, n=12 mice; 2-8 mice/group/experiment). a-e, Each circle represents one mouse and data show the mean+s.e.m. Tumor growth (a-d, left and e, upper), cross-sectional (a-d, right and e, lower), and survival (a, right) statistical analyses were performed using TumGrowth. p-values are indicated.
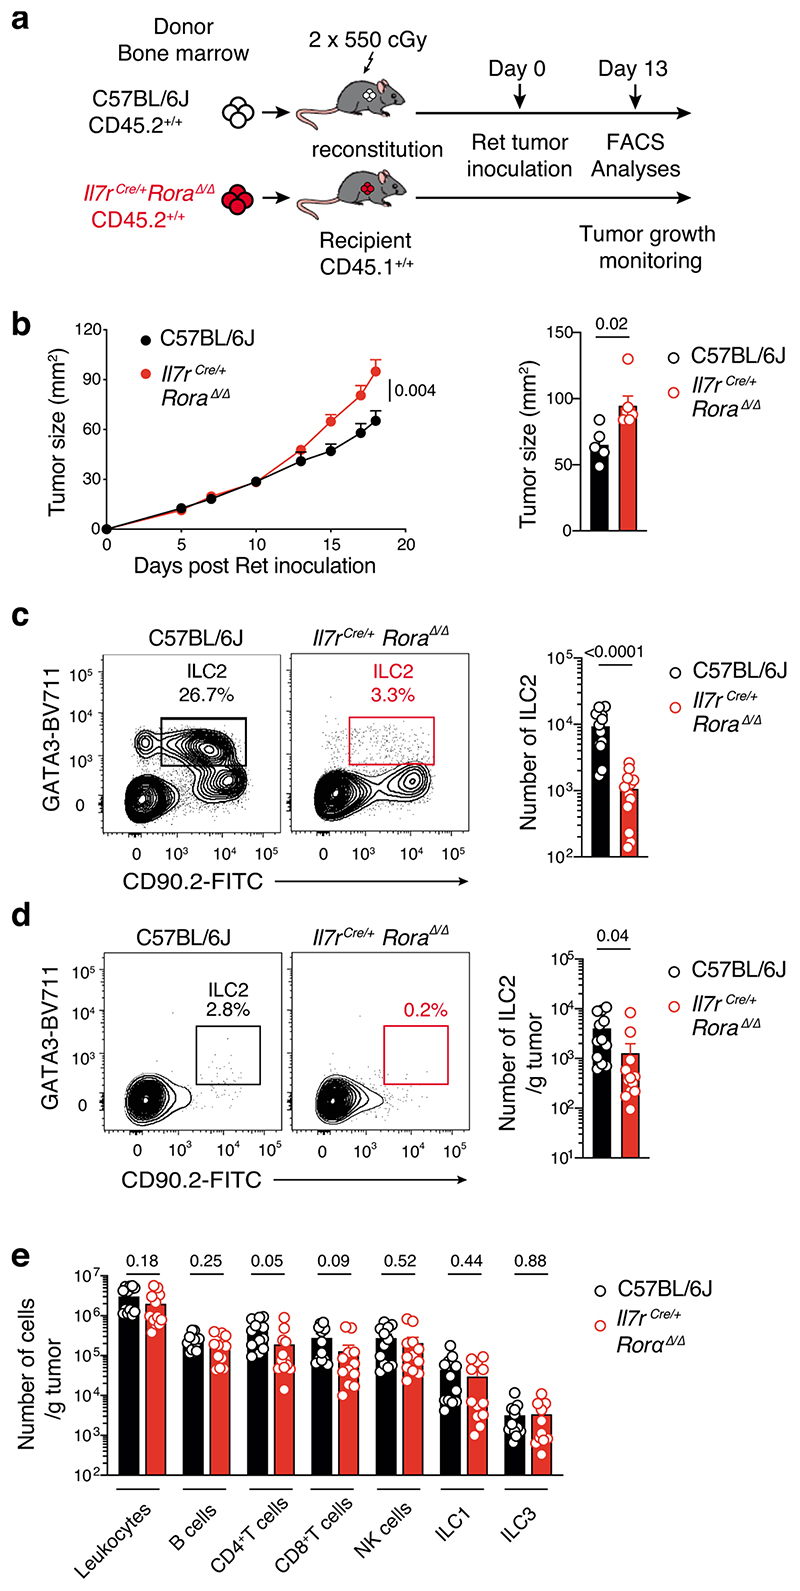
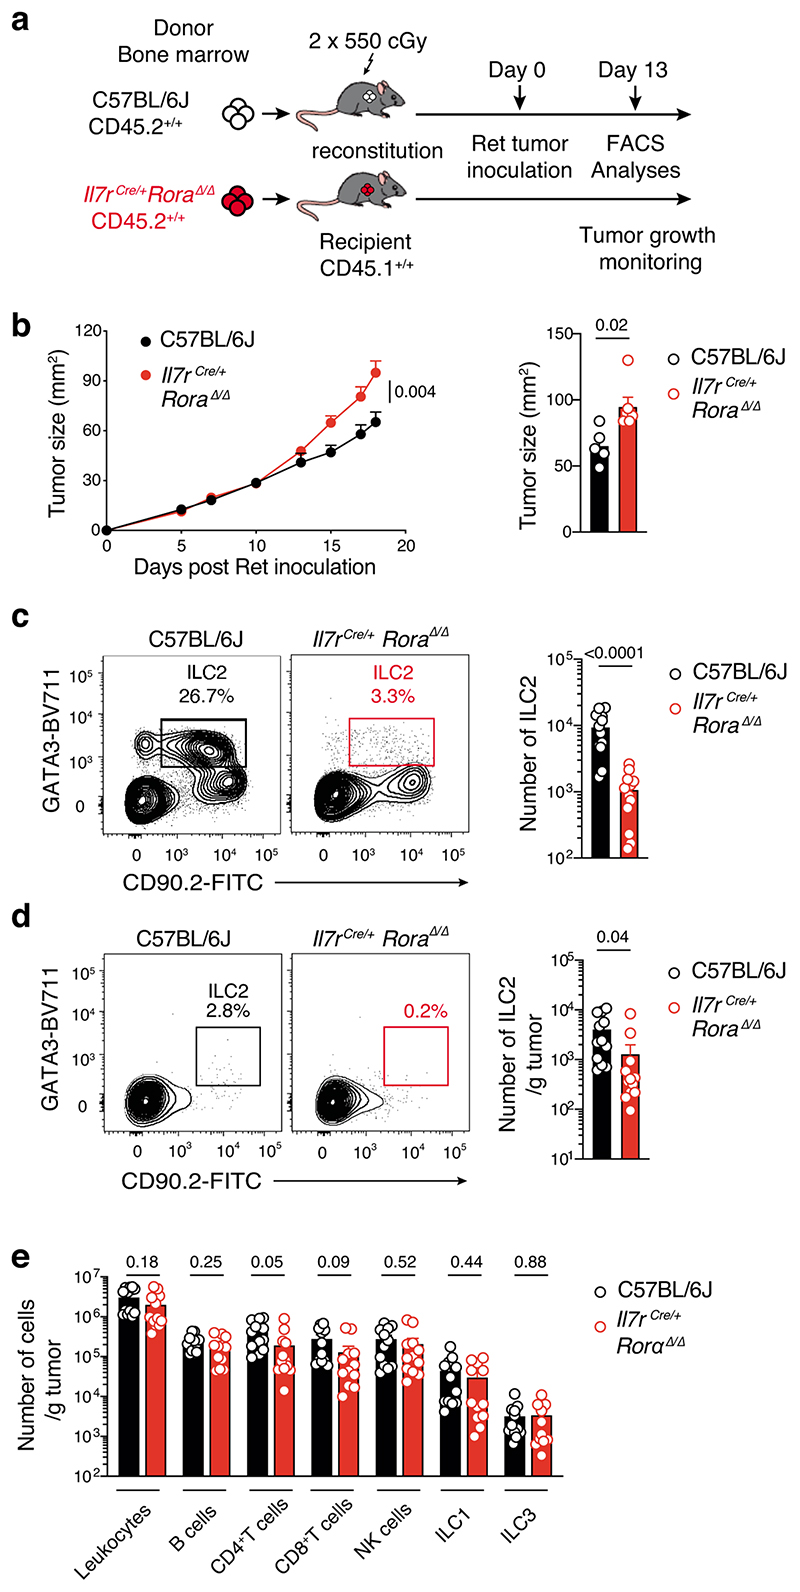
We then investigated whether this protection was driven by a specific ILC subset. To assess the role of NK cells, which have previously shown to be involved in controlling melanoma tumor dissemination26, we inoculated NK cell-deficient mice, NKp46iCre/+Mcl1Δ/Δ, and NKp46iCre/+ control mice26 with Ret tumor cells (Fig. 2b). This showed that loss of NKp46-expressing cells (Supplementary Fig. 3) did not affect either the rate, or final size of tumor growth (Fig. 2b). Similarly, loss of ILC3 in lethally-irradiated Ly5.1+ mice reconstituted with Rorc(γt)GFP/GFP (Ly5.2+)27 showed no differences in tumor growth or tumor size compared with Rorc(γt)GFP/+control chimeras (Fig. 2c). Thus, NK cells, ILC1 and ILC3 do not appear to play a significant role in the response to primary melanoma establishment. Thus, we focused on ILC2 and used two complementary mouse models that constitutively or inducibly lacked ILC2 to investigate their role in melanoma development. Rorafl/fl mice were crossed to Il7rCre/+ mice to inactivate the Rora gene in IL-7R-expressing cells which includes ILC2. Inoculation of Il7rCre/+Rora Δ/Δ mice with Ret tumor cells resulted in an increase in tumor growth compared with control Il7r+/+Rorafl/fl littermates (Fig. 2d) supporting a key role of ILC2 in anti-tumor protection. We confirmed this observation using lethally-irradiated Il7rCre/+Rora Δ/Δ→Ly5.1+/+ or C57BL/6J→Ly5.1+/+ chimeric mice (Extended Data Fig. 3a,b). As expected intestinal ILC2 were strongly reduced in Il7rCre/+Rora Δ/Δ-reconstituted mice (Extended Data Fig. 3c). Immunophenotyping of tumors at day 13 revealed a decrease of tumor-infiltrating ILC2 (Extended Data Fig. 3d) and a trend towards reduced tumor-infiltrating CD4+ and CD8+T cells (Extended Data Fig. 3e). We next took advantage of the Cd4Cre/+Icosfl-Dtr/+ mice in which ILC2 develop normally but can be selectively ablated in vivo using diphtheria toxin (DTx) leaving the T cell compartment intact. To enhance de facto ILC2 ablation, we treated mice with recombinant murine IL-33 which increases ICOS expression in ILC2 and deletion efficiency (Extended Data Fig. 4a). In this setting, IL-33-treated mice had reduced tumor growth and tumor weight and increased ILC2 tumor infiltration but this did not correlate with T cell changes (Extended Data Fig. 4b-e). In contrast, DTx-depletion of ILC2 abrogated the anti-tumor effect (Extended Data Fig. 4b,c). Thus, removal ILC2 alone appear to have an important impact on melanoma protection.
To determine whether the anti-tumor responses mediated by ILC2 were independent of other lymphoid cell subsets, purified bone marrow-derived ILC2 progenitors (ILC2p), α-lymphoid progenitors (αLP) and common lymphoid progenitors (CLP) from congenic mice were adoptively transferred into Rag2–/–Il2rg–/– recipients to allow them to replenish the lymphoid compartment28 (Supplementary Fig. 4). Immune cell reconstitution was analyzed at 8 to 10 weeks after transfer (Supplementary Fig. 5). CLP transfer allowed Rag2–/–Il2rg–/– (CD45.2+) recipients reconstituted intestinal T and B cells and all ILC populations (CD45.1+ cells) (Supplementary Fig. 5). αLP gave rise to all ILC subsets but not T or B cells while ILC2p only generated ILC2 (Supplementary Fig. 5)28. Consistent with our earlier results (Fig. 2a), ILCs conferred partial anti-tumor protection (Fig. 2e and Supplementary Table 2). As expected, CLP transfer in Rag2–/–Il2rg–/– mice regenerated both adaptive and innate cells and fully restored anti-tumor protection similar to C57BL/6J control mice (Fig. 2e and Supplementary Table 2). The transfer of αLP into Rag2–/–Il2rg–/– mice restored anti-tumor immunity to the level seen in Rag1–/– mice (Fig. 2e and Supplementary Table 2). However, Rag2–/–Il2rg–/– mice reconstituted with ILC2 progenitors alone exhibited anti-tumor protection. This was similar to the level of protection conferred in Rag2–/–Il2rg–/– mice reconstituted with αLP to regenerate all ILC subsets, and Rag1–/– mice (Fig. 2e and Supplementary Table 2), indicating that ILC2 mediate anti-tumor immunity even in absence of other innate or adaptive lymphoid cells.
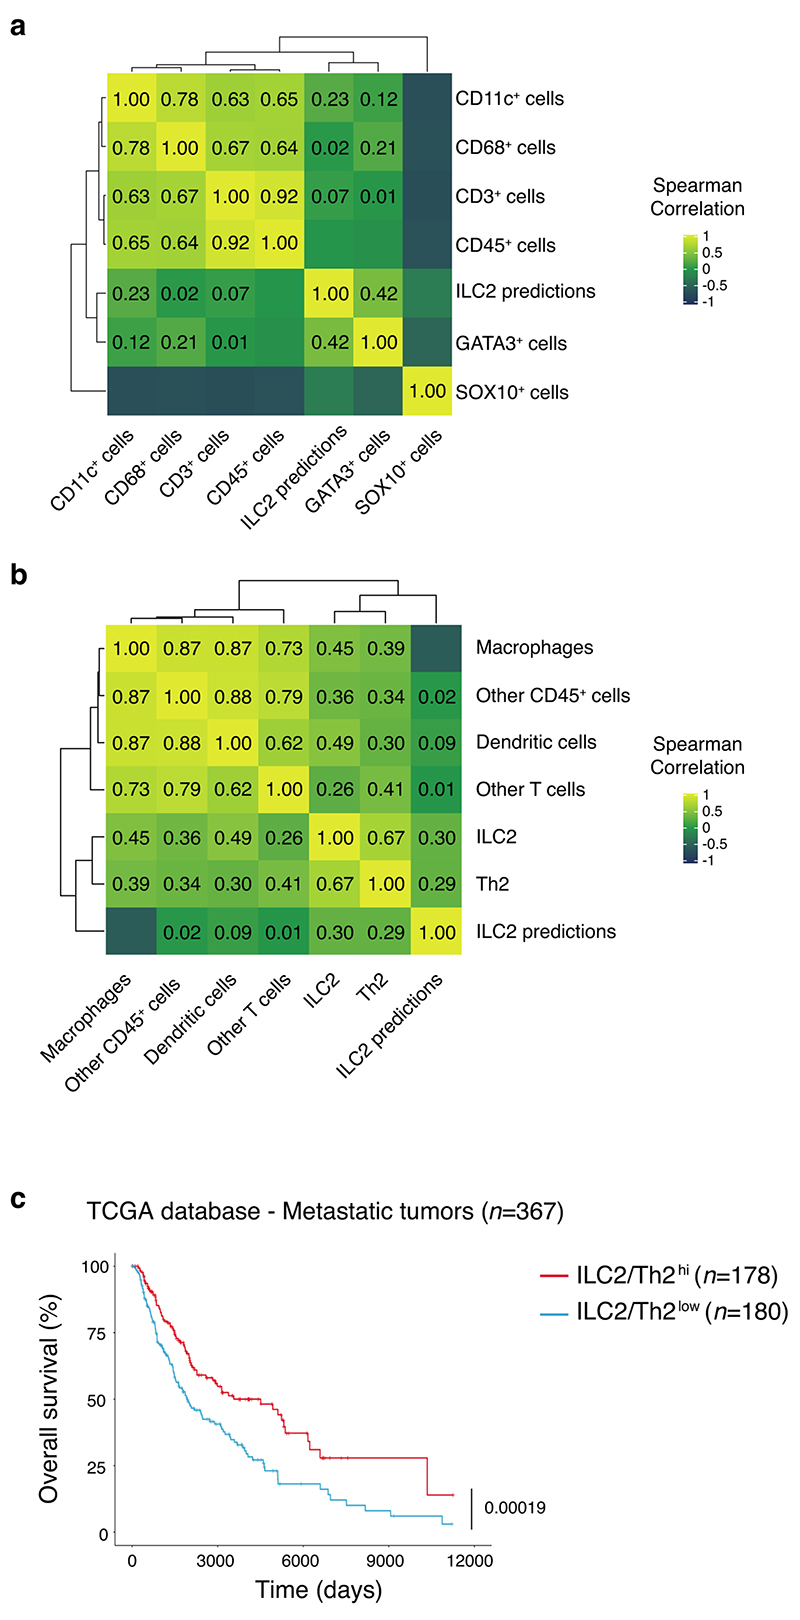
We then performed genomic analyses of human metastatic melanoma samples from the TCGA database to understand how ILC2 tumor infiltration might predict clinical outcomes. By applying machine learning approaches, we defined an ILC2 gene signature (Supplementary Table 3). This signature was first validated using NanoString gene expression profiling in 18 primary tumor samples for which we performed multiplex IHC analyses (Fig. 1c) and quantified ILC2 tumor infiltration (Extended Data Fig. 5a,b). We found that the signature positively correlated with GATA3 expression together with ILC2 and Th2 cells (Extended Data Fig. 5b) while no correlation was found with other markers or other immune cell subsets (Extended Data Fig. 5a,b). Thus, this classifier accurately identifies enrichment of type 2 immune cells in the microenvironment. Applying the classifier to the TCGA database, we found that tumors enriched in type 2 immune cells were associated with a marked increase in overall survival of metastatic melanoma patients (Extended Data Fig. 5c).
Collectively, these findings show that ILC2 mediate effective anti-tumor responses in melanoma and tumor enrichment in type 2 immune cells is associated with favorable outcomes in melanoma patients.
ILC2-driven GM-CSF controls melanoma tumor progression
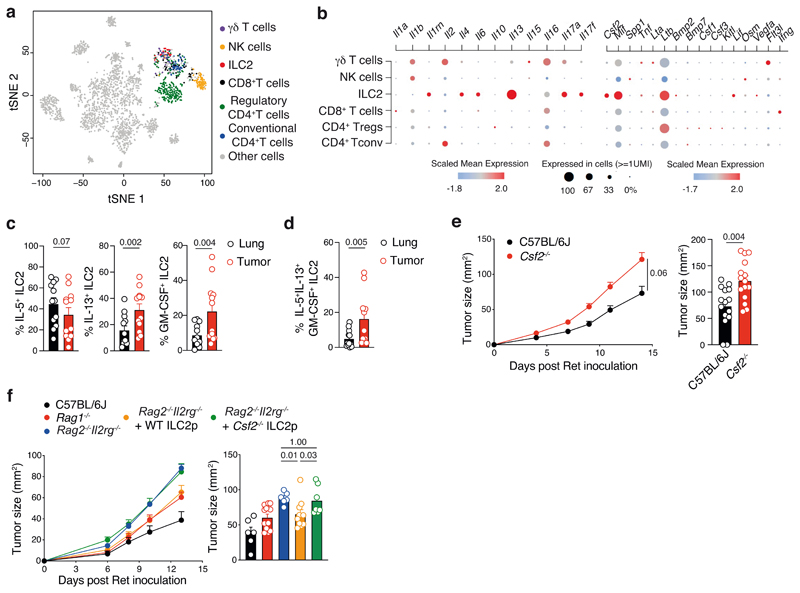
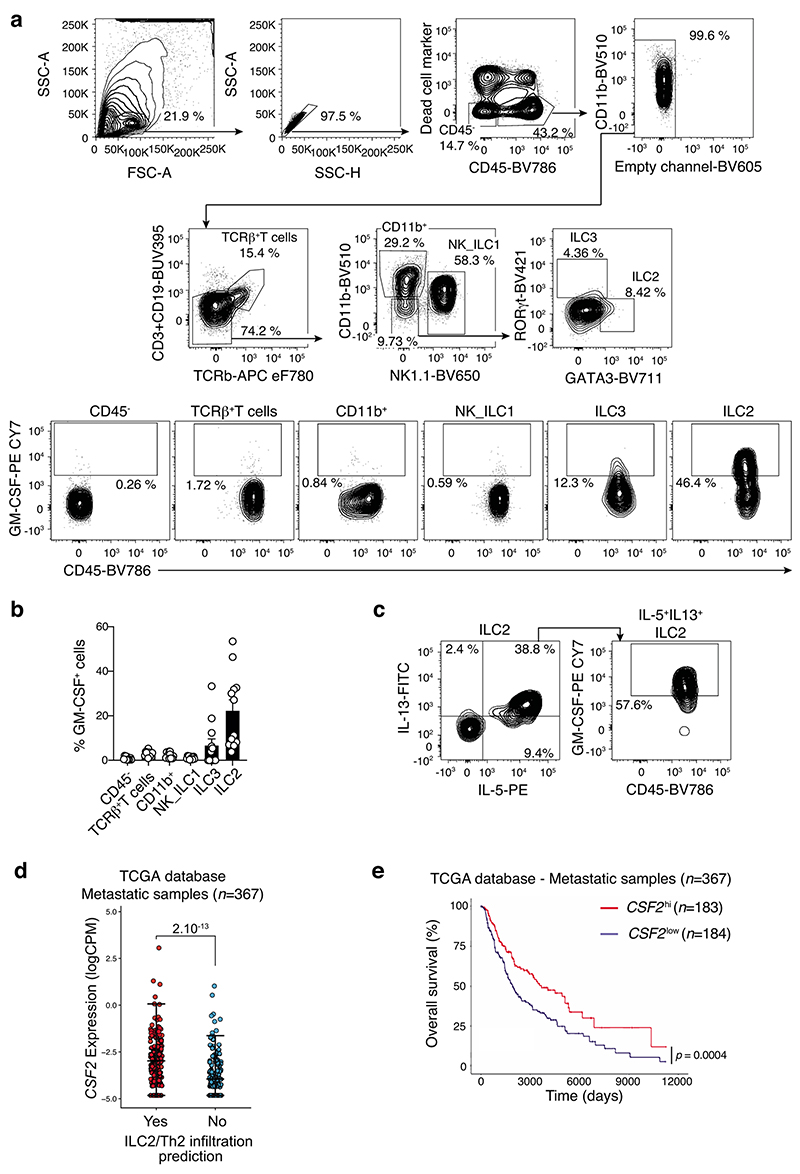
To gain insight to the mechanism by which ILC2 shape the anti-tumor immune response, we performed single-cell RNA sequencing analyses of tumor-infiltrating leukocytes (CD45+) isolated from BRAFCA;PTENloxp;Tyr::CreERT2 mice. Tumor-infiltrating immune cells were mapped using SingleR29 using the Immgen reference database (Fig. 3a). We identified innate, innate-like and adaptive lymphoid populations composed of ILC2, NK cells, γδ T cells, CD8+ T cells, conventional CD4+ T cells and Tregs (Fig. 3a and Extended Data Fig. 1c). Immune cell subset identity was confirmed by mapping the gene expression pattern of key markers and transcription factors for T cells (Cd3d, Cd247, Cd3e, Cd3g, Cd8, Cd4, Foxp3, Rorc) and ILCs (Ncr1, Id2, Irf8, Gata3, Rora) (Supplementary Fig. 6) validating the automated immune cell classification and population identification through SingleR29. This revealed that in addition to the well-characterized ILC2-related genes such as Il4, Il6 and Il13, approximately 30% of tumor-infiltrating ILC2 also expressed Csf2, which encodes granulocyte macrophage-colony stimulating factor (GM-CSF) (Fig. 3b). Using intracellular cytokine staining of lung and tumors isolated from SM1WT1-, B16-OVA- and Ret-tumor bearing C57BL/6J mice, we found that ILC2, but neither T cells nor NK cells, expressed GM-CSF (Extended Data Fig. 6 and Supplementary Fig. 7). This is despite both cell types being previously reported as key producers of GM-CSF in autoimmune inflammatory diseases30, 31. Neither other immune cell subsets nor non-hematopoietic (CD45-) cells expressed significant GM-CSF (Extended Data Fig. 6b and Supplementary Fig. 7b,f). The frequency of IL-5-producing ILC2 in tumors and lungs were similar (Fig 3c, Extended Data Fig. 6c and Supplementary Fig. 7e-h). However, ILC2 in tumors expressed higher levels of IL-13 and GM-CSF than lung-resident ILC2 (Fig. 3c, Extended Data Fig. 6c and Supplementary Fig. 7d,h) with 5-20% of cells expressing all three cytokines (Fig. 3c and Supplementary Fig. 7d,h). Inoculation of GM-CSF-deficient (Csf2–/–) and C57BL/6J control mice with Ret tumor cells showed that loss of GM-CSF resulted in increased tumor growth rate and tumor size (Fig. 3e) demonstrating the requirement for GM-CSF in controlling melanoma development. To ascertain the contribution of GM-CSF production by ILC2 in anti-tumor responses, we reconstituted Rag2–/–Il2rg–/– mice with wildtype (WT) or GM-CSF (Csf2–/–)-deficient bone marrow ILC2p (Fig. 3f). At eight weeks these mice were inoculated with Ret tumor cells and tumors monitored (Fig. 3f). As we previous (Fig. 2e), anti-tumor protection was restored in Rag2–/–Il2rg–/– mice reconstituted with wildtype, but not GM-CSF-deficient, ILC2 (Fig. 3f), indicating that ILC2-derived GM-CSF is critical to anti-melanoma immunity. Using the TCGA database, we found that metastatic tumors that expressed an imprint of type 2 immune cell infiltration also had elevated CSF2 expression compared with poorly enriched tumors (Extended Data Fig. 6d). Furthermore, high intratumoral CSF2 expression was associated with increased overall survival (Extended Data Fig. 6e). Collectively, these data identify that, in addition to IL-5 and IL-13, tumor-infiltrating ILC2 produce high levels of GM-CSF within the tumor microenvironment and ILC2-derived GMCSF is essential for anti-melanoma responses.
Fig. 3. GM-CSF-expressing ILC2 mediate anti-melanoma responses.
a and b, Single cell RNA sequencing of 2,261 tumor-infiltrating leukocytes from BRAFCA;PTENloxp;Tyr::CreERT2 tumors collected 48 days after treatment with tamoxifen. a, t-Distributed stochastic neighbor embedding (t-SNE) plots showing immune cell subsets colored by population. b, Selected differentially expressed genes coding cytokines and soluble factors (y-axis) grouped according to T cell and ILC subsets (x-axis) as in a. Dot size represents the fraction, color indicates z-scaled gene expression, of cells within the population that express each gene. c and d, Frequency of ILC2-producing IL-5 (c, left), IL-13 (c, middle) and GM-CSF (c, right) and polyfunctional GM-CSF+IL-5+IL-13+ ILC2 (d) isolated from lung and Ret tumors of C57BL/6J mice at day 7 post-tumor inoculation. ILC2 were identified as CD45+CD3-TCRβ-NK1.1-CD11b-RORγt-GATA3+. Single cell suspensions of stimulated lung- and tumor-digested samples were stained intracellularly for IL-5, IL-13 and GM-CSF. Data are pooled from 2 independent experiments (n=6 mice/group/experiment). e and f, Ret tumor growth in e, C57BL/6J and Csf2–/– (GM-CSF–/–) mice and f, C57BL/6J, Rag1–/– mice and Rag2–/–Il2rg–/– mice, or Rag2–/–Il2rg–/– recipients reconstituted for 8 weeks with purified bone marrow-derived ILC2p (2.5×10³ cells/mouse) isolated from GM-CSF deficient (Csf2–/–) and wildtype (WT) control mice. Data are pooled from e, 3 independent experiments (C57BL/6J, n=16 mice and Csf2–/–, n=17 mice; 4-7 mice/genotype/experiment); f, 2 independent experiments (C57BL/6J, n=6 mice; Rag1–/–, n=12 mice; Rag2–/–Il2rg–/–, n=6 mice; Rag2–/–Il2rg–/– + WT ILC2p, n=10 mice; Rag2–/–Il2rg–/– + Csf2–/– ILC2p, n=7 mice; 2-6 mice/group/experiment) with the exception of C57BL/6J control mice which represents 1 experiment. Statistical analyses were performed by using TumGrowth. c-f, Each dot shows one mouse and data show the mean ± s.e.m. c, d and g, Statistical analyses were performed using paired Student’s t test (c and d) or unpaired Student’s t test (g). p-values are indicated.
ILC2 GM-CSF drives eosinophils and tumor cytotoxicity
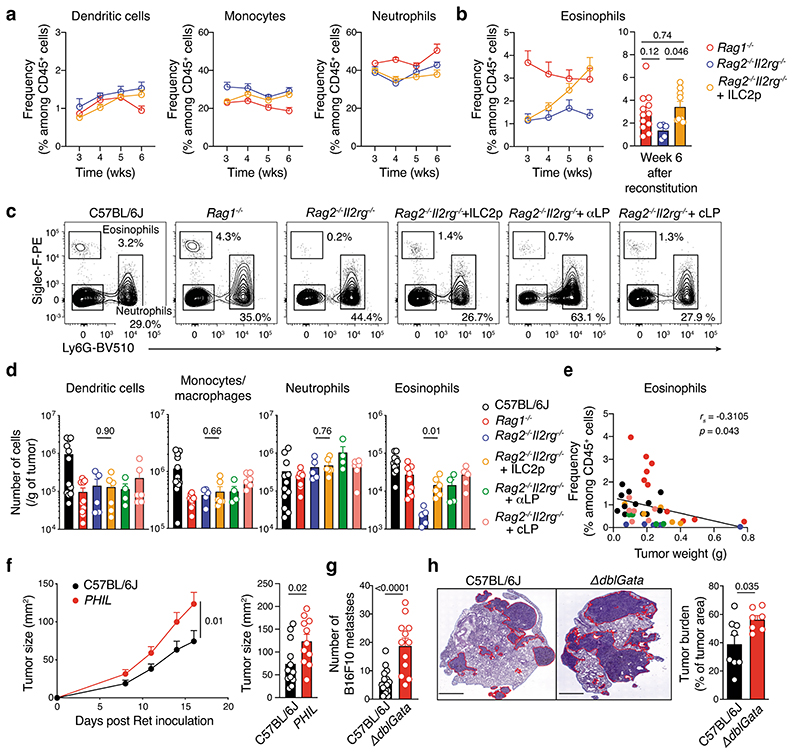
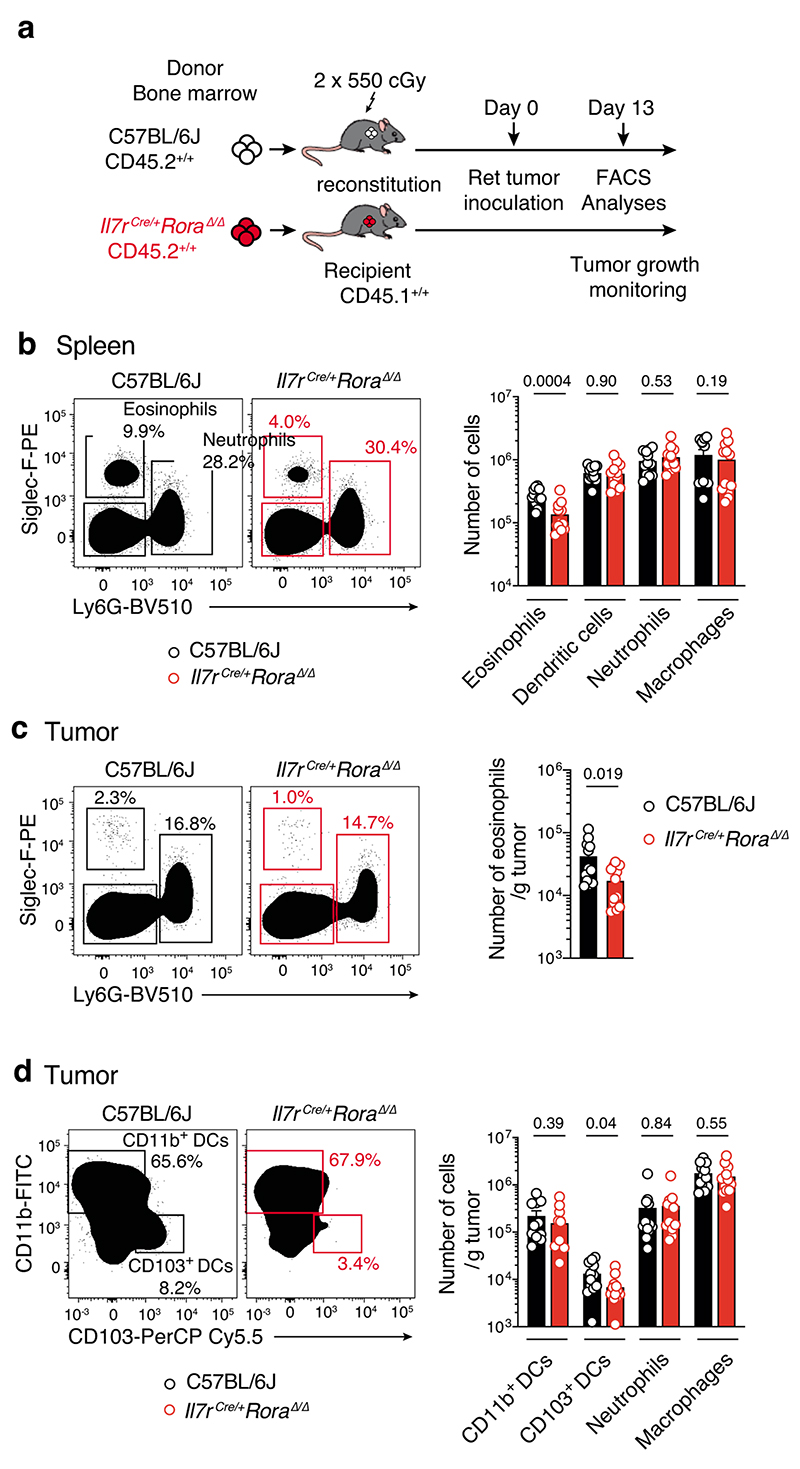
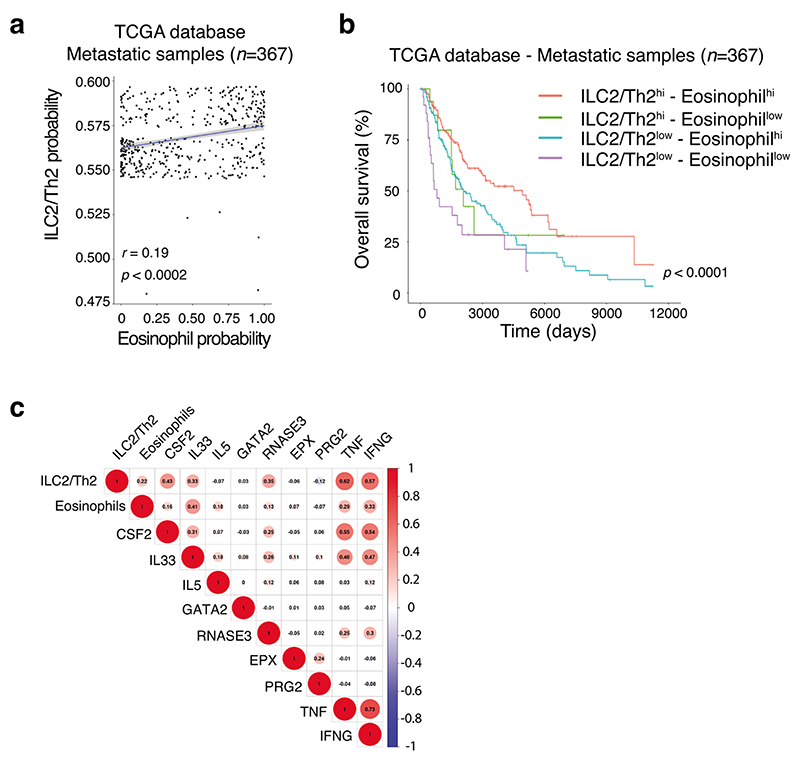
Given our earlier findings that tumor-infiltrating ILC2 abundantly produced both IL-5 and GM-CSF (Fig. 3c,d, Extended Data Fig. 6 and Supplementary Fig. 7), and that ILC2 were sufficient to provide an early brake on tumor growth in the absence of other ILC subsets or T or B cells (Fig. 2e and Fig. 3f), we hypothesized that ILC2 might regulate melanoma progression by influencing the recruitment and/or the anti-tumor function of myeloid cells. Analysis of circulating dendritic cells (DCs), monocytes and neutrophils in naive Rag1–/–, Rag2–/–Il2rg–/– mice and Rag2–/–Il2rg–/– mice reconstituted with ILC2p showed no major differences in the prevalence of myeloid populations (Fig. 4a). In contrast, circulating eosinophils progressively increased in ILC2-reconstituted Rag2–/–Il2rg–/– mice compared with non-reconstituted Rag2–/–Il2rg–/– mice, and reached levels similar to Rag1–/– mice 6 weeks after reconstitution (Fig. 4b). Next we inoculated Rag1–/–, Rag2–/–Il2rg–/– and Rag2–/– Il2rg–/– mice reconstituted with ILC2p, αLP or CLP with Ret tumor cells and enumerated tumor-infiltrating myeloid cell subsets (Fig. 4c,d). This revealed that in ILC2p, αLP- or CLP-reconstituted Rag2–/–Il2rg–/– mice which all restore ILC2 (Supplementary Fig. 5), intratumoral eosinophil infiltration was replenished to the levels seen in C57BL/6J and Rag1–/– mice (Fig. 4d). In addition, the frequency of tumor-infiltrating eosinophils was inversely correlated with the Ret tumor weight (Fig. 4e) suggesting that the ILC2-eosinophil axis may be responsible for melanoma control. In contrast, tumor-bearing Il7rCre/+Rora Δ/Δ (CD45.2+/+) bone marrow chimeric mice showed a significant reduction in splenic and tumor-infiltrating eosinophils (Extended Data Fig. 7a-d) together with increased tumor growth rate and size (Extended Data Fig. 3b). The number of splenic DCs, neutrophils, macrophages and other myeloid lineages were unaltered (Extended Data Fig. 7b), while tumor-infiltrating CD103+ DCs were reduced in Il7rCre/+Rora Δ/Δ chimeric mice (Extended Data Fig. 7d). Thus, to ascertain the requirement for eosinophils, eosinophil-deficient mice (Tg(Epo-DTA)#Nal, known as PHIL mice) were inoculated with Ret tumor cells. Similar to the loss of ILC2, eosinophil-deficiency (Supplementary Fig. 8) led to increased tumor growth rate and size (Fig. 4f) compared with wild-type C57BL/6J mice. Similar results were observed in an experimental lung metastasis model in eosinophil-deficient (ΔdblGATA) mice that displayed increased lung B16-F10 metastases (Fig. 4g) and tumor burden (Fig. 4h) compared with wild-type C57BL/6J control mice highlighting that eosinophils have anti-tumorigenic activities against primary and metastatic melanoma tumors. Consistent with our pre-clinical findings, in metastatic melanoma samples, we observed a highly significant correlation between tumors enriched in type 2 immune cells and eosinophil infiltration (Extended Data Fig. 8a) and this pattern was associated with a marked improvement in patient overall survival (Extended Data Fig. 8b).
Fig. 4. ILC2-driven eosinophil recruitment control melanoma anti-tumor immunity.
a and b, Frequency of circulating dendritic cells, monocytes and neutrophils (a), and eosinophils (b) in Rag1–/– (n=12), Rag2–/–Il2rg–/– (n=5) and Rag2–/–Il2rg–/– (n=9) mice reconstituted with ILC2 progenitors and analyzed at 3, 4, 5 and 6 wks after transfer. Data pooled from 2 independent experiments (2-6 mice/group/experiment). c to e, Eosinophil infiltration of tumors in ILC2p-reconstituted Rag2–/–Il2rg–/–. c, Flow cytometric plots of tumor-infiltrating eosinophils and neutrophils in C57BL/6J, Rag1–/–, Rag2–/–Il2rg–/– and progenitor-reconstituted Rag2–/–Il2rg–/– mice 12-13 days after Ret tumor cell inoculation. d, Enumeration of tumor-infiltrating immune cells from C57BL/6J (n=12), Rag1–/– (n=10), Rag2–/–Il2rg–/– (n=5), Rag2–/–Il2rg–/–+ILC2p (n=6), Rag2–/–Il2rg–/–+αLP (n=4), and Rag2–/– Il2rg–/–+cLP (n=6) mice as in c. e, Eosinophil frequency relative to melanoma tumor weight (g). Individual mice are colored by experimental group; linear regression curve is overlaid. Correlation assessed using non-parametric Spearman’s correlation test. Data show representative plots (c) or are pooled from 2 independent experiments (n=2-6 mice/group/experiment) (d and e). f, Cumulative tumor growth (left panel) and tumor size (day 16, right panel) in C57BL/6J and PHIL mice inoculated with Ret tumor cells. Data pooled from 3 independent experiments (C57BL/6J, n=14 mice;PHIL, n=12 mice; 2-8 mice/genotype/experiment). Statistical analyses were performed by using TumGrowth. g, Quantitation and h, hematoxylin and eosin staining of B16-F10 melanoma lung metastasis (day 16) and lung tumor burden (right panel) in wild-type and eosinophil-deficient ΔdblGata mice. Data pooled from 2 independent experiments (g, C57BL/6J, n= 16 mice; ΔdblGata, n=12 mice; h, C57BL/6J, n= 8 mice; ΔdblGata, n=7 mice) and show the mean ± s.e.m. b and d-i, Each dot represents one mouse (b, d-h). Statistical analyses were performed using ANOVA followed by Tukey’s multiple comparison test (b), unpaired Student’s t tests (Rag2–/–Il2rg–/– versus Rag2–/–Il2rg–/–+ILC2p) (d), or unpaired Student’s t tests (g and h). p-values are indicated. Data are shown as the mean ± s.e.m.
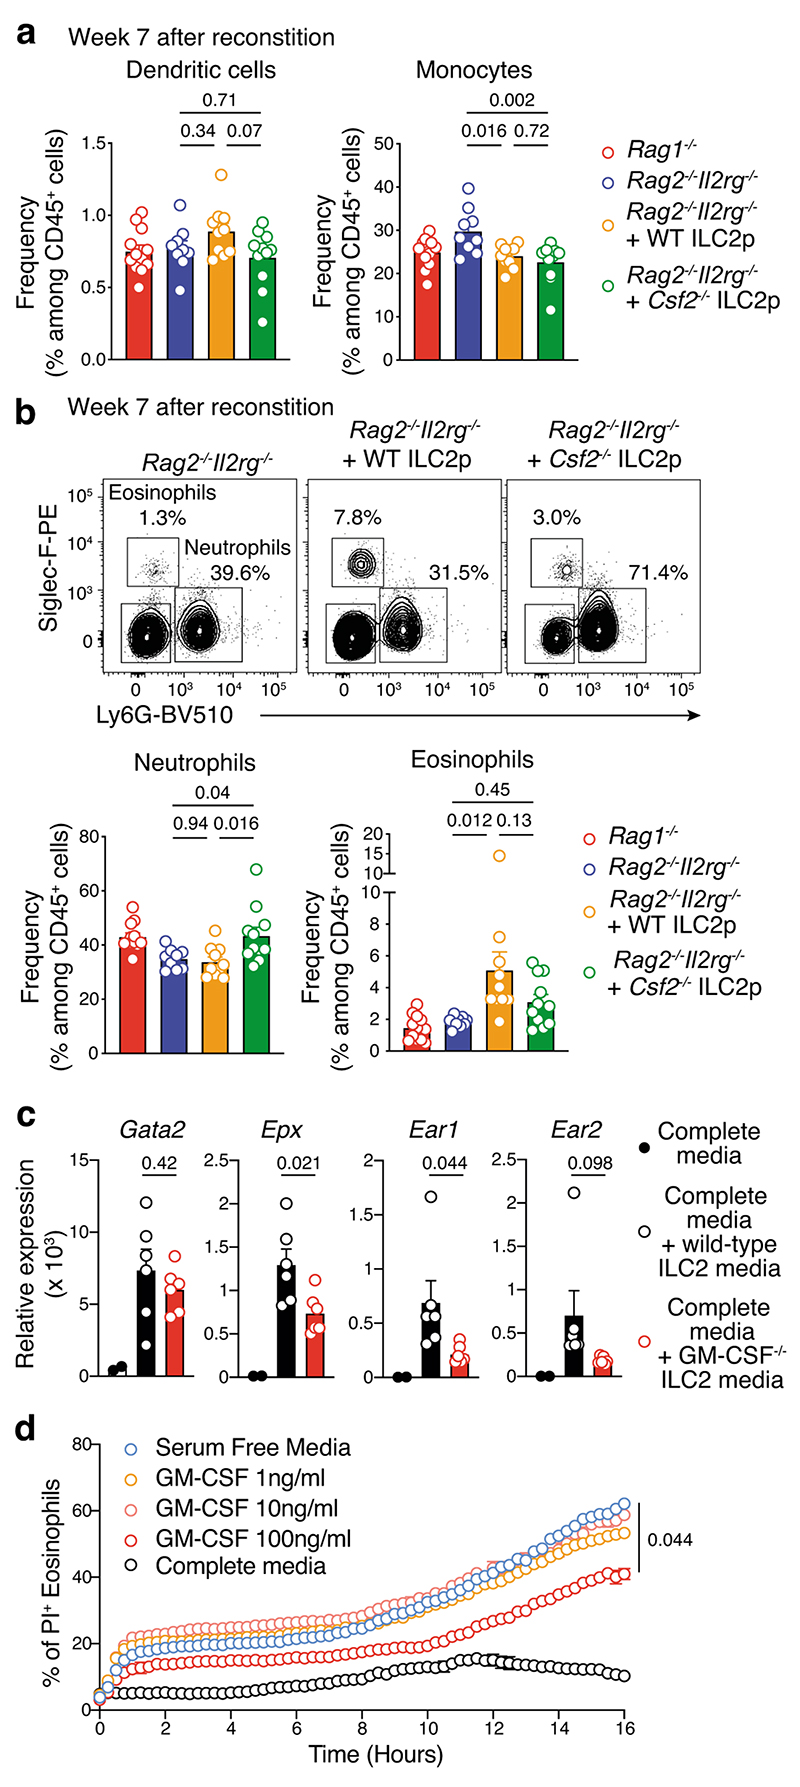
We next analysed the frequency of circulating myeloid cells in unchallenged Rag1–/–, Rag2–/–Il2rg–/– mice and Rag2–/–Il2rg–/– mice reconstituted with wildtype or GM-CSF deficient ILC2p 7 weeks after progenitor transfer (Fig. 5a,b). Consistent with our earlier results (Fig. 4a), Rag2–/–Il2rg–/– mice reconstituted with WT ILC2 have increased circulating eosinophils while no major changes were observed for other myeloid subsets (Fig. 5a,b). In contrast, in Csf2–/– ILC2-reconstituted Rag2–/–Il2rg–/– mice, an augmentation of neutrophils was seen, but no significant increase in circulating eosinophils was observed compared with Rag2–/–Il2rg–/– control mice (Fig. 5b). We then performed in vitro analyses to determine if ILC2-derived GM-CSF expression influenced eosinophil cytotoxic functions (Supplementary Fig. 9a). Intestinal ILC2 purified from wild-type and Csf2–/– mice were stimulated with IL-33 for 2 days to induce IL-5 and GM-CSF secretion allowing us to generate ILC2-conditioned media (Supplementary Fig. 9a-c). After 2 days, wild-type splenic eosinophils were cultured in complete media, or complete media plus wild-type or Csf2–/– ILC2-conditioned media (1:1 ratio). One day later, eosinophils were harvested and analyzed by qPCR (Fig. 5c and Supplementary Fig. 9a). Gata2 (a master eosinophil transcription factor), Epx, Ear1 and Ear2 (encoding proteins involved in eosinophil cytotoxicity) were all increased in eosinophils in the presence of ILC2-conditioned media in the culture (Fig. 5c). However, the enhanced Epx, Ear1 and Ear2 expression was dependent on GM-CSF in the media (Fig. 5c). In addition, we found that GM-CSF enhanced the survival of eosinophils in vitro (Fig. 5d). Collectively, these results indicate that ILC2-derived GM-CSF is necessary for eosinophil homeostasis and augments eosinophil activation and survival. Extending these initial findings, we found that metastatic lesions associated with improved clinical outcomes (Extended Data Fig. 8b) exhibited a molecular signature characterized by increased CSF2, IL33, RNASE3 (ortholog of Ear1 and Ear2), TNF and IFNG gene expression (Extended Data Fig. 8c) indicative of a pro-inflammatory/cytotoxic immune response associated with type 2 immune cells and eosinophil tumor infiltration. Thus, mapping these innate immune cell profiles in tumors provides a rationale to improve clinical prognosis of melanoma patients.
Fig. 5. ILC2-derived GM-CSF control eosinophil homeostasis, survival and effector functions.
a, Frequency of dendritic cells (DC, CD45+CD3ε-CD19-CD11b+CD11chiMHC class IIhi) and monocytes (CD45+CD3ε-CD19-CD11b+Siglec-F-Ly6G-Ly6ChiCD64+/-). b, Flow cytometric contour plots (upper panels)_and frequency (lower panels) of neutrophils (CD45+CD3ε-CD19-CD11b+Siglec-F-Ly6G+) and eosinophils (CD45+CD3ε-CD19-CD11b+ Ly6G -SiglecF+) from Rag1–/–, Rag2–/–Il2rg–/– and Rag2–/–Il2rg–/– mice reconstituted with ILC2 progenitors (ILC2p, 2.5×10³ cells/mouse) from GM-CSF deficient (Csf2–/–) and wildtype (WT) control mice analyzed 7 weeks after transfer of ILC2p. Data pooled from 2 independent experiments (Rag1–/–, n=12 mice; Rag2–/–Il2rg–/–, n=9 mice; Rag2–/– γc–/– + WT ILC2p, n=10 mice; Rag2–/– Il2rg–/– + Csf2–/– ILC2p, n=11 mice; 4-6 mice/group/experiment). c, Quantitative Gata2, Epx, Ear1 and Ear2 expression normalized to Gapdh in splenic eosinophils cultured overnight in complete media, or complete media + ILC2-conditioned media (ratio 1:1) (n=6 mice/experiment. Each dot represents one biological or technical replicate. Data pooled from 2 independent experiments with 1-4 biological or technical replicates/genotype/experiment. d, Effect of GM-CSF on eosinophil survival. Peritoneal eosinophils from IL-5Tg mice were cultured (40 × 103/well, in triplicate) in serum free media with or without increasing concentrations of GM-CSF or complete media for 16 hours and dead cells (Propidium Iodide+) was quantitated using IncucyteZOOM live imaging. Data show one representative experiment out of 2 performed with technical replicates. a-c, Each dot represents one mouse sample. a-d, Statistical analyses were performed using ANOVA followed by Tukey’s multiple comparison test (a and b; Rag2–/–Il2rg–/– vs Rag2–/–Il2rg–/– + WT ILC2p vs Rag2–/– Il2rg–/– + Csf2–/– ILC2p), unpaired Student’s t tests (complete media supplemented with wild-type versus Csf2–/– ILC2 conditioned media) (c), or two-way ANOVA followed by Dunnett’s multiple comparison test (d). p-values are indicated. Results are shown as the mean ± s.e.m.
Tumor-infiltrating ILC2 express high levels of PD-1
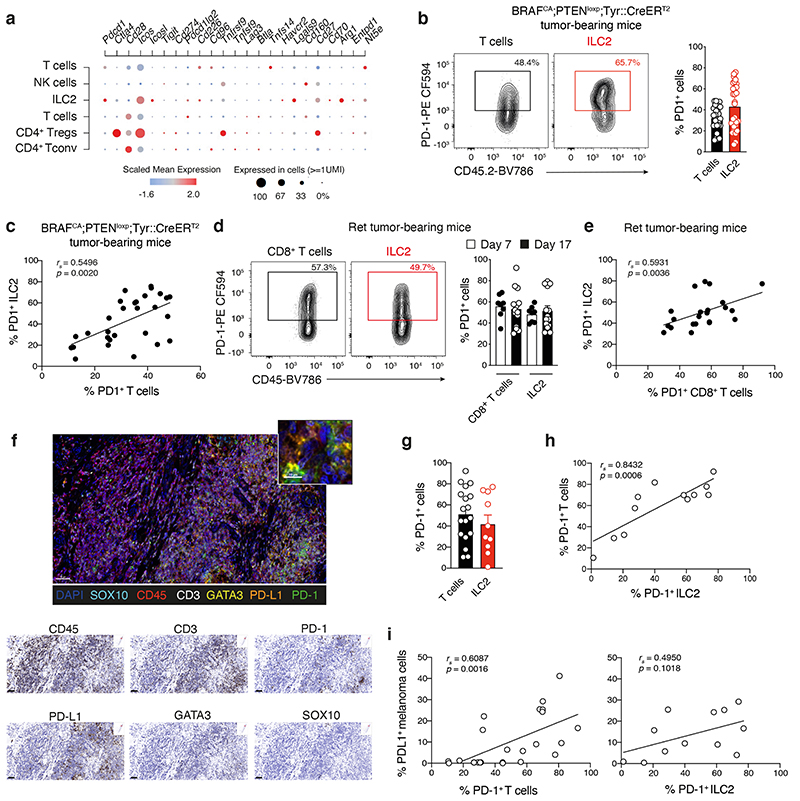
Our data show that while ILC2 play a role in restraining melanoma tumor establishment, they do not continue to accumulate over time and exhibit diminished cytokine function (Extended Data Fig. 2). To understand the mechanisms underpinning this switch in ILC2, we mapped immune checkpoint and co-stimulatory molecule expression in tumor-infiltrating ILCs and T cells within our single cell RNA sequencing data. We found that in addition to well-known gene-coding molecules such as Arg1 and Icos, tumor-infiltrating ILC2 also expressed Pdcd1 which encodes programmed cell death protein 1 (PD-1) (Fig. 6a). Analyses of PD-1 protein expression showed that ILC2 expressed high levels of PD-1 (Fig. 6b-e and Supplementary Fig. 10), and the frequency of PD-1+ T cells and ILC2 were highly correlated (Fig. 6b-e). Using multiplex immunohistochemical staining (Fig. 6f), we found that ILC2 in human primary melanoma tumors also expressed high levels of PD-1 on their surface (Fig. 6f,g) and PD-1-expressing ILC2 were positively correlated with intratumoral PD-1-expressing T cells (Fig. 6h). High PD-1 expression on ILC2 and T cells was also positively correlated with high expression of its ligand, PD-L1, on tumor cells (Fig. 6i). This extends a previous observation that showed that PD-L1+ melanoma cells colocalize with cytotoxic CD8+T cells and this was associated with favorable disease outcome32.
Fig. 6. Melanoma-infiltrating ILC2 express high levels of PD-1.
a, Single cell RNA sequencing analyses of tumor-infiltrating leukocytes purified from BRAFCA;PTENloxp;Tyr::CreERT2 tamoxifen-induced tumors showing differentially expressed genes coding for selected immune checkpoint and costimulatory molecules (y-axis) grouped according to T cell and ILC subsets (x-axis) as identified in Fig. 3a. b, Flow cytometric contour plots (left panels) and frequency (right panel) of PD-1 expression on T cells and ILC2 isolated from BRAFCA;PTENloxp;Tyr::CreERT2 tumor-bearing mice. Data pooled from 5 independent experiments (n=29 tumors). c, Comparison of the frequency of PD-1+ ILC2 relative to PD-1+ T cells. Data show individual values from 5 independent experiments (n=29 tumors). d, Flow cytometric contour plots (left panels) and frequency (right panel) of PD-1 expression on CD8+ T cells and ILC2 from Ret tumor-bearing C57BL/6J mice at day 7 and day 17 post tumor inoculation. Data pooled from 2 independent experiments with 4-6 mice/experiment/time-point (day 7, n=8 mice; day 17, n=12 mice). e, Comparison of the frequency of PD-1+ILC2 relative to PD-1+CD8+T cells. Data show individual values on day 7 and day 17 (n=20 tumors). f-i, Multiplex immunohistochemistry staining of human primary melanoma tumor. f, Immunohistochemistry staining of PD-1 and PD-L1 (scale bar, 50 μm). Inset, tumor-infiltrated PD-1+ILC2 interacting with PD-L1+cells (scale bar, 10 μm). Singlet immunostaining from the composite image (scale bar 50 μm). g, Frequency of PD-1-expressing T cells (CD45+CD3+PD-1+, n=18) and ILC2 (CD45+CD3-GATA3+PD-1+, n=10) in primary melanoma tumors. h, Comparison of the frequency of PD-1+ ILC2 relative to PD-1+ T cells. i, Comparison of the frequency of PD-1+ T cells or PD-1+ILC2 relative to PD-L1+ melanoma cells (SOX10+PD-L1+). b-e and g-i, Each dot represents one mouse (b-e) or human sample (g-i). b, d and g, Data show mean ± s.e.m. c, e, h and i, Correlations were assessed using non-parametric Spearman’s correlation test. The linear regression curves were overlaid. Spearman’s Rho (rs) and p-values are indicated.
PD-1 inhibits ILC2 homeostasis and anti-tumor responses
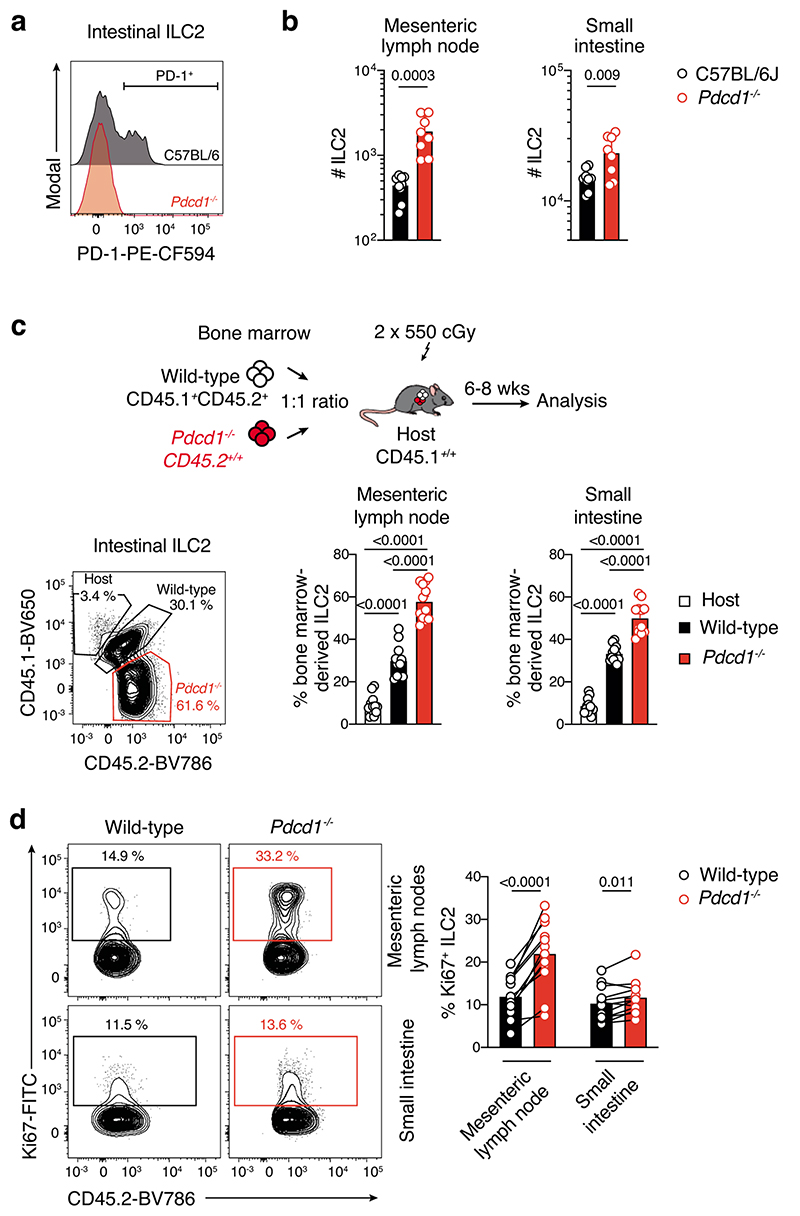
To understand how PD-1 expression might influence ILC2 function, we analyzed ILC2 in PD-1 (Pdcd1–/–)-deficient mice at steady-state. This revealed that Pdcd1–/– mice harbored significantly higher numbers of ILC2 in the small intestine and mesenteric lymph nodes compared with wild-type controls (Extended Data Fig. 9a,b). This accumulation was intrinsic as mixed bone marrow chimeric mice reconstituted with a 1:1 ratio of Pdcd1–/– (CD45.2+):wildtype (CD45.1+CD45.2+) bone marrow also showed increased ILC2 in tissues derived from the Pdcd1–/– compartment (Extended Data Fig. 9c). Furthermore, Pdcd1–/– ILC2 showed enhanced proliferative capacity (Extended Data Fig. 9d). Thus, PD-1 acts as a negative regulator of ILC2 and inhibits ILC2 tissue accumulation and proliferation at steady-state.
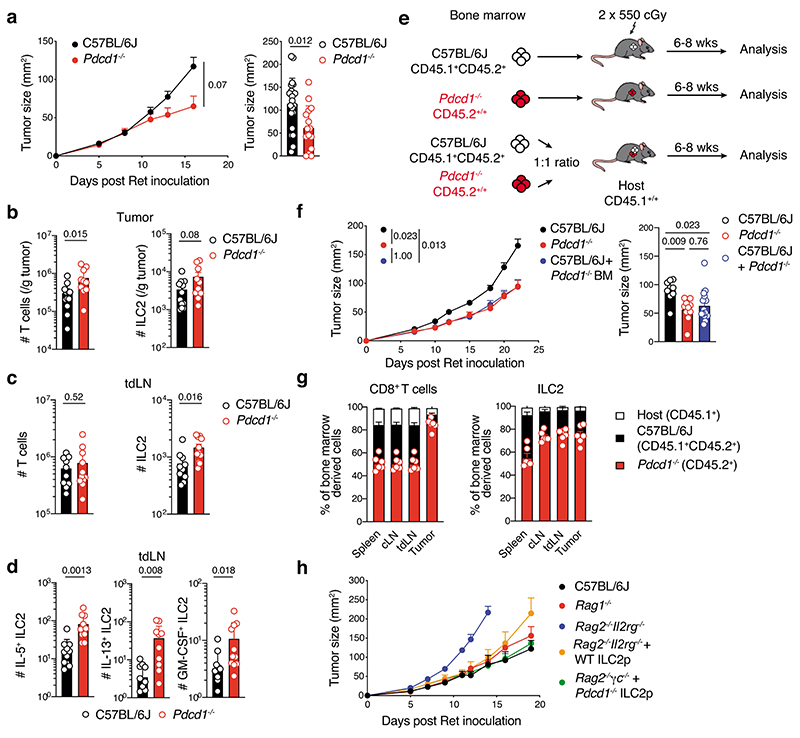
We speculated that this impaired proliferation would impact ILC2 function in the tumor setting. Pdcd1–/– mice inoculated with Ret tumor cells showed reduced tumor growth rate and tumor size compared with wild-type controls (Fig. 7a). This was associated with increased ILC2s and T cells in tumors (Fig. 7b), together with accumulation of cytokine-producing ILC2s in the tumor-draining lymph nodes of PD-1-deficient mice (Fig. 7c,d). As expected, similar results were observed in bone marrow chimeric mice reconstituted with PD-1-deficient hematopoietic cells (Fig. 7e,f), but surprisingly, mixed bone marrow chimeric mice (Pdcd1–/– (CD45.2+):Pdcd1+/+(CD45.1+CD45.2+)→CD45.1+ recipient) exhibited similar anti-tumor-responses to chimeric mice reconstituted with PD-1-deficient cells only (Fig. 7e,f). This favorable outcome was associated with increased intratumoral PD-1-deficient ILC2 and CD8+ T cells, and enrichment of ILC2 in both the tumor-draining and contralateral lymph nodes (Fig. 7g) similar to intact mice (Fig. 7b,c). Given that T cells were also increased in this setting, we asked whether impaired PD-1 expression on ILC2 alone might be sufficient to enhance the anti-tumor response in vivo. Rag2–/–Il2rg–/– mice were reconstituted with wild-type or Pdcd1–/– bone marrow-derived ILC2p. Similar to our earlier results, wild-type ILC2 improved the anti-melanoma response to a level comparable to Rag1–/– mice (Fig. 7h). However, deletion of PD-1 in ILC2 acted to further impede melanoma tumor growth (Fig. 7h). Collectively, these results suggest that PD-1 expression negatively impacts the capacity for ILC2 to mediate anti-tumor immune responses in melanoma.
Fig. 7. PD-1 expression inhibits tumor ILC2 infiltration and ILC2-dependent anti-tumor functions.
a, Cumulative tumor growth (left panel) and tumor size (day 15-16, right panel) in C57BL/6J and Pdcd1–/– mice inoculated intradermally with Ret tumor cells. Data pooled from three independent experiments (C57BL/6J, n=26 mice; Pdcd1–/–, n=20 mice) with 6-11 mice per experiment/group. b-d, Enumeration of T cells (CD45+CD3+TCRb+), ILC2 (CD45+CD3-TCRb-NK1.1-CD11b-RORγt-GATA3+, b and c) and ILC2-cytokine producing cells (d) in tumors (b) and tumor draining lymph nodes (tdLN) (c and d) from C57BL/6J and Pdcd1–/– mice at day 7 following 4hr in vitro stimulation. Data pooled from 2 independent experiments (n=12-10 mice/genotype) with 5-6 mice per experiment/genotype. e-g, C57BL/6J (Ly5.1+Ly5.2+) → Ly5.1, Pdcd1–/– (Ly5.2+) → Ly5.1 or mixed (ratio 1:1) of C57BL/6J:Pdcd1–/– → Ly5.1 bone marrow chimeras were injected with Ret tumor cells 6 weeks after reconstitution. e, Experimental design. f, Tumor growth (left) and tumor size (day 18, right). Data pooled from 2-3 independent experiments (C57BL/6J, n=9 mice; Pdcd1–/–, n=10; C57BL/6J:Pdcd1–/–, n=15) with 3-6 mice/group/experiment. g, Frequency of CD8+ T cells (left) and ILC2 among bone marrow-derived cells in the spleen, LN and tumor. Data show one experiment (n=6 mice). h, Ret tumor growth in C57BL/6J, Rag1–/– mice and Rag2–/–Il2rg–/– mice, or Rag2–/–Il2rg–/– mice reconstituted with wildtype (WT) or Pdcd1–/– purified bone marrow-derived ILC2p six weeks prior to injection. Data show one experiment (C57BL/6J, n=6 mice ; Rag1–/–, n=6 mice; Ragc–/–Il2rg–/–, n=3 mice; Rag2–/–Il2r–/– + wildtype ILC2p, n=5 mice; Rag2–/–Il2rg–/– + Pdcd1–/– ILC2p, n=5 mice). (a-d, f and g) Each circle represents one mouse. (a-d,f-h) Data show mean ± s.e.m. (b-d) Statistical analyses were performed using unpaired Student’s t-test. (a and f) Tumor growth statistical analyses were performed using TumGrowth. p-values are indicated.
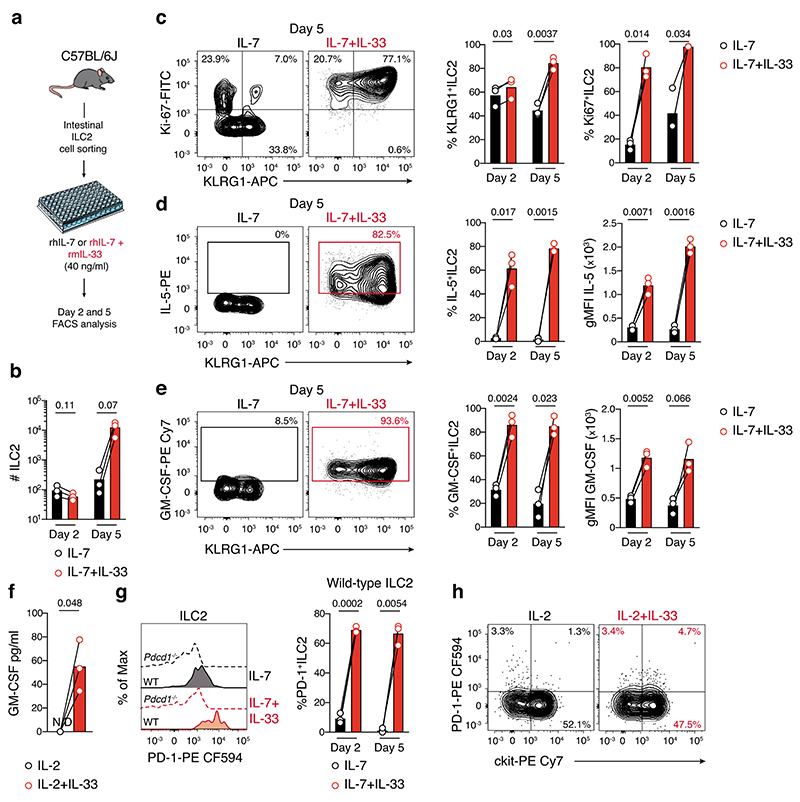
We then stimulated ILC2 with the activation cytokine IL-33 to understand whether enhanced ILC2 activation was also associated with increased PD-1 expression. In vitro IL-33 stimulation induced ILC2 expansion (Extended Data Fig. 10a,b), particularly the inflammatory KLRG1+ subset (Extended Data Fig. 10c) and enhanced both IL-5 and GM-CSF cytokine expression in mice (Extended Data Fig. 10d,e) and human (Extended Data Fig. 10f). It also significantly increased PD-1 expression on murine (Extended Data Fig. 10g) and human (Extended Data Fig. 10h) ILC2 indicating that activation of ILC2 drives increased PD-1 expression which then may impede ILC2 anti-tumor function in vivo.
ILC2 targeted combined therapy enhances anti-tumorogenicity
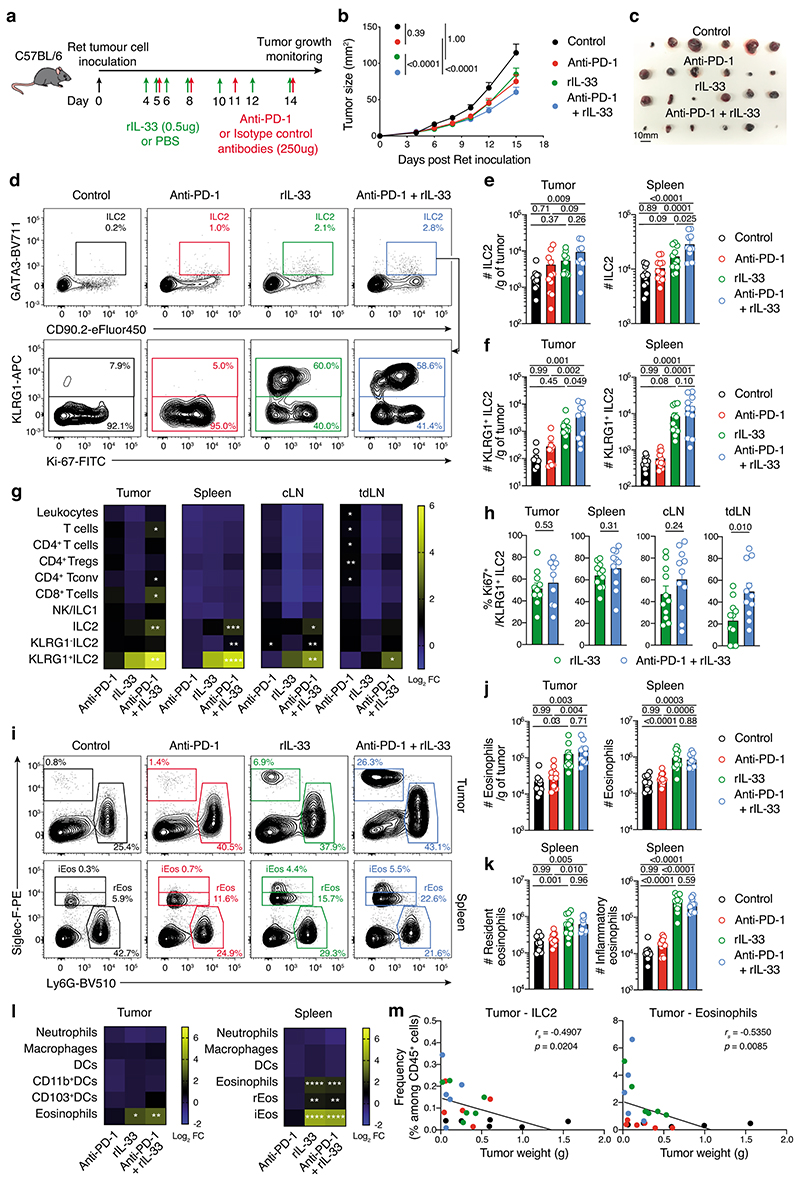
The amplification of ILC2 combined with PD-1 upregulation that limits ILC2 function in response to IL-33 treatment prompted us to ask whether combining IL-33 with anti-PD-1 antibody could overcome the inhibitory brake of PD-1 to improve anti-tumor responses (Fig. 8a). In vivo treatment with IL-33 or the anti-PD-1 antibody reduced Ret tumor growth rate and tumor size (Fig. 8b,c). However, the combination of IL-33 with PD-1 blockade significantly enhanced the anti-tumor response compared with other treatment groups (Fig. 8b,c) increasing tumor-infiltrating and splenic ILC2 (Fig. 8d,e). While, both IL-33 and IL-33+anti-PD-1 treatments resulted in the induction of tumor-infiltrating KLRG1+ ILC2 (Fig. 8d,f,g), the combination therapy further increased the number and proliferation of this inflammatory ILC2 subset (Fig. 8d,h). Neutrophils, macrophages and DCs were not increased with the combined treatment, while IL-33 alone could drive recruitment of tumor-infiltrating eosinophils and the emergence of splenic inflammatory eosinophils (Siglec-Fhi) (Fig. 8i,j,k,l). The frequency of both tumor-infiltrating ILC2 and eosinophils were negatively correlated with tumor weight (Fig. 8m). Altogether, these findings demonstrate how the design of potential combination therapies such as IL-33 + anti-PD-1 can drive significantly improved anti-tumor responses that are associated with increased ILC2 and eosinophils in tumors and secondary lymphoid organs.
Fig. 8. IL-33 combined with anti-PD-1 antibody unleashes anti-melanoma immunity mediated by the ILC2-eosinophil axis.
a-m, Ret tumor-bearing C57BL/6J mice treated with rmIL-33, anti-PD-1 antibody, rmIL-33 + anti-PD-1 or control (PBS and isotype antibody). a, Experimental design. b, Tumor growth and c, Individual tumors (day 15, scale bar, 10 mm). d-m, Immunological analyses at day 15. d, Contour plots showing ILC2 isolated from the tumors. e,f, Enumeration of total ILC2 (e) and KLRG1+ ILC2 (f) in tumors (left panels) and spleens (right panels). g, Heatmaps showing the log2 mean fold change in cell number for immune cell subsets between treatment and control group in tumors, spleen, contralateral (cLN) and tumor-draining (tdLN) lymph nodes of injected mice. *statistical significance between experimental and control groups. h, Frequency of proliferating (Ki67+) KLRG1+ ILC2. i, Flow cytometric contour plots of eosinophils (Siglec-F+Ly6G-) and neutrophils (Siglec-F-Ly6G+) from tumors (upper panels) and spleen (lower panels) resident (rEos, Siglec-F+) and inflammatory (iEos, Siglec-Fhi) eosinophils. j, Enumeration of eosinophils on day 15 post Ret tumor cell inoculation. k, Enumeration of rEos (left panel) and iEos (right panel). l, Heatmaps showing log2 mean fold change in cell number between treatment groups and control groups of immune populations (left axis) of treated mice. Statistical significance between experimental and control groups are shown. m, Frequency of tumor ILC2 and eosinophils relative to melanoma tumor weight (g). Individual data points are colored by group. b,e,f,h,j and k, Data show the mean ± s.e.m. b,e,f,h,j,k and m, Each dot shows one mouse. b-m, Data are pooled from 4 independent experiments (Control, n=21; Anti-PD-1, n=23; rIL-33, n=23; Anti-PD-1+rIL-33, n=22) (b), 2 independent experiments (Control, n=11; Anti-PD-1, n=11-12; rIL-33, n=11; Anti-PD-1+rIL-33, n=9-11) (e-h, and j-l) or represents one experiment (d,i, and m) with 4-6 mice/experimental group/experiment. b, Tumor growth statistical analyses were performed using TumGrowth. e,f,h,j,k, Statistical analyses were performed using a Student’s t-test (h) or ANOVA with Tukey’s multiple comparison test (e,f,j,k,g,l). m, Correlations were assessed using non-parametric Spearman’s correlation test. Linear regression curves were overlaid. Spearman’s Rho (rs) and p-values are indicated. g, k, * p<0.05; ** p<0.01; *** p<0.01; and **** p<0.0001.
Discussion
The melanoma tumor immune infiltrate is heterogeneous, and its composition and quality directly dictate patient outcomes33, 34. How individual ILC subsets contribute and can be harnessed to improve anti-tumor therapy is not yet clear. Here we show that ILC2s produce GM-CSF which drives recruitment of eosinophils and activate their effector functions to orchestrate anti-tumor immune responses. We demonstrate that activation with IL-33 dually enhanced ILC2 cytokine production and augmented PD-1-driven ILC2 inhibition. Combination of IL-33 with PD-1 blockade increased tumor ILC2 and eosinophil recruitment and improved anti-tumor protection. This reveals a mechanism to improve ILC2 function and highlights that, in this setting, immune checkpoint blockade alone is unlikely to fully rescue anti-tumor responses. Thus, tailored reactivation of ILC2s in this setting can strongly influence tumor regression.
GM-CSF has recently been identified as a key cytokine produced by ILC3 important to maintain intestinal homeostasis through cross-talk between macrophages, regulatory T cells and ILC3s35 in inflammation36. It is also produced by NK cells that can exert powerful anti-tumor responses37 and conversely drive inflammation to exacerbate inflammatory arthritis30. We now show that ILC2s express high levels of GM-CSF in melanoma tumors. Although GM-CSF has previously been identified as potent in promoting anti-tumor responses, its therapeutic benefit in melanoma has remained controversial38, but recently it has been shown using genetically modified herpes simplex virus type 1–based oncolytic immunotherapy, talimogene laherparepvec to be important39. This virus produces large amounts of GM-CSF in tumors and induces both potent local and systemic anti-tumor immune responses in melanoma patients40. This suggests that endogenous levels of GM-CSF within tumors are not usually sufficient to efficiently harness immune control of melanoma tumor development. Using IL-33 to drive ILC2 amplification, intratumor accumulation and increased GM-CSF, however, provides a strategy to enhance the anti-tumor response. This mechanism also increased eosinophil tumor recruitment and survival and enhanced eosinophil cytotoxic function. GM-CSF forms a critical checkpoint in synergizing with ILC2-derived cytokines such as IL-5 to drive eosinophil proliferation and function18, 41. However, poor understanding of the mechanisms that underpin the roles of eosinophils in anti-tumor immunity have limited targeting approaches for clinical practice. IL-33 stimulation itself can directly affect eosinophil anti-tumor functions through adhesion molecules such as CD11b and ICAM1 and enhance eosinophil degranulation and cytotoxicity to potentiate killing of tumor cells15, 18. In addition, using RNA sequencing in colorectal cancer, we previously revealed that eosinophils were critical for tumor rejection and displayed an interferon-dependent profile and cytotoxic machinery similar to CD8+ T cells 42.
Among innate immune cells, DCs, particularly type 1 conventional DC (cDC1), are critical for tumor elimination43. They trigger potent anti-tumor responses and are necessary to prime tumor antigen-specific T cells. Using ILC2-deficient mice, we found reduced tumor-infiltrating CD103+cDC1 associated with a decrease of CD8+ T cells in melanoma tumors. Similar observations have recently been reported in pancreatic tumors, suggesting that ILC2 – though their capacity to produce GM-CSF or CCL5 – may potentially recruit and activate intratumoral cDC1, which in turn increase the function and accumulation of tumor antigen specific CD8+ T cells6. However, given that the maintenance and function of CD103+DC, as well as CD103 expression itself, are driven in part, by the presence of GM-CSF44, the use of the β integrin CD103 for intratumoral cDC1 identification might suboptimal. Indeed, reduced CD103 expression on DCs may occur as intratumoral GM-CSF expression occurs in mice deficient in ILC2s which normally express the highest levels of GM-CSF in three different melanoma models examined. Thus, further analyses will be required to ascertain the direct contribution of ILC2s to the recruitment and activation of intratumoral cDC1 tumor antigen specific CD8+ T cells.
We and others discovered that PD-1, mainly known as a T cell inhibitory receptor, is also expressed on bone marrow ILC progenitors28, 45 and mature ILC subsets found in peripheral tissues46. Tissue-resident ILC2s constitutively express PD-1 thereby influencing normal ILC2 function and strongly impacting outcomes in infection and cancer6, 45, 47. Similar to the findings of Moral et al 6 in pancreatic cancer, we observed that PD-1 expression negatively regulates melanoma tumor ILC2 accumulation and effector function, resulting in impaired ILC2-dependent anti-tumor responses. In addition, we found that IL-33-mediated ILC2 proliferation and enhanced GM-CSF production were both associated with increased PD-1 expression, aligned to previous reports6, 47. These findings suggest that ILC2-mediated GM-CSF expression may be dampened as PD-1 expression increases following IL-33 injections, reducing the beneficial impact of IL-33-mediated ILC2 anti-tumor functions. However, these effects are mitigated by co-injection of the anti-PD-1 antibody to remove the inhibitory signals. While we found an increase in adaptive CD8+ T cells in the tumor microenvironment, we also observed the recruitment and accumulation of ILC2s and eosinophils in tumors and peripheral organs. Thus both the innate and adaptive immune arms are synergistically harnessed in the context of combination therapies driving potent anti-tumor responses. More recently, the combination of the GM-CSF-producing oncolytic virus with immune checkpoint inhibitors has demonstrated increased objective response rate and anti-tumor activity in melanoma48, 49. In particular, combination with anti-PD-1 antibody led to improved immune checkpoint therapy and increased anti-tumor immunity48. Thus, similar to IL-33 treatment, non-redundant and complementary anti-tumor immune functions involving both the innate and adaptive arms may be selectively reinvigorated to bolster anti-tumor immunity. Whether similar observations are seen when GM-CSF-producing oncolytic virus is combined with anti-PD-1 immunotherapy remains unknown, but resistance to immune checkpoint blockers has recently been shown to be overcome by intralesional talimogene laherparepvec injections in melanoma patients50.
Collectively, our findings reveal that tumor-infiltrating ILC2s establish the framework for secreted signals, cellular recruitment and cooperation between innate immune cells to unleash anti-tumor functions (Supplementary Fig. 11). Thus, targeting this innate ILC2-eosinophil axis and adaptive lymphoid cells are necessary to fully capitalize on the immune system and help design new therapeutic combinations in melanoma. We propose that mapping the expression of ILC2s and eosinophils in tissues may provide a strong prognostic factor of patient outcomes and warrants additional studies in large cohorts for clinical application of our findings.
Methods
Mice
C57BL/6JJ (B6, Ly5.2+/+), B6.SJL-PtprcaPep3b/BoyJ (Ly5.1+/+), Rag1–/– and Rag2–/– Il2rg–/–(ref. 51), Ncr1iCre (ref. 52), Mcl1fl/flNcr1iCr 26, BRAFCA;PTENloxp;Tyr::CreERT2 (B6.Cg-Tg(Tyr-cre/ERT2)13Bos Braftm1MmcmPtentm1Hwu/BosJ, ref. 22), ICOS-T (CD4CreT/+Icosfl-Dtr/+, ref. 53), IL7riCreRorafl/fl (ref. 53), Rorc(γt)GFP/GFP (ref. 27), ID2GFP/GFP (ref. 54), EomesmCherry (ref. 55), Pdcd1–/– (ref. 56), Csf2–/– (B6.129S-Csf2tm1Mlg/J, ref. 57), Tg(Cd3d-Il5)NJ.1638 (ref. 58) and eosinophil-deficient ΔdblGATA (ref. 59) and PHIL (Tg(Epo-DTA)#Nal, ref. 60) mice have been previously described. All mice were bred and maintained at the Walter and Eliza Hall Institute of Medical Research (Australia), the Hunter Medical Research Institute (Australia), and Tel-Aviv University (Israel) under specific pathogen-free conditions. Both male and female mice were used and analysed at 6-16 weeks of age unless otherwise stated. Animals were handled according to the guidelines of the Australian Code for the Care and Use of Animals of the National Health and Medical Research Council of Australia. Experimental procedures were approved by the Animal Ethics Committee of the Walter and Eliza Hall Institute of Medical Research and the Animal Care and Use Committee of Tel Aviv University.
Cell culture, reagents and tumor cell line
The SM1WT1 (kindly provided by Prof. Mark Smyth), the B16-OVA (kindly provided by Prof. Sandra Nicholson) and Ret melanoma cell lines derived from the culture of a primary tumor generated by transgene-enforced expression of the Ret proto-oncogene under the control of the metallothionein-1 promoter driving spontaneous melanomagenesis61 (kindly provided by Prof. Viktor Umansky) were maintained in complete media consisting of RPMI 1640 containing 10% heat-inactivated FCS, 2mM L-Glutamine, 50mM β-mercaptoethanol, 100U/ml penicillin, and 100mg/ml streptomycin. The B16-F10 melanoma cell line was maintained in complete media consisting of DMEM medium, supplemented with 10% heat-inactivated FCS, 100U/ml penicillin and 100μg/ml streptomycin. In vivo injection of B16-OVA, Ret or B16-F10 tumor cells form pigmented tumor lesions (black) recapitulating melanoma phenotype. OVA expression in B16OVA cell line was successfully detected by PCR (B16F10 cell line used as negative control). Cells tested negative for Mycoplasma.
In vivo treatments
For depletion of ILC2 in vivo, ICOS-T mice and C57BL/6J control mice were treated intraperitoneally with 0.5mg of recombinant mIL-33 (PeproTech) and/or 4ng/g of body weight of diphtheria toxin (Sigma) concomitantly (Extended Data Fig. 4). Control animals received PBS only. C57BL/6J mice were treated intraperitoneally with 0.5μg of recombinant mIL-33 (PeproTech) and/or 250μg of anti-PD-1 (clone RMP1-14, BioXcell) or received control ratIgG2a isotype antibody (Clone 2A3, BioXcell) or PBS (Fig. 8).
Tumor inoculation, induction and monitoring
SM1WT1, B16-OVA and Ret tumor inductions
Syngeneic C57BL/6J mice were shaved and then implanted with 5×10⁵ SM1WT1, B16-OVA or Ret cells intradermally.
Spontaneous melanoma induction in vivo
Immediately prior to tumor induction, the flank of BRAFCA;PTENloxp;Tyr::CreERT2 mice was shaved. 2μl of a 5mM 4-hydroxytamoxifen solution was placed on the skin of mice to delete PTEN in tyrosinase-expressing cells22. This is associated with the expression of a constitutive active form of BRAF that together leads to the development and clinical appearance of melanomas after approximately 30 days after topical treatment (Extended Data Fig. 1a). In both models, tumor size was monitored every 2 to 3 days and ethical end points were reached when (i) tumor size reached 200 mm2 or (ii) tumor site showed ulceration.
Experimental lung metastasis
Syngeneic C57BL/6J and ΔdblGATA mice were injected intravenously with 2×10⁵ B16-F10 cells to the tail vein causing tumor cell colonization in the lungs. Tumor burden was assessed on day 16 after injection using histology H&E staining by calculating the percentage of tumor area in the left lung utilizing QuPath software62 and manual nodule count.
Cell isolation
Tumors and lungs
Prior to digestion, tumors were weighted. Tumors and lungs were minced before digestion in Collagenase IV (1mg/mL, Worthington Biochemical) and DNase I (50μg/mL, Roche) for 45 minutes at 37°C with agitation. Digested fragments passed through a 70μm cell strainer (Corning) and washed in FACS buffer (PBS containing 2.5% FCS and 0.3% sodium azide) prior to staining. Single cell suspensions from lung were isolated using 40%-80% Percoll gradient. Mononuclear leukocytes were recovered from the interface and washed in cold FACS buffer prior to analyses.
Skin
Fat tissue was removed using surgical blade and skin samples were chopped. Tissues were then digested in Liberase™ (0.1mg/mL, Roche) and DNase I (50μg/mL, Roche) for 2 hrs at 37°C under gentle agitation. Digested tissue was then filtered through a 70μm cell strainer, wash in FACS buffer, prior to staining.
Small intestine
The fat tissue and Peyer’s patch were removed from the small intestine, the tissue was opened up longitudinally, cleaned, cut into ~2mm sections, and washed before digestion. Small fragments were then dissociated in 2% FCS HANKS Ca+Mg+ Free Media with 5mM EDTA for 40 minutes at 37°C with gentle agitation. The dissociated epithelial layer was then discarded and remaining gut fragments were digested in Collagenase IV (1mg/mL, Worthington Biochemical), DNase I (200μg/mL, Roche) and Dispase (4U/mL, Sigma) for 45 min at 37°C under gentle agitation. Lamina propria mononuclear immune cells were isolated by centrifugation on a 40%-80% Percoll gradient. Lymphocytes were recovered from the interface and washed in cold FACS buffer.
Spleen and lymph nodes
Single cell suspensions were generated from spleen and lymph nodes by dissociating tissues using 70μm filters. Red blood cells from the spleen were removed using a hypotonic solution and samples washed and resuspended in cold FACS buffer prior to analyses.
Flow cytometric analyses
Single cell suspensions were blocked with anti-CD16/32 (2.4G2, 1/400 dilution) antibody for 10-20 mins then stained with the indicated fluorescently conjugated antibodies for 30 minutes on ice. Antibodies used were anti-CD4 (GK1.5, 1/400 dilution; and RM4-5 1/400 dilution, in house or BD Biosciences, 1/1000 dilution), anti-CD8α (53-6.7, in house or BD Biosciences, 1/100-1/400 dilution), anti-CD11b (M1/70, in house 1?100 dilution, or BD Biosciences, 1/400 dilution), anti-CD103 (2E7, BioLegend, 1/200 dilution), anti-CD49a (Ha31/8, BD Biosciences, 1/300 dilution), anti-ST2 (D1H9, BioLegend, 1/100 dilution or eBioscience, 1/200 dilution), anti-GR1 (RB6-8C5, BD Biosciences, 1/200 dilution), anti-CD49b (DX5, in house, 1/100 dilution), anti-TCRγδ (GL3, BD Biosciences, 1/300 dilution), anti-CD64 (X54-517.1, BioLegend, 1/100 dilution), anti-MHC Class II (M5/114.15.2, BioLegend, 1/300 dilution, or BD Biosciences, 1/1,200 dilution), anti-ICOS (C398.4A, BioLegend, 1/100 dilution), anti-IL-7R (SB/199, BD Biosciences, 1/100 dilution), anti-CD11c (HL3, BD Biosciences, 1/200 dilution), anti-Ly6C (HK1.4, eBioscience, 1/200 dilution), anti-Ly6G (1A8, BD Biosciences, 1/200 dilution), anti-Siglec-F (E50-2440, BD Biosciences, 1/200 dilution), anti-F4/80 (BM8, eBioscience, 1/200 dilution), anti-CD3ε (145-2C11, BD Biosciences, 1/200 dilution), anti-CD19 (1D3, BD Biosciences, 1/800 dilution), anti-CD45 (30-F11, BD Biosciences, 1/1,200 dilution), anti-CD45.1 (A20, BD Biosciences, 1/400 dilution), anti-CD45.2 (104, BD Biosciences, 1/100 dilution), anti-NK1.1 (PK136, BD Biosciences, 1/400 dilution), anti-CD90.2 (30-H12, in house or BD Biosciences, 1/300 dilution), anti-KLRG1 (2F1, eBioscience, 1/200 dilution, or BD Biosciences, 1/300 dilution), anti-NKp46 (29A1.4, eBioscience, 1/100 dilution), anti-TCRβ (H57-597, eBioscience, 1/200 dilution), anti-PD-1 (J43, BD Biosciences, 1/100 dilution), anti-CD25 (PC61.5, eBioscience, 1/100 dilution, BD Biosciences, 1/100 dilution, or in house, 1/100 dilution), anti-CCR6 (140706, BD Biosciences, 1/100 dilution) or anti-c-kit (2B8, eBioscience, 1/300 dilution) antibodies together with the fixable viability dye 700 (BD HorizonTM, 1/1000 dilution). For intracellular staining, cells were fixed and permeabilized using a Foxp3 eBioscience Kit (eBioscience) for 30 minutes on ice, washed and then stained for 30-40 minutes with the following antibodies: anti-GATA3 (TWAJ, eBioscience; or L50-823, BD Biosciences, 1/100 dilution), anti-RORγt (Q31-378, BD Biosciences, 1/300 dilution), anti-Eomes (Dan11mag, eBioscience, 1/300 dilution), anti-Foxp3 (FJK-16S, eBioscience, 1/300 dilution), anti-Ki-67 (B56, BD Biosciences, 1/25 dilution), anti-IL-5 (TRFK5, eBioscience, 1/400 dilution), anti-IL-13 (Ebio13A, eBioscience, 1/200 dilution), anti-IL-17A (Ebio17B7, eBioscience, 1/100 dilution), anti-IL-22 (IL22JOP, eBioscience, 1/200 dilution), anti-GM-CSF (MP1-22E9, BioLegend, 1/100 dilution), anti-IFNγ (XMG1.2, BD Biosciences, 1/100 dilution) or anti-TNFα (MP6-XT22, BD Biosciences, 1/100 dilution) antibodies. Cytokine expression was determined after 4 h of stimulation in complete medium in the presence of 50ng/ml PMA (Sigma), 500ng/ml ionomycin (Sigma) and GolgiStop™ (BD Biosciences). Samples were acquired on a Fortessa X20 (BD Bioscience) and analysed with FlowJo™ software (version 10).
Isolation of bone marrow progenitors
Bone marrow cells were isolated from the long bones, hips and sternum. Cleaned bones were crushed with mortar and pestle in PBS to create a single cell suspension. Cells were then filtered through 70μm cell strainers. Red blood cells were removed using hypotonic solution. Cell suspensions were filtered through 70μm cell strainers and washed in PBS. Cells were resuspended in MACS Buffer (phosphate-buffered saline containing 2% heat-inactivated FCS and 1mM EDTA) then stained with anti-IL-7Rbiotin (CD127, A7R34, eBioscience, 1/100 dilution) antibody for 40 minutes on ice. Cell suspensions were washed and incubated with α-biotin magnetic microbeads (Miltenyi Biotec) for 30 minutes on ice prior to enrichment of the IL-7R-biotin binding fraction using LS columns (Miltenyi Biotech). These cells were then stained with anti-c-kit (2B8, eBioscience, 1/300 dilution), anti-CD127 (A7R34, BD Biosciences, 1/100 dilution), anti-Sca-1 (D7, BD Biosciences or in house, 1/200 dilution), anti-Flt3 (A2F10, BD Biosciences, 1/50 dilution), anti-α4β7 integrin (DATK32, eBioscience, 1/300 dilution), anti-CD25 (PC61.5, eBioscience, 1/200 dilution) antibodies and streptavidin-PE Cy7 (BD Biosciences, 1/100 dilution). Lineage-positive (lin+) cells were excluded from analyses by staining with anti-CD3ε (145-2C11, 1/300 dilution), anti-B220 (RA3-6B2, 1/300 dilution), anti-CD11b (M1/70, 1/300 dilution), anti-TER119-AF700 (1/300 dilution)(all generated in house), anti-NKp46 (29A1.4, BD Biosciences, 1/200 dilution), anti-F4/80 (BM8, eBioscience, 1/200 dilution), anti-CD19 (1D3, eBioscience, 1/200 dilution), anti-TCRβ (H57-597, eBioscience, 1/200 dilution), and anti-NK1.1 (PK136, BD Biosciences, 1/200 dilution) antibodies together with the fixable viability dye 700 (BD Horizon™). Flow cytometric sorting was performed on a FACS Aria (BD Biosciences) (Supplementary Fig. 4).
Chimeric mice
Rag2–/–Il2rg–/– reconstitution
Highly purified bone marrow progenitors (Supplementary Fig. 4) were isolated from congenic Ly5.2 (CD45.2+), Ly5.1 (CD45.1+), ID2GFP/GFP (CD45.2+), Pdcd1–/– (CD45.2+), Csf2–/– (CD45.2+) or ID2GFP/GFP× EomesmCherry (CD45.2+) mice and adoptively transfer by intravenous injection into sublethally irradiated (1 × 4.5 Gy) Rag2–/–Il2rg–/– recipients. After 6-10 weeks of reconstitution, mice were injected with 5×10⁵ Ret tumor cells.
Bone marrow chimeric mice
Bone marrow chimeric mice were generated by reconstituting lethally-irradiated (2 × 5.5 Gy) Ly5.1 (CD45.1+) recipient mice with Rorafl/flIl7riCre (CD45.2+), Pdcd1–/– (CD45.2+), Rorc(γt)GFP/GFP (CD45.2+), Rorc(γt)GFP/+ (CD45.2+) or C57BL/6J (CD45.2+) bone marrow as indicated, or a 1:1 mixture of Pdcd1–/– (CD45.2+) and C57BL/6J × Ly5.1 (CD45.2+CD45.1+) (mixed bone marrow chimeras). After 6-10 weeks reconstitution, mice were analyzed or injected with 5×10⁵ Ret tumor cells for tumor growth monitoring and flow cytometric analyses.
In vitro cell culture
Intestinal ILC2
Cells were purified by flow cytometric sorting from naïve C57BL/6J, Pdcd1–/– or Csf2–/– mice (Supplementary Fig. 9 and Extended Data Fig. 10). Lamina propria single cell suspensions were stained with antibodies for anti-CD45 (30-F11, BD Biosciences, 1/1,200 dilution), anti-CD3ε (145-2C11, eBioscience, or 17A2, BioLegend, 1/200 dilution), anti-CD19 (1D3, BD Biosciences, or eBio1D3, eBioscience, 1/800 dilution), anti-TCRβ (H57-597, eBioscience, 1/200 dilution), anti-CD11b (M1/70, BD Biosciences, 1/800 dilution), anti-c-kit (2B8, eBioscience, 1/300 dilution), anti-NK1.1 (PK136, BD Biosciences, 1/400 dilution), anti-Sca-1 (D7, BD Biosciences, 1/300 dilution) and anti-KLRG1 (2F1, BD Biosciences, 1/200 dilution) antibodies. Intestinal ILC2 were identified as: CD45+CD3-CD19-TCRβ-CD11b-NK1.1-c-kit-Sca-1+KLRG1+/- or CD45+CD3-CD19-TCRβCD11b-NK1.1-c-kit-CD90.2+CD127+KLRG1+. 2.5-8.5×10³ purified cells were cultured in 96 well plates with 40ng/ml rhIL-7 and rmIL-33 (both from PeproTech) in complete media. After two to five days of culture, cells were collected and stained to assess surface and intracellular cytokine expression. The ILC2-conditioned media was collected to supplement eosinophil cultures at a 1:1 ratio (Supplementary Fig. 9).
Eosinophils
Eosinophils were isolated from the spleens of naïve Ly5.1+/+ mice by magnetic separation enrichment followed by flow cytometric sorting. Single cell suspensions of spleen were resuspended in MACS Buffer and then stained with an anti-Siglec-F (E50-2440, BD Biosciences, 1/100 dilution) antibody for 30 minutes on ice. Cell suspensions were washed and incubated with α-PE magnetic microbeads (Miltenyi Biotec) for 30 minutes on ice prior to enrichment of the Siglec-F-binding fraction using LS columns (Miltenyi Biotech). Live splenic eosinophils were then identified and purified as SSCAhiSiglec-F+Ly6G- cells. After washing cells with complete media, 5×10⁴ purified eosinophils were cultured in complete media in 96 well plates supplemented with or without ILC2-conditioned media (ratio 1:1). After overnight culture, cells were harvested, washed twice in PBS before resuspension in RLT+ (RNA later + β-Mercaptoethanol) buffer and stored at -80°C until RNA extraction.
Eosinophil survival assay
Eosinophils were isolated from peritoneum of Il5Tg mice using magnetic separation. Peritoneal cells were isolated by washing the peritoneal cavity of Il5Tg mice with sterile PBS. Eosinophils were isolated using negative selection with anti-Thy1.2 and anti-B220 Dynabead conjugated antibodies. Eosinophil purity and viability was determined using CD45, Siglec-F and DAPI antibody staining by flow cytometry. Eosinophils were used only >90% purity and viability. Eosinophils were incubated with DMEM supplemented with increasing concentrations of GM-CSF (PeproTech) and images were recorded every 15 min using IncucyteZOOM (Essen BioScience) live imaging. Analysis was conducted using IncucyteZoom2016B analysis software, normalization was performed according to maximal PI-positive object count to calculate the percentage of dead cells.
Eosinophil gene expression analysis
Total RNA extraction and genomic DNA removal were performed using the RNeasy Plus Micro Kit (Qiagen). First-strand cDNA was generated from total RNA using iScript™ Reverse Transcription Supermix for RT-qPCR (Bio-Rad) according to the manufacturer’s recommendations. Expression of Gapdh (Forward: TACCCCCAATGTGTCCGTC; Reverse: AAGAGTGGGAGTTGCTGTTGAAG), Gata2 (Forward: GAATGGACAGAACCGGCC; Reverse: AGGTGGTGGTTGTCGTCTGA), Epx (Forward: TCACTTGACCGAGTGTCACC; Reverse: CTCCTGACTAACCGCTCTGC), Ear1 (Forward: AATGCTGTTGGTGTGTGTGGAAAT; Reverse: CACTGGATACATGGGACTGTCCTG) and Ear2 (Forward: TCTGTAACATCACCAGTCGGAGGA; Reverse: CACTGGAGCTAAAATGTCCCATCC) (all from Integrated DNA Technologies) were analysed using 2× SensiMix SYBR No-ROX (Bioline) on a CFX384 Real-Time PCR detection System (Bio-Rad). Quantitative gene expression data were normalized to the expression levels of the housekeeping gene Gapdh by means of the 2−ΔCq method multiplied by 10.
Single cell RNA sequencing
Library preparation and sequencing
Single cell RNA sequencing analyses were performed on BRAFCA;PTENloxp;Tyr::CreERT2 tumors collected 48 days after treatment with tamoxifen. Live tumor-infiltrating leukocytes (Dead cell marker-CD45+) were purified by flow cytometry. Single cell RNA sequencing libraries were prepared using 10X Genomics protocols using the Chromium™ Single Cell 3’ Library and Gel Bead Kit (v2). Briefly, sorted leukocytes were suspended at a concentration of 1 × 10³ cells/μl and then loaded onto 10X Chromium™ Single Cell 3’ Chips to be encapsulated in Gel Beads in Emulsion (GEM). Then PolyA barcoded cDNA was generated after incubation with GEM at 53°C for 45 minutes using a Thermocycler. After cleaning, cDNA was amplified for 10 cycles, enzymatically fragmented, end repaired, A-tailed and double-sided size selected. An adaptor was ligated and then each library was indexed by adding a sample index tag by PCR for 14 cycles. A second double-sided selection was performed to obtain an average of 445 and 410bp for the two samples. Libraries were sequenced on an Illumina NextSeq platform to a depth of 0.2 million reads/cell.
Bioinformatics analyses
Reads from each sample were processed using 10× Genomics Cell Ranger software (version 3.0.2). Cellranger mkfastq was used to demultiplex cell barcodes and convert BCL-format Illumina reads in each flowcell directory into FASTQ files. Reads were then mapped to mouse reference genome GRCm38. Mapped reads were deduplicated and counted to Ensembl genes to produce UMI (Unique Molecular Identifier) counts for each gene in each cell. On average between 1 × 10³ to 2 × 10³ genes were identified for each cell. Subsequent analyses were performed in R (v3.6.0). Outlier cells were removed if they (i) had < 200 or > 2,500 genes expressed, (ii) had more than 5% of mitochondrial gene content or (iii) genes failed to be detected in >3 cells. UMI counts of genes were converted to log2 count-per-million (log2-CPM) values, with a prior count of 5 added to raw counts to avoid log transformation of zero. The t-distributed stochastic neighbor embedding (t-SNE) technique was used to identify different clusters. Immune cell populations were mapped using SingleR29 through the ImmGen database which also allows mapping of small numbers of cells63, 64. Z-scores in those dot plots, which show gene expression and the proportion of cells expressing targeted genes, were calculated using average log2-CPM values of each gene computed over all the cells in each cell type. Single cell RNA sequencing data from this study have been deposited in the Gene Expression Omnibus (GEO) repository under accession number GSE149615.
Statistical analyses
Data analyses and representations were performed either with the R software or Prism (GraphPad version 7.0 or 8.0, San Diego, CA, USA). Statistical analyses were two-sided. In all cases, confidence intervals were reported at a nominal level of 95%. For more than two groups, statistical analyses were performed using ANOVA followed by Tukey’s multiple comparison test or pairwise comparisons with Bonferroni adjustments. Otherwise, for two groups, statistical analyses were performed using the paired or unpaired Student’s t tests. Results are shown as the mean ± s.e.m. Correlations between two variables were assessed using non-parametric Spearman correlation tests. Tumor growth experiments were analysed with TumGrowth software (https://kroemerlab.shinyapps.io/TumGrowth/) with default settings at the exception of the original tumor measurements that were log transformed before linear mixed-effect modelling. Cox proportional hazards modelling were applied when assessing the impact of the genotype on mice survival. p-values were two-sided with 95% confidence intervals and considered significant at p < 0.05.
Human samples
Seven color multiplex immunohistochemistry (mIHC)
All tissues samples were retrieved through Melanoma Research Victoria (MRV) following the study protocol approved by the MRV Review Board (MRV07/38). Informed consent was obtained from all patients. The study was performed in strict compliance with all institutional ethical regulations. All tumor samples were surgically resected primary melanoma and preserved as formalin-fixed paraffin-embedded blocks (FFPE). Patient’s characteristics are detailed in Supplementary Table 1. 4μm sections were cut and stained with haematoxylin and eosin (H&E) from each FFPE block. The H&E slides were evaluated by a pathologist to define ‘tumor’ vs ‘non-tumor’ regions. For mIHC staining, serial 4μm FFPE tissue sections from each block were de-paraffinized and rehydrated by serial passage through changes of xylene and graded ethanol before being stained with Immune Checkpoint Panel and Pan Immune Panels composed of anti-CD45 (2B11, PD7/26 Dako, 1/100 dilution), anti-Sox10 (BC34, Biocare Medical, 1/200 dilution), anti-PD1 (EP239, BioSB, 1/100 dilution), anti-GATA3 (L50-823, Biocare Medical, 1/50 dilution), anti-PD-LI (SP263, Roche Diagnostics), anti-CD68 (514H12, Biocare Medical, 1/100 dilution), anti-CD3ε (polyclonal, Dako, 1/200 dilution), anti-CD11c (EP157, Dako, 1/500 dilution) and DAPI (Invitrogen). mIHC staining was performed using the OPAL POLARIS 7-color automation IHC kit (Akoya BioSciences, California, United States) as per manufacturer’s instructions. Automated staining was performed on the sections using Leica Biosystems BOND RX autostainer (Wetzlar, Germany) according to the manufacturer’s instructions. All steps were performed at room temperature unless indicated. Briefly, heat-induced epitope retrieval (HIER) by incubating tissue sections in 1mM EDTA buffer, pH 8.0 at 125°C for 3 minutes followed by blocking buffer for 10 minutes. Slides were incubated in the primary antibody for 30 minutes, followed by Opal polymer HRP Ms+Rb for 10 minutes. The fluorescent signal was introduced using reactive fluorophores by incubating for 10 minutes. The antibody was stripped using HIER before applying the next primary antibody. Endogenous peroxidase in tissues were blocked using 3% hydrogen peroxide solution after incubation with the first primary antibody. For the last antibody, OPAL TSA-DIG were applied after Opal polymer HRP Ms+Rb step and before Opal Polaris 780 fluorophore. After the final antigen retrieval using HIER, slides were washed twice before staining nuclei with 4′,6-diamidino-2-phenylindole (DAPI), and mounted using ProLong™ Glass Antifade Mountant (Thermo Fisher Scientific, Waltham, Massachusetts, United States). All slides were subsequently imaged on a Vectra Polaris™ quantitative pathology imaging system (Akoya Biosciences). High-powered images at 20X were selected using Phenochart (Akoya Biosciences) and imported into inForm® Software v2.4 (Akoya Biosciences) for deconvolution. The deconvoluted files from InForm 2.4 were exported into HALO® (Indica Labs, New Mexico, United States) and merged together to perform tissue and cell segmentation as well as cell phenotyping using the Highplex v3.0.3 module on HALO® software. Cell segmentation was assessed based on all cells counter-stained with DAPI. Manual annotations in HALO® segmented the tissue into ‘tumor’ and ‘non-tumor’ regions guided by pathologist markup of H&E stained sections. Cell phenotyping on InForm was undertaken by selecting at least five representative cells per phenotype, then performing reiterations until at least 20 representative cells per phenotype were selected. Cell phenotyping on HALO® was performed by thresholding the individual seven markers in the panel for each slide. The density of cell subsets was subsequently calculated per mm2.
CyTOF
Frozen vials containing single cell suspensions of metastatic melanoma samples were thawed and counted using Trypan blue. Cells were incubated for 10 min at room temperature with Human BD Fc block (BD Pharmingen, 1/20) in CyTOF staining media (CSM: Ca++/Mg++ free PBS, 2% Foetal Bovine Serum (FBS), 2mM EDTA, 0.05% sodium azide) then washed and stained for 30 min on ice with anti-CD45-89Y (H130, Fluidigm, 1/50 dilution), anti-CD19-142Nd (HIB19, BioLegend, 1/100 dilution), anti-CD123-143Nd (6H6, BioLegend, 1/200 dilution), anti-HLA-ABC-144Nd (W6-32, Fluidigm, 1/200 dilution), anti-CD11c-147Sm (Bu15, BioLegend, 1/200 dilution), anti-HLA-DR-147Sm (L243, BioLegend, 1/400 dilution), anti-CD8α-155Gd or -115LN (RPA-T8, BioLegend, 1/400 dilution) anti-CD4-145Nd (RPA-T4, BioLegend, 1/200 dilution), anti-TCRγδ-152Sm (11F2, Fluidigm, 1/100 dilution), anti-CD33-158Gd (WM53, Fluidigm, 1/400 dilution), anti-CD161-159Tb (HP-3G16, Fluidigm, 1/50 dilution), anti-CD56-163Dy (HCD56, BioLegend, 1/100 dilution), anti-CD15-164Dy (W6D3, Fluidigm, 1/25 dilution), anti-CD3-170Rt (UCHT1, BioLegend, 1/100 dilution), anti-TCRvα7.2-172Yb (3C10, BioLegend, 1/50 dilution), anti-CD14-175Lu (M5E2, BioLegend, 1/100 dilution), anti-TCRαβ-176Yb (IP26, BioLegend, 1/50 dilution) and anti-CD11b-209Bi (ICRF44, Fluidigm, 1/400 dilution). For 2 patients, CD11c was replaced by HLA-DR and for five other patients, CD3 was not used. Following one wash in CSM, cells were washed in PBS and stained with 0.5 uM cisplatin (viability marker) in PBS for 3 min at room temperature. Staining was quenched with CSM. Cells were then permeabilized with eBioscience FoxP3/Transcription Factor Staining Buffer Set (Invitrogen) according to manufacturer’s instructions then stained with the antibodies anti-EOMES-153Eu (WD1928, Invitrogen, 1/200 dilution), anti-T-BET-160Gd (4B10, Fluidigm, 1/400 dilution), anti-RORγt-168Er (1181A, R<D Systems, 1/100 dilution) and anti-CD68-171Yb (Y1/82A, Fluidigm, 1:1,000). After washing in perm-wash buffer twice, the pellet was resuspended in iridium intercalator (EM Sciences) at 0.1μM in 2% paraformaldehyde in PBS and stored up to 48 hrs in the fridge before acquisition. Cells were washed in CSM and twice in deionized water (MilliQ, Merck) before loading onto Helios instrument (Fluidigm) for acquisition. Antibodies not purchased from Fluidigm were purchased from the listed sources, and metal conjugated in house using X8 Multi-Metal Labelling Kit (Fluidigm). Informed consent was obtained from all patients.
ILC2 isolation, in vitro cultures, flow-cytometric analyses and GM-CSF quantification
For the isolation of human ILC2, blood or Buffy coats were obtained from healthy donors (Ethics approval number: HREC/2019/QMS/55385, University of Queensland Metro North Ethic Committee). PBMCs were isolated by Ficoll-Paque (GE Healthcare). ILC2 were MACS separated according to protocol using human ILC2 isolation kit (lineage-, CRTH2+, Miltenyi). Cells were then stained and FACS sorted for purity with following antibodies: anti-TCRγδ (B1, BD Pharmingen), anti-CD14 (M5E2, BD Pharmingen), anti-CD3 (UCHT1, BD Pharmingen), anti-CD19 (HIB19, BD Pharmingen), anti-TCRαβ (T10B9.1A-31, BD Pharmingen), anti-FCεR1 (AER-37 (CRA-1), BioLegend), anti-CD34 (581, BD Pharmingen), anti-CD123 (7G3, BD Pharmingen), anti-CD303 (201A, BioLegend), anti-CD15 (HI98, BD Pharmingen), anti-CD33 (HIM3-4, BD Pharmingen), anti-CD11c (B-ly6, BD Pharmingen) collectively called lineage, as well as anti-CD161 (DX12, BD Horizon), anti-CD117 (104D2, eBiosciences), anti-CD45 (2D1, BD Pharmingen), anti-CD127 (HIL-7R-M21, BD Horizon), anti-CD56 (NCAM16.2, BD Horizon), anti-CD16 (3G8, BD Horizon), anti-CD69 (FN50, BD Horizon), anti-CD94 (HP-3D9, BD Optibuild) and anti-PD-1 (EH12.1, BD Horizon). ILC2 were defined as live CD45+lineage-CD127+CD56-CD16-CRTH2+. Freshly sorted ILC2 were cultured for 2 days with IL2 (5ng/ml, PeproTech) or IL2 and IL-33 (5ng/ml and 10ng/ml (Miltenyi), respectively) in complete media consisting of RPMI 1640 supplemented with: 10% heat-inactivated human AB+ Serum, 2mM L-Glutamine, 1mM Sodium Pyruvate, 100U/ml penicillin, 100μg/ml Streptomycin (300-2000 cells/well). After 2 days of culture, supernatant was harvested and stored at -80 degrees. Cells were freshly stained with anti-PD-1 antibody and analysed by flow cytometry. GM-CSF production was analysed by using the BD Biosciences cytometric bead array flex set for human GM-CSF according to manufacturer’s instructions.
NanoString and 3’ RNAseq immune gene expression profiling
RNA was isolated and purified from 10μm tissue sections using the RNeasy FFPE kit (Qiagen) according to the manufacturer’s instructions. 1μl of RNA from each sample was tested for quality using a High Sensitivity RNA TapeStation assay (Agilent) with a DV200 cut-off of > 50% for downstream analysis. 150 ng total RNA from each sample was analysed using the Nanostring platform using the nCounter PanCancer Immune Profiling Panel. Downstream normalisation and gene quantification were performed using nSolver Analysis Software v4.0. The raw counts were read from RCC files using CRAN package nanostringr. Sample-specific library size factors were estimated from negative control genes using calcNormFactors() in edgeR. The estimated normalization factors were then used to compute log-CPM values, which were then used an input to ILC2 prediction model (classifier).
Statistical learning models for ILC2 and eosinophil infiltration signatures
ILC2
Raw read counts for single cell RNA-sequencing of human tonsil innate lymphoid cells (ILCs), including ILC1, ILC2, ILC3 and NK cells were obtained from a previously published study available under accession GSE7058065. Cells of low quality with more than 5% mitochondrial contamination and genes expressed in less than 5% of the cells were filtered out. Read counts were normalized and the top 5,000 highly variable genes were identified using scran R/Bioconductor package. A classifier was trained to learn the ILC2 gene expression signature using 241 genes (features) based on highly variable genes overlapping a panel of 730 immune genes on 80% of the data, while the rest of the data was used as the test dataset to tune the model parameters. An Extreme Gradient Boosting (XGboost) classifier was trained using tree boosting, maximum tree depth of 5, learning rate of 0.05, a binary logistic objective and 9 rounds of iteration using xgboost R package. The classifier was also validated on an independent dataset of mouse single cells of wild-type skin ILC2 obtained from GSE11756866. The classifier was then applied to TCGA primary and metastatic SKCM cohorts, where RNAseq profiles were transformed to log2 Counts per Million (CPM) and centered and scaled by gene expression values in the training data.
Eosinophil
The Eosinophil classifier was trained on Eosinophil population profiles as part of a Homo Sapiens micrroarray dataset of purified hematopoietic stem and progenitor cells and lymphocyte populations available under accession GSE2475967. A Support Vector Machine classifier with linear kernel was trained on this dataset using e1071 R package, leaving all other parameters in their default settings. The classifier was validated on an independent Eosinophil dataset available on GSE11573668. The correlation between ILC2/type 2 immune cells, eosinophils and gene expression was determined using the Spearman correlation implemented in base R software.
Extended Data
Extended Data Fig. 1. Flow cytometric analyses of innate lymphoid cell subsets in BRAFCA;PTENloxp;Tyr::CreERT2 mice.
a, Kinetics of individual tumor growth in BRAFCA;PTENloxp;Tyr::CreERT2 mice. Tumor induction was performed at day 0. Individual data were pooled from 3 independent experiments (n=16, 3-9 mice per experiment). Each line shows the growth curve for an individual mouse and the mean growth is shown in dark red. b, Representative flow cytometric contour plots showing the gating strategy used to identify tumor-infiltrating immune cell populations. c, Frequency of NK cells, ILC1, ILC2 and ILC3 within skin and tumors. The skin was collected from flank on the opposite side to tumor induction. Tumor and skin-resident immune cell populations were identified as indicated in b. Data are pooled from 4 independent experiments (n=14 mice; 2-5 mice/experiment). c, Each dot represents one mouse and data show mean ± s.e.m. Statistical analyses were performed using a Student’s paired t test. p-values are indicated.
Extended Data Fig. 2. Flow cytometric analyses of innate lymphoid cell subsets in Ret melanoma tumor-bearing mice.
a,b, Enumeration (a and b) and frequency (a) of NK cells, ILC1, ILC2 and ILC3 in tumors (a) and control and tumor-draining lymph nodes (b) at 7 and 17 days after Ret tumor cell inoculation of C57BL/6J mice. NK cells were CD45+CD3-TCRβ-CD19-(lin-)CD11b+/-NK1.1+NKp46+EOMES+CD49a-, ILC1 lin-CD11b+/-NK1.1+NKp46+EOMES-CD49a+; ILC2 lin-CD11b+/-NK1.1-NKp46-RORγt-GATA3+; ILC3 lin-CD11b+/-NK1.1-NKp46-RORγt+ GATA3- cells. Data pooled from 2 independent experiments with 4-6 mice/experiment/time-point (day 7, n=8 mice; day 17, n=12 mice). c-k, Intracellular cytokine production in in vitro stimulated ILC subsets from tumors in C57BL/6J mice at day 7 and 17 for IFN-g and TNF-a (c), IL-5 and IL-13 (f), and IL-17A and IL-22 (i) in NK cells and ILC1 (c), ILC2 (f) and ILC3 (i). Representative samples for each time point (n=4-6 mice/experiment). d,g and j, Heatmaps showing the log2 fold change between day 7 and 17 of the mean intracellular IFN-g (d), IL-5 and IL-13 (g), and IL-17A and IL-22 (j) in NK cells and ILC1 (d), ILC2 (g) and ILC3 (j) from different tissues. Data are pooled from 2 experiments (day 7, n=8 mice, except for the lung, n=4; day 17, n=12 mice; 4-6 mice per experiment/time point). Insufficient ILC1 were recovered from the contralateral lymph nodes for accurate data interpretation (indicated by a cross). e,h and k, Frequency of tumor-infiltrating IFN-g+ NK cells and ILC1 (e), IL-5+ and IL-13+ ILC2 (h), and IL-17A+ and IL-22+ ILC3 (k) relative to tumor weight (g). Data shows pooled results from day 7 (n=8) and 17 (n=12). a,b,e,h, and k, Each dot represents one mouse. a and b, Data show the mean ± s.e.m and statistical analyses were performed using unpaired Student’s t tests (a) or ANOVA followed with Tukey’s multiple comparison tests (b). e,h, and k, Correlations were assessed using non-parametric Spearman’s correlation test. Non-linear fitting curves (one-phase decay) were overlaid. Spearman’s Rho (rs) and p-values are indicated.
Extended Data Fig. 3. ILC2-dependent anti-tumor immunity in Il7rCre/+Roraρ/ρ mice.
a-e, Ret tumor growth and immune cell composition of Ly5.1+/+ chimeric mice reconstituted with C57BL/6J (CD45.2+/+) or Il7rCre/+Rora□/□ (CD45.2+/+) (5) bone marrow. a, Schematic representation of the experimental design. b, Ret tumor growth over time (left) and day 18 tumor size (right). Statistical analyses of tumor growth were performed using TumGrowth. Data represents one experiment with 6 mice/genotype and show the mean ± s.e.m. c-d, Representative flow cytometric contour plots (left panels) and enumeration (right panels) of intestinal (c) and tumor-infiltrating (d) ILC2 at day 13 after Ret tumor cell inoculation. ILC2 were defined as live CD45.2+lin-(CD3e-TCRb-CD19-CD11b-NKp46-RORgt-) CD90.2+GATA3+ cells. e, Enumeration of tumor infiltrating leukocytes cells at day 13 post Ret tumor inoculation. Leukocytes were defined as live CD45+; B cells as live CD45+CD3ε-TCRβ-CD19+; CD4+ T cells as live CD45+CD3ε+TCRβ+CD4+; CD8+ T cells as live CD45+CD3ε+TCRβ+CD8+; NK cells as live CD45+CD3ε-TCRβ-(lin-)CD19-NKp46+Eomes+; ILC1 as live lin-NKp46+Eomes-; and ILC3 as live lin-CD11b-NKp46-RORγt+. Data pooled from 2 independent experiments (n=6 mice/genotype/experiment) and show the mean ± s.e.m. b-e. Each circle represents one mouse and p-values are indicated.
Extended Data Fig. 4. ILC2-dependent anti-tumor immunity in ICOS-T mice.
Ret tumor growth and tumor immune cell composition of C57BL/6J and ICOS-T mice (CD4Cre/+ICOSfl-DTr/+) treated with PBS or rmIL-33 and/or diphtheria toxin (DTx). a, Experimental design and treatment regime for amplification and deletion of ILC2 in vivo. b, Ret tumor growth (left panel) and tumor weight (g) (right panel) at day 17. Data show the mean ± s.e.m. Each dot represents one mouse. Statistical differences were assessed using an unpaired Student’s t test between the groups ICOS-T + IL-33 and ICOS-T DTx + IL-33 and the p value is indicated. Data show C57BL/6J + PBS (tumor growth, n=3; tumor weight, n=2 mice), C57BL/6J + IL-33 (tumor growth, n=3; tumor weight, n=3 mice), ICOS-T + IL-33 (tumor growth, n=6; tumor weight, n=4 mice), ICOS-T + IL-33 + Dtx (tumor growth, n=6; tumor weight, n=4 mice). c,d, Representative flow cytometric contour plots (left panels) and quantification (middle panels) of tumor-infiltrating ILC2 (CD45+lin-(CD3e-TCRb-CD11b-NK1.1-NKp46-) RORgt-GATA3+) and regulatory CD4+ T cells (Tregs, CD45+CD3e+TCRb+CD8-CD4+CD25+Foxp3+) in each treatment. Data show mean ± s.e.m. (middle panels). Dot plots show the correlation of the frequency of (c, right) tumor infiltrating ILC2 or (d, right) Tregs with tumor weight (g) (right panels). Individual data points are colored by experimental group. Correlations were assessed using non-parametric Spearman’s correlation tests and overlaid by linear regression curves. Each dot represents one mouse (n=13 mice). Spearman’s Rho (rs) and p-values are indicated. e, Frequency of tumor-infiltrating CD8+ (live CD45+CD3e+TCRb+CD8+CD4-) T cells. Data show mean ± s.e.m (left panel). Dot plots showing correlation between the frequency of tumor-infiltrating CD8+ T cells and tumor weight (g) (right panel). Individual data points are colored by experimental group. The correlation was assessed using a non-parametric Spearman’s correlation test. A simple linear regression curve was been overlaid on data for individual animals (n=13) from one experiment. Spearman’s Rho and p-values are indicated.
Extended Data Fig. 5. Internal validation and prognosis of an ILC2/type 2 immune cell signature in human melanoma.
a,b, ILC2 infiltration probability is predicted from NanoString transcriptome profiles, which measures a panel of 730 genes. For each patient, the predicted infiltration probability is correlated with IHC markers (a) and immune cell infiltration estimates (b) from Pan Immune multiplex IHC obtained from that patient. Spearman correlation values are indicated. c, Analysis of the impact of enrichment of type 2 immune cell infiltration on melanoma patient survival using the publicly available TCGA database. Tumor infiltration probability was determined as described in the Methods using machine learning. Kaplan-Meier overall survival curves of metastatic melanomas (n=367) plotted against the likelihood of high and low infiltration of tumors by ILC2. f, Kaplan-Meier survival statistical analysis was performed using a Log-rank test. p-value is indicated.
Extended Data Fig. 6. Ret tumor-infiltrating ILC2 express high levels of GM-CSF and high Csf2 expression in human melanoma tumors is associated with increased survival.
a, Representative flow cytometric full gating strategy used to identify GM-CSF-expressing ILC2 in Ret melanoma tumors 7 days after tumor inoculation. GM-CSF expression in other immune and non-immune cell subsets is also depicted. b, Frequency of GM-CSF producing cells in Ret melanoma tumors. Each circle represents one mouse and data and show mean ± s.e.m. Data are pooled from 2 independent experiments (n=12 mice) with 6 mice/experiment. c, Representative flow-cytometric gating strategy used to identify polyfunctional ILC2 (IL-5+IL-13+GM-CSF+). a-c, Single cell suspensions of digested tumor cells were stimulated with 50 ng/ml PMA, 500 ng/ml ionomycin in the presence of GolgiStop™ for 4h before intracellular staining for IL-5, IL-13 and GM-CSF. b, Each circle represents one mouse and data show mean ± s.e.m. and are pooled from 2 independent experiments with 6 mice/experiments. a and c, Data show one of two independent experiments performed with 6 mice/experiment. d,e, Analysis of the publicly available TCGA database. d, Plot shows tumor CSF2 gene expression according to type 2 immune cell tumor enrichment probabilities in individual human metastatic melanoma samples. Tumor enrichment probabilities were determined as described in the Material and Methods using machine learning. Mean difference in CSF2 expression between TCGA metastatic samples predicted with type 2 immune cell infiltration (red) or no infiltration (blue). Data show statistical significance was determined by Student’s t test. e, Kaplan-Meier overall survival curves of metastatic melanomas (n=367) plotted against the likelihood of high and low tumor CSF2 expression. Kaplan-Meier survival statistical analysis was performed using a Log-rank test. p-value is indicated.
Extended Data Fig. 7. Reduced eosinophils in Ret tumor-bearing ILC2 deficient mice.
Myeloid immune cell composition of Ly5.1+/+ chimeric mice reconstituted with C57BL/6J (CD45.2+/+) or Il7rCre/+RoraΔ/Δ (CD45.2+/+) (5) bone marrow. a, Schematic representation of the experimental design. b-d, Representative flow cytometric contour plots (left panels) and enumeration (right panels) of splenic (b) and tumor-infiltrating (c and d) eosinophils, dendritic cells (DC), neutrophils and macrophages at day 13 after Ret tumor cell inoculation. Immune subsets were defined as eosinophils: live CD45.2+CD64-F4/80-CD3e-CD19-CD11c+/-MHCII+/-CD11b+Siglec-F+Ly6G- cells; DC: live CD45.2+CD64-F4/80-CD3e-CD19-CD11c+MHCII+ cells; macrophages: live CD45.2+CD64+F4/80+ cells; neutrophils: live CD45.2+CD64-F4/80-CD3e-CD19-CD11c+/-MHC II+/-CD11b+Siglec-F-Ly6G+ cells. d, Tumor-infiltrating DC were segregated into CD11b+ DC and CD103+ DC. b-d, Data are pooled from 2 independent experiments (n=6 mice/genotype/experiment) and show the mean ± s.e.m. Each dot represents one mouse. b-f, Statistical differences were assessed using unpaired Student’s t tests and exact p-values are indicated.
Extended Data Fig. 8. ILC2/type 2 immune cell enriched human melanoma tumors are associated with increased eosinophil infiltration and gene expression.
a and b, Analysis of the impact of tumor ILC2 and eosinophil infiltration on melanoma patient survival using the publicly available TCGA database. a, Dot plot of the probability of tumor eosinophil infiltration versus the probability of type 2 immune cell tumor enrichment in human metastatic melanoma samples (n = 367 tumors). Tumor-infiltration probabilities were determined as described in the Material and Methods using machine learning. The correlation was assessed by using Pearson’s correlation test. Each dot represents one human sample b, Kaplan-Meier overall survival curves of metastatic melanomas (n=367) plotted against to the likelihood of the high and low infiltration of tumors by type 2 immune cells and eosinophils. Kaplan-Meier survival statistical analysis was performed using a Log-rank test. p-value is indicated. c, Pearson’s correlation analyses of the tumor-infiltrating ILC2 and eosinophil probabilities with CSF2, IL33, IL5, GATA2, RNASE3, EPX, PRG2, TNF and IFNG genes in metastatic tumor melanoma samples available from the publicly TCGA database. Populations and genes that were found to positively and negatively correlate between the indicated populations are shown in red or blue, respectively. Circle size represents the strength of the correlation between two populations.
Extended Data Fig. 9. PD-1 inhibits tissue ILC2 accumulation and ILC2 proliferation.
Flow cytometric analyses of immune cells subsets in intestinal tissues and bone marrow collected from C57BL/6J and Pdcd1-/- mice at steady-state. a, Representative flow cytometric histogram showing PD-1 expression on C57BL/6J and Pdcd1-/- intestinal ILC2. Representative of 3 independent experiments (n=3 mice/experiment) with similar PD-1 expression on C57BL/6J ILC2. b, Enumeration of ILC2 in the mesenteric lymph node (left) and the lamina propria of the small intestine collected (right) from C57BL/6J and Pdcd1-/- mice. Data (C57BL6, n=9 mice; Pdcd1-/-, n=8 mice) are pooled from 3 independent experiments with 2-3 mice/genotype/experiment. c, Schematic representation of the experimental design (top) and frequency of bone marrow derived ILC2 in the mesenteric lymph nodes and small intestine of mixed bone marrow chimeric mice (bottom). Data are pooled from 2 independent experiments (n=12 mice; 6 mice/experiment). d, Flow cytometric contour plots (left panels) and quantification (right panels) of proliferation (Ki67+ cells) in ILC2 isolated from the mesenteric lymph nodes and small intestine of mixed bone marrow chimeric mice. Data are pooled from 2 independent experiments (n=12 mice; 6 mice/experiment). b-d, Each circle represents one mouse and data show mean ± s.e.m. Statistical analyses were performed using paired (d) and unpaired (b) Student’s t tests or ANOVA followed with Tukey’s multiple comparison tests (c). p-values are indicated.
Extended Data Fig. 10. IL-33 stimulation induces expansion and proliferation of KLRG1+ ILC2 associated with increased cytokines production and PD-1 expression.
a-f, Flow cytometric analyses of the impact of IL-33 stimulation on purified intestinal ILC2. Live ILC2 were identified as follow: CD45+CD3-CD19-TCRβ-CD11b-NK1.1-c-kit-Sca-1+KLRG1+/-. a, Experimental design. Purified intestinal ILC2 were cultured for 2 and 5 days in complete media supplemented with rIL-7 or rIL-7+rIL-33 (all 40 ng/ml) before flow cytometric analyses. b, ILC2 enumeration. c-e, Representative flow-cytometric contour plots (c, d and e, left panels) and frequencies or geometrical mean fluorescent intensities of KLRG1 (c, middle panel), Ki-67 (c, right), IL-5 (d) and GM-CSF (e). c-e Data show one of two experiments showing individual responses (open circles) and the mean of three biological replicates. Flow cytometric contour plots depict a representative analysis performed at day 5 of culture. f, GM-CSF concentration in culture supernatant of purified human ILC2 isolated from the blood of three healthy donors and stimulated with rIL-2 (5 ng/ml) or rIL-2+rIL-33 (5 ng/ml and 10 ng/ml, respectively). ILC2 were identified as Live+CD45+lin-(TCRαβ-TCRγδ-CD14-CD3-CD19-CD34-FcεRI-CD123-CD303-CD15-CD33-CD11c-CD56-CD16-) CD127+ CRTH2+. Data show the mean GM-CSF production of 3 healthy donors pooled from two independent experiments. N.D., not detected. g, Histograms (left panel) and frequencies (right panel) of PD-1 expression on wild-type and Pdcd1-/- ILC2 (2.5 × 10³ cells/well) cultured in vitro for 2 and 5 days in complete media supplemented with rIL-7 or rIL-7+rIL-33 (all 40 ng/ml). Data show the mean of three biological replicates. h, Representative flow-cytometric contour plots showing PD-1 expression on purified human ILC2 isolated from blood of healthy donors after two days of stimulation with rIL-2 (5 ng/ml) or rIL-2+rIL-33 (5 ng/ml and 10 ng/ml, respectively). ILC2 were identified as in f. One representative healthy donor out of two yielding similar results is shown. b-f, Statistical analyses were performed using paired Student’s t-test. p-values are indicated.
Supplementary Material
Acknowledgments
We thank J. Janssen, S. Cree, S. Shaw, E. Mettes, J. Leahy, F. Almeida, E. Pan, A. Johnston, D. Tantalo, members of the Belz, Neeson and Nutt laboratories, and members of the Flow Cytometry, Histology and Bioservices facilities at the Walter and Eliza Hall Institute of Medical Research for technical assistance and for helpful discussions. We express our gratitude to J. Cockwill, our long-term consumer representative, for fruitful discussions and significant consumer input. We are grateful to S. Wilcox and the Genomics platform for their technical help with scRNA sequencing. The results published here are in part based upon data generated by the TCGA Research Network: https://www.cancer.gov/tcga. This work was supported by grants and fellowships from the National Health and Medical Research Council (NHMRC) of Australia (1165443, 1122277, 1054925, 1135898 to G.T.B., 1165443 and 1123000 to C.S., 1175134 to P.M.H., 1113577 and 1154325 to I.W., 1158024 to D.H.D.G., 1140406 to F.S-F-G., 1155342 to S.L.N., and 1196235 to M.Ch.), Reid Charitable Trusts (I.W.), a grant to The University of Queensland Chair of Immunology (Diamantina Institute, G.T.B.), Cancer Council NSW (RG 21-05 to G.T.B. and N.J.), Cure Cancer Australia and Cancer Australia through the Cancer Australia Priority-driven Cancer Research Scheme (1163990 to N.J., 1158085 to F.S-F-G.), a fellowship from the Foundation ARC pour la recherche sur le cancer (NJ), Centenary Fellowships of the Walter and Eliza Hall Institute (sponsored by CSL Limited, to J.G. and W.S.), a fellowship from the Victorian Government Department of Health and Human Services acting through the Victorian Cancer Agency (A.B.), and the Deutsche Forschungsgemeinschaft (DFG, German Research Foundation - 259332240/RTG 2099 to V.U.) and scholarships of the Australian Government Research Training Program (Q.H.) and Melbourne Research Scholarship (S.Z.). A.N.J.M. was supported by the UK Medical Research Council (U105178805). A.M. is supported by the US-Israel Bi-national Science Foundation (grant no. 2015163), the Israel Science Foundation (grants no. 886/15 and 542/20), the Israel Cancer Research Fund, the Richard Eimert Research Fund on Solid Tumors (TAU), the Israel Cancer Association Avraham Rotstein Donation, the Cancer Biology Research Center (TAU) and the Emerson Collective. This research was carried out in part at the Translational Research Institute, Woolloongabba, QLD 4102, Australia. The Translational Research Institute is supported by a grant from the Australian Government. This work was supported through Victorian State Government Operational Infrastructure Support and Australian Government NHMRC IRIIS.
Footnotes
Author contributions
N.J. and G.T.B. supervised the study and wrote the manuscript with the input of all the coauthors. N.J., C.S. and G.T.B. designed the experiments, analyzed and interpreted data and designed figures. N.J., C.S., A.P., M.W., S.G-T., C.L., Q.H., J.S., F.S-F-G., K..T, S.M., M.Ca., K.L., S.Z., M.Ch. and T.M.H. performed experiments. Y.L. and SH-z. performed bioinformatics analyses under the supervision of W.S. and M.J.D. M.W., A.P. and S.M. performed CyTOF analyses. M.W. and K.T. performed multiplex I.H.C. analyses. C.A.dG., S.L.N., V.U., B.C., J.R.G., P.S.F., P.M.H., A.N.J.M., D.H.D.G., A.B., J.C., E.V., I.W., J.A.T., A.M., M.J.D., W.S. and P.J.N. provided tools, reagents, mouse strains and intellectual input. A.P., Y.L., S.H-z. and M.J.D., W.S., P.N. contributed equally to this work. All authors reviewed, edited, provided input and approved the manuscript before submission.
Competing interests
E.V. is an employee of Innate Pharma. F.S-F-G. is a consultant and has a funded research agreement with Biotheus Inc. P.N. has received research funding from Bristol Myers Squibb, Roche Genentech, Merck Sharp & Dohme, CRISPR Therapeutics, Allergan and Compugen. Other authors declare no competing interests.
Reporting Summary. Further information on research design is available in the Nature Research Reporting Summary linked to this article.
Additional information
Supplementary Information and Extended Data are available for this paper.
Data and materials availability
Single cell RNA sequencing data that support the findings of this study have been deposited with the Gene Expression Omnibus (GEO) repository under accession number GSE149615. Source code for statistical learning models is publicly available at: https://github.com/DavisLaboratory/Jacquelot_2021_reproducibility. All the data to evaluate the conclusions in this paper are present either in the main text, extended data or in supplementary materials.
References
- 1.Park SL, et al. Tissue-resident memory CD8(+) T cells promote melanoma-immune equilibrium in skin. Nature. 2019;565:366–371. doi: 10.1038/s41586-018-0812-9. [DOI] [PubMed] [Google Scholar]
- 2.Gebhardt T, Palendira U, Tscharke DC, Bedoui S. Tissue-resident memory T cells in tissue homeostasis, persistent infection, and cancer surveillance. Immunol Rev. 2018;283:54–76. doi: 10.1111/imr.12650. [DOI] [PubMed] [Google Scholar]
- 3.Bruggen MC, et al. In Situ Mapping of Innate Lymphoid Cells in Human Skin: Evidence for Remarkable Differences between Normal and Inflamed Skin. J Invest Dermatol. 2016;136:2396–2405. doi: 10.1016/j.jid.2016.07.017. [DOI] [PubMed] [Google Scholar]
- 4.Salimi M, et al. Activated innate lymphoid cell populations accumulate in human tumour tissues. BMC Cancer. 2018;18:341. doi: 10.1186/s12885-018-4262-4. [DOI] [PMC free article] [PubMed] [Google Scholar]
- 5.Bie Q, et al. Polarization of ILC2s in peripheral blood might contribute to immunosuppressive microenvironment in patients with gastric cancer. J Immunol Res. 2014;2014:923135. doi: 10.1155/2014/923135. [DOI] [PMC free article] [PubMed] [Google Scholar]
- 6.Moral JA, et al. ILC2s amplify PD-1 blockade by activating tissue-specific cancer immunity. Nature. 2020;579:130–135. doi: 10.1038/s41586-020-2015-4. [DOI] [PMC free article] [PubMed] [Google Scholar]
- 7.Trabanelli S, et al. Tumour-derived PGD2 and NKp30-B7H6 engagement drives an immunosuppressive ILC2-MDSC axis. Nat Commun. 2017;8:593. doi: 10.1038/s41467-017-00678-2. [DOI] [PMC free article] [PubMed] [Google Scholar]
- 8.Suzuki A, Leland P, Joshi BH, Puri RK. Targeting of IL-4 and IL-13 receptors for cancer therapy. Cytokine. 2015;75:79–88. doi: 10.1016/j.cyto.2015.05.026. [DOI] [PubMed] [Google Scholar]
- 9.Zaiss DMW, Gause WC, Osborne LC, Artis D. Emerging functions of amphiregulin in orchestrating immunity, inflammation, and tissue repair. Immunity. 2015;42:216–226. doi: 10.1016/j.immuni.2015.01.020. [DOI] [PMC free article] [PubMed] [Google Scholar]
- 10.Busser B, Sancey L, Brambilla E, Coll JL, Hurbin A. The multiple roles of amphiregulin in human cancer. Biochim Biophys Acta. 2011;1816:119–131. doi: 10.1016/j.bbcan.2011.05.003. [DOI] [PubMed] [Google Scholar]
- 11.Chevalier MF, et al. ILC2-modulated T cell-to-MDSC balance is associated with bladder cancer recurrence. J Clin Invest. 2017;127:2916–2929. doi: 10.1172/JCI89717. [DOI] [PMC free article] [PubMed] [Google Scholar]
- 12.Saranchova I, et al. Type 2 Innate Lymphocytes Actuate Immunity Against Tumours and Limit Cancer Metastasis. Sci Rep. 2018;8:2924. doi: 10.1038/s41598-018-20608-6. [DOI] [PMC free article] [PubMed] [Google Scholar]
- 13.Huang Q, et al. Type 2 Innate Lymphoid Cells Protect against Colorectal Cancer Progression and Predict Improved Patient Survival. Cancers (Basel) 2021;13 doi: 10.3390/cancers13030559. [DOI] [PMC free article] [PubMed] [Google Scholar]
- 14.Wagner M, et al. Tumor-Derived Lactic Acid Contributes to the Paucity of Intratumoral ILC2s. Cell Rep. 2020;30:2743–2757.:e2745. doi: 10.1016/j.celrep.2020.01.103. [DOI] [PubMed] [Google Scholar]
- 15.Lucarini V, et al. IL-33 restricts tumor growth and inhibits pulmonary metastasis in melanoma-bearing mice through eosinophils. Oncoimmunology. 2017;6:e1317420. doi: 10.1080/2162402X.2017.1317420. [DOI] [PMC free article] [PubMed] [Google Scholar]
- 16.Schuijs MJ, et al. ILC2-driven innate immune checkpoint mechanism antagonizes NK cell antimetastatic function in the lung. Nat Immunol. 2020 doi: 10.1038/s41590-020-0745-y. [DOI] [PMC free article] [PubMed] [Google Scholar]
- 17.Long A, et al. Type 2 Innate Lymphoid Cells Impede IL-33-Mediated Tumor Suppression. J Immunol. 2018;201:3456–3464. doi: 10.4049/jimmunol.1800173. [DOI] [PMC free article] [PubMed] [Google Scholar]
- 18.Grisaru-Tal S, Itan M, Klion AD, Munitz A. A new dawn for eosinophils in the tumour microenvironment. Nat Rev Cancer. 2020 doi: 10.1038/s41568-020-0283-9. [DOI] [PubMed] [Google Scholar]
- 19.Moreira A, Leisgang W, Schuler G, Heinzerling L. Eosinophilic count as a biomarker for prognosis of melanoma patients and its importance in the response to immunotherapy. Immunotherapy. 2017;9:115–121. doi: 10.2217/imt-2016-0138. [DOI] [PubMed] [Google Scholar]
- 20.Hollande C, et al. Inhibition of the dipeptidyl peptidase DPP4 (CD26) reveals IL-33-dependent eosinophil-mediated control of tumor growth. Nat Immunol. 2019;20:257–264. doi: 10.1038/s41590-019-0321-5. [DOI] [PubMed] [Google Scholar]
- 21.Ercolano G, Falquet M, Vanoni G, Trabanelli S, Jandus C. ILC2s: New Actors in Tumor Immunity. Front Immunol. 2019;10:2801. doi: 10.3389/fimmu.2019.02801. [DOI] [PMC free article] [PubMed] [Google Scholar]
- 22.Dankort D, et al. Braf(V600E) cooperates with Pten loss to induce metastatic melanoma. Nat Genet. 2009;41:544–552. doi: 10.1038/ng.356. [DOI] [PMC free article] [PubMed] [Google Scholar]
- 23.Putz EM, et al. Targeting cytokine signaling checkpoint CIS activates NK cells to protect from tumor initiation and metastasis. Oncoimmunology. 2017;6:e1267892. doi: 10.1080/2162402X.2016.1267892. [DOI] [PMC free article] [PubMed] [Google Scholar]
- 24.Knight DA, et al. Host immunity contributes to the anti-melanoma activity of BRAF inhibitors. J Clin Invest. 2013;123:1371–1381. doi: 10.1172/JCI66236. [DOI] [PMC free article] [PubMed] [Google Scholar] [Retracted]
- 25.Routy B, et al. Gut microbiome influences efficacy of PD-1-based immunotherapy against epithelial tumors. Science. 2018;359:91–97. doi: 10.1126/science.aan3706. [DOI] [PubMed] [Google Scholar]
- 26.Sathe P, et al. Innate immunodeficiency following genetic ablation of Mcl1 in natural killer cells. Nat Commun. 2014;5:4539. doi: 10.1038/ncomms5539. [DOI] [PubMed] [Google Scholar]
- 27.Eberl G, et al. An essential function for the nuclear receptor ROR gamma t in the generation of fetal lymphoid tissue inducer cells. Nature Immunology. 2004;5:64–73. doi: 10.1038/ni1022. [DOI] [PubMed] [Google Scholar]
- 28.Seillet C, et al. Deciphering the Innate Lymphoid Cell Transcriptional Program. Cell Rep. 2016;17:436–447. doi: 10.1016/j.celrep.2016.09.025. [DOI] [PubMed] [Google Scholar]
- 29.Aran D, et al. Reference-based analysis of lung single-cell sequencing reveals a transitional profibrotic macrophage. Nat Immunol. 2019;20:163–172. doi: 10.1038/s41590-018-0276-y. [DOI] [PMC free article] [PubMed] [Google Scholar]
- 30.Louis C, et al. NK cell-derived GM-CSF potentiates inflammatory arthritis and is negatively regulated by CIS. J Exp Med. 2020;217 doi: 10.1084/jem.20191421. [DOI] [PMC free article] [PubMed] [Google Scholar]
- 31.Codarri L, et al. RORgammat drives production of the cytokine GM-CSF in helper T cells, which is essential for the effector phase of autoimmune neuroinflammation. Nat Immunol. 2011;12:560–567. doi: 10.1038/ni.2027. [DOI] [PubMed] [Google Scholar]
- 32.Taube JM, et al. Colocalization of inflammatory response with B7-h1 expression in human melanocytic lesions supports an adaptive resistance mechanism of immune escape. Sci Transl Med. 2012;4:127ra137. doi: 10.1126/scitranslmed.3003689. [DOI] [PMC free article] [PubMed] [Google Scholar]
- 33.Jacquelot N, et al. Immunophenotyping of Stage III Melanoma Reveals Parameters Associated with Patient Prognosis. J Invest Dermatol. 2016;136:994–1001. doi: 10.1016/j.jid.2015.12.042. [DOI] [PMC free article] [PubMed] [Google Scholar]
- 34.Jacquelot N, et al. Immune biomarkers for prognosis and prediction of responses to immune checkpoint blockade in cutaneous melanoma. Oncoimmunology. 2017;6:e1299303. doi: 10.1080/2162402X.2017.1299303. [DOI] [PMC free article] [PubMed] [Google Scholar]
- 35.Mortha A, et al. Microbiota-dependent crosstalk between macrophages and ILC3 promotes intestinal homeostasis. Science. 2014;343:1249288. doi: 10.1126/science.1249288. [DOI] [PMC free article] [PubMed] [Google Scholar]
- 36.Pearson C, et al. ILC3 GM-CSF production and mobilisation orchestrate acute intestinal inflammation. Elife. 2016;5:e10066. doi: 10.7554/eLife.10066. [DOI] [PMC free article] [PubMed] [Google Scholar]
- 37.Demaria O, et al. Harnessing innate immunity in cancer therapy. Nature. 2019;574:45–56. doi: 10.1038/s41586-019-1593-5. [DOI] [PubMed] [Google Scholar]
- 38.Hoeller C, Michielin O, Ascierto PA, Szabo Z, Blank CU. Systematic review of the use of granulocyte-macrophage colony-stimulating factor in patients with advanced melanoma. Cancer Immunol Immunother. 2016;65:1015–1034. doi: 10.1007/s00262-016-1860-3. [DOI] [PMC free article] [PubMed] [Google Scholar]
- 39.Liu H, et al. Quantitative analysis of long-term virus-specific CD8+-T-cell memory in mice challenged with unrelated pathogens. J Virol. 2003;77:7756–7763. doi: 10.1128/JVI.77.14.7756-7763.2003. [DOI] [PMC free article] [PubMed] [Google Scholar]
- 40.Kim-Schulze S, Kim HS, Fan Q, Kim DW, Kaufman HL. Local IL-21 promotes the therapeutic activity of effector T cells by decreasing regulatory T cells within the tumor microenvironment. Mol Ther. 2009;17:380–388. doi: 10.1038/mt.2008.249. [DOI] [PMC free article] [PubMed] [Google Scholar]
- 41.Ikutani M, et al. Identification of innate IL-5-producing cells and their role in lung eosinophil regulation and antitumor immunity. J Immunol. 2012;188:703–713. doi: 10.4049/jimmunol.1101270. [DOI] [PubMed] [Google Scholar]
- 42.Reichman H, et al. Activated Eosinophils Exert Antitumorigenic Activities in Colorectal Cancer. Cancer Immunol Res. 2019;7:388–400. doi: 10.1158/2326-6066.CIR-18-0494. [DOI] [PubMed] [Google Scholar]
- 43.Broz ML, et al. Dissecting the tumor myeloid compartment reveals rare activating antigen-presenting cells critical for T cell immunity. Cancer cell. 2014;26:638–652. doi: 10.1016/j.ccell.2014.09.007. [DOI] [PMC free article] [PubMed] [Google Scholar]
- 44.Greter M, et al. GM-CSF controls nonlymphoid tissue dendritic cell homeostasis but is dispensable for the differentiation of inflammatory dendritic cells. Immunity. 2012;36:1031–1046. doi: 10.1016/j.immuni.2012.03.027. [DOI] [PMC free article] [PubMed] [Google Scholar]
- 45.Yu Y, et al. Single-cell RNA-seq identifies a PD-1hi ILC progenitor and defines its development pathway. Nature. 2016;539:102–106. doi: 10.1038/nature20105. [DOI] [PubMed] [Google Scholar]
- 46.Liu X, Hogg GD, DeNardo DG. Rethinking immune checkpoint blockade: ‘Beyond the T cell’. J Immunother Cancer. 2021;9 doi: 10.1136/jitc-2020-001460. [DOI] [PMC free article] [PubMed] [Google Scholar]
- 47.Helou DG, et al. PD-1 pathway regulates ILC2 metabolism and PD-1 agonist treatment ameliorates airway hyperreactivity. Nat Commun. 2020;11:3998. doi: 10.1038/s41467-020-17813-1. [DOI] [PMC free article] [PubMed] [Google Scholar]
- 48.Ribas A, et al. Oncolytic Virotherapy Promotes Intratumoral T Cell Infiltration and Improves Anti-PD-1 Immunotherapy. Cell. 2017;170:1109–1119.:e1110. doi: 10.1016/j.cell.2017.08.027. [DOI] [PMC free article] [PubMed] [Google Scholar]
- 49.Chesney J, et al. Randomized, Open-Label Phase II Study Evaluating the Efficacy and Safety of Talimogene Laherparepvec in Combination With Ipilimumab Versus Ipilimumab Alone in Patients With Advanced, Unresectable Melanoma. J Clin Oncol. 2018;36:1658–1667. doi: 10.1200/JCO.2017.73.7379. [DOI] [PMC free article] [PubMed] [Google Scholar]
- 50.Seremet T, et al. Successful treatment with intralesional talimogene laherparepvec in two patients with immune checkpoint inhibitor-refractory, advanced-stage melanoma. Melanoma Res. 2019;29:85–88. doi: 10.1097/CMR.0000000000000501. [DOI] [PubMed] [Google Scholar]
- 51.Garcia S, DiSanto J, Stockinger B. Following the development of a CD4 T cell response in vivo: from activation to memory formation. Immunity. 1999;11:163–171. doi: 10.1016/s1074-7613(00)80091-6. [DOI] [PubMed] [Google Scholar]
- 52.Narni-Mancinelli E, et al. Fate mapping analysis of lymphoid cells expressing the NKp46 cell surface receptor. PNAS. 2011;108:18324–18329. doi: 10.1073/pnas.1112064108. [DOI] [PMC free article] [PubMed] [Google Scholar]
- 53.Oliphant CJ, et al. MHCII-Mediated Dialog between Group 2 Innate Lymphoid Cells and CD4(+) T Cells Potentiates Type 2 Immunity and Promotes Parasitic Helminth Expulsion. Immunity. 2014;41:283–295. doi: 10.1016/j.immuni.2014.06.016. [DOI] [PMC free article] [PubMed] [Google Scholar]
- 54.Jackson JT, et al. Id2 expression delineates differential checkpoints in the genetic program of CD8alpha(+) and CD103(+) dendritic cell lineages. EMBO J. 2011;30:2690–2704. doi: 10.1038/emboj.2011.163. [DOI] [PMC free article] [PubMed] [Google Scholar]
- 55.Kara EE, et al. CCR2 defines in vivo development and homing of IL-23-driven GM-CSF-producing Th17 cells. Nat Commun. 2015;6:8644. doi: 10.1038/ncomms9644. [DOI] [PMC free article] [PubMed] [Google Scholar]
- 56.Keir ME, Freeman GJ, Sharpe AH. PD-1 regulates self-reactive CD8+ T cell responses to antigen in lymph nodes and tissues. J Immunol. 2007;179:5064–5070. doi: 10.4049/jimmunol.179.8.5064. [DOI] [PubMed] [Google Scholar]
- 57.Dranoff G, et al. Involvement of granulocyte-macrophage colony-stimulating factor in pulmonary homeostasis. Science. 1994;264:713–716. doi: 10.1126/science.8171324. [DOI] [PubMed] [Google Scholar]
- 58.Lee NA, et al. Expression of IL-5 in thymocytes/T cells leads to the development of a massive eosinophilia, extramedullary eosinophilopoiesis, and unique histopathologies. J Immunol. 1997;158:1332–1344. [PubMed] [Google Scholar]
- 59.Yu C, et al. Targeted deletion of a high-affinity GATA-binding site in the GATA-1 promoter leads to selective loss of the eosinophil lineage in vivo. J Exp Med. 2002;195:1387–1395. doi: 10.1084/jem.20020656. [DOI] [PMC free article] [PubMed] [Google Scholar]
- 60.Lee JJ, et al. Defining a link with asthma in mice congenitally deficient in eosinophils. Science. 2004;305:1773–1776. doi: 10.1126/science.1099472. [DOI] [PubMed] [Google Scholar]
- 61.Kato M, et al. Transgenic mouse model for skin malignant melanoma. Oncogene. 1998;17:1885–1888. doi: 10.1038/sj.onc.1202077. [DOI] [PubMed] [Google Scholar]
- 62.Bankhead P, et al. QuPath: Open source software for digital pathology image analysis. Sci Rep. 2017;7:16878. doi: 10.1038/s41598-017-17204-5. [DOI] [PMC free article] [PubMed] [Google Scholar]
- 63.Cao Y, et al. Potent Neutralizing Antibodies against SARS-CoV-2 Identified by High-Throughput Single-Cell Sequencing of Convalescent Patients’ B Cells. Cell. 2020;182:73–84.:e16. doi: 10.1016/j.cell.2020.05.025. [DOI] [PMC free article] [PubMed] [Google Scholar]
- 64.Adams TS, et al. Single-cell RNA-seq reveals ectopic and aberrant lung-resident cell populations in idiopathic pulmonary fibrosis. Sci Adv. 2020;6:eaba1983. doi: 10.1126/sciadv.aba1983. [DOI] [PMC free article] [PubMed] [Google Scholar]
- 65.Bjorklund AK, et al. The heterogeneity of human CD127(+) innate lymphoid cells revealed by single-cell RNA sequencing. Nat Immunol. 2016;17:451–460. doi: 10.1038/ni.3368. [DOI] [PubMed] [Google Scholar]
- 66.Ricardo-Gonzalez RR, et al. Tissue signals imprint ILC2 identity with anticipatory function. Nat Immunol. 2018;19:1093–1099. doi: 10.1038/s41590-018-0201-4. [DOI] [PMC free article] [PubMed] [Google Scholar]
- 67.Novershtern N, et al. Densely interconnected transcriptional circuits control cell states in human hematopoiesis. Cell. 2011;144:296–309. doi: 10.1016/j.cell.2011.01.004. [DOI] [PMC free article] [PubMed] [Google Scholar]
- 68.Choi J, et al. Haemopedia RNA-seq: a database of gene expression during haematopoiesis in mice and humans. Nucleic Acids Res. 2019;47:D780–D785. doi: 10.1093/nar/gky1020. [DOI] [PMC free article] [PubMed] [Google Scholar]
Associated Data
This section collects any data citations, data availability statements, or supplementary materials included in this article.
Supplementary Materials
Data Availability Statement
Single cell RNA sequencing data that support the findings of this study have been deposited with the Gene Expression Omnibus (GEO) repository under accession number GSE149615. Source code for statistical learning models is publicly available at: https://github.com/DavisLaboratory/Jacquelot_2021_reproducibility. All the data to evaluate the conclusions in this paper are present either in the main text, extended data or in supplementary materials.


