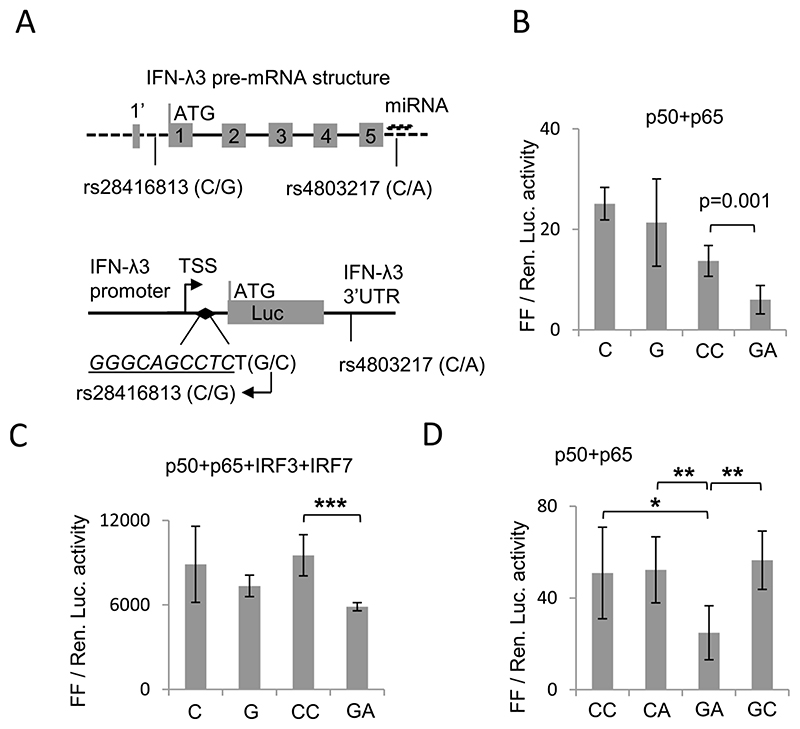
Fig. 1. Effect of SNPs rs28416813 and rs4803217 on reporter gene expression.
A) (Top) Structure of the pre-mRNA of IFN-λ3 showing presence of 5 exons. The first exon is split such that the first three amino acids (1’) are encoded in the shorter arm and the remaining amino acids are encoded by the longer arm. The dark line shows introns while dashed lines show UTRs. The SNP rs4803217 overlaps the miRNA binding sites identified in Ref. no. (29); miRNA is shown above the SNP. Depending on whether IFN-λ3 has a split first exon or not, the SNP rs28416813 is either present in the 5’UTR or in the first intron of IFN-λ3. (bottom) Schematic showing the positions of SNPs rs28416813 and rs4803217 within the constructs used in the study. A 1.4 kb DNA fragment upstream of the start codon of IFN-λ3 gene (as shown in top panel) containing the SNP rs28416813 at 37 bp upstream of the start codon and one base pair away from a NF-κB binding site (inverted filled diamond, sequence in italics and underlined) is shown. The 154 bp IFN-λ3 3’UTR is shown downstream of the Luciferase (Luc) gene carrying the SNP rs4803217. The top arrow shows transcription start site (TSS). B) Ancestral alleles G and A at rs28416813 and rs4803217 significantly decrease reporter gene expression. The construct p1.4kbIFNL3 or p1.4kbIFNL3-3’UTR were transfected in HEK293T cells. The experiments were carried out in 96-well plates. The data is from six separate experiments representing three different plasmid preparations. The mean value from all six experiments is shown, while the error bars depict SD. C) Similar to B, except that additional TFs IRF3 and IRF7 were overexpressed and experiments were carried out in 12-well plates. D) The non-ancestral alleles at rs28416813 and rs4803217 have dominant effects on each other while ancestral alleles at both rs28416813 and rs4803217 in combination have a negative effect on reporter gene expression. The experiments were carried out in 96-well plates seeded with HEK293T cells and transfected with p1.4kbIFNL3-3’UTR carrying different allele combinations at the two SNP positions rs28416813 (C/G) and rs4803217 (C/A) respectively as shown. The data is from six separate experiments representing three different plasmid preparations. The mean value from all six experiments is shown, while the error bars depict SD. For B, C and D two tailed student t-test for independent means was used for calculating statistical significance; *p < 0.05, **p < 0.01; ***p < 0.001. All the Luciferase ratio values from each individual experiment are shown in Suppl. Table 1.

