Abstract
Conventional quantitative assessments of myocardial perfusion analyze the temporal relation between the arterial input function and the myocardial signal intensity curves, thereby neglecting the important spatial relation between the myocardial signal intensity curves. The new method presented in this article enables characterization of sub-endocardial to sub-epicardial gradients in myocardial perfusion based on a two dimensional, “gradientogram” representation, which displays the evolution of the transmural gradient in myocardial contrast uptake over time in all circumferential positions of the acquired images. Moreover, based on segmentation in these gradientograms, several new measurements that characterize transmural myocardial perfusion distribution over time are defined. In application to clinical image data, the new two-dimensional representations, as well as the newly defined measurements revealed a clear distinction between normal perfusion and inducible ischaemia. Thus, the new measurements may serve as diagnostic markers for the detection and characterization of epicardial coronary and microvascular disease.
Keywords: myocardial perfusion, magnetic resonance imaging, heart, myocardium, quantification, post-processing
Introduction
Dynamic contrast-enhanced cardiovascular magnetic resonance (CMR) methods can be used to measure myocardial perfusion (1–4). The analysis of CMR perfusion data involves processing of signal intensity (SI) vs. time curves extracted from a myocardial region. Once the images are corrected for respiratory motion and delineated, the SI curves are extracted to enable quantification of various semi-quantitative parameters, including the time to contrast arrival, the peak enhancement, and the maximum upslope (4). More recently, the use of deconvolution methods (5–7) enabling true quantification of myocardial blood flow has been proposed. A more indepth review of both semi-quantitative and true quantitative analysis methods is given by Jerosch-Herold et al. (8).
Both semi- and true-quantitative analysis assess the temporal relation between the arterial input function and the myocardial SI curves, while ignoring the spatial characteristics of perfusion deficits. However, it is well known that due to the higher cardiac workload in the sub-endocardial layer, myocardial blood flow is highly heterogeneous even in healthy subjects, with distinct differences between the sub-endocardial and sub-epicardial layers. In disease states such as myocardial ischaemia, LV hypertrophy, or metabolic disease, these differences are further accentuated (9–12). Epicardial coronary stenosis affects predominantly the sub-endocardial layers, but many factors including the severity of the lesion, microvascular integrity, and collateralization determine the extent and persistence of perfusion defects. The high spatial resolution achievable with modern CMR perfusion imaging permits a detailed interrogation of the regional distribution of myocardial blood over time, but the depiction and graphical representation of these complex dynamic changes is challenging.
In this article, we describe a new approach for characterization and visualization of regional and dynamic differences in myocardial contrast uptake, complementary to existing quantification methods. Based on the myocardial SI curves in the epicardial- and endocardial layers, we calculate the transmural gradient in SI in each dynamic, thus obtaining gradient curves. These gradient curves can be displayed in a new two-dimensional representation that allows for direct quantification of the gradient amplitude, the temporal persistence, and circumferential extent of myocardial perfusion defects.
Methods
Method Development
The implementation of accurate voxel-based SI analysis in this work required respiratory motion correction and myocardial contour delineation. We developed an automated approach based on (13,14), in which respiratory motion is removed using affine image registration by maximization of the joint correlation between consecutive dynamics within an automatically determined region of interest. Then, a temporal maximum intensity projection is calculated to serve as a feature image for an automatic contour delineation method based on active contour models (13,14).
Following motion correction and contour delineation, SI curves are extracted at a grid of 60 angular positions and 10 transmural positions, or layers, see Fig. 1. The transmural positions are located on chords perpendicular to the myocardial centreline obtained by applying the repeated averaging algorithm (15) to the endocardial and epicardial LV contours. We used bi-linear interpolation in the spatial domain to extract SI curves of satisfactory quality at these positions, as lower order interpolators are not sufficient for extracting high quality SI curves, while the added value of higher order interpolators is unclear.
Fig. 1. Examples of the sampling grid used to extract SI curves from apical (a), mid (b), and basal (c) slice of a SA perfusion CMR series.
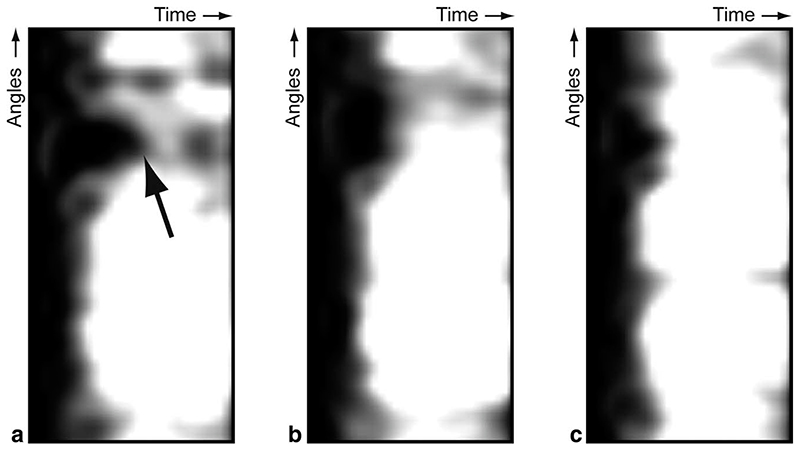
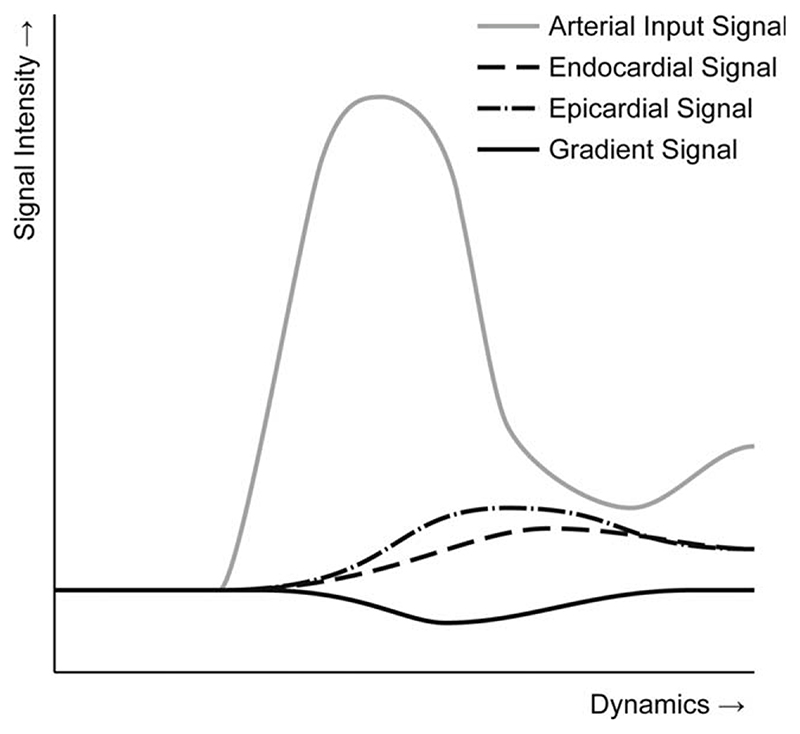
Conventionally, SI curves are displayed in charts, but the number of SI curves that can be differentiated in a single chart is limited. Moreover, the spatial relation between the SI curves in such charts is lost. An alternative approach for visualizing SI curves are perfusograms (16), which are two-dimensional images in which each line corresponds to a SI curve at an angular position in a particular slice, see Fig. 2. Thus, the vertical axis of the perfusogram relates to the angular position and the horizontal axis corresponds to the temporal position. The SI values themselves are shown in grey-levels (as in the original images) or colors. In our new method, we acquire SI curves in a grid of angular and transmural positions, allowing for the construction of a perfusogram for each transmural layer. Altogether, this results in a stack of perfusograms. In these, perfusion defects affecting only the sub-endocardial layers will be seen only in the endocardial perfusograms, as shown in Fig. 2. This can also be seen in Fig. 3, which shows the sub-endocardial and sub-epicardial SI curves at the angular location of the perfusion deficit.
Fig. 2. Examples of perfusograms for an endocardial layer (a), mid-myocardial layer (b), and an epicardial layer (c). Note the endocardial perfusion defect indicated by the arrow.
Fig. 3. A chart representing an endocardial SI curve, an epicardial SI curve, a gradient curve, and an arterial input curve.
To enable direct quantification of such endocardial perfusion deficits, we calculate gradient curves based on sub-endocardial and sub-epicardial SI curves. The sub-endocardial and sub-epicardial SI curves are obtained by averaging the three innermost and outermost layers, thus ignoring the four mid-myocardial layers to be more sensitive to transmural gradients in contrast uptake. The resulting average sub-endocardial SI curves are subtracted from the sub-epicardial SI curves to calculate the gradient curves. This is expressed in Eq. 1, in which Ga[t] denotes a gradient in the transmural direction at time t and an angular position a and Ia,I[t] denotes the intensity at time t, angular position a, and transmural position I.
| [1] |
The resulting gradient curves represent the evolution of transmural gradients in contrast uptake over time and can be calculated at all angular positions. As the transmural gradient is defined at each temporal and angular position, gradient curves can be represented in a spatiotemporal display, similar to perfusograms, which we refer to as gradientograms, see Fig. 4. The gradientogram thus summarizes the stack of perfusograms acquired from transmural layers into a single two-dimensional representation. The amplitude of the endocardial to epicardial SI gradient encodes the grey (or color) scale of the gradientogram. In our current implementation, we encoded increasing endocardial to epicardial gradients with a darkening grey level, so that an endocardial perfusion defect would generate a dark area in the gradientogram.
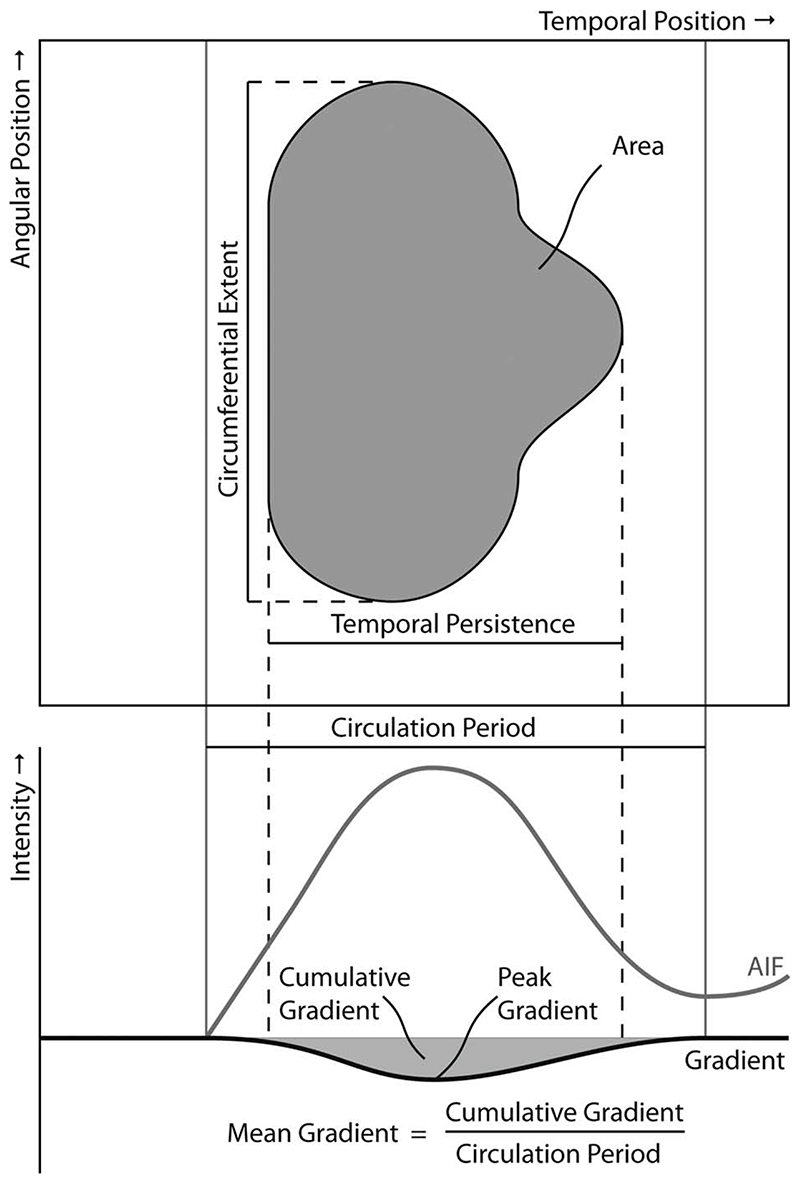
Fig. 4. The newly defined quantitative measures for assessing the severity of perfusion deficits based on the segmented gradientogram and gradient curves.
The acquired perfusion CMR series are subject to both transmit and receive B1 inhomogeneities and can contain substantial amounts of noise. Therefore, it is essential to preprocess the extracted SI curves to allow for visualization and characterization of transmural gradients in contrast uptake as described above. To cope with noise present in the perfusion CMR series, the extracted SI curves are filtered in both the spatial and temporal domain using a binomial filter (17). These filtered SI curves are used to calculate the gradient curves, which are then also less noisy. In a second preprocessing step, the gradient curves are normalized to be robust against the inhomogeneities that are present in perfusion CMR series. While the impact of such inhomogeneities can be strong across the entire image, the impact is very limited across the myocardial wall due to its small thickness, compared with the image domain. Therefore, we chose to normalize the transmural gradient by dividing it by the mean transmural signal intensity, as expressed in Eq. 2, in which Na[t] denotes the normalized gradient. By multiplying the resulting ratio with 100%, we express the gradient amplitude as a percentage of the transmural signal intensity. Although this approach does not completely correct SI curves for the signal variation due to B1 inhomogeneities, this relative quantity is less affected, and is thus more homogenous across myocardial regions.
| [2] |
Similar to the analysis of SI curves in conventional semi-quantitative analysis, temporal analysis of the normalized gradient curves can be performed. For each normalized gradient curve, the mean gradient amplitude , the peak gradient amplitude and the cumulative gradient amplitude over time, i.e. along the horizontal axis of the gradientogram, are calculated, see Eqs. 3–5 in which tAIF and t 2nd refer to the time of contrast arrival for the first and second bolus passage measured in the LV blood pool.
| [3] |
| [4] |
| [5] |
As shown in Fig. 4 and expressed in Eqs. 3–5, these measures are based on the gradients caused during the first pass only. The results of this analysis are defined for each angular position and can therefore be displayed in bull’s eye plots.
From the gradient curves and the specific appearance of an endocardial perfusion deficit in the gradientogram representation, several measures can be derived that characterize and quantify perfusion deficits. In visual assessments, the severity of endocardial perfusion deficits is usually characterized from three aspects; the amplitude of the transmural difference in contrast uptake, the time this transmural difference persists, and the circumferential extent of the perfusion defect. The gradientogram captures all these aspects, see Fig. 4. An endocardial perfusion deficit appears like a dark region, in which the intensity is related to the amplitude of the transmural gradient in contrast uptake. The persistence of a transmural gradient in contrast uptake can be estimated from the width of the dark region in the gradientogram. Finally, the circumferential extent of the perfusion deficit can be estimated from the height of the dark region in the gradientogram.
To translate these aspects into quantitative measurements, the perfusion deficit needs to be segmented. This can be done by means of a simple thresholding of the gradientogram, after which quantitative characterization of perfusion deficits can be performed based on the dimensions of the resulting segmentation, as well as based on the intensity values within the resulting segmentation. As the severity of perfusion deficits is visually assessed from the combination of the amplitude, the persistence and the circumferential extent of the transmural difference in contrast uptake, we also developed quantification of compound measures, aiming to summarize these aspects in a single quantitative property. The area of the obtained binary segmentation can be used to report on the circumferential extent and temporal persistence and may be linked to the severity of the perfusion deficit. Similarly, the average amplitude of the transmural gradient within the deficit may be of interest.
As the significance of a coronary occlusion relates to the size of its downstream territories, we also propose to normalize the average amplitude by the circumferential extent of a perfusion deficit. We refer to the resulting ratio as the strength of the perfusion deficit. The newly defined quantitative measures for assessing the severity of perfusion deficits are explained in Fig. 4 and listed in Table 1 including appropriate units.
Table 1. New Quantitative Parameters that are derived from Segmented Gradientograms (° is the degree symbol).
| Parameter | Unit | Interpretation |
|---|---|---|
| Maximum intensity | % | Maximum transmural gradient |
| Mean intensity | % | Mean transmural gradient |
| Maximum width | s | Persistence of deficit |
| Maximum height | ° | Circumferential extent of deficit |
| Area | ° s | Severity of deficit |
| Strength | % °−1 | Severity of deficit |
Method Evaluation
The new method was tested in a total of 8 patients suspected of having coronary artery disease. All patients had undergone first pass myocardial perfusion imaging on a 3T CMR scanner (Achieva, Philips Healthcare, Best, The Netherlands) using a high spatial resolution k-t SENSE accelerated perfusion method in combination with a saturation recovery gradient-echo pulse sequence (repetition time msec/echo time msec, 3.0/1.0; flip angle, 15°; nonselective saturation pulse with saturation prepulse delay 120 msec in all slices; partial Fourier sampling; acquisition window, 120 msec; matrix 256 × 256, spatial resolution 1.3 × 1.3 × 10 mm; k-t factor of five with 11 k-t interleaved training profiles; effective acceleration, 3.8) (18–21). Three slices were acquired at every heart beat for 40 dynamics in apical, equatorial, and basal short-axis positions. After 4 min of intravenous infusion of the vasodilator adenosine (at 140 mcg/kg/min), stress perfusion images were acquired with bolus injection of 0.05 mmol/kg Gd-DTPA (Dimeglumine gadopentetate, Magnevist, Bayer Schering Health Care Limited, UK), administered at a rate of 5 mL/s by a power injector (Medrad Spectris Solaris, Medrad) and followed by a flush of 20 mL Normal Saline.
The first 2 patients were chosen to test the new method in a normal and an abnormal case. Moreover, these cases were used to assess the impact of respiratory motion correction and filtering the SI curves by quantification of the contrast to noise ratio, which was calculated by dividing the peak enhancement by the standard deviation of the SI curves in the precontrast dynamics.
Further 6 patients were randomly selected from our clinical case pool to test the method’s variability. To assess intra-observer variability, one observer (AC) analyzed all cases twice. For inter-observer variability, all cases were also analyzed by another observer (SP). Both observers rated the gradientogram appearance in each coronary artery territory as positive or negative. To establish the presence of pericardial coronary artery stenosis by coronary artery territory, these 6 patients underwent subsequent coronary angiography.
Results
Automatic respiratory motion correction and myocardial contour detection was performed. If necessary, the automatically detected myocardial contours were manually corrected. Care was taken in the placement of endocardial contours to exclude any endocardial dark rim artefacts. Without respiratory motion correction and filtering, the resulting SI curves obtained from all slices of the first two cases after respiratory motion correction had a contrast to noise ratio of 4.32–11.92. With respiratory motion correction, the resulting SI curves had a contrast to noise ratio of 7.22–12.89 before filtering and 14.41–27.12 after filtering. To further illustrate the impact of these preprocessing methods, Fig. 5 shows sub-epicardial perfusograms before registration, before filtering, and after filtering. Thus, by employing respiratory motion correction and filtering in both the temporal and spatial domain, we achieved voxel-based SI curves of sufficient quality for accurate analysis, which in practice requires SI curves with contrast to noise ratio values higher than 10.0 (8). Altogether, a single analysis took between 2 and 3 min to be performed.
Fig. 5. Examples of sub-epicardial perfusograms before registration and filtering (a), after registration but before filtering (b), and after registration and filtering (c).
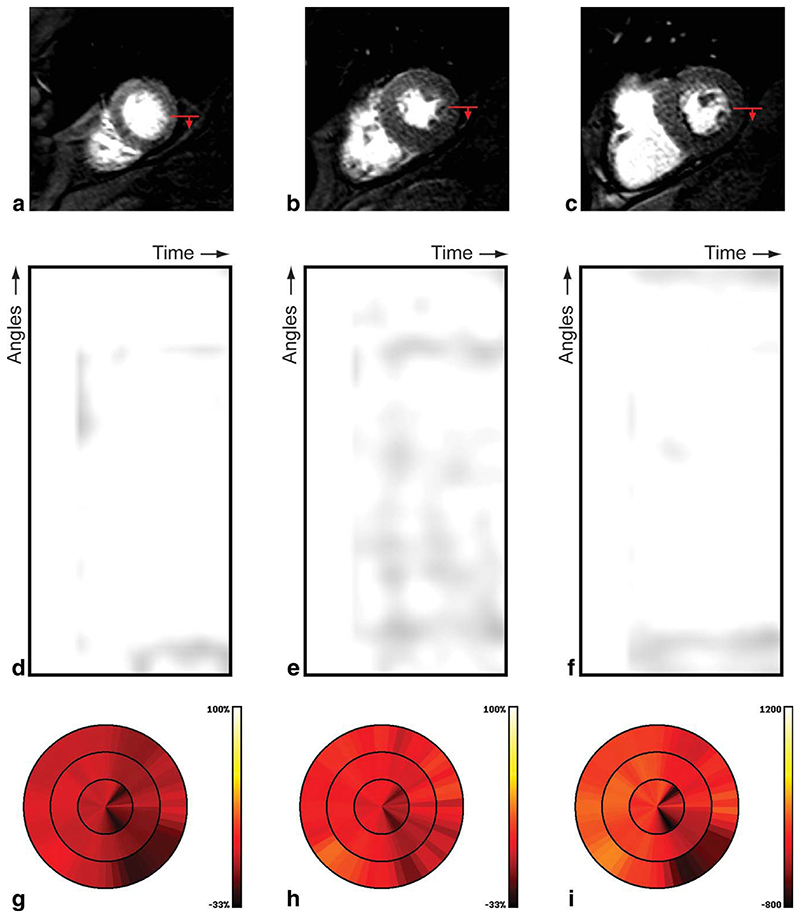
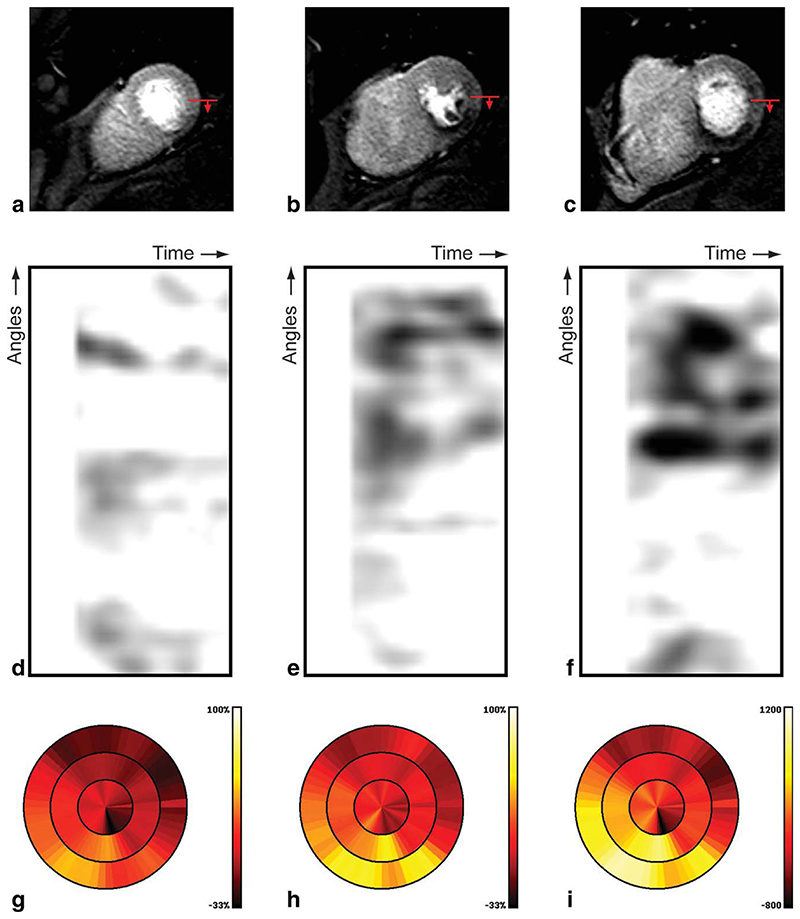
Figure 6 shows the results obtained from the first case in our evaluation, for which coronary angiography revealed no epicardial coronary stenosis. On visual inspection, no perfusion deficit was visible in the acquired high resolution perfusion CMR images, see Fig. 6a,b,c. The gradientogram of this patient shows no transmural gradients in myocardial contrast uptake, as illustrated by the uniformly bright appearance in the gradientograms, see Fig. 6d,e,f. The results of quantification of the mean, peak, and cumulative gradient amplitude is displayed in bull’s eye plots, see Fig. 6g,h,i. The uniform appearance of the bull’s eye plots for the mean gradient (Fig. 6g), peak gradient (Fig. 6h) and integral gradient (Fig. 6i) further exclude the presence of transmural gradients in myocardial contrast uptake.
Fig. 6.
Results for a patient with normal perfusion, including the original high resolution CMR perfusion images at apical (a), mid (b), and basal (c) position; the red arrow indicates the start and direction of the gradientogram (top-bottom), gradientograms for the apical (d), mid (e), and basal (f) position, and bull’s eye plots displaying for all slices the mean gradient (g), peak gradient (h), and cumulative gradient (i); bright (yellow) is worse.
The results obtained for the second case in our evaluation, with confirmed epicardial coronary stenosis by coronary angiography, are shown in Fig. 7. In this case, visual assessment of the perfusion CMR images (Fig. 7a,b,c) revealed a clear sub-endocardial perfusion deficit in the inferoseptal and inferior segments at the mid and basal level. The dark areas in the gradientograms obtained in this case (see Fig. 7d,e,f) clearly reveal the presence of strong and persistent transmural gradients in myocardial contrast uptake, as is consistent with the presence of sub-endocardial perfusion defects. The presence of transmural gradients in myocardial contrast uptake is further confirmed by the bull’s eye plots for the mean gradient (Fig. 7g), peak gradient (Fig. 7h), and cumulative gradient (Fig. 7i), as can be concluded from the yellow to bright color in the inferoseptal and inferior segments at the mid and basal level. Note that the bull’s eye plots from both cases for the mean gradient (Figs. 6g and 7g), peak gradient (Figs. 6h and 7h) and integral gradient (Figs. 6i and 7i) are generated using identical color scales.
Fig. 7.
Results for a patient with abnormal perfusion, including the original high resolution CMR perfusion images at apical (a), mid (b), and basal (c) position; the red arrow indicates the start and direction of the gradientogram (top-bottom), gradientograms for the apical (d), mid (e), and basal (f) position, and bull’s eye plots displaying for all slices the mean gradient (g), peak gradient (h), and cumulative gradient (i); bright (yellow) is worse.
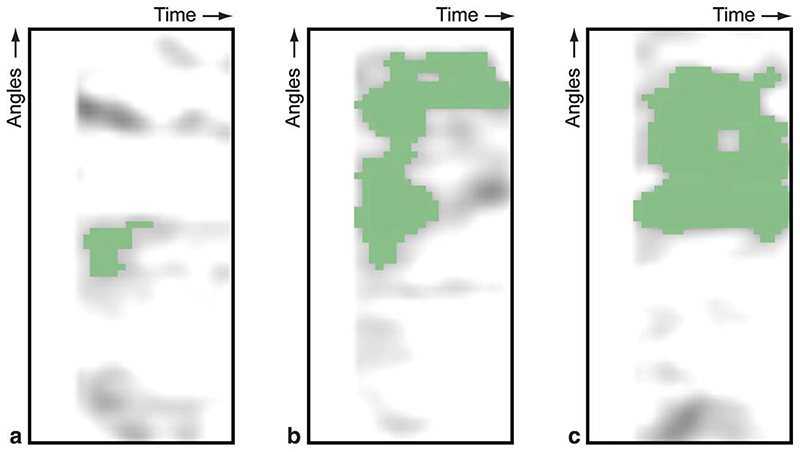
For the second case, we continued our quantitative analysis by segmenting the gradientograms, see Fig. 8. This segmentation was obtained by selecting the largest object after thresholding the gradientogram at the 15% level. Based on these segmentations, we quantified the parameters listed in Table 1 for the segmented defects in the apical, mid, and basal gradientogram resulting in Table 2. Note that these results cannot be computed for the first case, as there are no perfusion deficits to be segmented. This quantitative assessment confirms differences in circumferential extent, temporal persistence, and amplitude of the transmural gradients in myocardial contrast uptake over the slices that can be seen from the gradientograms (Fig. 7d,e,f). Moreover, Table 2 shows that compound measures such as the area and strength of the segmented deficit are capable of capturing the more subtle difference in defect severity between the mid and basal slices, which is not apparent from maximum intensity, the mean intensity, the maximum width, or the maximum height alone.
Fig. 8. Segmented perfusion deficit in the gradientograms of the apical (a), mid (b), and basal (c) slices of the positive case.
Table 2. Results of Quantitative Assessment of Transmural Gradients in Myocardial Contrast Uptake.
| Parameter | Apical | Mid | Basal |
|---|---|---|---|
| Maximum intensity (%) | 30.71 | 62.90 | 58.88 |
| Mean intensity (%) | 22.01 | 29.56 | 32.93 |
| Maximum width (s) | 2.86 | 14.29 | 14.29 |
| Maximum height (°) | 24.00 | 162.00 | 174.00 |
| Area (° s) | 68.57 | 1457.14 | 2078.57 |
| Strength (%° −1) | 14.68 | 62.04 | 91.78 |
The remaining 6 cases were analyzed to provide an assessment of inter- and intra-observer variability of the new method. Table 3 lists the results of these observations by coronary artery territory including a comparison with coronary angiography. In the coronary artery territories with perfusion defects, the gradientogram was segmented and quantitatively assessed. The mean ± SD of the difference between the observations was quantified resulting in Table 4. This preliminary evaluation on six cases revealed a promising correspondence between gradientogram analysis and coronary angiography, as well as good reproducibility for the derived measurements from gradientogram analysis.
Table 3. Comparison of Cath. Results to Visual Assessment of the Gradientogram.
| Gradient Results | |||||
|---|---|---|---|---|---|
| Patient | Vessel | Cath. Lab | Operator 1 (1st) | Operator 1 (2nd) | Operator 2 |
| 1 | LAD | 1 | 1 | 1 | 1 |
| LCX | 0 | 0 | 0 | 0 | |
| RCA | 0 | 0 | 0 | 0 | |
| 2 | LAD | 0 | 0 | 0 | 0 |
| LCX | 1 | 1 | 1 | 0 | |
| RCA | 0 | 0 | 0 | 0 | |
| 3 | LAD | 1 | 1 | 1 | 1 |
| LCX | 0 | 0 | 0 | 0 | |
| RCA | 0 | 0 | 0 | 0 | |
| 4 | LAD | 0 | 0 | 0 | 0 |
| LCX | 0 | 0 | 0 | 0 | |
| RCA | 0 | 0 | 0 | 0 | |
| 5 | LAD | 0 | 0 | 0 | 0 |
| LCX | 1 | 1 | 1 | 1 | |
| RCA | 0 | 0 | 0 | 0 | |
| 6 | LAD | 1 | 1 | 1 | 1 |
| LCX | 0 | 0 | 0 | 0 | |
| RCA | 0 | 0 | 0 | 0 | |
Table 4. Intra and Inter-observer Variability Assessed by Measuring the Mean ± SD Difference in the Quantitative Parameters Derived from a Segmented Gradient.
| Parameter | Intra-observer | Inter-observer |
|---|---|---|
| Maximum intensity (%) | 1.26 ± 12.37 | 5.14 ± 7.79 |
| Mean intensity (%) | 1.11 ± 7.75 | 3.75 ± 8.28 |
| Maximum width (s) | 0.84 ± 3.42 | −0.19 ± 2.66 |
| Maximum height (°) | −2.33 ± 23.30 | 12.00 ± 32.01 |
| Area (° s) | 3.07 ± 166.2 | 3.75 ± 8.28 |
| Strength (%° −1) | 4.34 ± 14.24 | −0.03 ± 5.43 |
Discussion
We present a new method for the visualization and characterization of transmural myocardial perfusion distribution that may reflect the severity of transmural perfusion gradients as well as their spatial and temporal evolution during contrast passage. Our method relies on high spatial resolution source data and an integrated motion compensation algorithm to enable the extraction of SI curves in layers within the myocardium. The SI curves in each layer were visualized in a perfusogram, a two-dimensional representation spanning the time and angular dimension. By subtracting the epicardial and endocardial perfusograms, we were able to visualize the temporal evolution of the transmural gradient in myocardial contrast uptake at each angular position in a similar twodimensional gradientogram. Within these gradientograms, the severity and extent of transmural gradients in myocardial contrast uptake and their evolution over time was visualized. In addition, we proposed several new quantitative measures that may characterize the severity of perfusion defects.
Our preliminary evaluation revealed a clear distinction between patients with normal perfusion or inducible ischaemia. As the sub-endocardium is known to be more susceptible to ischaemia than the sub-epicardium, the newly proposed measurements may well be additional indicators of the severity of myocardial perfusion deficits. Future studies need to explore the correlation between these new parameters and the severity of epicardial coronary disease, microvascular function and collateralization in larger patient populations of suspected coronary artery disease, as well as other pathologies in which gradients in myocardial perfusion are seen.
The proposed method can be used to visualize and characterize transmural gradients in contrast uptake, which should not be confused with transmural gradients in myocardial perfusion itself, as assessed in (12). Although transmural variations in myocardial perfusion are the main cause of transmural gradients in myocardial contrast uptake, the appearance of these gradients is also affected by the contrast administration protocol. Moreover, the transmural gradient in myocardial contrast uptake evolves over time. This temporal aspect also highlights the importance of clear and reproducible contrast administration protocols, which is particularly eminent for the interpretation of epicardial to endocardial contrast ratios calculated at one particular time point, as done in (11).
Our method relies on the ability to extract accurate SI curves in layers within the myocardium, which requires high spatial resolution images. For the initial evaluation of the method, we therefore used high spatial resolution k-t SENSE accelerated first pass perfusion imaging as presented in (18–21), rather than conventional spoiled gradient echo or SSFP first pass perfusion imaging. As the requirements with respect to the in-plane resolution of images are related to the myocardial thickness, our new method may perform particularly well under circumstances with increased myocardial thickness such as LV hypertrophy. Moreover, it may be beneficial to perform imaging near end systole when the myocardium is at its maximum thickness. The use of our method under circumstances with decreased myocardial thickness, as well as the use of our method with conventional spoiled gradient echo or SSFP first pass perfusion images (22), remain to be investigated but are likely to be less effective.
To acquire high spatial resolution images, we have used k-t SENSE accelerated first pass perfusion imaging on a 3T CMR scanner. While 3T compared to 1.5T enables an increased acquisition speed and spatial resolution, it is also associated with stronger B1 variation which may reveal limitations in our gradient normalization scheme. Therefore, the use of a 1.5T CMR scanner, sacrificing resolution for signal homogeneity, may be considered. Furthermore, technologies that reduce the impact of B1 variation at 3T should be investigated, including adiabatic or multipulse saturation schemes, and multi-channel transmission.
In addition to sufficient spatial resolution, the extraction of accurate voxel-based SI curves requires anatomically consistent sampling positions in each dynamic. Therefore, we integrated a motion compensation method to reduce the respiratory motion that is present in first pass perfusion images. Next to enabling accurate SI curve sampling, successful respiratory motion compensation enables tracing of the endocardial and epicardial contours in all dynamics by a single tracing. This greatly simplifies the delineation task, which is the primary bottleneck of perfusion analysis in the absence of respiratory motion correction (8). While we have used a newly developed approach based on (13,14), alternative approaches toward automatic respiratory motion correction and myocardial contour detection as reviewed in (23,24) may be used.
Limitations
The evaluation of our method was limited to 8 patients. Although our evaluation revealed a promising correspondence between coronary angiography and gradientogram analysis, future studies need to explore the correlation between the new parameters and the severity of epicardial coronary disease in larger patient populations. As gradients in myocardial perfusion are also seen in left ventricular hypertrophy and microvascular disease, future studies should also investigate the use of our method in patients with these pathologies.
In patients with transmural infarcts, the absence of myocardial perfusion may limit contrast uptake such that no transmural gradients occur, causing a false negative result. Fortunately, such transmural infarcts are easy to distinguish from the original perfusion images, as well as from late gadolinium enhancement images that are usually in conjunction with first pass perfusion CMR. Consequently, the likelihood of missing such transmural defects is limited.
Dynamic contrast-enhanced perfusion CMR studies can be affected by sub-endocardial dark rim artefacts, particularly during the first passage of the contrast agent through the left ventricular cavity. The occurrence and extent of such artefacts are known to depend on the contrast dose, pixel size, and pulse sequence characteristics. In this work, we used a perfusion method with high spatial resolution, which results in relatively small dark rim artefacts (19). In addition, we positioned the endocardial contours to exclude the immediate sub-endocardial layer so that any residual artefacts were not included. Finally, the gradientogram segmentation method is tailored to ignore defects that persist for a single dynamic.
The current implementation of our method incorporates a number of parameters that have been configured by trial-and-error to demonstrate the potential of our method. These parameters include the dimensions of the myocardial sampling grid, the level of spatial and temporal filtering, the number of sub-endocardial and sub-epicardial layers to be averaged in the computation for the transmural gradient and the threshold value used for segmenting the perfusion deficit in the gradientogram. As our intention in this article is to explain and demonstrate our new method, we have not performed an extensive quantitative analysis on the influence of these parameters. Thus, further studies in larger cohorts will be needed to determine the optimal parameter settings for detection of ischaemia and other conditions. Furthermore, while different implementations of our method should be evaluated and might reveal better diagnostic performance, this would not alter the basic principles of our method that has been the subject of the current work.
Conclusions
We have developed a new method for the visualization and characterization of transmural myocardial perfusion distribution based on the gradientogram representation, which permits simultaneous display and measurement of amplitude, extent and persistence of transmural gradients in myocardial contrast uptake. This representation, together with several newly defined measurements, revealed a clear distinction between normal perfusion and inducible ischaemia in application to clinical image data. In a small evaluation, the new methods have shown to be reproducible and correspond well with coronary angiography. Thus, the new method may find application in the detection and characterization of epicardial coronary disease and microvascular disease states.
Acknowledgments
Grant sponsor: Wellcome Trust fellowship; Grant number: 078288; Grant sponsor: Wellcome Trust and EPSRC; Grant number: WT 088641/Z/09/Z.
References
- 1.Atkinson DJ, Burstein D, Edelman RR. First-pass cardiac perfusion: evaluation with ultrafast MR imaging. Radiology. 1990;174(3 Pt 1):757–762. doi: 10.1148/radiology.174.3.2305058. [DOI] [PubMed] [Google Scholar]
- 2.Schwitter J, Wacker CM, van Rossum AC, Lombardi M, Al-Saadi N, Ahlstrom H, Dill T, Larsson HBW, Flamm Scott D, Marquardt M, Johansson L. MR-IMPACT: comparison of perfusion-cardiac magnetic resonance with single-photon emission computed tomography for the detection of coronary artery disease in a multicentre, multivendor, randomized trial. Eur Heart J. 2008;29:480–489. doi: 10.1093/eurheartj/ehm617. [DOI] [PubMed] [Google Scholar]
- 3.Plein S, Radjenovic A, Ridgway J, Barmby D, Greenwood JP, Ball SG, Sivananthan MU. Coronary artery disease: myocardial perfusion MR imaging with sensitivity encoding versus conventional angiography. Radiology. 2005;235:423–430. doi: 10.1148/radiol.2352040454. [DOI] [PubMed] [Google Scholar]
- 4.Nagel E, Klein C, Paetsch I, Hettwer S, Schnackenburg B, Wegscheider K, Fleck E. Magnetic resonance perfusion measurements for the noninvasive detection of coronary artery disease. Circulation. 2003;108:432–437. doi: 10.1161/01.CIR.0000080915.35024.A9. [DOI] [PubMed] [Google Scholar]
- 5.Jerosch-Herold M, Wilke N, Stillman AE, Wilson RF. Magnetic resonance quantification of the myocardial perfusion reserve with a Fermi function model for constrained deconvolution. Med Phys. 1998;25:73–84. doi: 10.1118/1.598163. [DOI] [PubMed] [Google Scholar]
- 6.Jerosch-Herold M, Swingen C, Seethamraju RT. Myocardial blood flow quantification with MRI by model-independent deconvolution. Med Phys. 2002;29:886–897. doi: 10.1118/1.1473135. [DOI] [PubMed] [Google Scholar]
- 7.Neyran BB, Janier MF, Casali C, Revel D, Soulas EPC. Mapping myocardial perfusion with an intravascular MR contrast agent: robustness of deconvolution methods at various blood flows. Magn Reson Med. 2002;48:166–179. doi: 10.1002/mrm.10201. [DOI] [PubMed] [Google Scholar]
- 8.Jerosch-Herold M, Seethamraju RT, Swingen CM, Wilke NM, Stillman AE. Analysis of myocardial perfusion MRI. J Magn Reson Imaging. 2004;19:758–770. doi: 10.1002/jmri.20065. [DOI] [PubMed] [Google Scholar]
- 9.Path G, Robitaille PM, Merkle H, Tristani M, Zhang JJ, Garwood M, From AH, Bache RJ, Uǧurbil K. Correlation between transmural high energy phosphate levels and myocardial blood flow in the presence of graded coronary stenosis. Circ Res. 1990;67:660–673. doi: 10.1161/01.res.67.3.660. [DOI] [PubMed] [Google Scholar]
- 10.Hoffman JI. Transmural myocardial perfusion. Prog Cardiovasc Dis. 1987;29:429–464. doi: 10.1016/0033-0620(87)90016-8. [DOI] [PubMed] [Google Scholar]
- 11.George RT, Arbab-Zadeh A, Miller JM, Kitagawa K, Chang H, Bluemke DA, Becker L, Yousuf O, Texter J, Lardo AC, Lima JA. Adenosine stress 64- and 256-row detector computed tomography angiography and perfusion imaging: a pilot study evaluating the transmural extent of perfusion abnormalities to predict atherosclerosis causing myocardial ischemia. Circ Cardiovasc Imaging. 2009;2:174–182. doi: 10.1161/CIRCIMAGING.108.813766. [DOI] [PMC free article] [PubMed] [Google Scholar]
- 12.Muehling OM, Wilke NM, Panse P, Jerosch-Herold M, Wilson BV, Wilson RF, Miller LW. Reduced myocardial perfusion reserve and transmural perfusion gradient in heart transplant arteriopathy assessed by magnetic resonance imaging. J Am Coll Cardiol. 2003;42:1054–1060. doi: 10.1016/s0735-1097(03)00924-0. [DOI] [PubMed] [Google Scholar]
- 13.Spreeuwers L, Breeuwer M. Automatic detection of myocardial boundaries in MR cardio perfusion images; Proceedings of Med Image Comput Comput Assist Interv; Utrecht, Netherlands. 2001. pp. 1228–1231. [Google Scholar]
- 14.Breeuwer M, Spreeuwers LJ, Quist MJ. Automatic quantitative analysis of cardiac MR perfusion images; Proceedings of SPIE Medical Imaging; San Diego, CA, USA. 2001. pp. 733–742. [Google Scholar]
- 15.Chalana V, Kim Y. A methodology for evaluation of boundary detection algorithms on medical images. IEEE Trans Med Imaging. 1997;16:642–652. doi: 10.1109/42.640755. [DOI] [PubMed] [Google Scholar]
- 16.Pearlman JD, Hibberd MG, Chuang ML, Harada K, Lopez JJ, Gladstone SR, Friedman M, Sellke FW, Simons M. Magnetic resonance mapping demonstrates benefits of VEGF-induced myocardial angiogenesis. Nat Med. 1995;1:1085–1089. doi: 10.1038/nm1095-1085. [DOI] [PubMed] [Google Scholar]
- 17.Aubury M, Luk W. Binomial filters. J VLSI Signal Process Syst Signal Image Video Technol. 1996;12:35–50. [Google Scholar]
- 18.Plein S, Schwitter J, Suerder D, Greenwood JP, Boesiger P, Kozerke S. k-Space and time sensitivity encoding-accelerated myocardial perfusion MR imaging at 3.0 T: comparison with 1.5 T. Radiology. 2008;249:493–500. doi: 10.1148/radiol.2492080017. [DOI] [PMC free article] [PubMed] [Google Scholar]
- 19.Plein S, Kozerke S, Suerder D, Luescher TF, Greenwood JP, Boesiger P, Schwitter J. High spatial resolution myocardial perfusion cardiac magnetic resonance for the detection of coronary artery disease. Eur Heart J. 2008;29:2148–2155. doi: 10.1093/eurheartj/ehn297. [DOI] [PMC free article] [PubMed] [Google Scholar]
- 20.Plein S, Ryf S, Schwitter J, Radjenovic A, Boesiger P, Kozerke S. Dynamic contrast-enhanced myocardial perfusion MRI accelerated with k-t sense. Magn Reson Med. 2007;58:777–785. doi: 10.1002/mrm.21381. [DOI] [PubMed] [Google Scholar]
- 21.Gebker R, Jahnke C, Paetsch I, Schnackenburg B, Kozerke S, Bornstedt A, Fleck E, Nagel E. MR myocardial perfusion imaging with k-space and time broad-use linear acquisition speed-up technique: feasibility study. Radiology. 2007;245:863–871. doi: 10.1148/radiol.2453061701. [DOI] [PubMed] [Google Scholar]
- 22.Gebker R, Schwitter J, Fleck E, Nagel E. How we perform myocardial perfusion with cardiovascular magnetic resonance. J Cardiovasc Magn Reson. 2007;9:539–547. doi: 10.1080/10976640600897286. [DOI] [PubMed] [Google Scholar]
- 23.Stegmann MB, Ólafsdóttir H, Larsson HBW. Unsupervised motioncompensation of multi-slice cardiac perfusion MRI. Med Image Anal. 2005;9:394–410. doi: 10.1016/j.media.2004.10.002. [DOI] [PubMed] [Google Scholar]
- 24.Milles J, van der Geest RJ, Jerosch-Herold M, Reiber JHC, Lelieveldt BPF. Fully automated motion correction in first-pass myocardial perfusion MR image sequences. IEEE Trans Med Imaging. 2008;27:1611–1621. doi: 10.1109/TMI.2008.928918. [DOI] [PubMed] [Google Scholar]


