Abstract
In contrast to single-cell approaches for measuring gene expression and DNA accessibility, single-cell methods for analyzing histone modifications are limited by low sensitivity and throughput. Here we combine the CUT&Tag technology, developed to measure bulk histone modifications, with droplet-based single-cell library preparation to produce high-quality single-cell data on chromatin modifications. We apply single-cell CUT&Tag on tens of thousands of cells of the mouse central nervous system (CNS) and probe histone modifications characteristic of active promoters, enhancers and gene bodies (H3K4me3, H3K27ac and H3K36me3) and inactive regions (H3K27me3). These scCUT&Tag profiles were sufficient to determine cell identity and deconvolute regulatory principles such as promoter bivalency, spreading of H3K4me3, and promoter-enhancer connectivity. We also used scCUT&Tag to investigate the single-cell chromatin occupancy of transcription factor Olig2 and the cohesin-complex component Rad21. Our results indicate that analysis of histone modifications and transcription factor occupancy at single-cell resolution provides unique insights into epigenomic landscapes in the CNS.
The advent of single-cell sequencing technologies has inaugurated a new era in developmental biology, allowing exploratory analysis of tissue complexity and cell heterogeneity1, in-depth analysis of gene regulatory networks, imputation of developmental trajectories, and prediction of future cell states (e.g. RNA velocity)2. Single-cell technologies for probing the epigenetic landscape, such as single-cell ATAC-seq3 or single-cell DNA methylation4 sequencing, have shed light on the epigenetic heterogeneity of tissues. While chromatin accessibility and DNA methylation can provide genome-wide snapshots of active and repressive states, the study of diverse chromatin modifications might provide further insights on epigenomic and cellular states. For decades, the gold-standard assay in the field of epigenetics has been chromatin immunoprecipitation (ChIP) coupled with deep sequencing (ChiP-seq). However, ChIP-seq experiments suffer from low signal-to-noise ratio, inconsistencies due to immunoprecipitation, and requirements for high quantities of sample. Recent methods based on in situ chromatin cleavage or tagmentation with low input requirements, such as Cut&Run5 and CUT&Tag6, have raised the possibility of investigating chromatin modifications at the single-cell level at large scale6.
Modifications of histone tails represent a unique system of regulation of gene expression. Histone acetyltransferases and methyltransferases deposit post-translational modifications at various genomic elements (e.g. promoters, enhancers) to regulate gene expression both positively (e.g. H3K27ac, H3K4me3, H3K4me1) and negatively (e.g. H3K27me3, H3K9me3). Bulk studies of these modifications have succeeded in defining the regulatory elements but failed to uncover potential cell heterogeneity within tissue samples. Recent studies have characterized the state of post-translational modifications of histones at a single cell level in cultured cells and embryos6–12. However, for highly complex adult organs such as the brain, this single-cell characterization has not been achieved.
Here, we developed and applied single-cell Cut&Tag protocol by adapting the droplet-based 10x Genomics single cell ATAC-seq platform to investigate histone modification profiles at the single cell level in the mouse brain. We focused on the oligodendrocyte lineage (OLG), which we have recently shown to be heterogeneous and to be able to transition to alternative cell states during development and disease13–16. We were able to resolve single cells into discrete populations based exclusively on the histone modifications data, find unique cell type specific markers and quantitative differences in the levels of histone modifications. We used the obtained data to get unique insights into promoter mark spreading, bivalency and identification of enhancer-promoter interactions. Finally, we were able to obtain single cell binding profiles for non-histone proteins, namely chromatin architecture factor and subunit of cohesin complex Rad21 and the OLG-specific transcription factor Olig2. We have generated web resources available at https://ki.se/en/mbb/oligointernode and https://mouse-brain-cutandtag.cells.ucsc.edu, where these scCUT&Tag datasets can be explored. This study provides a method to study epigenetic regulation in complex tissues in great detail and a deeper understanding of epigenetic heterogeneity in the mouse brain.
Results
CUT&Tag profiling of single cells
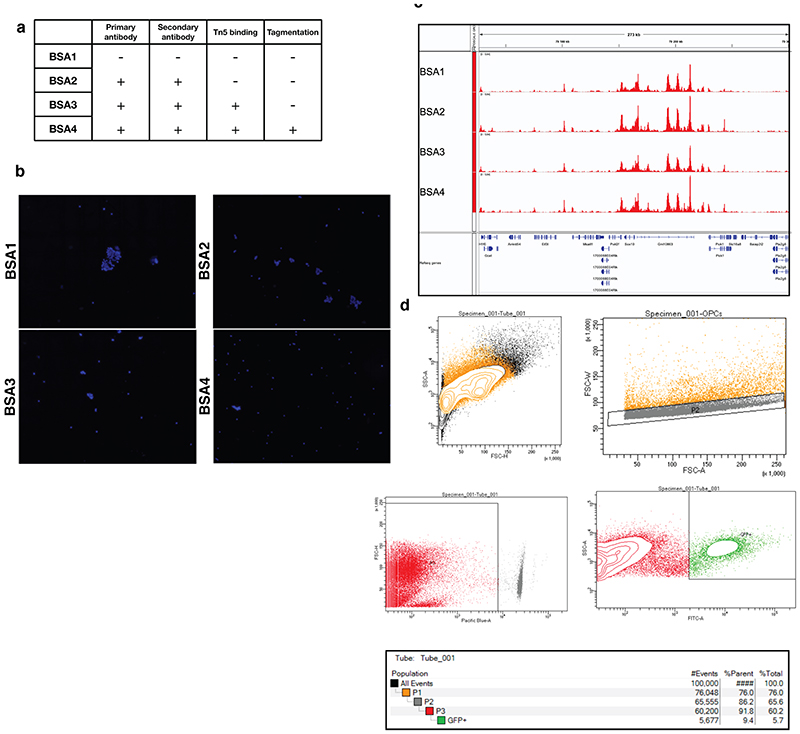
In order to perform scCUT&Tag on thousands of cells, we coupled antibody directed tagmentation (Cut&Tag)1 in bulk with an existing single-cell ATAC-seq protocol (10x Genomics, Figure 1a). To reduce clumping of the nuclei during the incubations, we added 1% BSA to specific buffers (see online methods) and performed trial bulk CUT&Tag experiments (Extended Data Figure 1a). We found that addition of BSA reduced nuclei clumping (Extended Data Figure 1b) but did not substantially alter the efficiency of tagmentation nor the signal distribution for bulk Cut&Tag (Extended Data Figure 1c).
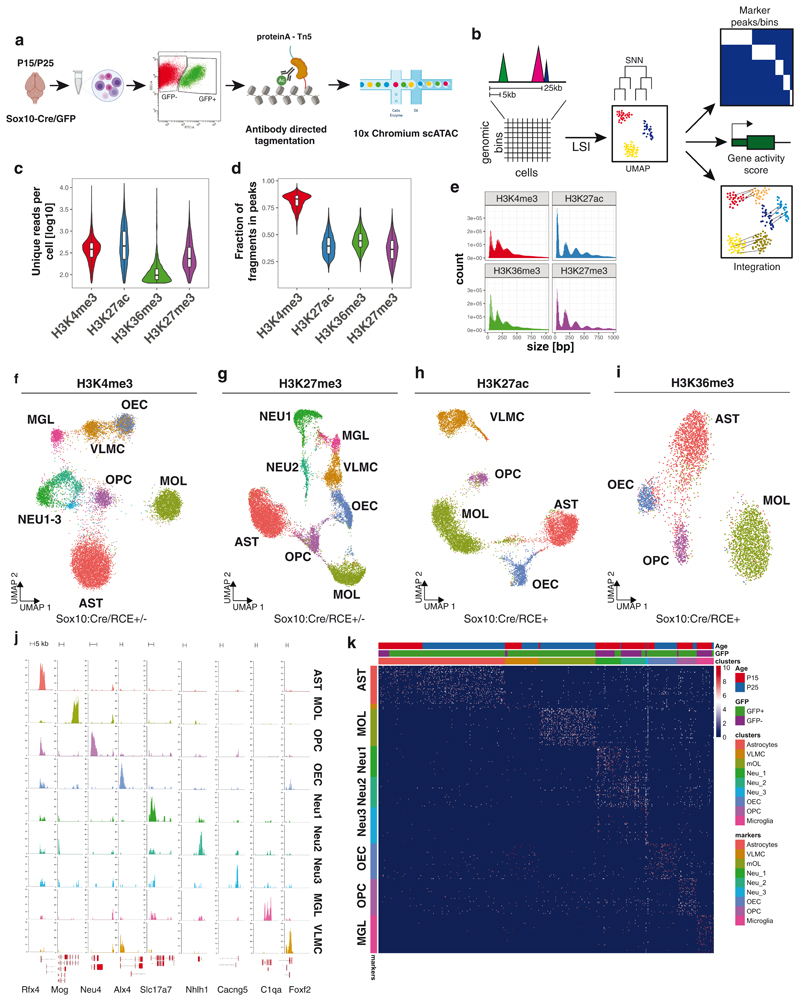
Figure 1. Single-cell profiling of several histone modifications in the mouse brain.
a. Schematic of the scCut&Tag experimental design. Cells were isolated from mouse brain at age P15 or P25, sorted either for GFP+ or GFP-population; nuclei were isolated and incubated with specific antibody against chromatin modifications or transcription factors and tagmented using proteinA-Tn5 fusion and processed by the 10x chromium scATAC-seq protocol. b. Schematic of the analysis strategy. scCUT&Tag signal was aggregated into cell x bin matrix, with various bin size (5kb or 50kb); dimensionality reduction was performed using LSI and UMAP and clustering using SNN. Cell clusters were used to identify marker regions, gene activity scores was calculated per cell and integration with other datasets was performed. c. Comparison of number of unique reads per antibody in scCUT&Tag experiments. Lower and upper bound of boxplot specify 25th and 75th percentile and lower and upper whisker specifies minimum and maximum no further than 1.5 times of inter-quantile range. Outliers are not displayed. H3K4me3 – n=13739 cells from 4 biological replicates; H3K27ac – n=10414 cells from 2 biological replicates; H3K27me3 – n=13932 from 4 biological replicates; H3K36me3 – n=4350 cells from 2 biological replicates d. Comparison of percentage of reads falling into peak regions per antibody in scCUT&Tag experiments. Peaks were obtained by peak calling in merged bulk datasets. Lower and upper bound of boxplot specify 25th and 75th percentile and lower and upper whisker specifies minimum and maximum no further than 1.5 times of inter-quantile range. Outliers are not displayed. H3K4me3 – n=13739 cells from 4 biological replicates; H3K27ac – n=10414 cells from 2 biological replicates; H3K27me3 – n=13932 from 4 biological replicates; H3K36me3 – n=4350 cells from 2 biological replicates. e. Distribution of fragment lengths scCUT&Tag experiments per antibody. f-i. two-dimensional UMAP representation of the scCUT&Tag data for H3K4me3, n=4 (f), H3K27me3, n=4 (g), H3K27ac, n=2 (h) and H3K36me3, n=2 (i). AST – Astrocytes, MOL – Mature Oligodendrocytes, OPC - Oligodendrocyte progenitor cells, NEU – Neurons, MGL - Microglia, VLMC – Vascular and leptomeningeal cells, OEC – Olfactory ensheating cells. j. Pseudo-bulk scCUT&Tag profiles of H3K4me3 aggregated by cell type at markers’ loci. k. Heatmap showing H3K4me3 signal intensity in top 50 most specifically enriched genomic bins per cluster (rows) and single cells (columns). Cells are randomly sampled and 5% of total number of cells are displayed. Color bars in rows specify marker cluster, and in columns cell metadata (Age, GFP).
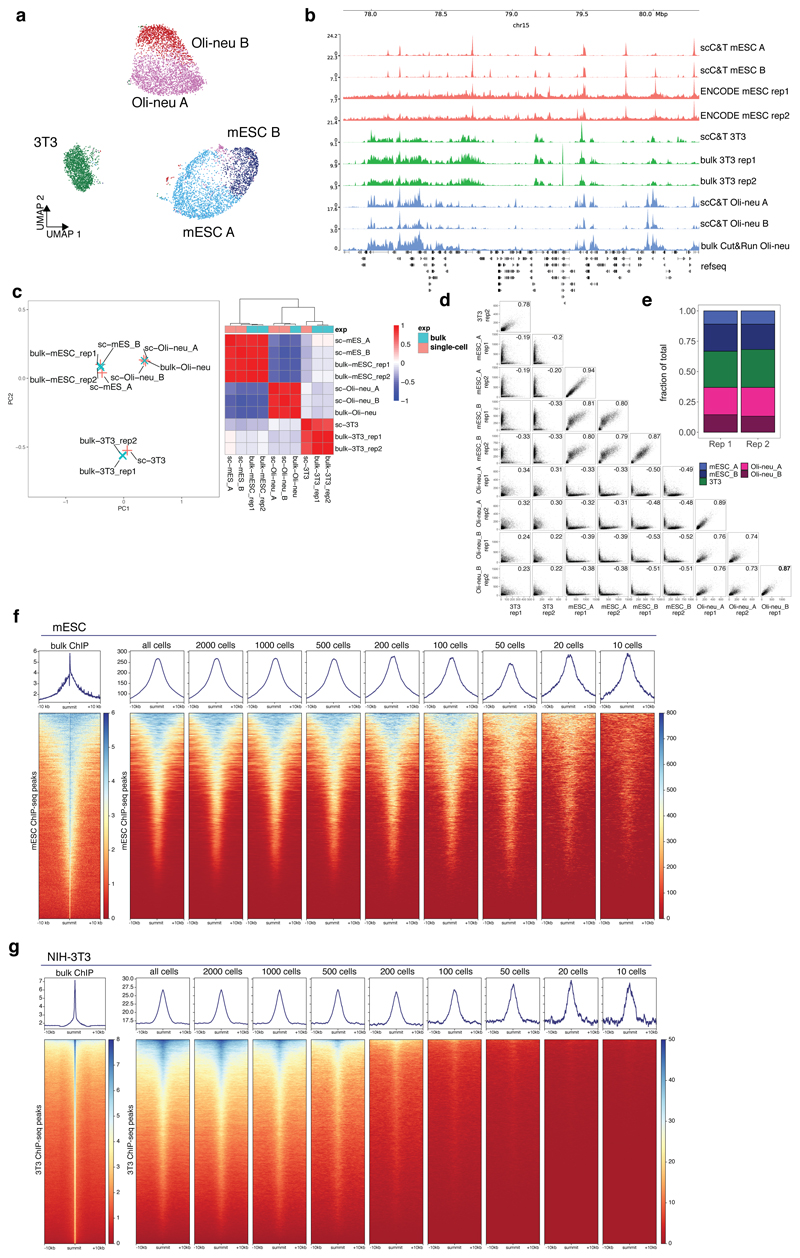
To verify whether scCUT&Tag data can be used to deconvolute heterogeneous cell population, we prepared a mixture of three cell lines – mouse embryonic stem cells (mESC, C57Bl/6J origin), mouse embryonic fibroblasts (NIH-3T3) (ATCC) and mouse oligodendrocyte progenitor model cell line (Oli-neu)17. Tagmented nuclei were then barcoded using the 10x Genomics Chromium platform (Figure 1a) and we performed scCUT&Tag against the H3K27me3 histone modification, in two technical replicates using v1 (rep1) and v1.1 (rep2) 10x Genomics scATAC-seq kit (each version required specific optimizations - see Online Methods). We obtained H3K27me3 profiles of 4872 and 3873 single cells with 597 and 568 unique fragments per cell. We aggregated the data and generated cell-feature matrices for all datasets using 5kb windows (Figure 1b). To reduce the dimensionality of the dataset, we used latent semantic indexing (LSI) and uniform manifold approximation and projection (UMAP) and clustered the cells using shared nearest neighbors (SNN) and Leiden algorithm implemented with package Signac/Seurat v3 (Figure 1b). Dimensionality reduction and clustering yielded one cluster that was identified as 3T3 cells and two sub-clusters for Oli-neu (Oli-neu_A and Oli-neu_B) and mESCs (mES_A, and mESC_B) (Extended Data Figure 2a). Genome browser tracks of merged scCUT&Tag clusters and the respective bulk H3K27me3 mESC ChIP-seq from Encode18, 3T3 ChIP-seq19 and in house generated Oli-neu Cut&Run datasets showed high level of similarity (Extended Data Figure 2b). We also performed principal component analysis (PCA) on the top 150 most variable marker peaks and observed co-clustering and correlation of the respective bulk and single-cell Cut&Tag data (Extended Data Figure 2c). We also observed high correlation of signal in peaks between the two scCut&Tag technical replicates between the corresponding clusters (Extended Data Figure 2d) and concordance in proportion of identified cell identities (Extended Data Figure 2e). Finally, we plotted metagene profiles of downscaled H3K27me3 scCUT&Tag signal around the peaks called from the respective ChIP-seq or CUT&Run data and found that merging around 200-500 3T3 cells and 20-50 mESCs yielded high-quality bulk profiles comparable to the reference data (Extended Data Figure 2f,g).
Single-cell profiles of several histone modifications in the mouse brain
De novo identification of cell populations is one of the main strengths of a single-cell technologies. Since scCUT&Tag allowed the deconvolution of distinct cell types in complex mixtures, we aimed to use scCUT&Tag to investigate epigenetic changes during OLG differentiation and myelination in the mouse brain. We used a mouse model expressing Sox10:Cre/Rosa26:(CAG-LSL-EGFP) mice (RCE)13,20,21, which primarily labels OLGs in the mouse CNS. We sorted both GFP+ and GFP-cells from whole juvenile brain at postnatal day 15 (P15 timepoint). Additionally, to gain more insights into OLG differentiation, we sorted GFP+ cells at P21-P25 range (P25 timepoint) in two biological replicates, at the peak of oligodendrocyte differentiation and the onset of myelination (Figure 1a). We then performed scCUT&Tag with antibodies against H3K4me3 (for active promoters) and H3K27me3 (for repressed loci) at both timepoints. We also performed scCUT&Tag against H3K27ac (marks active enhancers and promoters) and H3K36me3 (marks actively transcribed genes) in the P25 GFP+ cohort. Inspection of merged pseudo-bulk datasets including all cells revealed distinct profiles for the histone modifications highlighting the specificity of the technique (Extended Data Figure 3a). In particular, H3K4me3 was mainly present at regions flanking transcription start sites, H3K27ac occupied both these regions and neighboring intergenic regions (most likely enhancers) and H3K36me3 was spread throughout the gene bodies (Extended Data Figure 3a). In contrast, H3K27me3 was associated with genes where the other active markers were absent, or it coincided with H3K4me3.
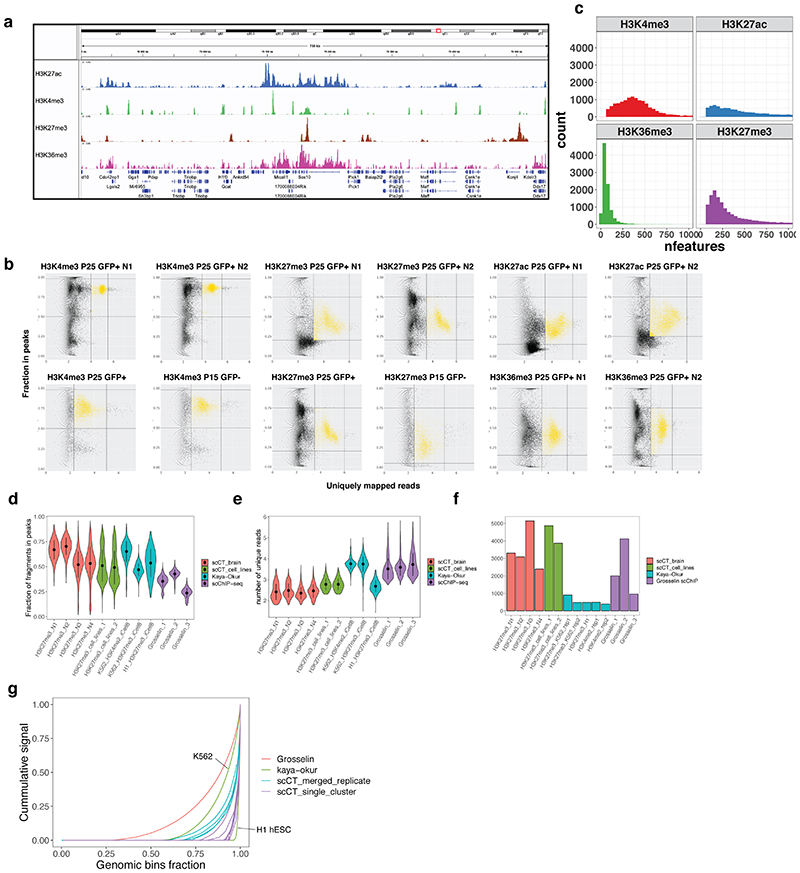
We identified single cells based on the number of reads per barcode and fraction of reads falling into peak regions, called from merged bulk data (Extended Data Figure 3b and Online Methods). Altogether we obtained scCut&Tag profiles of various histone modifications for 47340 single cells with median ranging between 98 (H3K36me3) and 453 (H3K27ac) unique fragments per cell (Figure 1c). Between 39.4% and 85.6% of fragments fell within narrow peak regions (Figure 1d), indicating a low level of background. The fragment length distribution was consistent with the capture of sub nucleosome fragments as well as mono-, di- and tri -nucleosomes for all modifications (Figure 1e).
We compared performance metrics of H3K27me3 scCUT&Tag to those of previously published technologies targeting the same epitope. Our scCUT&Tag data showed similar or higher specificity (as measured by fraction of fragments in peaks), equal or lower number of unique fragments per cell, but yielded more cells per experiment compared to the iCell8 scCUT&Tag6 and the latest scChIP-seq method12 (Extended Data Figures 3d-f). Consistent with this, fingerprint plots showed that scCUT&Tag displayed higher specificity and better signal to noise ratio compared to scChIP-seq12 and similar level of specificity to the iCell8 scCUT&Tag (Extended Data Figure 3g).
scCUT&Tag of individual histone modifications allows identification of specific cell populations from the mouse brain
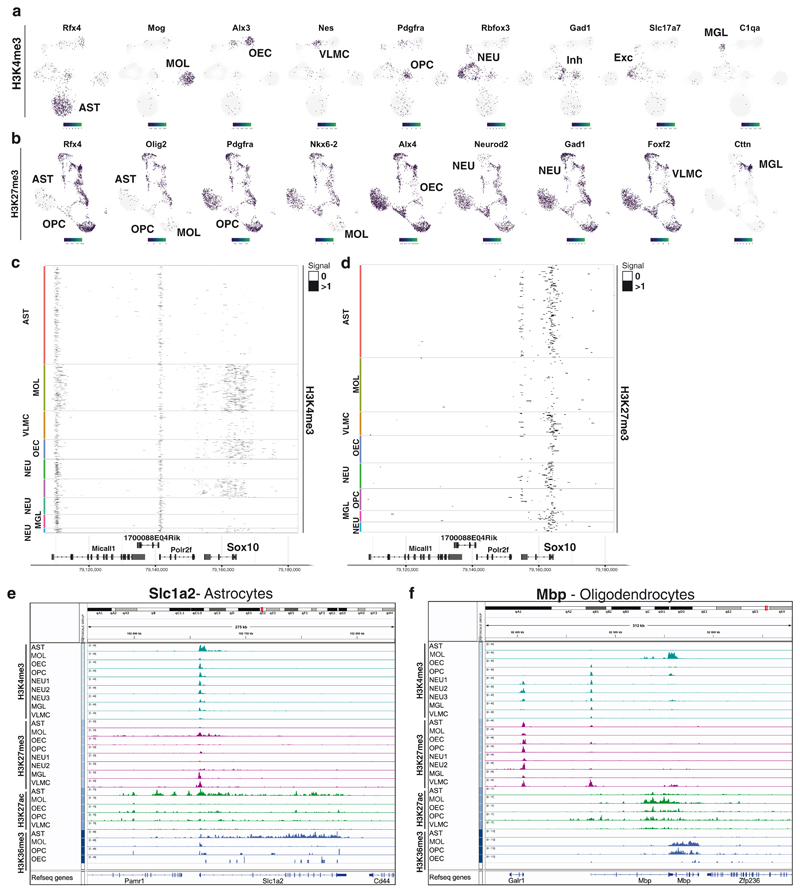
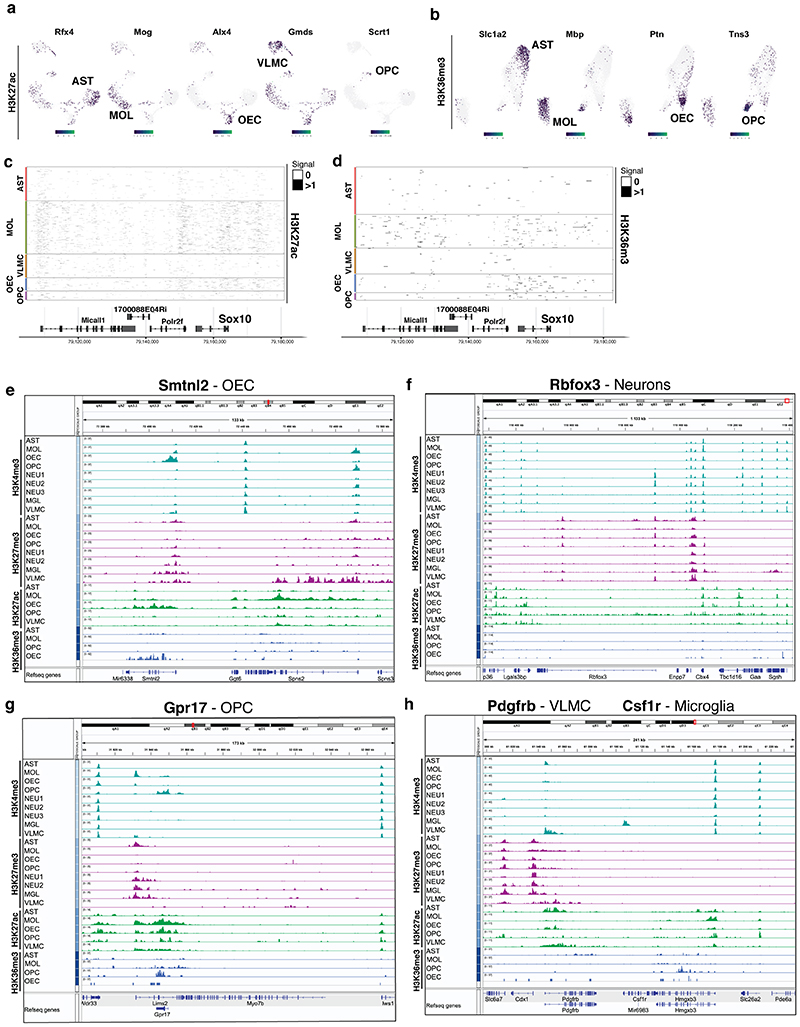
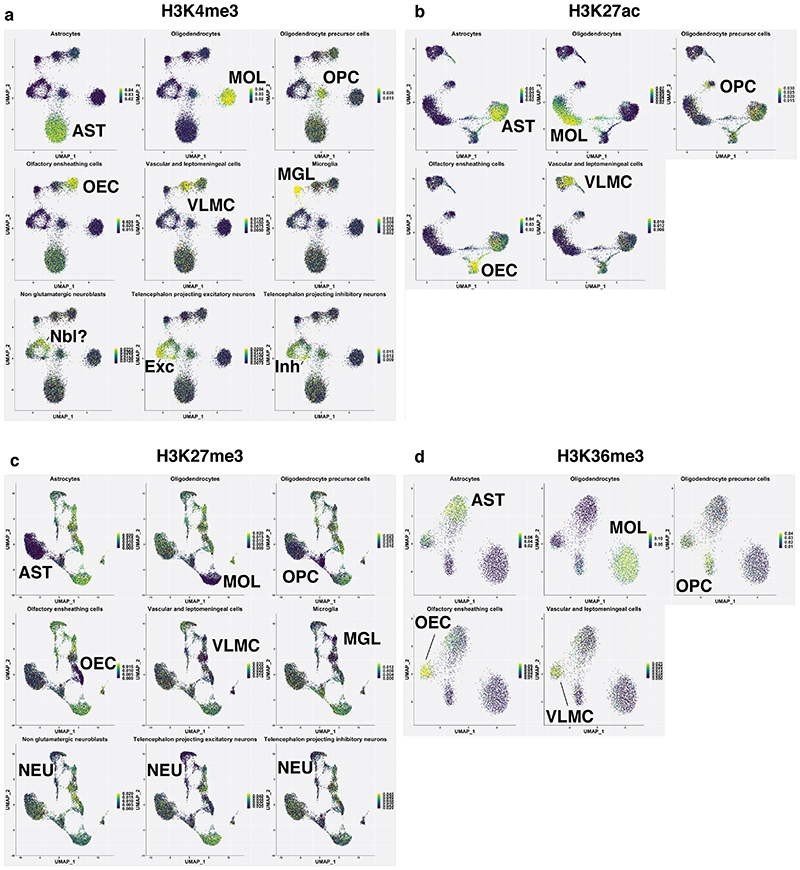
In order to deconvolute and cluster the cells, we generated cell-feature matrices for all datasets using 5kb (H3K4me3, H3K27ac and H3K27me3) or 50kb genomic bins (H3K36me3), (Figure 1b) and identified all major CNS cell populations in the scCUT&Tag assay for the different modifications (Figure 1f–i). By identifying specific peaks proximal to promoters of marker genes (Figure 1j,k, Figure 2), we manually annotated the populations as mature oligodendrocytes (MOL, Mbp+, Mog+, Cldn11+), astrocytes (AST, Slc1a2+, Rfx4+, Aqp4+), olfactory ensheathing cells (OEC, Alx3+, Alx4+, Frzb+), vascular cells (VAS, Nes+, Tbx18+, Foxf2+) and cells within the spectrum of oligodendrocyte progenitors cells (OPCs), committed OPCs (COPs) and newly formed oligodendrocytes (NFOLs) (OPC, Pdgfra+, Neu4+, Gpr17+) in the GFP+ fraction (Figures 1j, 2, Extended Data Figure 4). GFP-cells were comprised mainly of neurons (NEU, Rbfox3+, Neurod2+), both excitatory (Exc, Slc17a7+) and inhibitory (Inh, Gad1+, Gad2+), astrocytes (AST, Slc1a2 +, Rfx4 +, Aqp4 +) and microglia (MGL, C1qa+, CD45/Ptprc+) (Figures 1j, 2, Extended data Figure 4). We could identify similar populations in H3K27me3 scCUT&Tag and annotate them using a combination of markers that lacked the repressive mark in the vicinity of the marker gene regions (Figure 1j, 2, Extended Data Figure 4).
Figure 2. De novo identification of cell types by cell type specific scCut&Tag marker regions.
a-b. Projection of scCut&Tag gene activity scores of (a) H3K4me3 and (b) H3K27me3 on two-dimensional UMAP embedding. Gene name is depicted in the title and specific population is highlighted in the UMAP plot by labeling the cell type. c-d. Heatmap representation of the scCUT&Tag signal for (c) H3K4me3 and (d) H3K27me3. X axis represents genomic region, each row in Y axis contains data from one cell. Cell correspondence to clusters is depicted by color bar on the right side of the heatmap and annotated with cell type. Signal is aggregated per 250 bp windows and binarized. e-f. Aggregated pseudobulk scCUT&Tag profiles for four histone modifications in all identified cell types at the loci of selected marker genes (Slc1a2 – astrocytes and Mbp – oligodendrocytes).
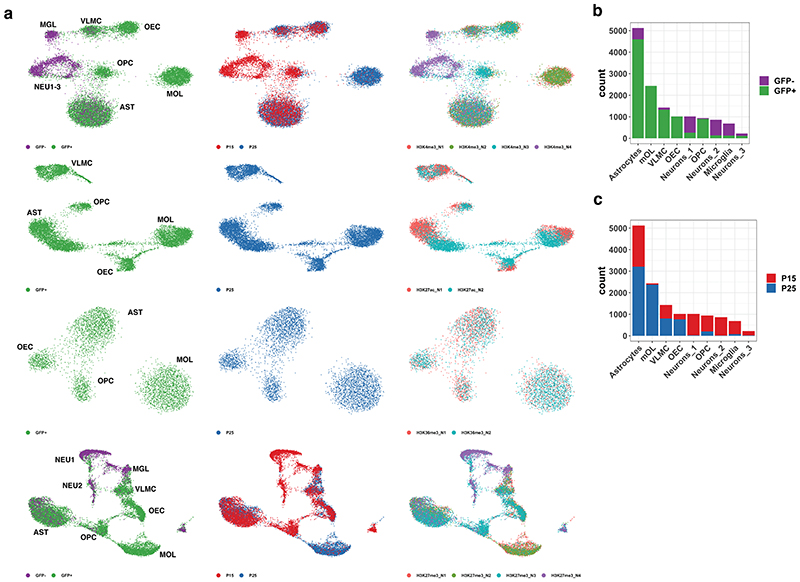
The clustering was highly reproducible among biological replicates and cells originating from P15/P25 age were well intermingled within the clusters (Extended Data Figure 5a–c). The cell states of OLG lineage reflect the mouse age with majority of OPCs originating from P15 and differentiated OLG coming from P25 (Extended Data Figure 5b, c). Interestingly, we detected a major, likely transient population of astrocytes, in GFP+ fraction of the Sox10:Cre/RCE mouse (Extended Data Figure 2a, 2c), most probably derived from ventral regions22–24.
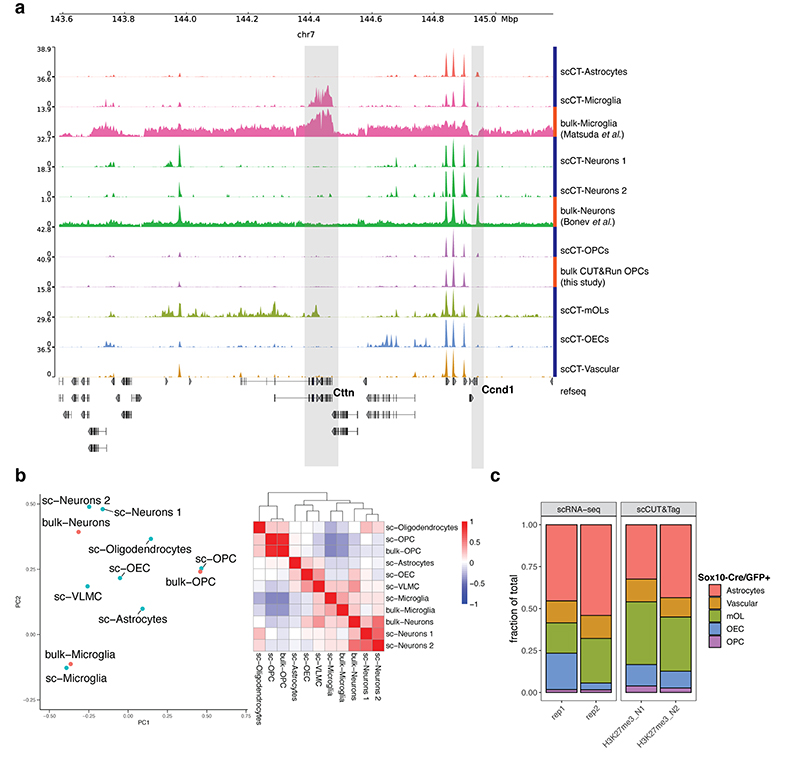
In order to benchmark the scCUT&Tag profiles of brain cell populations, we compared them to previously published bulk brain H3K27me3 ChIP-seq25,26 and in-house generated bulk H3K27me3 Cut&Run data. Inspection of genome browser tracks revealed similarity between corresponding populations of bulk and single-cell tracks and lower level of background signal in scCUT&Tag data (Extended Data Figure 6a). Moreover, the corresponding bulk and scCUT&Tag datasets clustered together on a PCA plot generated from the top 150 most variable marker regions (Extended Data Figure 6b). We also performed scRNA-seq from Sox10-Cre/GFP+ sorted cells and determined that the proportions of cell types obtained by scCUT&Tag and by scRNA-Seq were similar (Extended Data Figure 6c).
Integration of scCUT&Tag data with single-cell gene expression
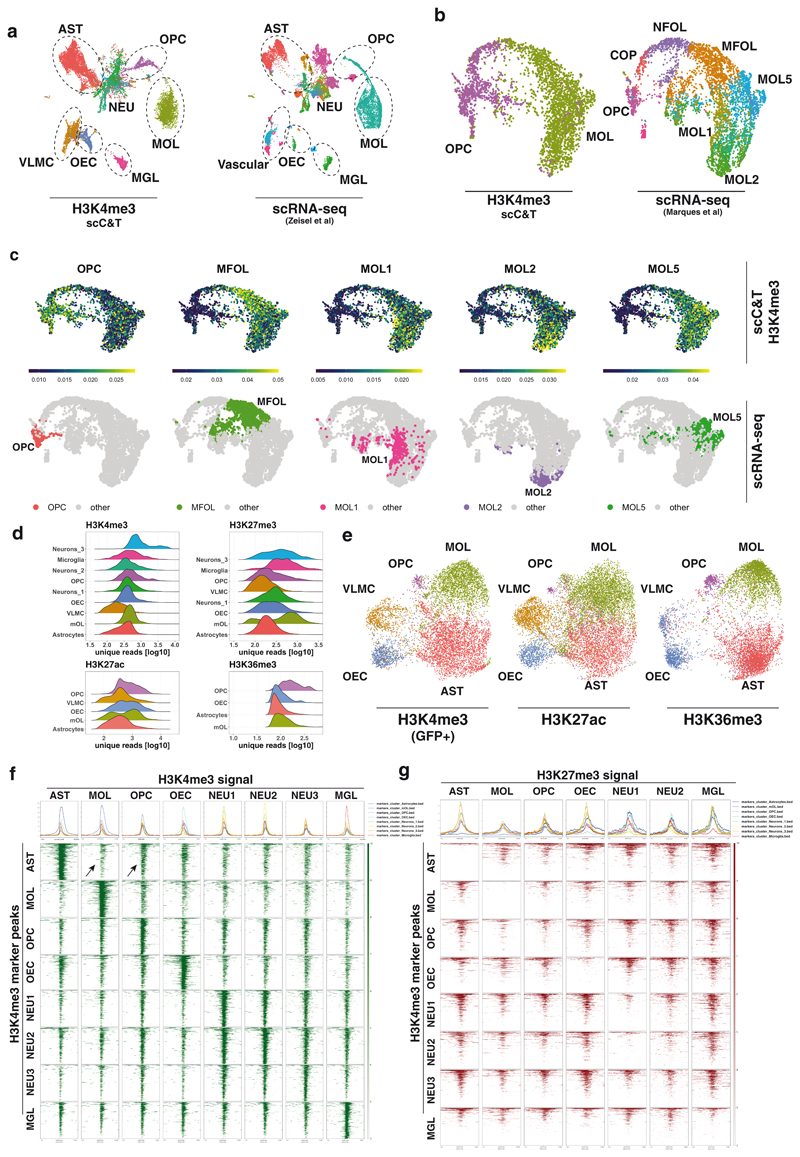
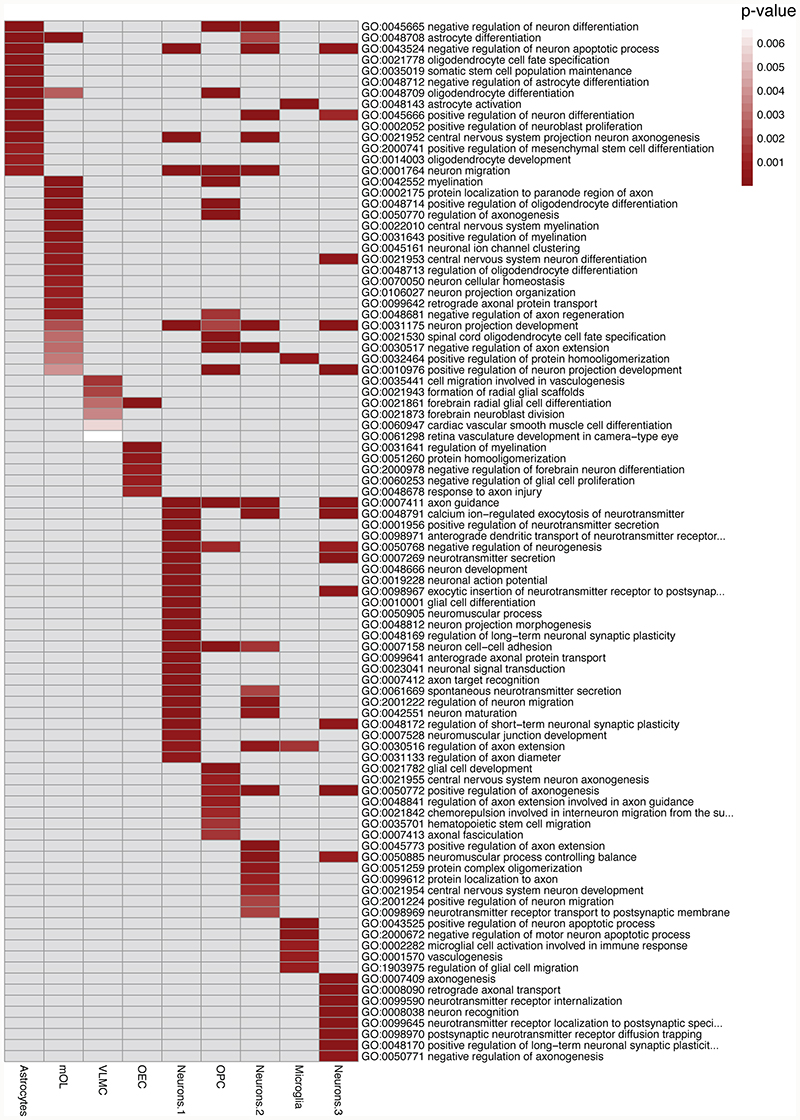
In order to validate the manual annotation of the clusters, we used the adolescent mouse brain scRNAseq atlas1. We picked the one hundred most specifically expressed marker genes for selected populations, generated metagene modules and then calculated gene activity score (scCUT&Tag signal in gene body and promoter) within the module. We found that the specific cell clusters showed enrichment of the metagene signal for the active modifications and were depleted of the signal in the H3K27me3 dataset (Extended Data Figure 7), supporting the cluster annotations. Furthermore, we integrated the H3K4me3 scCut&Tag with the scRNA-seq data using canonical correlation analysis (CCA)27 at the single cell level. We found that the major cell populations co-cluster together with the corresponding scRNA-seq population (Figure 3a). Finally, we used gene ontology (GO) terms analysis to functionally annotate the H3K4me3 scCUT&Tag clusters and found GO terms such as astrocyte differentiation and activation (AST), myelination (OLG), regulation of myelination (OEC), cell migration involved in vasculogenesis (VAS), glial cell development (OPCs), neuron development, neuron maturation and axonogenesis (NEU) and microglial cell activation involved in immune response (MGL) (Extended Data Figure 8) to be specifically enriched in respective clusters.
Figure 3. Integration of the scCUT&Tag data with single-cell gene expression.
a. Coembedding of the H3K4me3 scCUT&Tag data together with the mouse brain atlas scRNA-seq data1. b. Coembedding of the H3K4me3 of OPC and MOL clusters together with the scRNA-seq data16 depicting heterogeneity of the OLG lineage. c. Metagene activity scores of OLG lineage sub-clusters. Activity scores are calculated by aggregating the H3K4me3 scCUT&Tag signal (in gene body and promoter) over the 200 most specific genes (determined by p-value) expressed in the corresponding scRNA-seq cluster16. The corresponding scRNA-seq populations are highlighted in the UMAP plots in the bottom row d. Ridgeline plots depicting histogram of number of unique reads per population of four histone modifications. e. Coembedding of the scCUT&Tag data of three active histone modifications – H3K4me3, H3K27ac and H3K36me3 in a single two-dimensional UMAP space. H3K4me3 dataset was filtered for cells corresponding to populations present in the GFP+ samples. f-g. Metagene heatmaps of (f) H3K4me3 and (g) H3K27me3 occupancy in populations (x axis) at the loci of H3K4me3 peaks (y axis). Arrows highlight the H3K4me3 signal in MOL and OPC populations around the AST marker regions. AST – Astrocytes, MOL – Mature Oligodendrocytes, OPC - Oligodendrocyte progenitor cells, NFOL – Newly formed oligodendrocytes, NEU – Neurons, MGL - Microglia, VLMC – Vascular and leptomeningeal cells, OEC – Olfactory ensheating cells.
The scCUT&Tag data was able to resolve the major cell types in a heterogenous sample. However, a previous study had shown that further cell subtypes can be detected in the population of oligodendrocytes16. Therefore, we asked whether this heterogeneity can be resolved by integration of the scCUT&Tag data with an existing OLG scRNA-seq dataset16. For this purpose, we co-embedded the H3K4me3 scCUT&Tag and scRNA-seq using CCA, which showed good integration of the techniques, while the scRNA-seq clustering was retained (Figure 3b). We then used metagene scores of OPC, MFOL, MOL1, MOL2 and MOL5 to reveal cell subtype signatures within the H3K4me3 scCUT&Tag data. Interestingly, we found that the population of oligodendrocytes that appeared homogenous could be further deconvoluted into sub-populations enriched in module-specific genes (Figure 3c), indicating that oligodendrocyte heterogeneity is reflected at an epigenetic level.
Differential global and genome-wide patterns of histone modifications in the single-cell populations
Since the scCUT&Tag profiles are generated simultaneously for all present populations, it allows for quantitative analysis of global and genome-wide pattern of histone modifications in them. We used the number of unique reads per cell as a proxy for absolute amount of the histone modification in single cells. We found a substantial variability in this regard (Figure 3d). This is most prominent for H3K27me3, which is enriched in populations of oligodendrocytes, microglia and a subset of neurons, relative to the other populations (Figure 3d). Enrichment of H3K27me3 in oligodendrocytes is consistent with the recent finding that H3K27me3 drives oligodendrocyte-astrocyte switch during development28. Interestingly, we also observed relatively higher amounts of H3K36me3 in the population of immature oligodendrocytes (OPC/COP-NFOL stages) (Figure 3d). Although heterogeneity in the global levels of antibody-specific signal in cell types could be caused by differential permeability and/or tagmentation, we did not notice consistent enrichment of signal across all histone modifications in specific cell types. Therefore, it is unlikely that the signal heterogeneity is caused by differential tagmentation efficiency between cell types but rather by differential levels of modifications between the cell types.
Next, we asked whether we could assign cell populations across the different active modifications and cross-correlate them. For this purpose, we used the CCA to integrate the data at gene resolution. Strikingly, the obtained two-dimensional representation of the data recapitulated the original non-supervised clustering with great precision (Figure 3e) and the clusters annotated with the same cell type in different datasets co-occupied the same low dimensional space (Figure 3e). To further look at the interplay between active and repressive marks, we identified all active promoters specific for individual populations marked by H3K4me3 and plotted signal of H3K4me3 (Figure 3f) and H3K27me3 (Figure 3g) per cluster for all the populations. As expected, we observed depletion of H3K27me3 when the promoter is enriched in H3K4me3 in the respective population (Figure 3g). Interestingly, we noticed that astrocyte-specific genes had higher H3K4me3 signal in OPCs than in MOLs (Figure 3f). Besides, H3K27me3 signal was depleted from OPC-specific genes in MOLs, but not in astrocytes (Figure 3g), suggesting that H3K27me3 is not required to repress OPC genes during MOL differentiation. In contrast, H3K27me3 signal was present in AST-specific genes in OPCs and MOLs (Figure 3g). Consistently, it was recently reported that disruption of H3K27me3 impairs OPC differentiation to MOL, and triggers switch towards an astrocytic faith29. Moreover, the presented epigenetic profiles suggest that astrocytes are epigenetically (H3K4me3) related to OPCs.
Increase in breadth of H3K4me3 upon oligodendrocyte differentiation
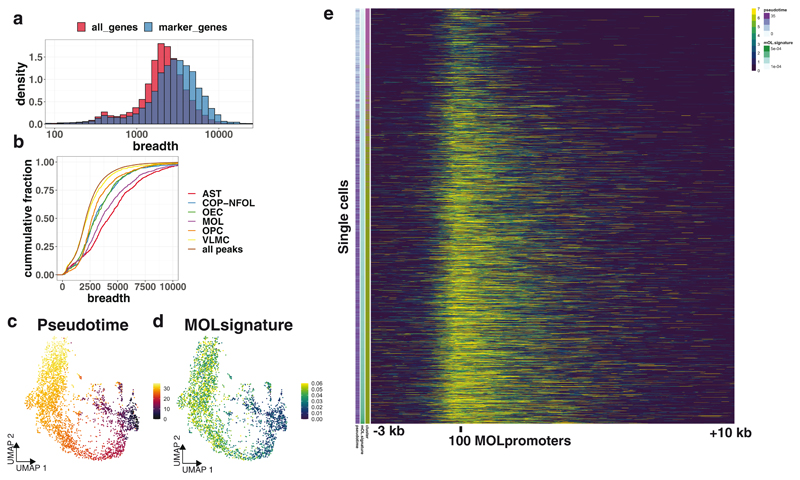
The breadth of the H3K4me3 mark has been previously linked to cell identity, gene expression and transcriptional consistency across a variety of cell types30. We noticed in the H3K4me3 pileup analysis that both amplitude and breadth of the H3K4me3 signal were increased at population-specific marker gene promoters, when compared to marker gene promoters of other populations (Extended Data Figure 4e–h). To quantify the breadth, we specifically looked at promoters of marker genes identified from scRNA-seq data. We found that the marker genes of the identified populations had on average higher H3K4me3 breadth (Figure 4a). Moreover, the magnitude of the breadth was different for individual cell types with the broadest H3K4me3 peaks on the promoters of astrocytes and oligodendrocytes, and the narrower on VLMCs, but also OPCs (Figure 4b), which could suggest an increase of H3K4me3 breadth during transition from progenitor states to fully differentiated states. To further look into the dynamics of H3K4me3 spreading, we leveraged the ability of scCut&Tag to visualize H3K4me3 spreading at the single cell resolution and investigated the H3K4me3 breadth during the process of differentiation of MOLs from OPCs. We generated single-cell H3K4me3 metagene profiles around MOL specific marker genes. We then ordered the cells (OPCs and MOL) in the matrix according to H3K4me3 signal coming from genes expressed in MOLs (MOL signature) and validated by pseudotime analysis (Figure 4c, 4d). Strikingly, we observed a gradual increase in the breadth of the H3K4me3 signal at MOL promoters with single cell resolution (Figure 4e), which is consistent with spreading of H3K4me3 as the cells progress towards differentiated oligodendrocyte identity.
Figure 4. Spreading of H3K4me3 mark at promoters at single-cell resolution.
a. Histogram of breadth of H3K4me3 around promoters of all annotated genes (all_genes) and genes that are marker genes for specific populations in scRNA-seq (marker_genes). b. Cumulative distribution of the breadth of H3K4me3 peaks around the promoters of marker genes identified from scRNA-seq. c. Pseudotime analysis of the OLG lineage H3K4me3 scCUT&Tag data that was integrated with scRNA-seq data16. d. MOL signature score (H3K4me3 signal in MOL-specific gene body and promoter normalized to total number of reads in each cell) projected on the UMAP representation of H3K4me3 scCUT&Tag data. e. Heatmap depicting H3K4me3 spreading from the promoters of MOL-specific genes. Each row represents a single cell. Cells are ordered by the MOL signature score, that is correlated also with pseudotime. X axis shows the genomic distance from the meta-promoter (-3kb / +10kb). Meta-promoters are promoters of top 100 most specifically expressed genes in MOLs defined by scRNA-seq data.
Single cell Cut&Tag of transcription factors
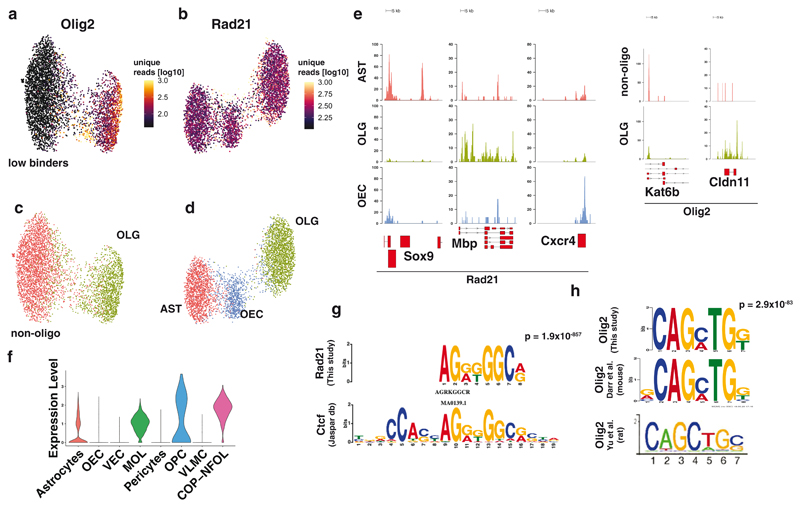
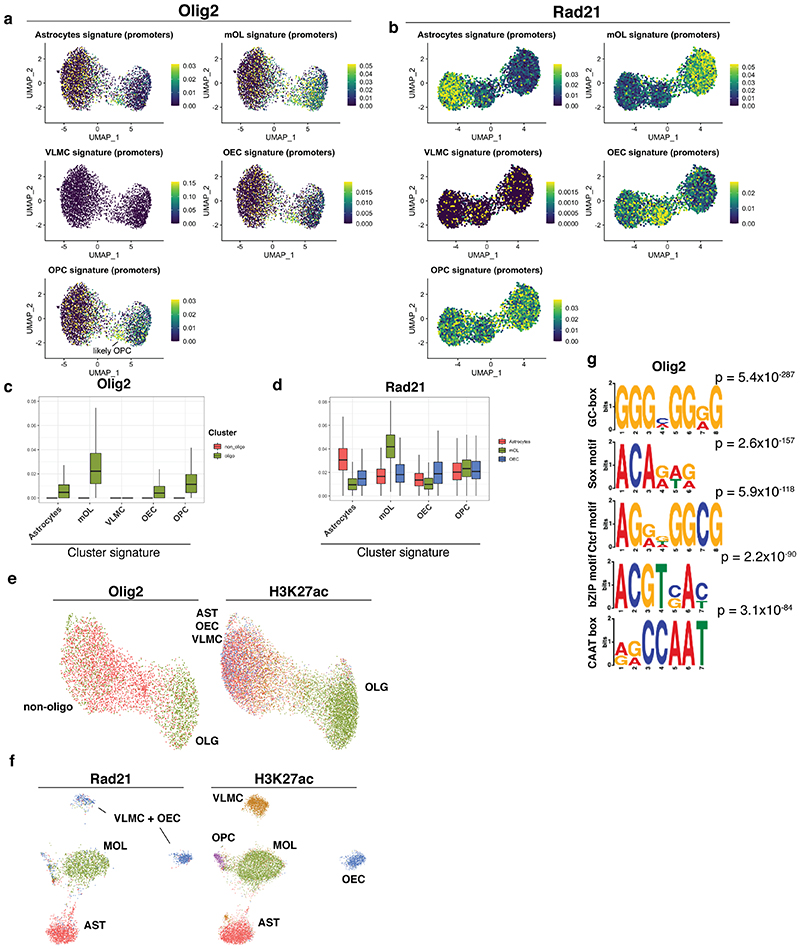
Transcription factor binding is notoriously difficult to profile using ChIP-seq in low input samples. Therefore, we asked whether scCUT&Tag was able to uncover the binding of transcription factors at a single-cell resolution. We chose the transcription factor (TF) Olig2 since it is specific for glial populations, and Rad21, a general chromatin architecture factor and a subunit of the cohesin complex. We performed scCUT&Tag in GFP+ sorted cells from the brain at postnatal day P25. The number of unique reads per cells was lower for TF scCUT&Tag compared to histone modifications. Nevertheless, we were able to obtain in median 48 and 240 unique reads per cell in Olig2 and Rad21 scCUT&Tag respectively. We reduced the dimensionality of the dataset using LSI and UMAP and obtained specific clusters for Rad21 and Olig2 (Figure 5a–d). Olig2 dataset separated into 2 clusters based on depth (number of unique reads per cell), and we annotated the cluster with low number of unique reads as “low binders” (Figure 5a). Since manual annotation of populations based on markers is challenging in TF Cut&Tag (Figure 5e), we based cluster annotation on the assumption that Olig2/Rad21 binding in specific cell types is correlated with enhancer/promoter activity. Therefore, we analyzed Olig2/Rad21 binding in promoter regions of genes that are specifically modified by H3K4me3 in scCUT&Tag data, and identified populations of AST, OLG and OEC in Rad21 scCUT&Tag and OLG and non-OLGs (‘low binders’) in Olig2 scCUT&Tag (Extended Data Figure 9a–d). The OLG population in Olig2 scCUT&Tag is likely composed of both mature OLG and OPCs, which appear to form a subpopulation within the OLG cluster (Extended Data Figure 9a). To further strengthen the cluster annotations, we performed co-embedding of the Rad21/Olig2 with another histone modification – H3K27ac using CCA and found that the identified clusters consistently co-embeded with the corresponding H3K27ac clusters (Extended Data Figure 9e). Interestingly, the low binder non-OLGs cells randomly co-embedded with the populations of OEC, Astrocytes and vascular cell clusters that were defined by H3K27ac, whereas OLG cluster specifically co-embeded with the OLG H3K27ac signal (Extended Data Figure 9e). This finding is consistent with expression of Olig2 throughout the cell types, being highly expressed throughout the OLG lineage, whereas OECs and VLMCs do not express Olig2 and only small portion of astrocytes express Olig2 (Figure 5f).
Figure 5. scCUT&Tag analysis of transcription factors binding.
a-b. Two dimensional UMAP embedding of (a) Olig2 and (b) Rad21 scCUT&Tag data with coloring by the number of unique reads per cell. c-d UMAP embedding of the (c) Olig2 and (d) Rad21 scCUT&Tag with coloring by the cell type. e. Pseudobulk profiles of Olig2 and Rad21 scCUT&Tag data aggregated by cell type around the marker gene regions. f. RNA expression of Olig2 from scRNA-seq data for cell types present in Sox10-Cre/RCE+ populations. g. Logo representation of the motif that was found to be the most enriched in the scCUT&Tag of Rad21 and its alignment with the motif of transcription factor Ctcf retrieved from the Jaspar database. h. Logo representation of the motif found to be enriched in the Olig2 Cut&Tag that is consistent with the previously reported Olig2-specific motif33,34. The newly discovered motif was compared to known motifs from Jaspar database using TomTom from MEME suite without small sample correction (--no-ssc option). AST – Astrocytes, MOL – Mature Oligodendrocytes, OPC - Oligodendrocyte progenitor cells, NEU – Neurons, MGL - Microglia, VLMC – Vascular and leptomeningeal cells, OEC – Olfactory ensheating cells.
To validate the specificity of the scCUT&Tag, we searched for enriched motifs in binding sites using MEME suite31 in merged pseudo-bulk datasets of Rad21 and Olig2. We found the motif of chromatin architecture factor, CTCF as the highest enriched in the Rad21 dataset (Figure 5g), which is consistent with the cooperativity between Ctcf and Cohesin32. We found several motifs enriched in the Olig2 scCUT&Tag, including motif CAGMTG, similar to the previously identified CAGMTG/CAGCTG motif specific for Olig2 (Figure 5h) in mouse33 and rat34 respectively. Together with the previously identified Olig2 motif, we found enrichment of multiple general eukaryotic enhancer and promoter features (GC box, CAAT box). Interestingly, we also found a motif similar to the motif of transcription factors from the Sox family (ACARWR, Extended Data Figure 9f), which is consistent with physical interaction and cooperativity between Olig2 and members of Sox family of transcription factors (Sox8, Sox10)35.
Prediction of enhancer-promoter interactions from scCut&Tag data
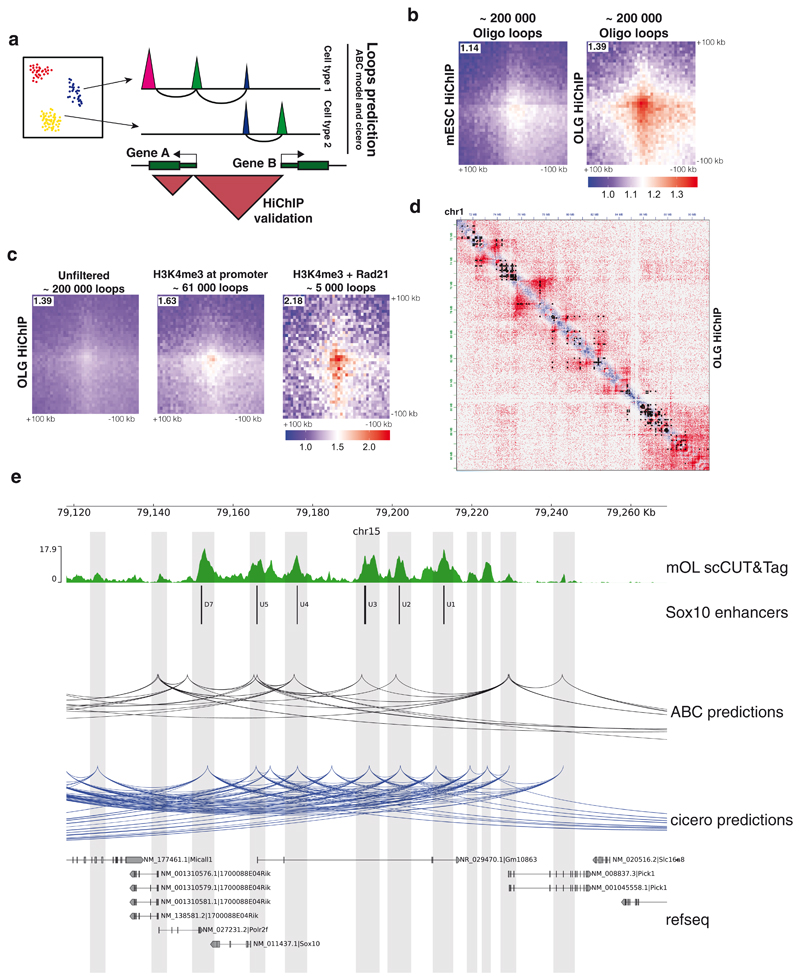
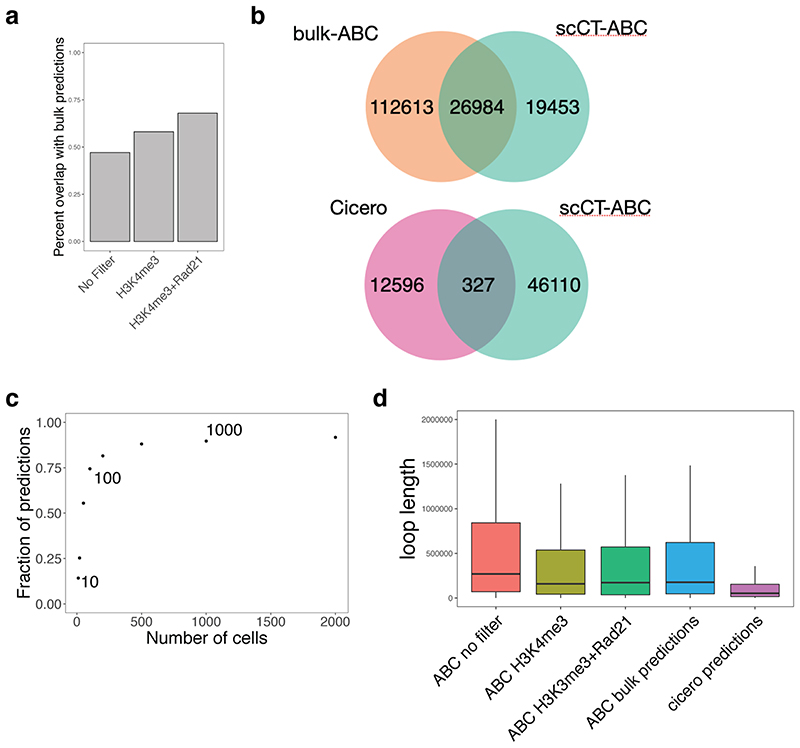
Perhaps the most intriguing and challenging task of epigenomics is to use epigenetic data to predict gene regulatory networks. Our scCUT&Tag dataset is a rich resource that can be used to tackle this question in specific cell populations. We used the activity-by-contact model (ABC model)36 of enhancer-promoter interactions to predict the gene-enhancer regulatory networks from aggregated scCUT&Tag data (Figure 6a). We focused on OLG and ran the ABC model using oligodendrocyte H3K27ac scCUT&Tag, oligodendrocyte scATAC-seq data (P50 cortex, 10x Genomics) and Hi-C of neural progenitor cells26. By using the neural progenitor cells Hi-C we ensured that we did not provide the model with accurate measurements of DNA looping, but rather used the Hi-C data to estimate the long-distance chromosome topology. The ABC model predicted ~200,000 enhancer-promoter loops in the oligodendrocyte lineage. The predicted loops were consistent with loops predicted by the ABC model from bulk OLG Cut&Run data (Extended Data Figure 10a, b). We also downscaled the scCUT&Tag data and could see the robustness of predictions from as few as 100 cells (74.4% overlap with full dataset, Extended Data Figure 10c).
Figure 6. Prediction of gene regulatory networks from the scCUT&Tag data.
a. Schematic depicting the strategy used to predict and validate the promoter-enhancer specific loops. Loops are predicted using the H3K27ac scCUT&Tag and other publicly available datasets (see Methods). Presence of loops is validated by H3K27ac HiChIP analysis of purified populations of OLG lineage b. Pileup analysis of 200,000 loops predicted by the ABC model. Signal of HiChIP performed in either mES cells or OLG lineage cells was aggregated and plotted as a heatmap with the center at the intersection of the loop coordinates. c. Pileup analysis of loops predicted by ABC and filtered using H3K4me3 (~61,000 loops) and Rad21 (~5000 loops) scCUT&Tag data. d. Representative overlay of OLG HiChIP matrix with the loops predicted by the ABC model from the scCUT&Tag data and filtered with the H3K4me3 signal (black dots). e. Representative example of the loops predicted by Cicero and ABC model from H3K27ac scCUT&Tag data. Known Sox10 enhancers and putative new candidate enhancers are highlighted with grey bars.
In order to examine the contact probability of predicted interactions, we performed HiChIP of H3K27ac from primary mouse OPC cultures, containing mainly OPCs but also differentiated oligodendrocytes. To investigate the cell-type specificity of the predictions, we generated pileups using Oligodendrocyte H3K27ac HiChIP data and H3K27ac HiChIP performed in mouse embryonic stem cells37 and found that the predicted loops were highly specific for oligodendrocytes (Figure 6b). We then used the scCUT&Tag data to further refine the loops. We used the H3K4me3 signal in the oligodendrocyte population to filter for promoters that were active in oligodendrocytes, which yielded 61,000 loops. Cohesin binding has been associated with loop formation38, so we further filtered the predictions using the presence of Rad21 binding on both sides of the loop (promoter and enhancer), which resulted in approximately 5,000 loops. These loops showed substantially higher specificity in the HiChIP pileup signal, compared to the original set of unfiltered loops (Figure 6c) and higher overlap between ABC predictions from bulk CUT&Run and scCUT&Tag (Extended Data Figure 10a). Finally, loops predicted by the ABC model and filtered by H3K4me3 signal overlapped well with H3K27ac-mediated loops and stripes, when inspected in a 2D matrix representation (Figure 6d).
Cicero39 can be used to predict cell type specific interactions of cis-regulatory regions through a different approach - correlating the ATAC-Seq signal in single cells. Applying Cicero to the scCUT&Tag data, we found 14,322 correlated features with a correlation score > 0.2 in mOLs. Cicero predictions modestly overlapped with ABC model predictions (Extended Data Figure 10b) and the length of the predicted loops was substantially different between cicero and ABC model (Extended Data Figure 10d). Nevertheless, both predictions methods successfully identified known Sox10 enhancers 40 and connected them to the Sox10 promoter (Figure 6e). Altogether, loop predictions based on scCUT&Tag data can serve as an important tool to identify candidate regulatory interactions and guide future studies and/or perturbations of cell type specific regulatory elements.
Discussion
The emergence of single-cell resolution transcriptomic technologies has allowed the investigation of developmental biology processes with exquisite detail. However, the underlying regulatory epigenetic processes still remain to be uncovered at such resolution. Here, we provide for the first time a high-throughput study of chromatin modifications and transcription factor binding at single-cell resolution in the mouse brain. We coupled the CUT&Tag protocol6 with a single-cell barcoding platform that is robust, widespread, and well established as a standard in single-cell epigenetics.
To demonstrate the performance of scCUT&Tag, we generated an extensive dataset of histone modifications in juvenile mouse at the age of P15-P25, at the time of differentiation of OPCs into mature oligodendrocytes and at the peak of myelination. We generated H3K4me3 and H3K27me3 genome tracks for all major cell types in the brain, and H3K27ac and H3K36me3 tracks for glial cell populations. We show that analysis of histone modifications at a single-cell level allows identification of distinct neural cell types, with the active marks H3K4me3 and H3K27ac and the repressive mark H3k27me3 being particularly useful for this purpose.
The main strength of scCUT&Tag when applied to tissues lies in its unbiased and unsupervised nature. We were able to de novo identify distinct populations of cells and find unique peaks of histone modifications at genomic elements such as promoters, enhancers and gene bodies of marker genes. This allows the examination of dynamics of epigenetic changes in virtually any biological process without a priori knowledge about the process and the study of epigenetic regulation of gene expression. With low background signal, scCUT&Tag can yield merged genomic tracks from as few as 500 cells, with quality comparable to bulk ChIP-seq performed on hundreds of thousands to millions of cells. Acquiring such detailed data was previously possible only for cultured cell lines, at whole tissue resolution41, or after detailed characterization of cell surface markers that could be used for sorting of cell populations.
We further used the scCUT&Tag data to examine epigenetic heterogeneity in the oligodendrocyte lineage, the spreading of H3K4me3 and for predicting enhancer-promoter connections. scCUT&Tag allowed the deconvolution of potential H3K4me3/H3K27me3 bivalency, but also revealed a close epigenetic relationship between OPCs and astrocytes. We also observed an increase in H3K4me3 breadth during the process of differentiation in the OLG lineage at unprecedented resolution, indicating that spreading of this modification can be used to delineate lineage progression. Finally, we also show that histone modification and transcription factor binding data can be used together with predictive models to infer looping of cis-regulatory elements in primary cell types. Predictions of DNA loops can be a useful tool to narrow down potential candidate DNA interactions and target them by functional perturbations.
We also generated scCUT&Tag profiles for glial transcription factor Olig2 and chromatin architecture factor Rad21. While Olig2 preferentially binds oligodendrocyte lineage specific enhancers and promoters and binds only weakly to astrocyte-specific gene regulatory regions, Rad21, a ubiquitously expressed genome architecture factor, binds cell type–specific promoters and enhancers. Although the TF scCUT&Tag data is sparser than scCUT&Tag of histones, we were still able to distinguish cell identity based only on Rad21 binding for all cell types, except for vascular cells and OPCs, which are the smallest cell populations and share features with larger populations. The Rad21 binding at single-cell resolution provides valuable insights into enhancer-promoter connectivity and we show that it can be incorporated into models that aim to uncover enhancer-promoter connections.
Although the provided datasets provide unique insights into epigenetic regulation, improvement of the technology, especially number of unique fragments per cell can further enhance the possible applications. In the current state, scCUT&Tag is able to distinguish the major cell types but fails to uncover heterogeneity of the subpopulations in an unsupervised manner. We could only reveal the oligodendrocyte heterogeneity at H3K4me3 level upon integration with more complex scRNA-seq data. Potential introduction of multi-omic approaches, such as simultaneous measurement of scCUT&Tag and RNA-seq signal from the same cell will help us to further understand causal relationships between epigenetic modifications and gene expression.
Online Methods
Animals
The mouse line used in this study was generated by crossing Sox10:Cre animals7 (The Jackson Laboratory mouse stock number #025807) on a C57BL/6j genetic background with RCE:loxP (EGFP) animals8 (The Jackson Laboratory mouse stock number #32037-JAX) on a C57BL/6xCD1 mixed genetic background. Females with a hemizygous Cre allele were mated with males lacking the Cre allele, while the reporter allele was kept in hemizygosity or homozygosity in both females and males. In the resulting Sox10:Cre-RCE:LoxP (EGFP) animals the entire OL lineage was labeled with EGFP. Breeding with males containing a hemizygous Cre allele in combination with the reporter allele to non-Cre carrier females resulted in early Cre activation in the whole animal and consequently avoided. All animals were free from the most common mouse viral pathogens, ectoparasites, endoparasites, and mouse bacteria pathogens harbored in research animals. The battery of screened infective agents met the standard health profile established in Karolinska Institutet animal housing facilities. Mice were kept with the following light/dark cycle: dawn 6:00-7:00, daylight 7:00-18:00, dusk 18:00-19:00, night 19:00-6:00 and housed to a maximum number of 5 per cage in individually ventilated cages (IVC sealsafe GM500, tecniplast). Cages contained hardwood bedding (TAPVEI, Estonia), nesting material, shredded paper, gnawing sticks and card box shelter (Scanbur). The mice received regular chew diet (either R70 diet or R34, Lantmännen Lantbruk, Sweden, or CRM-P, 801722, Special Diet Services). General housing parameters such as relative humidity, temperature, and ventilation follow the European convention for the protection of vertebrate animals used for experimental and other scientific purposes treaty ETS 123. Briefly, consistent relative air humidity of 50%, 22 °C and the air quality is controlled with the use of stand-alone air handling units supplemented with HEPA filtrated air. Monitoring of husbandry parameters is done using ScanClime (Scanbur) units. Water was provided by using a water bottle, which was changed weekly. Cages were changed every other week. All cage changes were done in a laminar air-flow cabinet. Facility personnel wore dedicated scrubs, socks and shoes. Respiratory masks were used when working outside of the laminar air-flow cabinet. Littermate animals were sacrificed either at postnatal (P4-P6) or at juvenile stages (P21-25) and both sexes were included in the study. All experimental procedures on animals were performed following the European directive 2010/63/EU, local Swedish directive L150/SJVFS/2019:9, Saknr L150 and Karolinska Institutet complementary guidelines for procurement and use of laboratory animals, Dnr. 1937/03-640. The procedures described were approved by the local committee for ethical experiments on laboratory animals in Sweden (Stockholms Norra Djurförsöksetiska nämnd), lic. nr. 131/15, 144/16 and 1995_2019.
Antibodies
H3K4me3 (1:50, Diagenode, C15410030), H3K27ac (1:50, Abcam, Ab177178), H3K27me3 (1:50, Cell Signaling, 9733T), H3K36me3 (1:50, Abcam, Ab9050), Rad21 (1:50, GeneTex, GTX106012), Olig2 (1:50, Novus Biologicals, NBP1-28667), Guinea pig anti-rabbit (1:50, Novus Biologicals, NBP1-72763).
Single cell Cut&Tag
Single cell Cut&Tag was performed as in Kaya-Okur et al.6 with the modifications below. A step-by-step protocol is also available at https://dx.doi.org/10.17504/protocols.io.bqbnmsme. The Cut&Tag was performed in 0.5 ml tubes, all washes and incubation volumes were 200 ul unless otherwise stated and all centrifugations were done using swinging bucket centrifuge, with appropriate tube adaptors.
150,000 GFP+ or GFP-cells were sorted from the brain of Sox10::Cre/RCE animals on post-natal day 15 (P15) or P21-P25 using fluorescent assisted cell sorting (FACS Aria III or FACS Aria Fusion) directly into 500 ul of Antibody buffer (20 mM HEPES pH 7.6, 150 mM NaCl, 2mM EDTA, 0.5 mM Spermidine, 0.05% Digitonin, 0.01 % NP-40, 1x Protease inhibitors, 1% BSA), centrifuged for 5 minutes at 300 x g force, washed 1x with the antibody buffer, resuspended in 200 ul antibody buffer with 1:50 diluted primary antibody and incubated overnight with slow rotation. Next day the nuclei were centrifuged 3 minutes at 600 x g, washed 1x with 200 ul of Dig-wash buffer (20 mM HEPES pH 7.6, 150 mM NaCl, 0.5 mM Spermidine, 0.05% Digitonin, 0.01 % NP-40, 1x Protease inhibitors, 1% BSA), resuspended in 200 ul of Dig-wash buffer with 1:50 diluted secondary antibody (Guinea pig anti-rabbit, Novus Biologicals, NBP1-72763) and incubated for 1h at room temperature with slow rotation. Then, nuclei were centrifuged 3 minutes at 600x g, washed three times with 200 ul of Dig-wash buffer, resuspended in 200 ul of Dig-300 buffer (20 mM HEPES pH 7.6, 300 mM NaCl, 0.5 mM Spermidine, 0.05% Digitonin, 0.01 % NP-40, 1x Protease inhibitors, 1% BSA) with 1:100 diluted proteinA-Tn5 fusion and incubated for 1 hour rotating at room temperature. After Tn5 binding, the cells were centrifuged 3 minutes at 300 x g and washed 3x with Dig-300 buffer, resuspended in 200 ul of tagmentation buffer (20 mM HEPES pH 7.6, 300 mM NaCl, 0.5 mM Spermidine, 0.05% Digitonin, 0.01 % NP-40, 1x Protease inhibitors, 10 mM MgCl2), without BSA and incubated for 1 hour at 37°C. After that, tagmentation was stopped by addition of 10 ul of 500 mM EDTA and 200 ul of Dig-300 buffer, and mixed by gently pipetting up and down several times (Final 0.5 % BSA, critical, otherwise the nuclei would clump during the centrifugation). Then the nuclei were centrifuged 3 minutes @ 300 x g and washed once with 200ul of 1x diluted nuclei buffer supplemented with 2% BSA (Chromium Next GEM Single Cell ATAC Library & Gel Bead Kit v1.1, 10x Genomics). qPCR cycle check can be performed at this stage. Take 20ul (10%) of the sample, transfer to a clean tube and add 73ul of water, 5ul of 10% SDS and 2ul of proteinase K (Invitrogen, AM2546). Mix well, incubate 30 minutes at 50 degrees celsius and then purify using ZYMO DNA clean&concentrator-5 kit with 1:5 ratio of binding buffer. Elute in 25 ul and use 10ul as a template for qPCR reaction – 2ul fw ATAC primer, 2ul rev ATAC primer3, 2.5 ul 10xSYBR (ThermoFisher, S7563, diluted to 10x), 8.5ul water, 10ul template, 25ul 2x NEBnext High-Fidelity PCR master mix. PCR program 1. 5min 72C, 2. 1min 98C, 3. 15s 98C, 4. 10s 63C, 5. Goto 3 40x. Successful experiment can be identified by comparing CT values to IgG CUT&Tag.
The rest of the sample was centrifuged 3 min at 300x g and resuspended in 15-25 ul of 1xPBS + 1%BSA or 1x DNB + 2%BSA before counting with counting chamber with trypan blue staining (2ul+8ul trypan blue). At this stage clumping of the nuclei can be checked (with either trypan blue stain or DAPI) and if the sample is sufficient quality, processed using 10x chromium single cell ATAC-seq kit, skipping the Step 1 “Transposition” and continuing from Step 2.0 Generation & barcoding. For version v1 of scATAC-seq kit (Chromium Single Cell ATAC Library & Gel Bead Kit, 10x Genomics) prepare mastermix: 15ul nuclei suspension (in 1xPBS+1%BSA or 1xDNB+2%BSA), barcoding reagent 61.5ul, reducing agent B 1.5ul, barcoding enzyme 2ul and load chromium chip E. For version v1.1 (Chromium Next GEM Single Cell ATAC Library & Gel Bead Kit v1.1, 10x Genomics) prepare mastermix: 8ul nuclei suspension (in 1xPBS+1%BSA or 1xDNB+2%BSA), ATAC buffer B 7ul, barcoding reagent B 56.5 ul, reducing agent B 1.5ul, and barcoding enzyme 2ul and load chromium chip H. 16-20 PCR cycles were used to perform the final library amplification according to Chromium Single Cell ATAC Library kit manual.
Single cell Cut&Tag data processing
Data was pre-processed using cell ranger-ATAC v1.2.0 (10x genomics), with standard parameters. However, cell identification was done manually using number of reads per cell and fraction of reads in peaks. Peaks were called using MACS42, single cell clustering and marker search was done using packages Seurat and Signac27, pseudotime analysis using slingshot43, motif search using MEME suite31, and compared to the Jaspar database44 or published ChIP-seq data, metagene plots using deepTools45 and custom scripts, most plots were generated using ggplot2 46 R package, gene regulatory networks were analysed using ABC model36 and cicero39.
Processing pipeline was build using Snakemake platoform47. Preprocessing pipeline and R notebooks used to perform analysis and generate the figures are shared at https://github.com/Castelo-Branco-lab/scCut-Tag_2020. IGV server with bigwig tracks merged per replicate are available at https://raw.githubusercontent.com/mardzix/IGV_track_server/master/registry/IGV_registry.txt. Additional information is available at the Life Sciences Reporting Summary.
Bulk Cut&Run and Cut&Tag
Cut&run was performed on Oli-neu (H3K27me3) or MACS sorted OPCs (H3K27me3) as described in Skene and Henikoff48. Sequencing library was prepared using Kapa HyperPrep library prep kit (Kapa Biosystems, 07962363001). Cut&Tag was performed on CD140 MACSed and cultured primary mouse OPCs (C5BL/6j WT) with anti-H3K27ac antibody as described in protocols.io49.
proteinA-Tn5 production
The 3xFLAG pA-fusion sequence was acquired from Addgene plasmid #124601 and inserted into psfTn5 plasmid (addgene #79107) to generate pA-Tn5 fusion construct (6xhis-TEV-3xFlag-pA-Tn5). The protein was purified from 3 litres of E.coli culture grown at in the LEX system, with protein expression temperature 18 degrees Celsius and cultivation temperature 30 degrees celsius. The temperature was switched to 18°C at OD=2 and expression induced at OD=3 with 0.5 mM IPTG. Bacteria were disrupted by sonication (4s on/4s off cycle, 3min, 80% amplitude), centrifuged for 20 min at 49 000x g, filtered through 0.45 um filter and loaded on AKTA express column and purified overnight. 5 ml of HisTrap (GE Healthcare) was used for the affinity purification and Gel filtration was performed on HiLoad 16/60 Superdex 200 (GE Healthcare). Fractions were examined on SDS-PAGE gel before pooling, then desired fractions were combined, sample was diluted 1:5 to contain final 50% glycerol, aliquoted in 200 ul aliquotes and snap frozen using liquid nitrogen. Enzyme was stored at -80°C until loading.
Tn5 loading
To begin with the complex formation, each of Mosaic end-adapter A (Tn5ME-A, TCGTCGGCAGCGTCAGATGTGTATAAGAGACAG) and Mosaic end-adapter B (Tn5ME-B, GTCTCGTGGGCTCGGAGATGTGTATAAGAGACAG) oligonucleotides were annealed with Mosaic-end reverse oligonucleotides (Tn5MErev, 5′-[phos]CTGTCTCTTATACACATCT-3′). To anneal, the oligonucleotides were diluted to 100μM. Each pair of oligos, Tn5MErev/Tn5ME-A and Tn5MErev/Tn5ME-B, was mixed separately resulting in 50μM annealed products respectively. The product was denatured in a thermocycler for 5 min at 95°C and then cooled down slowly at ramp rate 0.1 degree celsius per second in thermocycler. The loading of pA-Tn5 with the oligonucleotides was carried out by incubating 2ul 50uM Tn5MErev/Tn5ME-A, 2ul 50uM Tn5MErev/Tn5ME-B, 21.56ul Glycerol, 21.3ul 2X Dialysis buffer (100 mM HEPES-KOH pH 7.2, 0.2 M NaCl (Thermo Fisher Scientific, AM9760G), 0.2 mM EDTA (Thermo Fisher Scientific, AM9260G), 2 mM DTT, 0.2% Triton X-100 (Thermo Fisher Scientific, 85111) and 20% Glycerol), 3.14ul pA-Tn5 (63.64uM (3.5 mg/ml)), for 1h at room temperature (the final concentration is 2uM). The enzyme was stored at -20°C until further use, or at -80 for long term storage.
Tissue dissociation
Mouse were sacrificed, perfused with Phosphate Buffered Saline, 1X, pH 7.4 and brain was removed. The brain was dissociated into single cell suspension using the Neural Tissue Dissociation Kit P (Miltenyi Biotec, 130-092-628) according to the manufacturers protocol. For mouse older than P7, myelin was removed using debris removal solution (Miltenyi Biotec, 130-109-398) according to manufacturer’s instruction. Single cell suspension was filtered through 50 um cell strainer and briefly stained with 1:5000 diluted DAPI (1mg/ml) to assess cell viability. For FACS, cells were resuspended in 1xPBS supplemented with 1% BSA and 2mM EDTA and kept at 4 degrees until sorted.
Primary OPC culture
Mice brains from P4-P6 pups were dissected, dissociated (see above) and the single cell suspension was used to enrich for OPCs by CD140a microbeads (Miltenyi Biotec, 130-101-502) according to manufacturer’s instructions. Brains from 4-5 mice were pooled for one batch of OPC culture. Cells were seeded on Petri dishes or multi-well plates pre-coated with poly-L lysine (Sigma, P4707) for >1h at 37C, and Fibronectin for >1h (Sigma, F1141, 1mg/ml stock, 1:1000 diluted in 1x PBS). Cells were cultivated in OPC proliferation medium - DMEM/Gmax (ThermoFisher Scientific, 10565018), 1x N2 supplement (ThermoFisher Scientific, 17502048), 1x penicillin–streptomycin (ThermoFisher Scientific, 15140122), 1xNeuroBrew (Miltenyi 130-093-566), bFGF 20 ng ml−1 (Peprotech, 100-18B) and PDGF-AA 10 ng ml−1 (Peprotech, 100-13A) until confluency (5-6 days), passaged once and collected 72h later.
Cell lines culture
NIH-3T3 cells were cultured in DMEM (Gibco, 41966029) supplemented with 10% FBS (Gibco, 10500064) and 1x penicillin/streptomycin (Gibco, 15140122). Oli-neu cells were cultured in DMEM medium (Gibco, 41966029) supplemented with 1x N2 supplement (ThermoFisher, 17502001), 1x penicilin/streptomycin/glutamine (Gibco, 10378016), 340ng/ml T3 (Sigma, T6397), 400ng/ml T4 (Sigma, 89430), 10ng/ml bFGF (R&D, 233-FB), 1ng/ml Pdgf-BB (R&D, 520-BB) and 0.5% FBS (Gibco, 10500064). mESC (C57Bl/6J background) were cultured on 0.1% gelatin coated flasks (30 minutes) in KO-DMEM (Gibco, 10829018), supplemented with 2mM Glutamine (Sigma, G8541), 15% ES grade fetal bovine serum (Sigma, F7524), 0.1mM 2-mercaptoethanol (Sigma, M3148) and 1000U/ml leukemia inhibitory factor (Milipore, ESG1107). For early passages, mES cells were maintained on an irradiated feeder layer. To remove feeders, cells were passaged at least two passages off of feeders onto gelatin-coated plates.
Medium was changed every 2-3 days for all cell lines and cells were splitted when they reached 80% confluency by TrypLE Express (3T3, ThermoFisher, 12604013) or accutase (Oli-neu and mESC, ThermoFisher, A1110501).
scRNA-seq
GFP+ cells were sorted using the same protocol as for scCUT&Tag but collected into 1xPBS+0.5% BSA instead of antibody buffer. Then, cells were counted, and ~7000 cells processed using chromium single cell 3’ reagent kit (10x Genomics) according to manufacturer’s instructions in two biological replicates.
HiChIP
HiChIP was performed in three biological replicates with at least 1 milion cells used as input. Briefly, cultured OPCs were collected using TrypLE Express (Gibco, 12604013), washed once with 10ml of 1xPBS and crosslinked using freshly prepared 1% formaldehyde (Methanol-free, Pierce, 28906) diluted in 1x PBS for 15 minutes at room temperature with gentle rotation. Formaldehyde was quenched by addition of final 125 mM glycine and incubated for 5 min at room temperature with gentle rotation. Fixed cells were then washed once with ice cold 1x PBS, flash frozen and stored at -80 until processed. HiChIP was performed as in Mumbach et al37. Briefly, chromatin was sonicated using the covaries ME220 with settings 75 PIP, 5% duty cycle, 200 cycles/burst for 2 minutes (for 1-3 milion cells). The immunoprecipitation was performed using 2 ug of H3K27ac antibody (Abcam, Ab177178) and 20 ul of protein A dynabeads (Thermo Fisher, 007613560), with 0.75 ul of in-house produced Tn5 used for tagmentation and 15-16 cycles of final PCR amplification (NEBNext High Fidelity 2x PCR mastermix, M0541L). Barcoded libraries wer gel-purified, quantified using bioanalyzer, mixed in equimolar ratios and sequenced on one flow cell of NovaSeq S Prime (Illumina).
HiChIP data processing
Paired-end sequencing reads from HiChIP experiments were aligned to mm10 genome and processed using the HiC-Pro pipeline50. The pipeline’s hicpro2juicebox.sh script was used to generate .hic files which were loaded into Juicebox51 for viewing contact maps. The hic2cool tool (https://github.com/4dn-dcic/hic2cool) was used to generate 5kb-resolution .cool files.
ABC model
ATAC-seq data was downloaded from 10x genomics online resources (https://support.10xgenomics.com/single-cell-atac/datasets/1.2.0/atac_v1_adult_brain_fresh_5k) and cell type specific peaks were called using MACS2. Cell-type specific H3K27ac bam files were generated from the cellranger-ATAC output files. Gene expression data from the scRNA-seq was used to identify the candidate genes and high-resolution Hi-C data from neural progenitor cells26 was used to estimate contact frequency. Default parameters were used for generating the candidate enhancer list. Regulatory loops with an ABC score > 0.2 were used for downstream analyses. The coolpuppy package was used for generating pileup profiles52. In brief, OLG-specific enhancer-promoter BEDPE files from the ABC model were used as pre-defined candidate regions to look for enrichment. Pileups were performed on OPC-derived H3K27ac HiChIP data and mESC data37. All HiChIP data was balanced using the cooler library prior to performing the pileups53.
To find overlapping loops called by ABC model and Cicero, we first binned the loops into genomic bins with 10kb resolution and flattened overlapping loops within one sample. Then we searched for overlaid loops between the samples.
Comparison with other datasets
We have used deepTools multiBigWig summary to generate summary matrices for bulk and single-cell bigwig tracks that were used as input into correlation analysis and principal component analysis. scChIP-seq data was processed using scChIPseq_DataEngineering pipeline (https://github.com/vallotlab/scChIPseq_DataEngineering)12. We used deepTools plotFingerprint to generate fingerprint plots.
Statistics
Significance of marker regions reported in Supplementary Table 1 was tested using Wilcoxon rank-sum test implemented in package Seurat3 with function FindAllMarkers. ABC predictions with threshold score higher than 0.02 were selected as significant. Cicero predictions with co-accessibility score more than 0.2 were selected for downstream analysis.
Extended Data
Extended Data Figure 1. Optimization of tagmentation step in the scCUT&Tag protocol by addition of BSA.
a. Table depicting scCUT&Tag protocol steps (Primary Antibody, Secondary Antibody, Tn5 binding, Tagmentation) and whether BSA was included in the scCUT&Tag buffers during these steps. b. DAPI counterstaining of the nuclei after the scCUT&Tag procedure. Inclusion of BSA in the procedure substantially reduces clumping of the nuclei. c. Genome browser profiles of bulk cut&tag experiment from the different BSA conditions (described in a). d. Gating strategy depicting sorting of GFP cells. P1 Depicts general gate for selection of cells, P2 gate selects for singlets, DAPI-gate selects only live cells and GFP+ gate selects cells that possess GFP signal (Sox10-Cre/GFP).
Extended Data Figure 2. scCUT&Tag of mixture of mouse cell lines.
a. UMAP projection of H3K27me3 scCUT&Tag in two dimensions. Points are colored by assigned cell identity. N=2 technical replicates b. Genome browser view of merged pseudobulk profiles of 5 scCUT&Tag clusters and bulk ChIP-seq or Cut&Run profiles of the respective cell lines. c. PCA analysis and pearson correlation matrix of 5 scCUT&Tag clusters and bulk ChIP-seq or Cut&Run data. The PCA was performed on the top 150 most variable marker regions selected from the scCUT&Tag data. Heatmap shows pearson’s correlation coefficient of signal in the same features. d. Scatter plot showing correlation of scCUT&Tag signal among clusters and technical replicates. e. Stacked barplot showing relative proportions of cell types identified using scCUT&Tag data. f and g. Metagene plot showing the distribution of ChIP-seq for mESCs (f) and 3T3 cells (g) and downscaled scCUT&Tag signal around peaks that were called from the bulk dataset.
Extended Data Figure 3. Quality control of the scCUT&Tag data.
a. Merged pseudobulk profiles of scCUT&Tag with four antibodies against modified histones. b. Scatterplot of number of reads per cells (x axis) and fraction of reads originating from peak regions (y axis) that was used to set cutoffs for cells identification. Cutoffs were set after manual inspection of the plots and are depicted as horizontal and vertical lines overlaid over the plot. c. Histogram of number of features identified per cell for each antibody used in scCUT&Tag. d. Violin plots showing fraction of reads per cell that overlap peak regions that were called on merged bulk profiles using the same parameters for all compared samples. scCUT&Tag peak calling parameters are different from parameters used in Figure 1d. Point specifies mean of the distribution and lines standard error of mean. Number of cells per sample – H3K27me3_N1 3304, H3K27me3_N2 3090, H3K27me3_N3 5145, H3K27me3_N4 2393, H3K27me3_cell_lines_1 4872, H3K27me3_cell_lines_2 3873, K562_H3K4me2_iCell8 807, K562_H3K27me3_iCell8 1387, H1_H3K27me3_iCell8 486, Grosselin_1 2005, Grosselin_2 4122, Grosselin_3 960. e. Violin plot showing number of unique reads per cell. Point specifies mean of the distribution and lines standard error of mean. Number of cells per sample – H3K27me3_N1 n=3304, H3K27me3_N2 n=3090, H3K27me3_N3 n=5145, H3K27me3_N4 n=2393, H3K27me3_cell_lines_1 n=4872, H3K27me3_cell_lines_2 n=3873, K562_H3K4me2_iCell8 n=807, K562_H3K27me3_iCell8 n=1387, H1_H3K27me3_iCell8 n=486, Grosselin_1 n=2005, Grosselin_2 n=4122, Grosselin_3 n=960. f. Bar plot depicting number of analyzed cells per experiment g. Fingerprint plot representing relationship between cumulative signal of scCUT&Tag and scChIP-seq relative to fraction of genomic bins analyzed.
Extended Data Figure 4. De novo identification of cell types by cell type specific marker regions.
Projection of gene activity scores of (a) H3K27ac and (b) H3K36me3 scCUT&Tag on the two-dimensional UMAP embedding. Gene name is depicted in the title and specific population is highlighted in the UMAP plot by labeling the cell type. c-d. Heatmap representation of the scCUT&Tag signal for (c) H3K27ac and (d) H3K36me3. X axis represents genomic region, each row in Y axis contains data from one cell. Cell correspondence to clusters is depicted by color bar on the right side of the heatmap and annotated with cell type. Signal is aggregated per 250 bp windows and binarized. e-h. Aggregated pseudobulk scCUT&Tag profiles for four histone modifications in all identified cell types around selected marker genes.
Extended Data Figure 5. Summary of meta features of cells analyzed by scCUT&Tag.
a. Two dimensional UMAP embedding of the scCUT&Tag data. Cells are colored by correspondence to GFP population, developmental age and biological replicate. b-c. Bar plot summary of the correspondence to the (b) GFP population and (c) developmental age per cell type identified from the H3K4me3 scCUT&Tag data.
Extended Data Figure 6. Comparison of merged profiles of populations identified from scCUT&Tag data and corresponding bulk ChIP-seq or bulk Cut&Run data.
a. Genome browser view of a representative region harboring microglia-specific and neuron-specific H3K27me3 peak regions (highlighted in grey). b. PCA analysis and pearson correlation matrix of merged scCUT&Tag profiles per cluster and bulk ChIP-seq and bulk Cut&Run data. PCA was performed on top 150 most variable marker regions selected from scCUT&Tag data. Heatmap shows pearson’s correlation coefficient of signal in the same features. c. Relative cell type proportions identified from scCUT&Tag data and scRNA-seq data from biological replicates.
Extended Data Figure 7. Metagene analysis of gene activity scores.
a-d. Metagene activity projection of scCUT&Tag data on the UMAP embeddings of four histone modification scCUT&Tag datasets. Metagenes are selected as top 100 most specifically expressed in the scRNA-seq data1.
Extended Data Figure 8. Gene Ontology analysis of H3K4me3 scCUT&Tag marker genes.
a. Gene ontology analysis of the marker genes determined by gene activity scores from the H3K4me3 scCUT&Tag data. GO terms were manually selected from the list of all enriched GO terms in all populations.
Extended Data Figure 9. scCUT&Tag of transcription factors.
a. Meta-region activity scores of marker regions determined from H3K4me3 scCUT&Tag data and specific for the respective population for (a) Olig2 and (b) Rad21 scCUT&Tag data. c-d. Boxplot representation of a and b, single cell meta-region profiles aggregated per cell type. Lower and upper bound of boxplot specify 25th and 75th percentile and lower and upper whisker specifies minimum and maximum no further than 1.5 times of inter-quantile range. Outliers are not displayed. non_oligo cells n=2877, oligo cells n=1667. e-f. Co-embedding of (e) H3K27ac and Olig2 and (f) H3K27ac and Rad21 in single two-dimensional UMAP space. g. Additional motifs identified using MEME from the merged pseudobulk profile of Olig2 scCUT&Tag.
Extended Data Figure 10. Benchmarking of loops predicted by the ABC model with scCUT&Tag data.
a. Bar plot depicting fraction of loops predicted by the ABC model with scCUT&Tag data that overlap with loops predicted by ABC model with bulk CUT&Tag data. b. Venn diagram showing the overlap of loops predicted with scCUT&Tag data with loops predicted with ABC model with bulk CUT&Run data and Cicero. c. Scatter plot showing consistency of predictions of ABC model run with downscaled scCUT&Tag data. d.Boxplot representation of lengths of the loops predicted by various methods. Lower and upper bound of boxplot specify 25th and 75th percentile and lower and upper whisker specifies minimum and maximum no further than 1.5 times of inter-quantile range. Outliers are not displayed. mOL n=1796, Astrocytes n=1506, OEC n=913, Unknown n=160.
Supplementary Material
Acknowledgements
We would like to thank Tony Jimenez-Beristain for writing laboratory animal ethics permit 1995_2019 and assistance with animal experiments, Leslie Kirby, Mandy Meijer and Petra Kukanja for assistance with animal experiments, Florian Gabriel for setting up Cut&Run technology, Steven Henikoff for providing proteinA-Tn5 and proteinA-MNAse, Bastien Hervé for setting up the Shiny web resource, Matthew Speir and Maximilian Haeussler at the University of California Santa Cruz Genomics Institute, for setting up the UCSC Cell Browser and UCSC Genome Browser resources, Simon Elsässer and Rickard Sandberg for proofreading and providing critical comments on the manuscript, Ida Johansson and Elin Dunevall and Karolinska Institute Protein Science facility for cloning the pA-Tn5 construct and the protein purification, Matilda Eriksson for performing the 10x ATAC-seq protocol, the Single Cell Genomics Facility, Simon Elsässer, Karolinska Institutet, for providing mESCs, Oscar Fernandez Capetillo, Karolinska Institutet, for providing NIH-3T3 cells and the staff at Comparative Medicine-Biomedicum and Biomedicum flow cytometry core facility (BFC). Figure 1a was generated using BioRender. The authors acknowledge support from the National Genomics Infrastructure in Stockholm funded by Science for Life Laboratory, the Knut and Alice Wallenberg Foundation and the Swedish Research Council, and Swedish National Infrastructure for Computing /Uppsala Multidisciplinary Center for Advanced Computational Science for assistance with massively parallel sequencing and access to the UPPMAX computational infrastructure. M.B. is funded by the Vinnova Seal of Excellence Marie-Sklodowska Curie Actions grant RNA-centric view on Oligodendrocyte lineage development (RODent). Work in G.C.B’s research group was supported by the Swedish Research Council (grant 2015-03558 and 2019-01360), the European Union (Horizon 2020 Research and Innovation Programme/European Research Council Consolidator Grant EPIScOPE, grant agreement number 681893), the Swedish Brain Foundation (FO2017-0075 and FO2018-0162), the Swedish Cancer Society (Cancerfonden; 190394 Pj), Knut and Alice Wallenberg Foundation (grants 2019-0107 and 2019-0089), The Swedish Society for Medical Research (SSMF, grant JUB2019), Ming Wai Lau Centre for Reparative Medicine and Karolinska Institutet.
Footnotes
Author Contributions
M.B. and G.C.B. conceived the study, designed the experiments and analysis and wrote the manuscript. M.B. optimized and performed the scCUT&Tag experiments and analyzed the scCUT&Tag data. M.K. and M.B. performed the HiChIP experiment. M.K. analyzed the HiChIP data and helped with generation of related figures. All authors contributed and approved the manuscript.
Ethics Declaration
M.B. and M.K. have performed paid consultation for the company Abcam.
Publicly available datasets used in this study:
GSE96107 – HiC of mESC and H3K27me3 ChIP-seq of cortical neurons. GSE124557 – scCUT&Tag in iCell8 platform, GSE117309 – scChIP-seq, GSE104435 – H3K27me3 ChIP-seq of microglia, SRP135960 – mouse brain atlas (https://storage.googleapis.com/linnarsson-lab-loom/l5_all.loom), GSE75330 – scRNA-seq of oligodendrocyte lineage, 10x genomics single-cell ATAC-seq of P50 mouse cortex - https://support.10xgenomics.com/single-cell-atac/datasets/1.2.0/atac_v1_adult_brain_fresh_5k), ENCODE H3K27me3 ChIP-seq of mouse embryonic stem cells Bruce4 https://www.encodeproject.org/experiments/ENCSR000CFN/, GSM135296 - H3K27me3 CUT&Run of mouse NIH/3T3 cells
Data availability
Raw data is deposited in GEO GSE163532 (https://www.ncbi.nlm.nih.gov/geo/query/acc.cgi?acc=GSE163532). The scCut&Tag dataset can be explored at web resources at https://ki.se/en/mbb/oligointernode and https://mouse-brain-cutandtag.cells.ucsc.edu/.
Code availability
Code is available at https://github.com/Castelo-Branco-lab/scCut-Tag_2020.
References
- 1.Zeisel A, et al. Molecular Architecture of the Mouse Nervous System. Cell. 2018;174:999–1014.e22. doi: 10.1016/j.cell.2018.06.021. [DOI] [PMC free article] [PubMed] [Google Scholar]
- 2.La Manno G, et al. RNA velocity of single cells. Nature. 2018;560:494–498. doi: 10.1038/s41586-018-0414-6. [DOI] [PMC free article] [PubMed] [Google Scholar]
- 3.Buenrostro JD, et al. Single-cell chromatin accessibility reveals principles of regulatory variation. Nature. 2015;523:486–490. doi: 10.1038/nature14590. [DOI] [PMC free article] [PubMed] [Google Scholar]
- 4.Lorthongpanich C, et al. Single-Cell DNA-Methylation Analysis Reveals Epigenetic Chimerism in Preimplantation Embryos. Science. 2013;341:1110–1112. doi: 10.1126/science.1240617. [DOI] [PubMed] [Google Scholar]
- 5.Skene PJ, Henikoff S. An efficient targeted nuclease strategy for high-resolution mapping of DNA binding sites. eLife. 6 doi: 10.7554/eLife.21856. [DOI] [PMC free article] [PubMed] [Google Scholar]
- 6.Kaya-Okur HS, et al. CUT&Tag for efficient epigenomic profiling of small samples and single cells. Nat Commun. 2019;10:1930. doi: 10.1038/s41467-019-09982-5. [DOI] [PMC free article] [PubMed] [Google Scholar]
- 7.Rotem A, et al. Single-cell ChIP-seq reveals cell subpopulations defined by chromatin state. Nat Biotechnol. 2015;33:1165–1172. doi: 10.1038/nbt.3383. [DOI] [PMC free article] [PubMed] [Google Scholar]
- 8.Ai S, et al. Profiling chromatin states using single-cell itChIP-seq. Nat Cell Biol. 2019;21:1164–1172. doi: 10.1038/s41556-019-0383-5. [DOI] [PubMed] [Google Scholar]
- 9.Wang Q, et al. CoBATCH for High-Throughput Single-Cell Epigenomic Profiling. Mol Cell. 2019;76:206–216.e7. doi: 10.1016/j.molcel.2019.07.015. [DOI] [PubMed] [Google Scholar]
- 10.Ku WL, et al. Single-cell chromatin immunocleavage sequencing (scChIC-seq) to profile histone modification. Nat Methods. 2019;16:323–325. doi: 10.1038/s41592-019-0361-7. [DOI] [PMC free article] [PubMed] [Google Scholar]
- 11.Carter B, et al. Mapping histone modifications in low cell number and single cells using antibody-guided chromatin tagmentation (ACT-seq) Nat Commun. 2019;10:3747. doi: 10.1038/s41467-019-11559-1. [DOI] [PMC free article] [PubMed] [Google Scholar]
- 12.Grosselin K, et al. High-throughput single-cell ChIP-seq identifies heterogeneity of chromatin states in breast cancer. Nat Genet. 2019;51:1060–1066. doi: 10.1038/s41588-019-0424-9. [DOI] [PubMed] [Google Scholar]
- 13.Falcão AM, et al. Disease-specific oligodendrocyte lineage cells arise in multiple sclerosis. Nat Med. 2018;24:1837–1844. doi: 10.1038/s41591-018-0236-y. [DOI] [PMC free article] [PubMed] [Google Scholar]
- 14.Marques S, et al. Transcriptional Convergence of Oligodendrocyte Lineage Progenitors during Development. Dev Cell. 2018;46:504–517.:e7. doi: 10.1016/j.devcel.2018.07.005. [DOI] [PMC free article] [PubMed] [Google Scholar]
- 15.Jäkel S, et al. Altered human oligodendrocyte heterogeneity in multiple sclerosis. Nature. 2019;566:543–547. doi: 10.1038/s41586-019-0903-2. [DOI] [PMC free article] [PubMed] [Google Scholar]
- 16.Marques S, et al. Oligodendrocyte heterogeneity in the mouse juvenile and adult central nervous system. Science. 2016;352:1326–1329. doi: 10.1126/science.aaf6463. [DOI] [PMC free article] [PubMed] [Google Scholar]
- 17.Jung M, et al. Lines of Murine Oligodendroglial Precursor Cells Immortalized by an Activated neu Tyrosine Kinase Show Distinct Degrees of Interaction with Axons In Vitro and In Vivo. Eur J Neurosci. 1995;7:1245–1265. doi: 10.1111/j.1460-9568.1995.tb01115.x. [DOI] [PubMed] [Google Scholar]
- 18.Davis CA, et al. The Encyclopedia of DNA elements (ENCODE): data portal update. Nucleic Acids Res. 2018;46:D794–D801. doi: 10.1093/nar/gkx1081. [DOI] [PMC free article] [PubMed] [Google Scholar]
- 19.Xiao Y, et al. Hippo pathway deletion in adult resting cardiac fibroblasts initiates a cell state transition with spontaneous and self-sustaining fibrosis. Genes Dev. 2019;33:1491–1505. doi: 10.1101/gad.329763.119. [DOI] [PMC free article] [PubMed] [Google Scholar]
- 20.Sousa VH, Miyoshi G, Hjerling-Leffler J, Karayannis T, Fishell G. Characterization of Nkx6-2-Derived Neocortical Interneuron Lineages. Cereb Cortex. 2009;19:i1–i10. doi: 10.1093/cercor/bhp038. [DOI] [PMC free article] [PubMed] [Google Scholar]
- 21.Matsuoka T, et al. Neural crest origins of the neck and shoulder. Nature. 2005;436:347–355. doi: 10.1038/nature03837. [DOI] [PMC free article] [PubMed] [Google Scholar]
- 22.Huang W, et al. Novel NG2-CreERT2 knock-in mice demonstrate heterogeneous differentiation potential of NG2 glia during development. Glia. 2014;62:896–913. doi: 10.1002/glia.22648. [DOI] [PubMed] [Google Scholar]
- 23.Zhu X, et al. Age-dependent fate and lineage restriction of single NG2 cells. Development. 2011;138:745–753. doi: 10.1242/dev.047951. [DOI] [PMC free article] [PubMed] [Google Scholar]
- 24.Zhu X, Bergles DE, Nishiyama A. NG2 cells generate both oligodendrocytes and gray matter astrocytes. Development. 2008;135:145–157. doi: 10.1242/dev.004895. [DOI] [PubMed] [Google Scholar]
- 25.Matsuda T, et al. Pioneer Factor NeuroD1 Rearranges Transcriptional and Epigenetic Profiles to Execute Microglia-Neuron Conversion. Neuron. 2019;101:472–485.:e7. doi: 10.1016/j.neuron.2018.12.010. [DOI] [PubMed] [Google Scholar]
- 26.Bonev B, et al. Multiscale 3D Genome Rewiring during Mouse Neural Development. Cell. 2017;171:557–572.:e24. doi: 10.1016/j.cell.2017.09.043. [DOI] [PMC free article] [PubMed] [Google Scholar]
- 27.Stuart T, et al. Comprehensive Integration of Single-Cell Data. Cell. 2019;177:1888–1902.:e21. doi: 10.1016/j.cell.2019.05.031. [DOI] [PMC free article] [PubMed] [Google Scholar]
- 28.Wang W, et al. PRC2 Acts as a Critical Timer That Drives Oligodendrocyte Fate over Astrocyte Identity by Repressing the Notch Pathway. Cell Rep. 2020;32:108147. doi: 10.1016/j.celrep.2020.108147. [DOI] [PMC free article] [PubMed] [Google Scholar]
- 29.Wang J, et al. EED-mediated histone methylation is critical for CNS myelination and remyelination by inhibiting WNT, BMP, and senescence pathways. Sci Adv. 2020;6:eaaz6477. doi: 10.1126/sciadv.aaz6477. [DOI] [PMC free article] [PubMed] [Google Scholar]
- 30.Benayoun BA, et al. H3K4me3 Breadth Is Linked to Cell Identity and Transcriptional Consistency. Cell. 2014;158:673–688. doi: 10.1016/j.cell.2014.06.027. [DOI] [PMC free article] [PubMed] [Google Scholar]
- 31.MEME Suite: tools for motif discovery and searching. doi: 10.1093/nar/gkp335. [DOI] [PMC free article] [PubMed] [Google Scholar]
- 32.Li Y, et al. The structural basis for cohesin–CTCF-anchored loops. Nature. 2020;578:472–476. doi: 10.1038/s41586-019-1910-z. [DOI] [PMC free article] [PubMed] [Google Scholar]
- 33.Yu Y, et al. Olig2 Targets Chromatin Remodelers To Enhancers To Initiate Oligodendrocyte Differentiation. Cell. 2013;152:248–261. doi: 10.1016/j.cell.2012.12.006. [DOI] [PMC free article] [PubMed] [Google Scholar]
- 34.Darr AJ, et al. Identification of genome-wide targets of Olig2 in the adult mouse spinal cord using ChIP-Seq. PLoS ONE. 2017;12 doi: 10.1371/journal.pone.0186091. [DOI] [PMC free article] [PubMed] [Google Scholar]
- 35.Wißmüller S, Kosian T, Wolf M, Finzsch M, Wegner M. The high-mobility-group domain of Sox proteins interacts with DNA-binding domains of many transcription factors. Nucleic Acids Res. 2006;34:1735–1744. doi: 10.1093/nar/gkl105. [DOI] [PMC free article] [PubMed] [Google Scholar]
- 36.Fulco CP, et al. Activity-by-contact model of enhancer–promoter regulation from thousands of CRISPR perturbations. Nat Genet. 2019;51:1664–1669. doi: 10.1038/s41588-019-0538-0. [DOI] [PMC free article] [PubMed] [Google Scholar]
- 37.Mumbach MR, et al. Enhancer connectome in primary human cells identifies target genes of disease-associated DNA elements. Nat Genet. 2017;49:1602–1612. doi: 10.1038/ng.3963. [DOI] [PMC free article] [PubMed] [Google Scholar]
- 38.Rao SSP, et al. Cohesin loss eliminates all loop domains. Cell. 2017;171:305–320.:e24. doi: 10.1016/j.cell.2017.09.026. [DOI] [PMC free article] [PubMed] [Google Scholar]
- 39.Pliner HA, et al. Cicero Predicts cis-Regulatory DNA Interactions from Single-Cell Chromatin Accessibility Data. Mol Cell. 2018;71:858–871.:e8. doi: 10.1016/j.molcel.2018.06.044. [DOI] [PMC free article] [PubMed] [Google Scholar]
- 40.Werner T, Hammer A, Wahlbuhl M, Bösl MR, Wegner M. Multiple conserved regulatory elements with overlapping functions determine Sox10 expression in mouse embryogenesis. Nucleic Acids Res. 2007;35:6526–6538. doi: 10.1093/nar/gkm727. [DOI] [PMC free article] [PubMed] [Google Scholar]
- 41.Moore JE, et al. Expanded encyclopaedias of DNA elements in the human and mouse genomes. Nature. 2020;583:699–710. doi: 10.1038/s41586-020-2493-4. [DOI] [PMC free article] [PubMed] [Google Scholar]
- 42.Zhang Y, et al. Model-based analysis of ChIP-Seq (MACS) Genome Biol. 2008;9:R137. doi: 10.1186/gb-2008-9-9-r137. [DOI] [PMC free article] [PubMed] [Google Scholar]
- 43.Street K, et al. Slingshot: cell lineage and pseudotime inference for single-cell transcriptomics. BMC Genomics. 2018;19:477. doi: 10.1186/s12864-018-4772-0. [DOI] [PMC free article] [PubMed] [Google Scholar]
- 44.Khan A, et al. JASPAR 2018: update of the open-access database of transcription factor binding profiles and its web framework. Nucleic Acids Res. 2018;46:D260–D266. doi: 10.1093/nar/gkx1126. [DOI] [PMC free article] [PubMed] [Google Scholar]
- 45.Ramírez F, et al. deepTools2: a next generation web server for deep-sequencing data analysis. Nucleic Acids Res. 2016;44:W160–165. doi: 10.1093/nar/gkw257. [DOI] [PMC free article] [PubMed] [Google Scholar]
- 46.Wickham H. ggplot2: Elegant Graphics for Data Analysis. Springer-Verlag; 2009. [DOI] [Google Scholar]
- 47.Köster J, Rahmann S. Snakemake—a scalable bioinformatics workflow engine. Bioinformatics. 2012;28:2520–2522. doi: 10.1093/bioinformatics/bts480. [DOI] [PubMed] [Google Scholar]
- 48.Skene PJ, Henikoff S. An efficient targeted nuclease strategy for high-resolution mapping of DNA binding sites. eLife. 2017;6:e21856. doi: 10.7554/eLife.21856. [DOI] [PMC free article] [PubMed] [Google Scholar]
- 49.Kaya-Okur H. Bench top CUT&Tag. 2020 doi: 10.17504/protocols.io.bcuhiwt6. [DOI] [Google Scholar]
- 50.Servant N, et al. HiC-Pro: an optimized and flexible pipeline for Hi-C data processing. Genome Biol. 2015;16:259. doi: 10.1186/s13059-015-0831-x. [DOI] [PMC free article] [PubMed] [Google Scholar]
- 51.Durand NC, et al. Juicebox Provides a Visualization System for Hi-C Contact Maps with Unlimited Zoom. Cell Syst. 2016;3:99–101. doi: 10.1016/j.cels.2015.07.012. [DOI] [PMC free article] [PubMed] [Google Scholar]
- 52.Flyamer IM, Illingworth RS, Bickmore WA. Coolpup.py: versatile pile-up analysis of Hi-C data. Bioinformatics. 2020;36:2980–2985. doi: 10.1093/bioinformatics/btaa073. [DOI] [PMC free article] [PubMed] [Google Scholar]
- 53.Abdennur N, Mirny LA. Cooler: scalable storage for Hi-C data and other genomically labeled arrays. Bioinformatics. 2020;36:311–316. doi: 10.1093/bioinformatics/btz540. [DOI] [PMC free article] [PubMed] [Google Scholar]
Associated Data
This section collects any data citations, data availability statements, or supplementary materials included in this article.
Supplementary Materials
Data Availability Statement
Raw data is deposited in GEO GSE163532 (https://www.ncbi.nlm.nih.gov/geo/query/acc.cgi?acc=GSE163532). The scCut&Tag dataset can be explored at web resources at https://ki.se/en/mbb/oligointernode and https://mouse-brain-cutandtag.cells.ucsc.edu/.
Code is available at https://github.com/Castelo-Branco-lab/scCut-Tag_2020.


