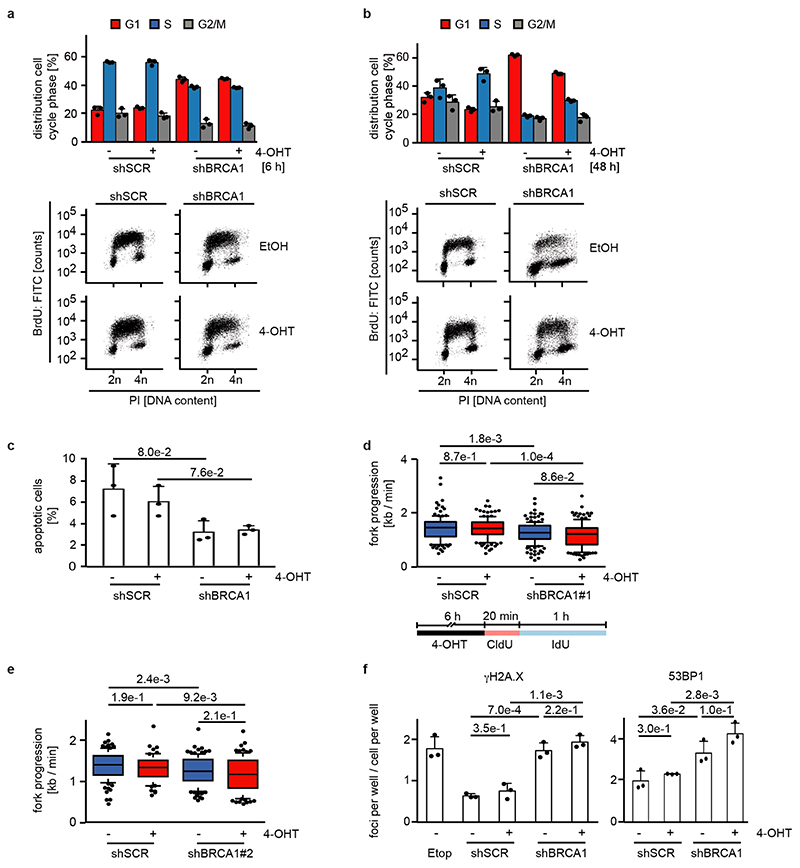
Extended Data Figure 4.
a: Quantification (top) and representative FACS profiles (bottom) documenting cell cycle distribution of bromodeoxyuridine (BrdU) / propidium iodide (PI)-stained control and BRCA1-deficient cells with shBRCA1#2 after 6 h of 4-OHT treatment. PI-staining was used for quantification. Shown is the mean and error bars indicate SD of biological triplicates.
b: Same experimental setup as panel a after 48 h 4-OHT treatment.
c: Percentage of apoptotic cells in control and BRCA1-deficient cells with shBRCA1#2 measured in a PI/AnnexinV FACS after treatment with 4-OHT for 48 h. Shown is the mean and error bars indicate SD of biological triplicates. p-values were calculated using an unpaired, two-tailed t-test.
d: (Top) Fork progression rates during both labels based on the track length under the indicated conditions in control and BRCA1-deficient cells for shBRCA1#1. The number of analyzed DNA fibers are shSCR: EtOH 130, 4-OHT 131; shBRCA1#1: EtOH 161, 4-OHT 139. Fork progressions are
displayed as boxplots with the central line reflecting the median and the borders of the boxes show the lower and upper quartile of the plotted data with 10 to 90 percentile whiskers. Outliers are shown as dots. P-values were calculated using a two-tailed, unpaired t-test with additional Welch’s correction. Shown is one representative experiment (n=3). (Bottom) Scheme of DNA fiber experiment labeled with CldU (red) and IdU (blue).
e: Same experimental setup as above with shBRCA1#2. The number of DNA fibers are shSCR: EtOH 95, 4-OHT 69; shBRCA1#2: EtOH 109, 4-OHT 90. For description of the box plot, see legend to Extended Data Figure 4d. P-values were calculated using a two-tailed, unpaired t-test with additional Welch’s correction. Shown is one representative experiment (n=3).
f: Number of γH2A.X (left) and 53BP1 (right) foci per cell/cell per well indicating DNA damage in control and BRCA1-deficient cells with shBRCA1#2 after 24 h of 4-OHT treatment. Etoposide (25μM) was used as positive control and added for the last 2 h. Shown is the mean and error bars indicate SD of biological triplicates. p-values were calculated using an unpaired, two-tailed t-test. Shown is one representative experiment (n=3).

