Abstract
Conditional manipulation of gene expression is a key approach to investigating the primary function of a gene in a biological process. While conditional and cell-type specific overexpression systems exist for plants, there are currently no systems available to disable a gene completely and conditionally. Here, we present a novel tool with which target genes can be efficiently conditionally knocked out by genome editing at any developmental stage. Target genes can also be knocked-out in a cell-type specific manner. Our tool is easy to construct and will be particularly useful for studying genes which have null-alleles that are non-viable or show pleiotropic developmental defects.
Studies of gene function typically rely on phenotypic analysis of loss-of-function mutants. However, mutations may lead to gametophytic or embryonic lethality, or early developmental defects, impeding studies in postembryonic plants. The genome of the model species Arabidopsis contains a substantial number of such essential genes, though the precise number remains unknown1. Developing a tool that enables conditional and cell-type specific gene disruption is therefore of great value for comprehensively investigating gene function in specific developmental or physiological processes.
Different strategies have been pursued for this purpose. One widely applied approach is the inducible expression of silencing small RNAs2,3. However, this results in only a partial reduction of transcript levels, which may hinder a full investigation of gene function. Furthermore, since small RNAs can be mobile4, constraining the knockdown effect to a given cell-type is challenging. These limitations can be overcome by using the Cre/lox based clonal deletion system5–7, or Zinc finger nuclease8 (ZFN) and transcription activator-like effector nuclease9 (TALEN) based gene editing systems, which provide the possibility of a conditional generation of full knockout. However, these methods rely on complicated genetic engineering and have thus remained rather marginal techniques.
The CRISPR-Cas9 system consists of components derived from the prokaryote adaptive immune system which have been modified for use as a genome editing toolkit in eukaryotes. The endonuclease activity of Cas9 produces double-strand breaks (DSB) in DNA when directed to a target by a single guide RNA (sgRNA). The subsequent error-prone DSB repair mediated by non-homologous end joining facilitates knockout generation. Thus far, CRISPR-Cas9 has been used in plants to generate stable knockouts10 and somatic knockouts at fixed developmental stages by driving Cas9 expression with tissue-specific promoters11. By integrating the well-established CRISPR-Cas9 technology12 with an XVE-based cell-type specific inducible system13,14, we developed an Inducible Genome Editing (IGE) system in Arabidopsis which enables efficient generation of target gene knockouts in desired cell types and at desired times.
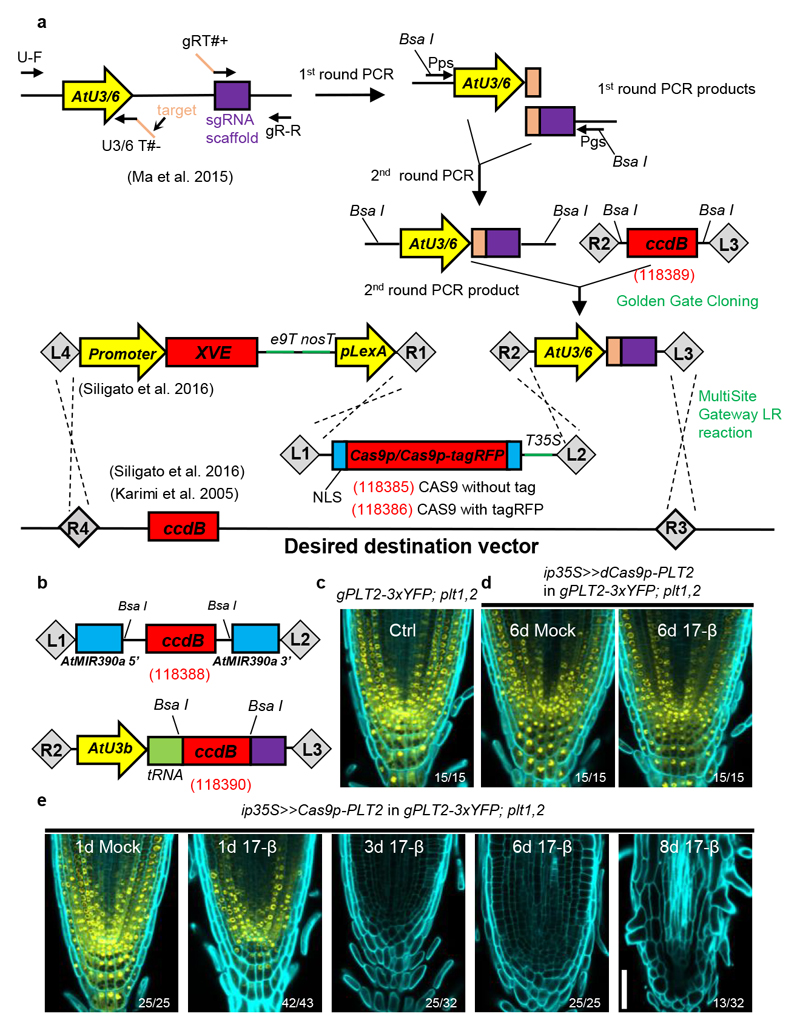
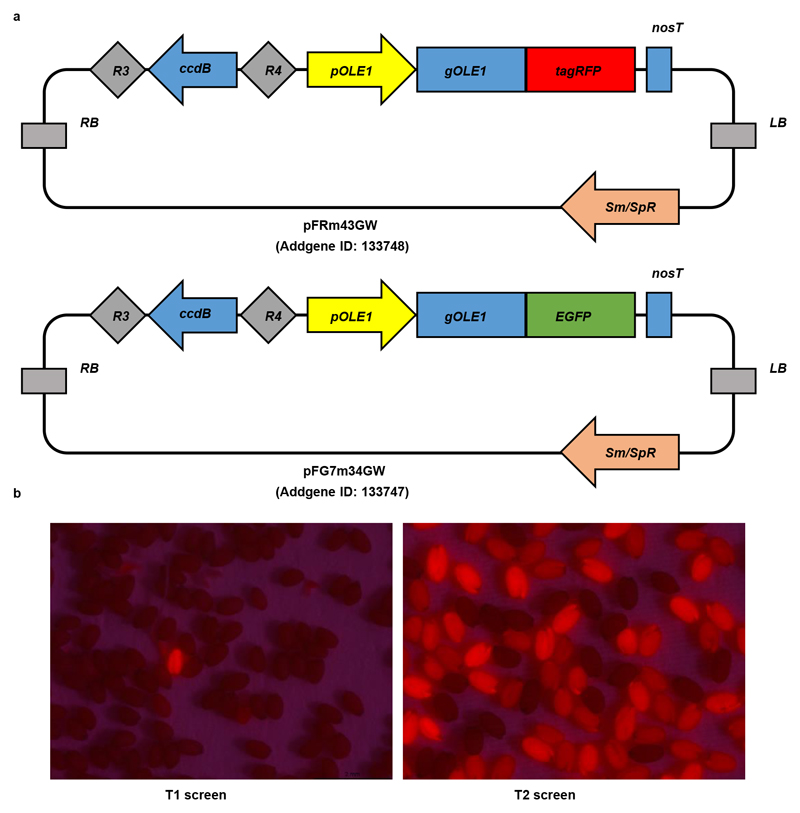
To achieve this, we first generated a fusion of a small nucleolar RNA promoter12 and an sgRNA (pAtU3/6-sgRNA) in two sequential PCR amplification steps (Fig. 1a). The fusion was then cloned into the p2PR3-Bsa I-ccdB-Bsa I entry vector (3rd box) by Golden Gate cloning12. This method allows simultaneous cloning of several pAtU3/6-sgRNA fragments, if needed. Next, we recombined a plant-codon optimized Cas9p 12 into pDONR 221z (2nd box). Finally, the IGE binary vector was generated in a single MultiSite Gateway LR reaction by combining an estrogen-inducible promoter (1st box), Cas9p (2nd box), pAtU3/6-sgRNA (3rd box) and a plant-compatible destination vector13,15 (Fig. 1a). To facilitate screening of transformed seeds, we also generated two non-destructive fluorescent screening vectors (Extended Data Fig. 1). The availability of a large collection of cell-type specific or ubiquitous inducible promoters13 and of destination vectors with different selection markers13,15 makes the IGE system quite versatile. In summary, an IGE construct can be generated in two cloning steps: first, generating a pAtU3/6-sgRNA entry vector by Golden Gate cloning and then performing an LR reaction.
Figure 1. Engineering the IGE system for conditional genome editing.
a, Cloning steps for IGE construct generation. The sgRNA expression cassette (pAtU3/6-sgRNA) was constructed in two PCR steps followed by Golden Gate cloning into the p2R3z-Bsa I-ccdB-Bsa I entry vector. The final IGE construct was then recombined by a MultiSite Gateway LR reaction. b, Schematics of two other entry vectors generated in this study. Entry vectorp221z-AtMIR390a, in which AtMIR39Oa is split by a Bsa I- flanking-ccdB cassette, was utilized for inducible gene knockdown. Entry vectorp2R3z-AtU3b-tRNA-ccdB-gRNA was generated to exploit the endogenous tRNA processing system. Two annealing and overlapping target sequences with overhangs can be directly ligated into Bsa I-linearizedp2R3z-AtU3b-tRNA-ccdB-gRNA. Red numbers in brackets are the Addgene numbers of vectors created in this study. c, The YFP signal in the RM of 7 day-old gPLT2-3xYFP; plt1,2. d, dCas9p does not decrease PLT2-3xYFP expression. e, Cas9p induction resulted in a gradual loss of YFP and eventually full differentiation of the RM. The numbers are the frequency of the observed phenotypes in independent T1 samples. Cell walls are visualized by calcofluor. Experiments were repeated three times in c-e. Scale bar, 50 μm.
Next, we tested the IGE system in the Arabidopsis root meristem (RM) by targeting well-established regulatory genes that are essential for RM development. In the RM, a subset of AP2/EREBP family transcription factors, including PLETHORA1 (PLT1) and PLT2, form gradients with maxima at the quiescent center (QC) to drive the transition from stem cells to differentiated cells16–18. The double mutant plt1,2 exhibits a fully differentiated RM 6-8 days after germination16, which can be rescued by complementing it with gPLT2-3xYFP 1. The fused 3xYFP restricts the mobility of PLT218, making it possible to observe cell-specific effects of editing PLT2 (Fig. 1c). We designed four sgRNAs to target PLT2 in the gPLT2-3xYFP;plt1,2 1 background (Supplementary Fig. 1). Cas9p or nuclease-dead Cas9p (dCas9p) were transcribed under the inducible, broadly-expressed promoter 35S:XVE (ip35S)13. While induction of dCas9p had no effect on PLT2-3xYFP levels (Fig. 1d), Cas9p induction led to a weakening of the YFP signal almost in every transformant (Fig. 1e). YFP fluorescence was initially reduced in the root cap and occasionally in the epidermis or stele. Prolonged induction gradually abolished the YFP signal and led to RM differentiation after 8-10 days of induction (Fig. 1e and Supplementary Table 1), similar to the uncomplemented plt1,2 mutant16. The disappearance of YFP fluorescence and subsequent appearance of RM differentiation phenotype suggests IGE-mediated genome editing efficiently disabled PLT2.
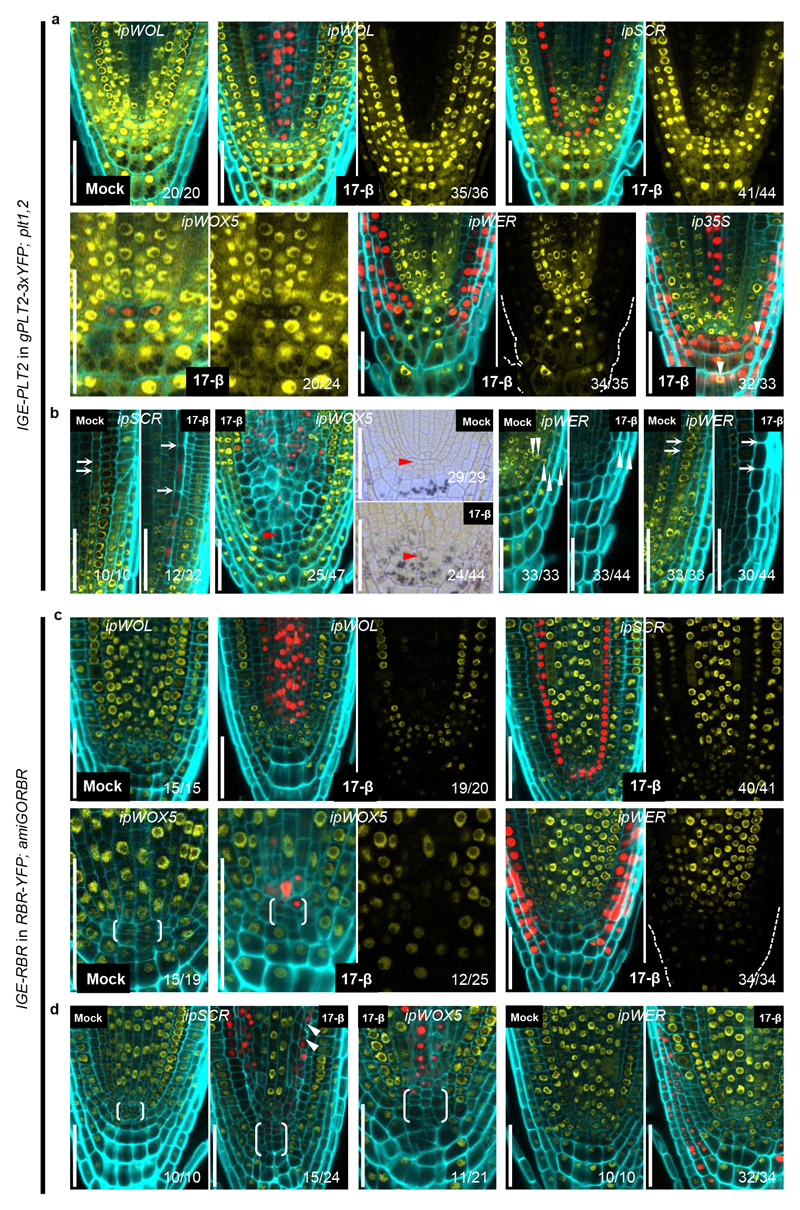
Next, we investigated whether the IGE system can be used to induce removal of PLT2-3xYFP fluorescence in a cell-type specific manner. We tested four inducible promoters: pWOL:XVE (ipWOL), pWOX5:XVE (ipWOX5), pSCR:XVE (ipSCR), and pWER:XVE (ipWER)13, the expression of which, together, covers most of the cell types in the RM. Cas9p-tagRFP was used to monitor promoter activity. Constructs were transformed into gPLT2-3xYFP;plt1,2. Along with promoter-specific Cas9p-tagRFP expression, we observed a corresponding dampening of the YFP signal in the respective domains after one day of induction (Fig. 2a). We noticed that inducible YFP dampening capability is stably transmitted to the T2 generation (Supplementary Fig. 2), demonstrating that the IGE system can be repetitively used in subsequent generations. Consistent with the role of PLT2 in promoting stem cell maintenance and QC specification, inducing Cas9p in promoter-specific tissues caused premature cell expansion or differentiation of the endodermis, QC, or epidermis/lateral root cap (LRC) after 3 days of induction (Fig. 2b). This reflects the cell-autonomous function of PLT2 in maintaining an undifferentiated cell state. In addition to QC differentiation, we observed a shift in ipWOX5 promoter activity towards the provasculature, which resulted in a larger area lacking the YFP signal (Fig. 2b; left panel in ipWOX5). The QC and adjacent provascular cells gained columella cell identity, as revealed by the accumulation of starch granules (Fig. 2b; right panels in ipWOX5). These results indicate that new QC cells were respecified from provascular cells following differentiation of the original QC, and the consequent re-specification and differentiation of the QC gradually led to a larger domain without YFP. These results are consistent with experiments in which laser ablation of the QC leads to re-specification of a new QC from provascular cells19.
Figure 2. The IGE system enables efficient cell-type-specific genome editing.
a, A one-day induction is sufficient to remove PLT2-3xYFP expression in a cell-type specific manner. In rare occasions, we observed overlapping Cas9p-tagRFP and PLT2-3xYFP expression (white arrowhead). b, PLT2 is cell-autonomously required for QC and stem cell maintenance. QC cells (red arrowheads) as well as endodermal and epidermal cells (white arrows) showed premature differentiation or cell expansion after 3 days of induction. QC differentiation is accompanied by shift of ipWOX5 expression towards the provascular cells. Removal of PLT2 from the ipWER expression domain resulted in fewer LRC layers (white arrowhead) and ectopically decreased PLT2-3xYFP expression. Cas9p-tagRFP expression in the LRC and epidermis was frequently undetectable. c, A one-day induction is sufficient to induce efficient cell-type specific RBR editing. Without induction, the QC frequently shows cell divisions, probably due to the heterogeneity of the complementing RBR-YFP. d, RBR cell-autonomously prevents QC and stem cell division. The endodermis, QC and LRC exhibited overproliferation after 3 days of induction. White arrowheads indicate rotated cell division planes in the endodermis. Brackets in c and d indicate QC regions. Cell walls are highlighted by calcofluor. The numbers represent the frequency of the observed phenotypes in independent T1 samples. All experiments were repeated at least three times. Scale bars, 50 μm.
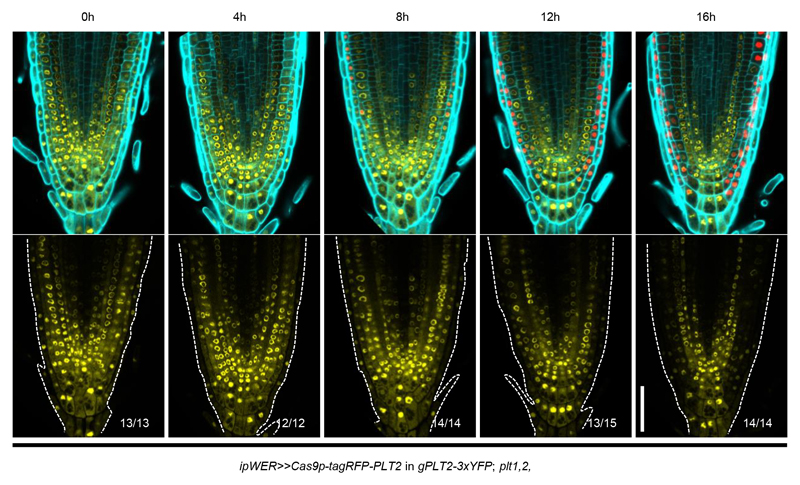
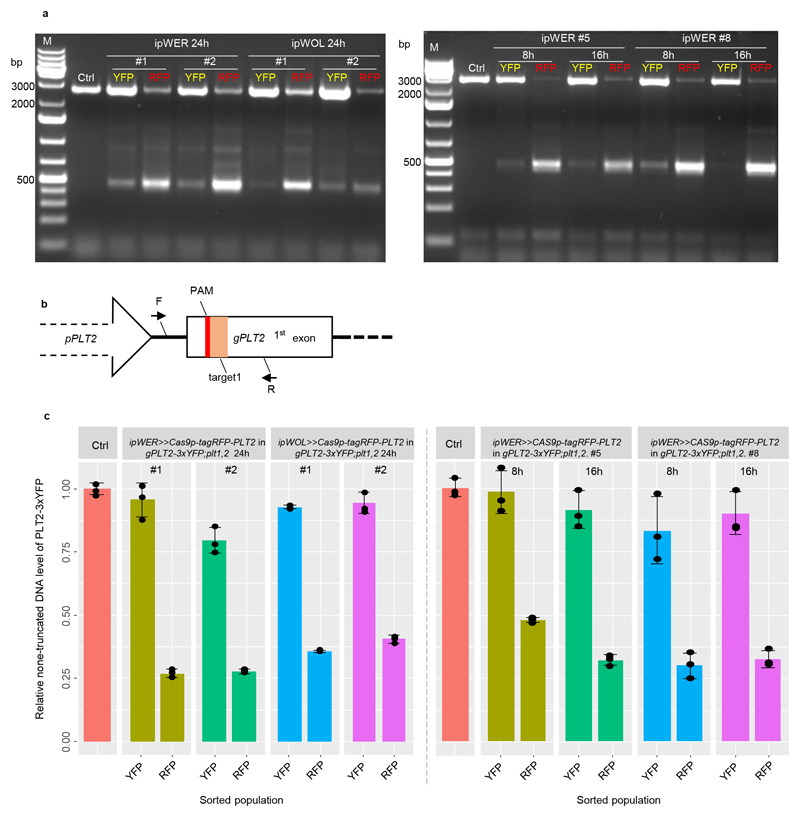
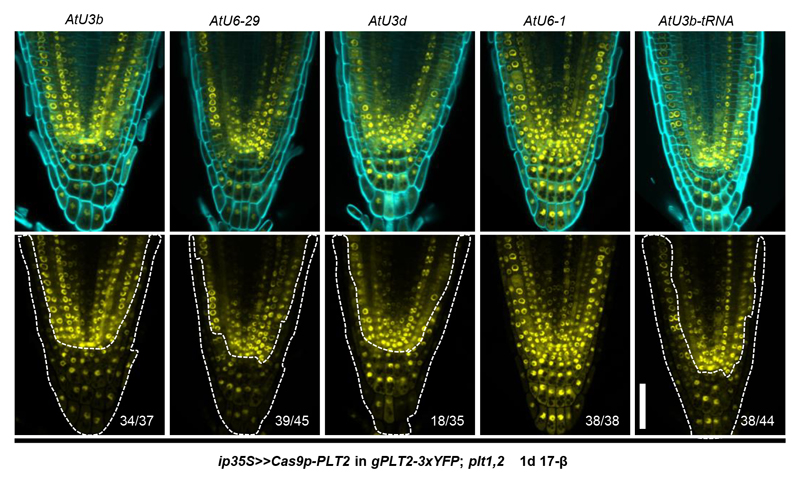
We found that loss of YFP fluorescence correlates strongly with the expression level, the expression region and the timing of induction of Cas9p-tagRFP (Supplementary Fig. 3 and Extended Data Fig. 2). To demonstrate that the loss of YFP fluorescence was due to IGE-mediated PLT2 editing, we first performed genotyping analysis with intact root samples. Using primers spanning all four targets, PCR detected a strong truncated band in pooled T1 transformants after Cas9p induction. The size of the band corresponds to fragment deletion between targets of sgRNA1 and sgRNA4, which was further confirmed by Sanger sequencing (Supplementary Fig. 4). Next, we isolated Cas9p-tagRFP and YFP-only cells by fluorescence-activated cell sorting (FACS) to compare genome editing efficiency between these two cell populations. The same truncated band was more prevalent in RFP-positive cells than in YFP-only cells (Supplementary Fig. 5a and Extended Data Fig. 3a). Quantitative PCR analysis estimated that the large fragment deletion efficiency in RFP-positive cells is 59-73% (Extended Data Fig. 3b, 3c). In addition to the large deletions, we also identified small indels predominantly in Cas9p-tagRFP positive cells, especially at the target sites of sgRNA1 and sgRNA4 through TIDE (Tracking of Indels by DEcomposition)20 analysis (Supplementary Data 1). When driving sgRNA1 expression under different promoters, we found that AtU3b and AtU6-29 were the most efficient promoters, at least in the Arabidopsis RM (Extended Data Fig. 4 and Supplementary Table 1), thus explaining why sgRNA1 (driven under AtU3b) and sgRNA4 (driven under AtU6-29) targets were most efficiently edited. Interestingly, already after 8h induction, before visible YFP signal decrease, Cas9p-RFP positive cells displayed 52-70% deletion efficiency, indicating that genome editing in vivo is a fast process (Supplementary Fig. 5b, Extended Data Fig. 2, 3c and Supplementary Data 1). We also constructed IGE-PLT2 lines with only single sgRNA. Both TIDE analysis and amplicon deep sequencing showed markedly higher indel mutation frequency of PLT2 in Cas9p-tagRFP positive cells than in YFP-only cells (Supplementary Fig. 6 and Supplementary Data 2). In conclusion, IGE-PLT2 enables efficient PLT2-3xYFP mutation, and the loss of fluorescence after Cas9p induction can be used as reliable indicator of target gene mutation.
To test whether the IGE system can edit other loci, we targeted a key gene encoding a cell cycle regulator, RETINOBLASTOMA-RELATED (RBR)7,21. The RBR null allele is gametophyte-lethal21. Previous conditional knockdown and clonal deletion experiments have shown that RBR has a role in restricting stem cell division in the RM6,7,22. IGE-RBR constructs were transformed into a background in which RBR-YFP complements an RBR artificial microRNA line, 35S:amiGORBR (amiGORBR)22. After one day of induction, we observed loss of YFP specifically in the respective promoter domains (Fig. 2c). Three days of induction led to cell overproliferation in the QC, LRC and endodermis, recapitulating the reported phenotype6,7,22 (Fig. 2d).
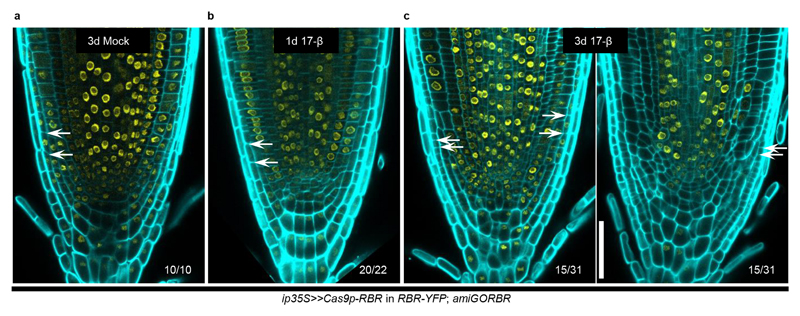
When inducing Cas9p-tagRFP, we found that ip35S was not expressed ubiquitously but instead preferentially in the root cap and sometimes in the epidermis or stele (Fig. 2a and Supplementary Fig. 3). This pattern matches the domain of reduced RBR-YFP (Extended Data Fig. 5a, 5b) and PLT2-3xYFP expression (Fig. 1e and Supplementary Fig. 3) after a 1-day induction of non-tagged Cas9p. After long-term induction of ip35S or ipWER, PLT2-3xYFP expression decreased outside the promoter-active region, in contrast to the effect on RBR (Fig. 1e, Fig. 2b, 2d and Extended Data Fig. 5c). These results suggest that loss of PLT2 in the epidermis and LRC leads to endogenous, non-cell-autonomous, negative feedback regulation of PLT2 expression in the rest of the RM, leading to differentiation. In addition, our results confirm the reported cell-autonomous function of RBR6.
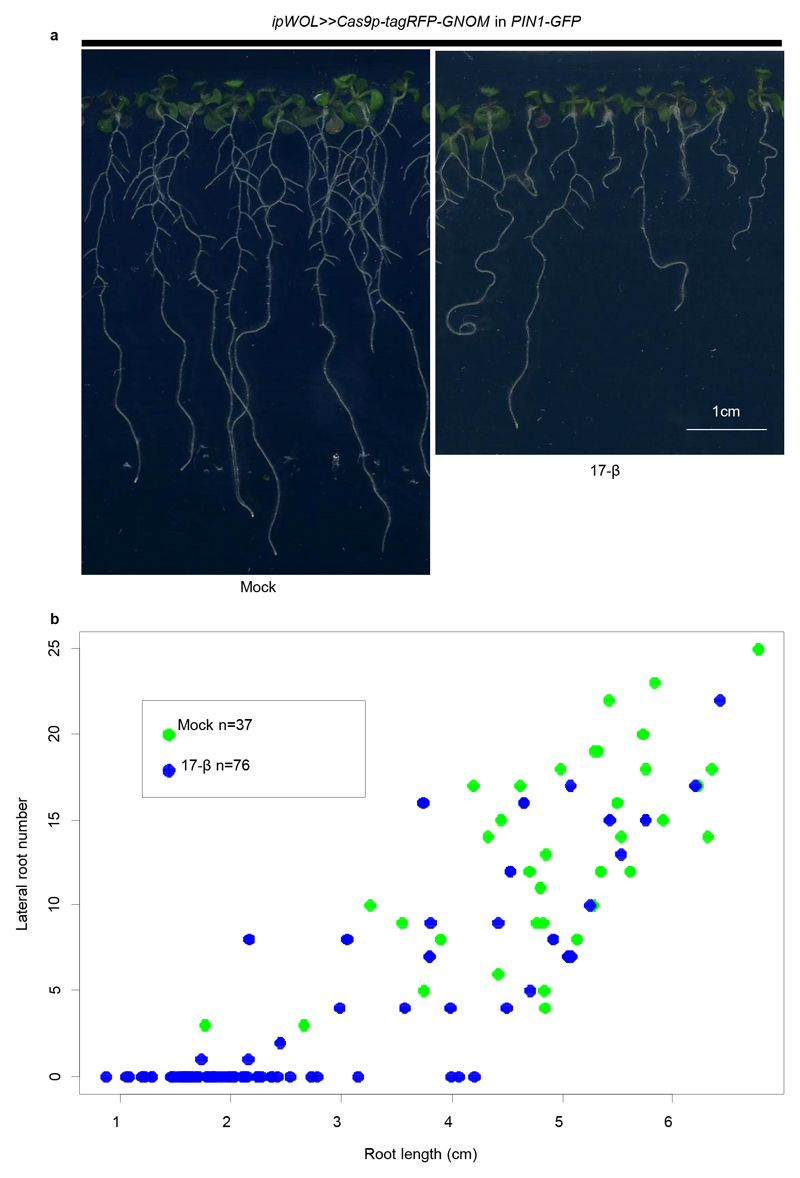
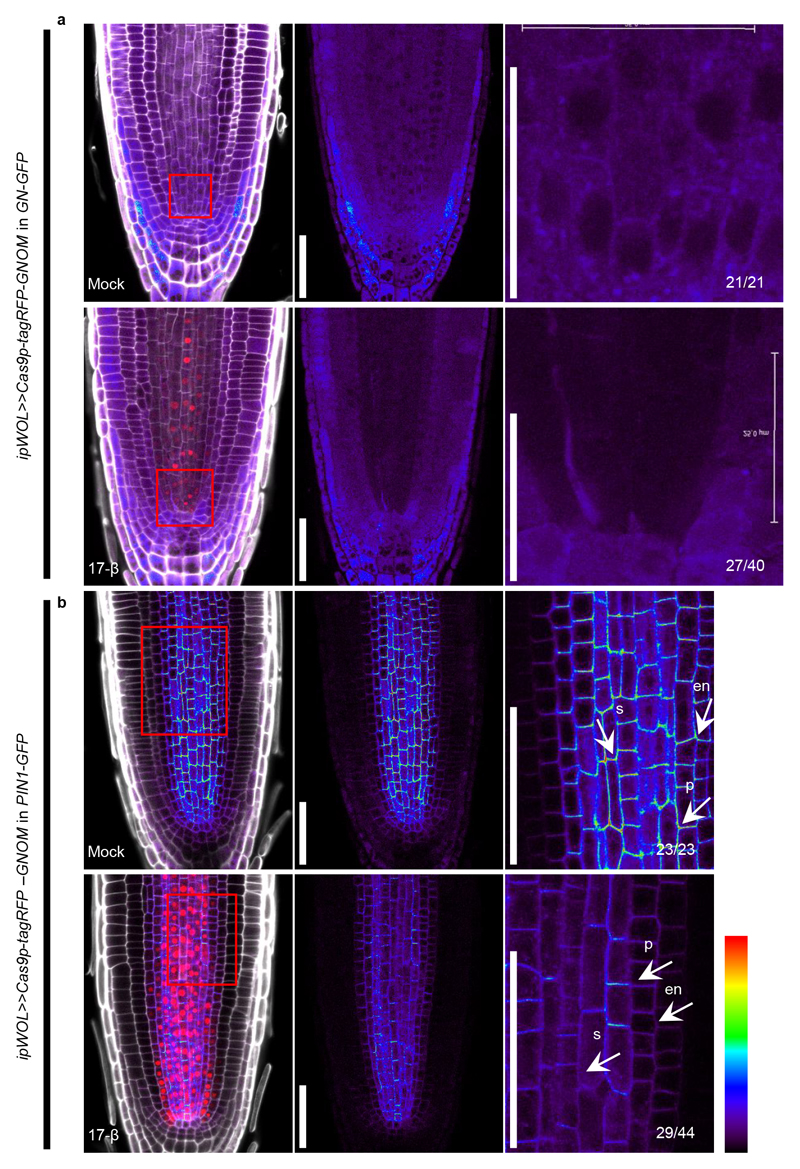
To further demonstrate the wide applicability of the IGE system, we selected GNOM (GN) as a target. GNOM encodes a brefeldin A (BFA) sensitive ARF guanine-nucleotide exchange factor (ARF-GEF) that plays essential roles in endosomal structural integrity and trafficking23. GNOM has been implicated in polar localization of auxin efflux carrier (PINs), but previous studies relied on high-concentration BFA treatments or on hypomorphic alleles24,25 because the null allele displays severe overall defects26,27. To test the response of PIN1 to the loss of GNOM, we made a construct using the ipWOL promoter to target GNOM in the vasculature and transformed it into both GN-GFP 23 and PIN1-GFP 28 backgrounds. Following GN-GFP signal disappearance, most transformants displayed short roots, agravitropic growth and reduced lateral root formation 10 days after germination on induction plates (Extended Data Fig. 6, 7), a similar phenotype to the gnom mutant26. We then focused on PIN1 localization. Following 3 days of induction, PIN1 lost basal polarity and its expression was strongly inhibited (Extended Data Fig. 7), confirming the role of GNOM in driving basal localization of PIN124,25.
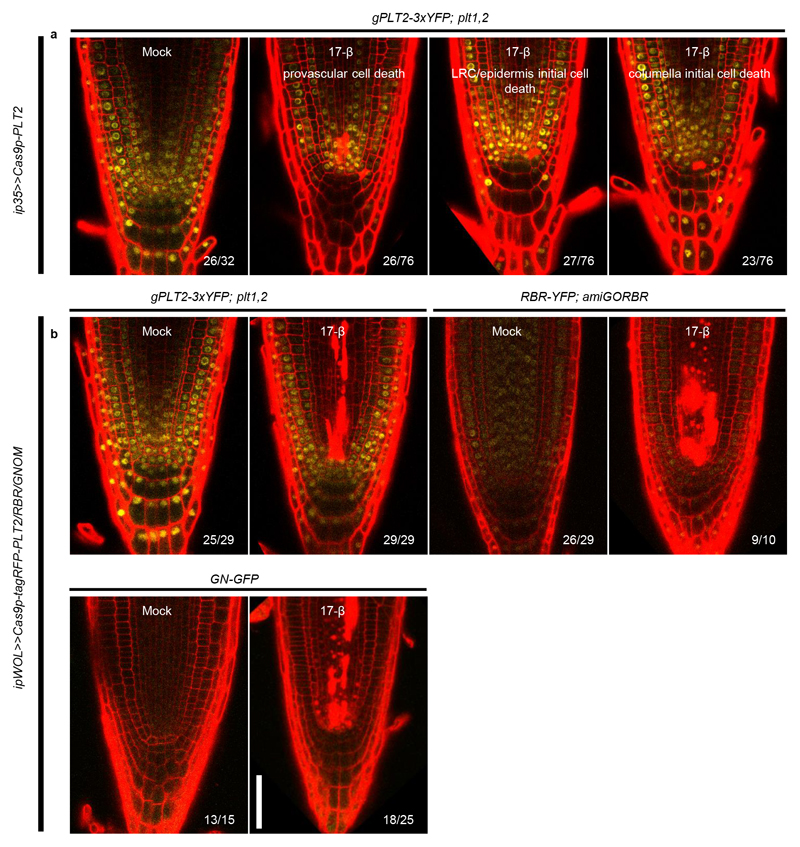
When inducing editing of PLT2, RBR or GNOM with ip35S or ipWOL, we observed cell death in the proximal stem cells of the RM, which have been shown to be sensitive to genotoxic stress29 (Extended Data Fig. 8). Although it has been reported that RBR silencing causes DNA damage and cell death30, PLT2 and GNOM have not been shown to regulate cell death before. It is thus likely that Cas9p-induced DSBs activate downstream DNA damage signals which trigger a cell death response in proximal stem cells.
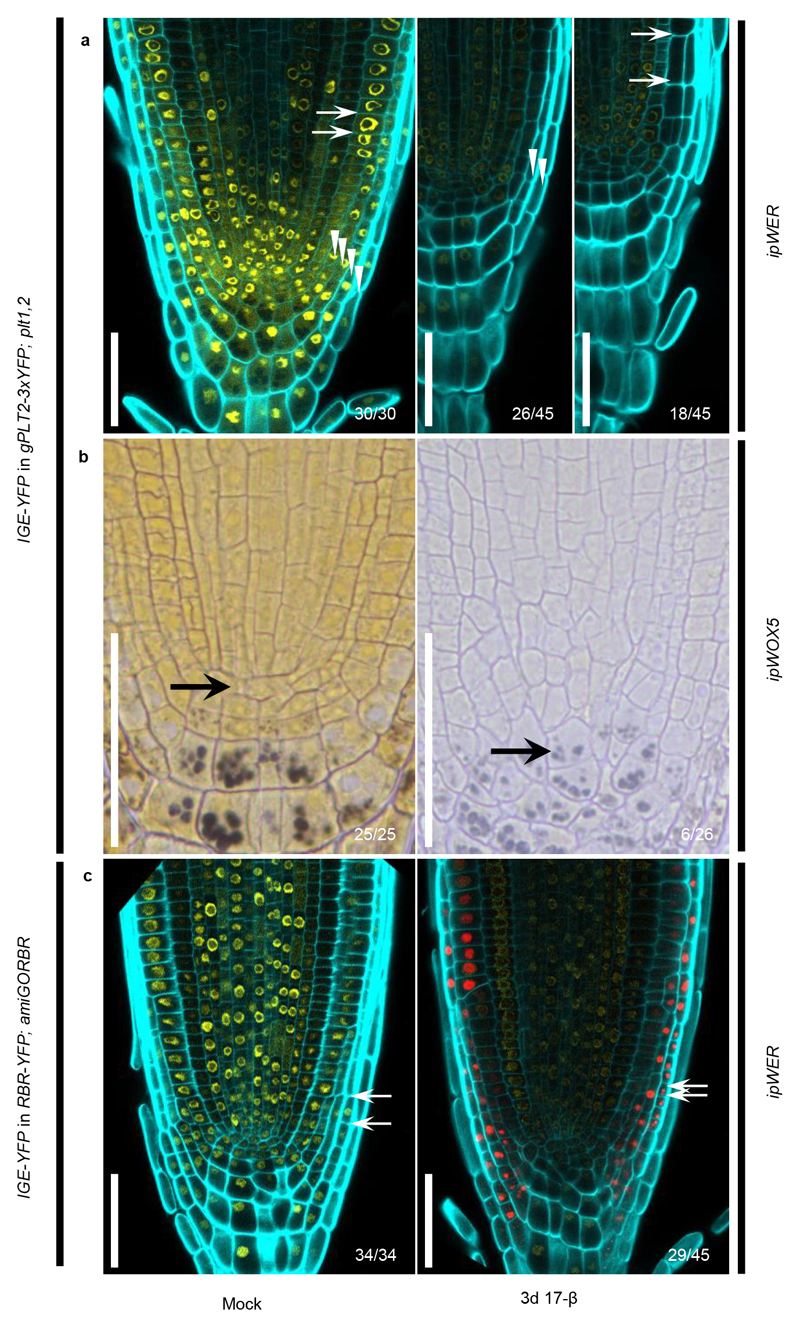
Next, we tested whether a single YFP-targeting IGE construct can be used to edit several different YFP-containing complementing lines. When targeting fused YFP in gPLT2-3xYFP; plt1,2 and RBR-YFP; amiGORBR backgrounds, we found a strong reduction in YFP followed by characteristic developmental defects (Extended Data Fig. 9), similar to targeting PLT2 and RBR directly (Fig. 2b, 2d). For example, in gPLT2-3xYFP; plt1,2, editing YFP in the QC caused QC differentiation, though at a lower frequency than when PLT2 was targeted (Fig. 2b and Extended Data Fig. 9b). Likewise, we observed LRC overproliferation when targeting YFP in RBR-YFP; amiGORBR. However, unlike when RBR was targeted, the YFP signal also decreased in the rest of the RM by an unknown mechanism (Fig. 2d and Extended Data Fig. 9c). Many fluorescent-tagged lines complementing important genes are available, so targeting reporter-encoding genes might represent a broadly applicable approach for gene function studies. Furthermore, targeting exogenous reporter genes may have fewer off-target effects.
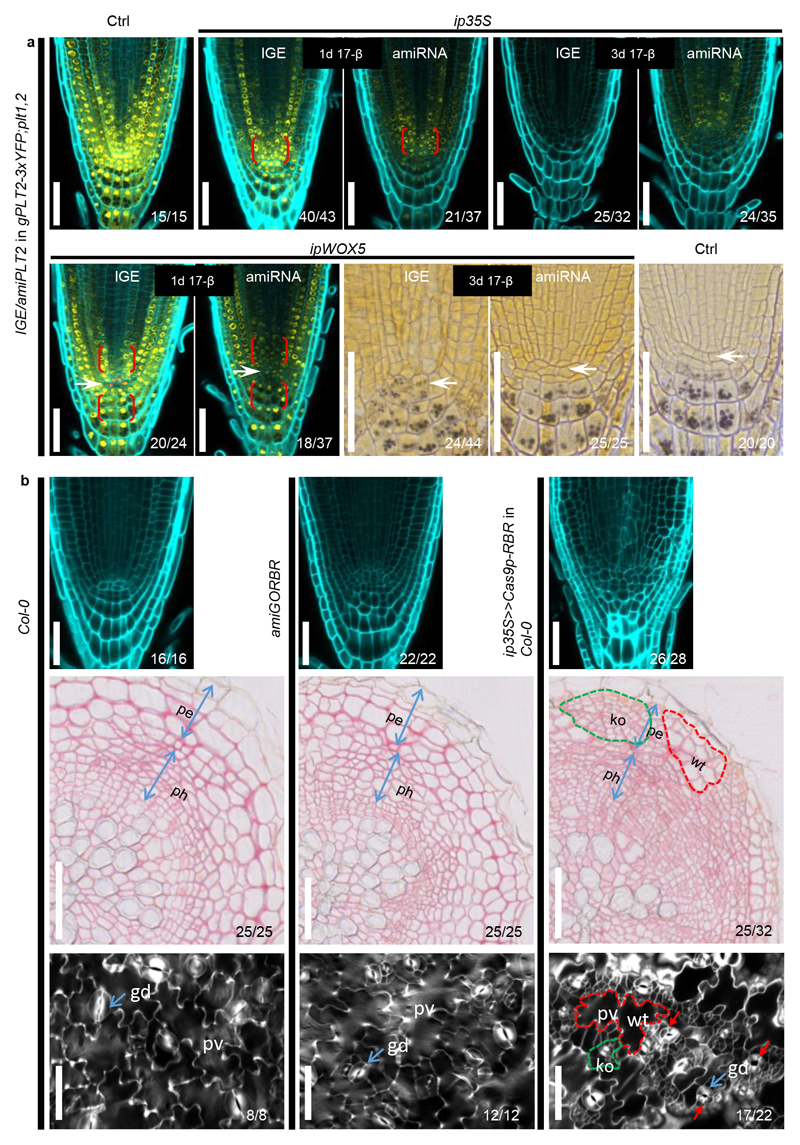
To compare the IGE system with artificial microRNAs (amiRNA) (Fig. 1b), a popular gene knockdown strategy31,32, we generated two amiRNAs targeting PLT2 in gPLT2-3xYFP; plt1,2. Induction of amiPLT2-1 by ip35S or ipWOX5 led to a reduction of YFP in a broader domain than with IGE-PLT2 (Extended Data Fig. 10a), indicating that IGE is more specific. This is likely due to cell-to-cell movement of amiRNA, consistent with the findings that several microRNAs can move4. Additionally, the IGE-caused phenotype tended to be stronger. After a 3-day induction of ip35S:amiPLT2-1, the YFP signal was decreased but still visible, and the RM remained undifferentiated after 10 days of induction (Extended Data Fig. 10a and Supplementary Table 1). Likewise, no QC differentiation was observed in ipWOX5:amiPLT2-1 lines (Extended Data Fig. 10a). The RM of amiGORBR showed an overproliferation phenotype, but it was not as severe as in IGE-RBR lines (Extended Data Fig. 10b). To investigate the effect of RBR downregulation in other tissues, we analyzed root secondary tissue and cotyledon epidermis. While amiGORBR failed to show any defects in these tissues, RBR-IGE caused excessive cell divisions in pavement cells and guard cells of cotyledon epidermis (as reported before33), as well as in periderm and phloem of root secondary tissues (Extended Data Fig. 10b). This highlights a conserved role for RBR in limiting cell divisions in different tissues. Interestingly, the proliferating clones were interspaced with slowly proliferating WT clones, which further confirms the cell-autonomous function of RBR.
In conclusion, we show that the IGE system can be used to disrupt target genes efficiently and precisely. Through spatiotemporal control of Cas9p expression, the system is well-suited to trace early molecular and cellular changes before visible phenotypes appear. Since the estrogen inducible system has been applied in various organs and plant species14,34,35, we expect the IGE system to be broadly applicable for plant molecular biology. By using different Cas9 variants, the system can be readily repurposed for base editing or transcriptional regulation.
Methods
Cloning of IGE constructs
The sgRNA expression cassettes were obtained as previously described12. Briefly, the first round of PCR amplified AtU3/6 promoters from template vectors, pYLsgRNA-AtU3b (Addgene ID: 66198), pYLsgRNA-AtU3d (Addgene ID: 66200), pYLsgRNA-AtU6-1 (Addgene ID: 66202) or pYLsgRNA-AtU6-29 (Addgene ID: 66203), using a common forward primer, U-F, and reverse chimeric primer U3/6 T#- which contains an AtU3/6-specific sequence at the 3’ end and a target sequence at the 5’ end. All sgRNA scaffolds were amplified from pYLsgRNA-AtU3b with a common reverse primer, gR-R, and chimeric forward primer gRT #+, which includes the sgRNA specific sequence at the 3’ end and the target sequence at the 5’ end. Primers used in this study are listed in Supplementary Table 2. In the second round of PCR, purified first-round PCR products were used as templates for overlapping PCR with Bsa I-containing primers Pps/Pgs as primer pairs. In this study, four sgRNAs (sgRNA1-sgRNA4) transcribed under promoters AtU3b, AtU3d, AtU6-1, and AtU6-29, respectively, were used to target genes of interest. For each target gene, four relatively equally distributed target sites were manually selected by following rules described previously12. Different sgRNA expression cassettes were cloned into the p2R3z-Bsa I-ccdB-Bsa I entry vector by one-step Golden Gate cloning. Golden gate cloning was performed with 120ng p2R3z-Bsa I-ccdB-Bsa I, 90 ng purified PCR product of each sgRNA expression cassette, 1.5μl l0x fast digestion buffer of Bsa I, 1.5μl Bsa I enzyme (15U), 1.5μl l0mM ATP, 4μl T4 DNA ligase (20U), and H2O to make up 15μl. Before E. coli transformation, the reaction mixture was incubated on the thermocycler using the following conditions: 37 °C for 5 min, 16 °C for 5 min, for 30-50 cycles, then 50 °C for 5 min and 80 °C for 5 min. Alternatively, the assembly reaction can be done by incubating the reaction mixture at 37 °C for 4-6h.
The five inducible promoters (p1R4-p35S:XVE, p1R4-pSCR:XVE, plR4-pWER:XVE, p1R4-pWOL:XVE) were created earlier13. To construct the binary vector, a MultiSite Gateway LR reaction was performed with the inducible promoters in the 1st box, Cas9p, dCas9p, Cas9p-tagRFP or amiPLT2 in the 2nd box, the sgRNA expression cassette or nosT terminator in the 3rd box and pBm43GW (PPT (phosphinotricin) selection) or pFRm43GW (seed coat RFP selection) as the destination vectors. The detailed cloning procedures of vectors p221z-Cas9p-t35s (Addgene ID: 118385), p221z-Cas9p-tagRFP-t35s (Addgene ID: 118386),p221z-dCas9p-t35s (Addgene ID: 118387), p2R3z-Bsa I-ccdB-Bsa I (Addgene ID: 118389), p221z-AtMIR390a (Addgene ID: 118388), p2R3z-AtU3b-tRNA-ccdB-sgRNA (Addgene ID: 118390) and non-destructive fluorescent screening vectors pFRm43GW (Addgene ID: 133748) and pFG7m34GW (Addgene ID: 133747) are described in the Supplementary Methods. All constructs generated in this study are listed in Supplementary Table 3.
Transformation of the IGE constructs into Arabidopsis
PLT2-targeting constructs were transformed into the gPLT2-3xYFP; plt1,2 background18. For RBR- targeting constructs, the transformed background was segregating pRBR:RBR-YFP(+,-); 35S:amiGORBR(+,+)22. The IGE construct targeting GNOM was transformed into both the GN-GFP 23 and PIN1-GFP 28 backgrounds. With the exception of the construct transformed into the GN-GFP background, in which the GFP signal was weak, all T1 lines were prescreened under a fluorescence-binocular microscope to identify those with leaky inducible promoter or in which the root tip had been damaged during selection. Only lines with YFP/GFP signal in root tip were used for further experiments. The above-mentioned PLT2 and RBR-based backgrounds were also used in transformation of the YFP-targeting construct. The RBR-targeting construct ip35S>>Cas9p-RBR was also transformed into the Col-0 background. All experiments were conducted using T1 plants unless stated otherwise.
Plant growth and chemical treatments
All seeds were surface-sterilized with 20% chlorine for 1 min, followed by a 1 min incubation in 70% ethanol and two rinses in H2O. The sterilized seeds were kept at 4°C for two days before plating on half strength Murashige and Skoog growth medium (½ GM) plates with/without selection antibiotics. The plates were vertically positioned in a growth chamber at 22 °C in long day conditions. PPT selection was conducted by growing sterilized seeds on ½ GM plates containing 20 μg/ml PPT for 4 days, then transferring them to PPT-free ½ GM plates for another 2 days before treatment. The transgenic seeds containing pFRm43GW were screened under a fluorescence binocular using DSRed filter (Extended Data Fig. 1b), and the sterilized seeds were directly grown on ½ GM plates for 6 days before treatment. 17-β-estradiol (17-β, Sigma) was dissolved in dimethyl sulfoxide (DMSO, Sigma) to make 10 mM stock solution (stored at -20°C) and a 5 μM working concentration was used. Mock or 17-β treatment was performed by transferring seedlings on ½ GM plates containing equal volume of DMSO or 17-β. Alternatively, screened seeds were germinated on DMSO or 17-β containing ½ GM plates.
Microtome sectioning and histological staining
Transverse plastic sections were cut from ip35S>>Cas9p-RBR (in Col-0 background) roots which were geminated on estradiol plates for 20 days, as well as Col-0 and 35S:amiGORBR roots that were grown on ½ GM plates for 20 days. Sections from 5 mm below the root–hypocotyl junction point were used for analysis. Sections were stained in 0.05% (w/v) ruthenium red solution (Fluka Biochemika) for 5 seconds before microscopy analysis. For root samples from ipWOX5>>Cas9p-tagRFP-PLT2, ipWOX5>>Cas9p-tagRFP-YFP and ipWOX5>>amiPLT2-1, after 3 days of mock or 17-β treatment, a serial longitudinal section of 5 μm thickness was cut from the root tips. To observe the QC differentiation state, the longitudinal sections were stained in 1g/ml lugol solution (Sigma) for 12 seconds before observation under a microscope. The sectioning methodology has been previously described36.
Microscopy and image processing
All of the cross sections and longitudinal sections were visualized using a Leica 2500 microscope. All fluorescent images were taken with a Leica TCS SP5 II Confocal microscope. Root samples used for cell death detection were stained in 10 μg/mL propidium iodide for 10 min then rinsed twice in water before imaging. For other samples used for fluorescence observation, a ClearSee protocol37 was used with slight modifications. Samples were first fixed in 4% paraformaldehyde (dissolved in 1xPBS, PH 7.2) for at least one hour with vacuuming, then washed twice in 1x PBS and transferred to ClearSee solution. Samples were incubated in ClearSee solution for at least 24h. Before imaging, 0.1% calcofluor white dissolved in ClearSee was used for one hour with vacuuming to stain cell walls. This was followed by washing the samples in ClearSee solution for at least 30 min with shaking. During the washing, the ClearSee solution was changed every 15 min. Confocal settings were kept the same between mock and induction in each experiment. All confocal images were acquired in sequential scanning mode. Images were sometimes rotated using Photoshop and the resulting empty corners were filled with a black background. All images were cropped and organized in Microsoft PowerPoint. The brightness of the calcofluor signal was sometimes adjusted differently between the mock and induction for better cell wall visualization.
Protoplasting and FACS
T2 lines of ipWER>>Cas9p-tagRFP-PLT2 in gPLT2-3xYFP;plt1,2 (#1, #2, #5 and #8); ipWOL>>Cas9p-tagRFP-PLT2 in gPLT2-3xYFP;plt1,2 (#1 and #2) with four sgRNAs; T1 lines of ipWER>>Cas9p-tagRFP-PLT2-sgRNA1 in gPLT2-3xYFP;plt1,2 and ipWOL>>Cas9p-tagRFP-PLT2-sgRNA1 in gPLT2-3xYFP; plt1,2 with only sgRNA1 were used for protoplast preparation. T2 seeds were planted on top of nylon mesh (100 μm, NITEX), which was placed on surface of ½ GM without adding PPT. After 6 days of germination, the induction was conducted by transferring mesh together with the seedlings to 17-β plates. For T1 lines, transgenic positive seedlings were first screened on PPT plates for 4 days, then transferred to ½ GM plates for another two days before 17-β induction. An equal amount of Ws (Wassilewskija ecotype) and gPLT2-3xYFP; plt1,2 seeds were also planted at the same time to facilitate gate determination in sorting.
The protoplast preparation was done as previously described38. The protoplasting solution (pH 5.7) consists of 1.25% (w/v) cellulase-R10 (Yakult), 0.3% (w/v) macerozyme-R10 (Yakult), 0.4 M mannitol, 20 mM MES, 20 mM KCl, 0.1% (w/v) BSA, and 10 mM CaCl2. For each sample, more than 600 root tips were harvested and incubated in 10 mL protoplasting solution at room temperature for 90 min. A shaker (75 rpm) was used to facilitate protoplast disassociation. The resultant protoplast solution was filtered through a 70μm filter. The flow-through was transferred into a 15mL falcon tube and centrifuged at 400g for 6 min. The precipitated protoplasts were resuspended with protoplasting solution without cellulase and macerozyme before conducting a three-laser (blue 488 nm, red 633 nm, Near UV 375 nm) BD FACS AriaII cell sorting analysis. Widely apart fluorescence detectors (PE-Texas Red 616/23 for RFP and FITC 530/30 for YFP) were used to reduce fluorescence spillover effect and gates were determined against controls (Ws and gPLT2-3xYFP;plt1,2) to minimize the false positive events within respective population. Because of high background autofluorescence and the clear separation of the fluorescent-positive populations, the Cas9p-tagRFP positive and PLT2-3xYFP positive populations were sorted without fluorescence compensation.
Quantitative PCR
We isolated DNA from sorted protoplasts based on previously described method39. Using genomic DNA as template, qPCR was performed on a Bio-Rad CFX384 cycler with EvaGreen qPCR mix (Solis Biodyne), by following the manufacturer’s instructions. Pooled DNA isolated from gPLT2-3xYFP; plt1,2 background was used as control. To avoid the interference of native PLT2, the forward primer was designed on LR reaction residual region, attB1, a linker between the promoter PLT2 and genomic PLT2. For each DNA sample, qPCR was performed three times with three technical repeats for each. The relative none-truncated DNA level of PLT2-3xYFP in each sample was normalized to the reference gene UBQ1040. The primers are listed in Supplementary Table 2.
PCR for TIDE analysis
TIDE analysis uses Sanger sequencing data as an input to predict genome editing efficiency in DNA samples20. For DNA samples containing four sgRNAs, two PCR amplification steps were conducted to obtain corresponding fragment harboring each target site. In the 1st PCR step, transgenic PLT2 genomic fragment was amplified (26 cycles) by using a primer pair spanning four sgRNAs target sites. Then WT size band was gel purified and used as template in the 2nd PCR step. In the 2nd PCR, the DNA fragment around each sgRNA target site was amplified with 30 PCR cycles. Corresponding fragments were amplified from plasmidpPLT2-gPLT2-3xYFP 18 as control. The PCR product was purified from gel for Sanger sequencing. The mutation efficiency at each target site was estimated by TIDE analysis (https://tide.deskgen.com/). For DNA samples in which PLT2 was targeted only by sgRNA1, the region including the target site was amplified in two PCR amplification steps, as explained above. PCR products after 1st PCR step were compared to the product after the 2nd step: both TIDE analysis and amplicon sequencing showed similar estimated editing efficiencies between the two products (Supplementary Data 2). This indicates that the second amplification step did not distort the results (i.e. estimated editing efficiencies). The primers used for PCR amplification and Sanger sequencing are listed in Supplementary Table 2.
Amplicon sequencing
To confirm the TIDE analysis results, we selected four pooled DNA samples from sorted T1 lines of ipWER>>Cas9p-tagRFP-PLT2-sgRNA1 and ipWOL>>Cas9p-tagRFP-PLT2-sgRNA1 for amplicon sequencing (Supplementary Data 2). We first amplified (26 cycles) a 316bp-long fragment around the target site with the forward primer located at the attB1 region of the transgenic construct. Even we performed PCR with 6x 50μL reaction volumes for each sample, the resulting yield was relatively low, from which we did nested PCR (30 cycles) and obtained a 266bp-long fragment with high yields. These 2nd round PCR products for each sample were used for amplicon sequencing. To evaluate the effect of our PCR amplification strategy on mutation efficiency estimation, we also selected two low yield 1st round PCR products for amplicon sequencing (Supplementary Data 2).
DNA libraries of these six PCR products were constructed, and 150-bp paired-end reads were generated using an Illumina NovaSeq PE150 platform (Novogene, Tianjin, China). Between 6.87e6 and 9.47e6 reads were obtained for each of the six samples. First 100,000 reads from each sample were aligned with bwa mem41 (v.0.7.15) to either 316 bp-long (26 PCR cycles) or 266 bp-long (30 PCR cycles) reference sequence using program’s default settings. More than 99.77% of the reads mapped, giving ~93,000X and ~112,000X coverage for the longer and the shorter reference sequence, respectively. Read were realigned around indels using GATK3 IndelRealigner42 (v.3.7.0) and program’s default settings. Variants were called with GATK4 Mutect243 (v.4.1.4) using the single-sample mode and unsetting the maximum number of reads (max-reads-per-alignment-start 0). The variant calls were reformatted and allelic depths printed with BCFtools query44 (v.1.9-87).
Extended Data
Extended Data Figure 1. Non-destructive screening markers facilitate identification of transformed seeds.
(a) Non-destructive fluorescent screening destination vectors generated in this study. (b) Examples of transgenic seeds containing pFRm43GW screened under the fluorescence-binocular in the T1 (left) and T2 (right) generations. Experiments in (b) have been repeated more than three times.
Extended Data Figure 2. IGE system enables real time observation of genome editing.
To monitor PLT2 editing dynamics, a time-course 17-β induction was conducted to ipWER>>Cas9p-tagRFP-PLT2 in gPLT2-3xYFP; plt1,2 (T2 generation, line #1). Cas9p-tagRFP fluorescence appeared after 4 hours of induction, followed by gradual reduction of PLT2-3xYFP expression (starting after 12 hours of induction). Cas9p-tagRFP expression and editing activity was gradually spread inwards, likely due to the radial diffusion of 17-β within ipWER domain. White dotted lines mark the RM outlines. Cell walls are visualized by calcofluor. Experiments were repeated three times. Numbers indicate the frequency of observed phenotype within given induction duration. Scale bar, 50 μm.
Extended Data Figure 3. Detection and quantification of PLT2 deletion from sorted cell populations.
(a) PCR-based detection of PLT2 deletion in sorted cell populations. While several truncated bands were visible, the predominant truncated band corresponds to the large fragment deletion between target1 and target4 (see location of target sites in Supplementary Fig. 1). Experiments were repeated three times. (b) qPCR primer design strategy for PLT2 deletion efficiency quantification. To avoid amplification of native PLT2, forward primer (F) was designed at attB1 site linking promoter and genomic PLT2 and reverse primer (R) was designed at downstream of target1. (c) Quantification of PLT2 deletion efficiency by qPCR with the pooled genome DNA from the sorted population (n>600) as template. Error bars represent s.d., and experiments were repeated three times with similar results. Individual values (black dots) and means (bars) are shown. Ctrl indicates the gPLT2-3xYFP;plt1,2.
Extended Data Figure 4. sgRNA promoter identity affects editing efficiency in Arabidopsis roots.
For each construct, the indicated sgRNA promoter was used to drive transcription of sgRNA1, while ip35S was used to guide Cas9p transcription. AtU3b and AtU6-29 showed the highest editing efficiency in T1 seedlings after one-day of induction (1d 17-β). This may explain the preferred detection of deletion between target1 (AtU3b) and target4 (AtU6-29) when four sgRNAs were used in a single construct (Supplementary Fig. 4 and Extended Data Fig. 3a). Transcription of tRNA together with sgRNA1 under the AtU3b promoter also resulted in efficient PLT2 editing. White dotted lines mark the region with reduced YFP signal. This corresponds to the region where ip35S is active (Fig. 2a and Supplementary Fig. 3). Cell walls are highlighted by calcofluor. Numbers indicate the frequency of similar results in the independent T1 samples analyzed. All experiments were repeated three times. Scale bar, 50 μm.
Extended Data Figure 5. RBR functions cell-autonomously in the RM.
(a) A three-day mock treatment of ip35S>>Cas9p-RBR in RBR-YFP; amiGORBR. (b) A one-day induction caused a reduced RBR-YFP signal mainly in the root cap region without an obvious phenotype. (c) A three-day induction of RBR editing with ip35S typically led to LRC overproliferation (white arrows) without affecting the YFP signal in other domains. While half of the transformants showed sectors of variable size lacking RBR-YFP expression (left panel in c), the other half showed almost complete absence of RBR-YFP in the domain of ip35S (right panel). Cell walls are visualized by calcofluor. Numbers indicate the frequency of the observed phenotype in independent T1 samples. Experiments were repeated three times. Scale bar, 50 μm.
Extended Data Figure 6. Post-embryonically inducing GNOM editing recapitulates the phenotypes of the gnom mutant.
(a) Plants with ipWOL>>Cas9p-tagRFP-GNOM in PIN1-GFP after ten days germination on mock or 17-β plates. Inducing GNOM editing led to shorter roots, agravitropic growth and decreased lateral root (LR) numbers. Adventitious roots from the hypocotyl were frequently found, however these roots were not counted in LR quantification. For each independent root, LR number and root length is plotted in (b). Experiments were repeated three times. Scale bar, 1 cm.
Extended Data Figure 7. GNOM is required for PIN1 polarity and expression.
(a) GNOM expression disappeared from the vasculature after a 6-day induction of ipWOL>>Cas9p-tagRFP-GNOM in GN-GFP. Due to the weak GFP signal, only roots showing a clear loss of GFP signal were included in quantification. (b) A three-day induction of ipWOL>>Cas9p-tagRFP-GNOM in PIN1-GFP resulted in loss of polarity and decreased expression of PIN1-GFP in the endodermis (en), pericycle (p) and stele (s) (white arrows). Right panels are magnified images of the regions marked with a red box in the left panels. Cell walls are marked by calcofluor. Numbers indicate the frequency of the observed phenotype in independent T1 samples analyzed. Experiments were repeated three times. Scale bar in right panels of a, 25 μm; others, 50 μm.
Extended Data Figure 8. Cas9p-mediated genome editing in proximal stem cells induces cell death.
(a) Stem cell death surrounding the QC was observed after one-day induction of ip35S>>Cas9p-PLT2. Based on cell types, the cell death response is classified into three categories: provascular cell death, LRC/epidermis initial cell death and columella initial cell death. Samples were counted twice if they had cell death in two different categories. (b) Cell death of provascular cells and early descendants was induced after one-day induction of ipWOL>>Cas9p-tagRFP-PLT2/RBR/GNOM. Cell walls are highlighted by propidium iodide (PI). Under PI detection settings, Cas9p-tagRFP is also visible. Numbers indicate the frequency of the observed phenotype in independent T1 samples analyzed. Experiments were repeated three times. Scale bars, 50 μm.
Extended Data Figure 9. A single IGE construct targeting a gene encoding a fluorescent reporter has the potential to disrupt different transgene targets.
(a) Editing YFP instead of PLT2 in the ipWER expression region caused changes similar to direct PLT2 editing. The RM had fewer LRC layers (white arrowheads), as well as premature expansion of epidermal cells and a broad, faint YFP signal. The Cas9p-tagRFP signal is frequently invisible. (b) Editing YFP led to QC (black arrow) differentiation at a lower frequency. (c) Targeting the YFP of RBR-YFP in the LRC led to LRC overproliferation, similar to editing RBR. However, the YFP signal outside ipWER expression region was also hampered by an unknown mechanism, unlike when editing RBR. White arrows mark the neighboring cell walls in a and c. The same construct was used in a and c. Cell walls are highlighted by calcofluor. Numbers indicate the frequency of the observed phenotype in independent T1 samples analyzed. Experiments were repeated three times. Scale bars, 50 μm.
Extended Data Figure 10. Comparison of IGE system with inducible amiRNA.
(a) IGE-PLT2 displays more specific and stronger PLT2-3xYFP downregulation than amiPLT2. After a one-day induction, ip35S>>amiPLT2-1 in gPLT2-3xYFP; plt1,2 and ipWOX5>>amiPLT2-1 in gPLT2-3xYFP; plt1,2 showed a broader reduction of the YFP signal, particularly in the bracketed regions where no inducible promoter activity was found. Conversely, induced PLT2 editing caused very local loss of the YFP signal. After a three-day induction, the YFP signal is still visible in most of ip35S>>amiPLT2-1 in gPLT2-3xYFP; plt1,2 transformants but not in ip35S>>Cas9p-PLT2 in gPLT2-3xYFP; plt1,2 transformants. There was no QC differentiation in ipWOX5>>amiPLT2-1 in gPLT2-3xYFP; plt1,2 roots. Ctrl refers to 7-day (top panel) or 9-day (bottom panel) old gPLT2-3xYFP; plt1,2. White arrows mark the QC. (b) Comparison of the RM (top panel), root secondary growth (middle panel) and cotyledon epidermis (bottom panel) of Col-0, 35S:amiGORBR and ip35S>>Cas9p-RBR in Col-0. Inducing RBR editing (germination on 17-β plates for 6 days (top panel), 20 days (middle panel) and 6 days (bottom panel)) resulted in more excessive cell divisions in the LRC than was seen in amiGORBR roots (top panel, germination and six days of growth on 17-β-free plates). Furthermore, RBR editing caused cell overproliferation in phloem (ph) cells and the periderm (pe) of root secondary tissues (middle panel) and pavement cells (pv) and guard cells (gd, blue arrows) of cotyledon epidermis (bottom panel), which was not observed in amiGORBR roots and cotyledons. The knockout (ko) sectors (green dotted line) were frequently accompanied by WT sectors (red dotted line), which can be regarded as an internal control. Red arrows mark guard cells divisions. Cell walls are marked by calcofluor. Numbers indicate the frequency of observed phenotype in independent samples analyzed. Experiments were repeated three times, except experiment on cotyledon epidermis phenotyping, which was repeated two times. Scale bars, 50 μm.
Supplementary Material
Acknowledgement
We thank B. Scheres (Wageningen University) and N. Geldner (University of Lausanne) for sharing published materials; N. Geldner for providing support for R.U.; K. D. Birnbaum (Univeristy of New York) for helpful discussion; T. Pessa-Morikawa (University of Helsinki) for technical support on FACS; A. Vaten (University of Helsinki) for cotyledon epidermis imaging and S. el-Showk for proofreading of this manuscript. This work was supported by the Academy of Finland (grants #316544, #266431, #307335), European Research Council (ERC-CoG CORKtheCAMBIA, agreement 819422), University of Helsinki HiLIFE fellowship (X.W., L.Y, M.L., A.P.M.) and European Molecular Biology Organisation (EMBO ALTF 1046-2015 to R.U.). X.W. is also supported by a grant from the Chinese Scholarship Council (CSC).
Footnotes
Contributions
X.W. and A.P.M. designed the experiments. X.W. conducted all experiments, except L.Y carried out the analysis for Supplementary Table 1, and M.L. performed FACS. R.U. generated and tested the new destination vectors. A.L. determined the indel mutation efficiency of amplicon deep sequencing. X.W. and A.P.M. analyzed the results and wrote the manuscript, with input from all coauthors.
Competing Interests Statement
The authors declare no competing financial interests.
Data and Materials Availability
Vectors created in this study have been deposited in Addgene for distribution. Addgene ID numbers are presented in Fig. 1, and Extended Data Fig. 1. All plant material, expression constructs and data supporting findings of this study are available from the corresponding author upon request.
References
- 1.Candela H, Perez-Perez JM, Micol JL. Trends Plant Sci. 2011;16:336–345. doi: 10.1016/j.tplants.2011.02.007. [DOI] [PubMed] [Google Scholar]
- 2.Borghi L, et al. Plant Cell. 2010;22:1792–1811. doi: 10.1105/tpc.110.074591. [DOI] [PMC free article] [PubMed] [Google Scholar]
- 3.Guo J, Wei J, Xu J, Sun MX. J Exp Bot. 2014;65:1165–1179. doi: 10.1093/jxb/ert475. [DOI] [PMC free article] [PubMed] [Google Scholar]
- 4.Liu L, Chen X. Nat Plants. 2018;4:869–878. doi: 10.1038/s41477-018-0288-5. [DOI] [PMC free article] [PubMed] [Google Scholar]
- 5.Heidstra R, Welch D, Scheres B. Genes Dev. 2004;18:1964–1969. doi: 10.1101/gad.305504. [DOI] [PMC free article] [PubMed] [Google Scholar]
- 6.Wachsman G, Heidstra R, Scheres B. Plant Cell. 2011;23:2581–2591. doi: 10.1105/tpc.111.086199. [DOI] [PMC free article] [PubMed] [Google Scholar]
- 7.Wildwater M, et al. Cell. 2005;123:1337–1349. doi: 10.1016/j.cell.2005.09.042. [DOI] [PubMed] [Google Scholar]
- 8.Qi YP, et al. G3. 2013;3:1707–1715. [Google Scholar]
- 9.Christian M, Qi YP, Zhang Y, Voytas DF. G3. 2013;3:1697–1705. doi: 10.1534/g3.113.007104. [DOI] [PMC free article] [PubMed] [Google Scholar]
- 10.Mao YF, Botella JR, Liu YG, Zhu JK. Natl Sci Rev. 2019;6:421–437. doi: 10.1093/nsr/nwz005. [DOI] [PMC free article] [PubMed] [Google Scholar]
- 11.Decaestecker W, et al. Plant Cell. 2019;31:2868–2887. doi: 10.1105/tpc.19.00454. [DOI] [PMC free article] [PubMed] [Google Scholar]
- 12.Ma X, et al. Mol Plant. 2015;8:1274–1284. doi: 10.1016/j.molp.2015.04.007. [DOI] [PubMed] [Google Scholar]
- 13.Siligato R, et al. Plant Physiol. 2016;170:627–641. doi: 10.1104/pp.15.01246. [DOI] [PMC free article] [PubMed] [Google Scholar]
- 14.Zuo J, Niu QW, Chua NH. Plant J. 2000;24:265–273. doi: 10.1046/j.1365-313x.2000.00868.x. [DOI] [PubMed] [Google Scholar]
- 15.Karimi M, Inze D, Depicker A. Trends Plant Sci. 2002;7:193–195. doi: 10.1016/s1360-1385(02)02251-3. [DOI] [PubMed] [Google Scholar]
- 16.Aida M, et al. Cell. 2004;119:109–120. doi: 10.1016/j.cell.2004.09.018. [DOI] [PubMed] [Google Scholar]
- 17.Galinha C, et al. Nature. 2007;449:1053–1057. doi: 10.1038/nature06206. [DOI] [PubMed] [Google Scholar]
- 18.Mähönen AP, et al. Nature. 2014;515:125–129. doi: 10.1038/nature13663. [DOI] [PMC free article] [PubMed] [Google Scholar]
- 19.Vandenberg C, Willemsen V, Hage W, Weisbeek P, Scheres B. Nature. 1995;378:62–65. doi: 10.1038/378062a0. [DOI] [PubMed] [Google Scholar]
- 20.Brinkman EK, Chen T, Amendola M, van Steensel B. Nucleic Acids Res. 2014;42:e168. doi: 10.1093/nar/gku936. [DOI] [PMC free article] [PubMed] [Google Scholar]
- 21.Ebel C, Mariconti L, Gruissem W. Nature. 2004;429:776–780. doi: 10.1038/nature02637. [DOI] [PubMed] [Google Scholar]
- 22.Cruz-Ramirez A, et al. PLoSBiol. 2013;11 [Google Scholar]
- 23.Geldner N, et al. Cell. 2003;112:219–230. doi: 10.1016/s0092-8674(03)00003-5. [DOI] [PubMed] [Google Scholar]
- 24.Kleine-Vehn J, et al. Curr Biol. 2008;18:526–531. doi: 10.1016/j.cub.2008.03.021. [DOI] [PubMed] [Google Scholar]
- 25.Steinmann T, et al. Science. 1999;286:316–318. doi: 10.1126/science.286.5438.316. [DOI] [PubMed] [Google Scholar]
- 26.Geldner N, et al. Development. 2004;131:389–400. doi: 10.1242/dev.00926. [DOI] [PubMed] [Google Scholar]
- 27.Shevell DE, et al. Cell. 1994;77:1051–1062. doi: 10.1016/0092-8674(94)90444-8. [DOI] [PubMed] [Google Scholar]
- 28.Scarpella E, Marcos D, Friml J, Berleth T. Genes Dev. 2006;20:1015–1027. doi: 10.1101/gad.1402406. [DOI] [PMC free article] [PubMed] [Google Scholar]
- 29.Fulcher N, Sablowski R. Proc Natl Acad Sci USA. 2009;106:20984–20988. doi: 10.1073/pnas.0909218106. [DOI] [PMC free article] [PubMed] [Google Scholar]
- 30.Horvath BM, et al. Embo J. 2017;36:1261–1278. doi: 10.15252/embj.201694561. [DOI] [PMC free article] [PubMed] [Google Scholar]
- 31.Carbonell A, et al. Plant Physiol. 2014;165:15–29. doi: 10.1104/pp.113.234989. [DOI] [PMC free article] [PubMed] [Google Scholar]
- 32.Schwab R, Ossowski S, Riester M, Warthmann N, Weigel D. Plant Cell. 2006;18:1121–1133. doi: 10.1105/tpc.105.039834. [DOI] [PMC free article] [PubMed] [Google Scholar]
- 33.Matos JL, et al. Elife. 2014;3 doi: 10.7554/eLife.03271. [DOI] [PMC free article] [PubMed] [Google Scholar]
- 34.Brand L, et al. Plant Physiol. 2006;141:1194–1204. doi: 10.1104/pp.106.081299. [DOI] [PMC free article] [PubMed] [Google Scholar]
- 35.Moore I, Samalova M, Kurup S. Plant J. 2006;45:651–683. doi: 10.1111/j.1365-313X.2006.02660.x. [DOI] [PubMed] [Google Scholar]
- 36.Kareem A, et al. Plant Methods. 2016;12:27. doi: 10.1186/s13007-016-0127-5. [DOI] [PMC free article] [PubMed] [Google Scholar]
- 37.Ursache R, Andersen TG, Marhavy P, Geldner N. Plant J. 2018;93:399–412. doi: 10.1111/tpj.13784. [DOI] [PubMed] [Google Scholar]
- 38.Bargmann BO, Birnbaum KD. J Vis Exp. 2010 doi: 10.3791/1673. [DOI] [PMC free article] [PubMed] [Google Scholar]
- 39.Edwards K, Johnstone C, Thompson C. Nucleic Acids Res. 1991;19:1349. doi: 10.1093/nar/19.6.1349. [DOI] [PMC free article] [PubMed] [Google Scholar]
- 40.Smetana O, et al. Nature. 2019;565:485–489. doi: 10.1038/s41586-018-0837-0. [DOI] [PubMed] [Google Scholar]
- 41.Li H. 2013 Preprint at http://arxiv.org/abs/1303.3997.
- 42.McKenna A, et al. Genome Res. 2010;20:1297–1303. doi: 10.1101/gr.107524.110. [DOI] [PMC free article] [PubMed] [Google Scholar]
- 43.Poplin R, et al. 2018 Preprint at https://www.bioRxiv.org/content/10.1101/201178v201172.
- 44.Li H, et al. Bioinform. 2009;25:2078–2079. doi: 10.1093/bioinformatics/btp352. [DOI] [PMC free article] [PubMed] [Google Scholar]
Associated Data
This section collects any data citations, data availability statements, or supplementary materials included in this article.
Supplementary Materials
Data Availability Statement
Vectors created in this study have been deposited in Addgene for distribution. Addgene ID numbers are presented in Fig. 1, and Extended Data Fig. 1. All plant material, expression constructs and data supporting findings of this study are available from the corresponding author upon request.


