Abstract
Faba bean (Vicia faba L.) is a widely adapted and high-yielding legume cultivated for its protein-rich seeds (1). However, the seeds accumulate the pyrimidine glucosides vicine and convicine, which can cause hemolytic anemia (favism) in 400 million genetically predisposed individuals (2). Here, we use gene-to-metabolite correlations, gene mapping, and genetic complementation to identify VC1 as a key enzyme in vicine and convicine biosynthesis. We demonstrate that VC1 has GTP cyclohydrolase II activity and that the purine GTP is a precursor of both vicine and convicine. Finally, we show that cultivars with low vicine and convicine levels carry an inactivating insertion in the coding sequence of VC1. Our results reveal an unexpected, purine rather than pyrimidine, biosynthetic origin for vicine and convicine and pave the way for the development of faba bean cultivars that are free of these anti-nutrients.
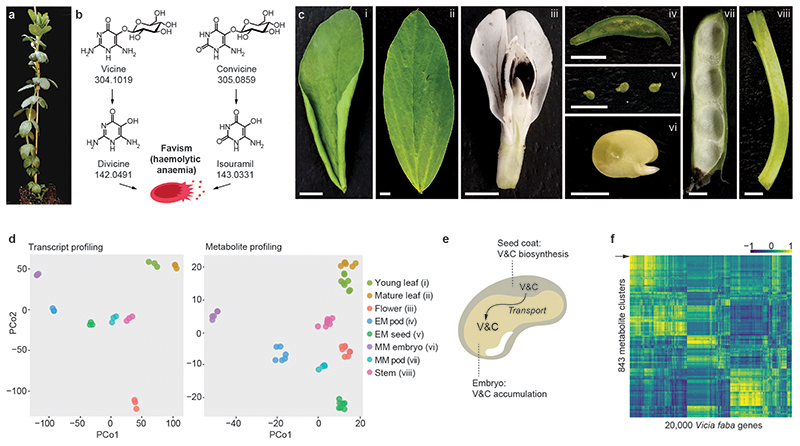
According to the UN’s Intergovernmental Panel on Climate Change (IPCC), switching to a plant-based diet can reduce carbon emissions, especially in the West (3). The suggested change in diet will require a wider and more varied cultivation of locally adapted protein crops. On a worldwide basis, faba bean (Fig. 1a) has the highest yield of the legumes after soybean (1.92 Mg/ha in 2013-2017) (4) and the highest seed protein content of the starch-containing legumes (29% dry-matter basis) (5). Furthermore, faba bean is adapted to cool climates such as Mediterranean winters and northern European summers, where soybean performs poorly (6). A major factor restricting faba bean cultivation and consumption is the presence of the anti-nutritional compounds vicine and convicine (Fig. 1b). Already in the 5th century BCE, the Greek philosopher Pythagoras discouraged his followers from eating faba bean seeds (7). Indeed, faba bean ingestion may trigger favism—hemolytic anemia from faba beans—in 4% of the world population. Susceptible individuals display a deficiency in glucose-6-phosphate dehydrogenase, which is common in regions with historically endemic malaria and renders red blood cells susceptible to oxidative damage. Rather than vicine and convicine themselves, their metabolic products—divicine and isouramil—can directly cause this irreversible damage leading to haemolysis (Fig. 1b). In contrast to the well-described etiology of favism (2), the biosynthetic pathway of vicine and convicine in faba bean remains obscure. One faba bean line with low levels of vicine and convicine (“low-vicine”) was identified in 1989 (8). Since then, the low-vicine trait has been introgressed into a handful of faba bean cultivars, but the causal gene/mutation remains unknown.
Fig. 1. Gene expression analysis and metabolite profiling of eight faba bean tissues.
(a) Faba bean plant at the onset of flowering. (b) The effect of vicine and convicine in individuals affected by favism. Once ingested, vicine and convicine are hydrolyzed to divicine and isouramil, respectively. These metabolic products cause irreversible oxidative stress in red blood cells, leading to favism -haemolytic anaemia. Exact neutral masses are shown below compound names. (c) Faba bean tissues used for the gene expression and metabolite profiling: i) young leaves; ii) mature leaves; iii) flowers; iv) whole seeds at an early seed-filling stage (EF seeds); v) pods from an early seed-filling stage (EF pods); vi) embryos at mid maturation stage (MM embryo); vii) pods at the mid maturation stage (MM pods); viii) stems. Scale bars correspond to 5 mm. (d) Principal coordinate analysis of the gene expression and metabolite profiling datasets. Samples corresponding to the same tissue cluster together. All tissues are represented by distinct clusters. See tissue abbreviations above. (e) Current hypothesis on the translocation of vicine and convicine from biosynthetic, maternal tissues (e.g. seed coat) to the embryo. V&C, vicine and convicine. (f) Heat map representing the correlations of 843 metabolic features with 20,000 faba bean genes. Only features that were present in metabolic clusters with more than one feature are represented in this heat map. MM embryos were not included in this analysis. The arrowhead indicates the metabolite feature cluster representing vicine (cluster 103).
In order to uncover genes associated with the biosynthesis of vicine and convicine in faba bean, we carried out a combined gene expression analysis and metabolite profiling of eight aerial tissues of the inbred line Hedin/2, which accumulates normal levels of vicine and convicine (Fig. 1c). For the gene expression analysis, we assembled the raw RNA-seq data consisting of both short and long reads into a high-quality transcriptome composed of 49,277 coding sequences (Table S1; Supplementary Data 1). We then mapped the short reads from each tissue onto the coding sequences, thus generating an expression matrix (Supplementary Data 2). For the metabolite profiling, we analyzed methanolic extracts using reverse-phase liquid chromatography coupled to high-resolution mass spectrometry, which yielded 1,479 unique metabolic features. We arranged these features into 852 clusters, each composed of one or more metabolic features with matching retention times and similar abundance patterns across tissues (Supplementary Data 3). Cluster 103 was composed of two features whose m/z values corresponded to protonated vicine (feature 89_ID; theoretical m/z: 305.1097; experimental m/z: 305.1099) and its cognate aglucone (protonated vicine aglucone; feature 108_ID; theoretical m/z: 143.0569; experimental m/z: 143.0567). We confirmed that this cluster represented vicine by analyzing a commercial standard and observing the same two features at a similar retention time. In both the gene expression and the metabolite datasets, all tissues could be clearly distinguished from one another using principal coordinate analysis (Figure 1d).
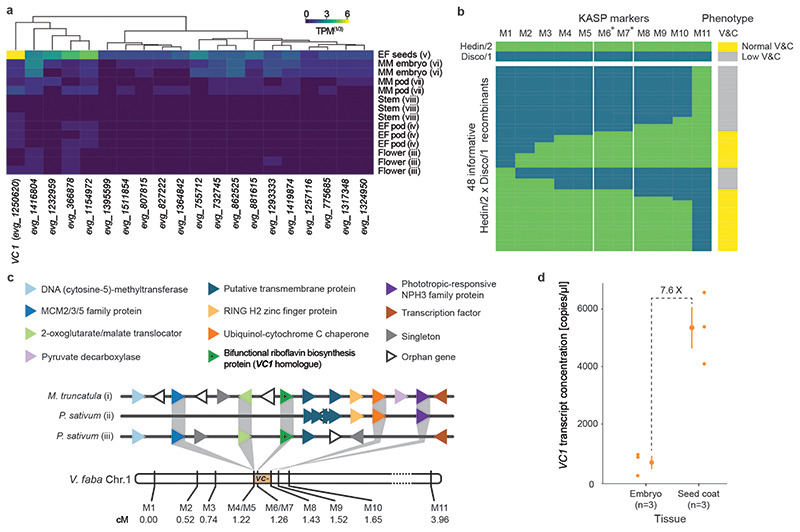
We then proceeded to analyze gene-to-metabolite correlations. The content of vicine and convicine in seeds is maternally determined (8), which suggests that vicine and convicine are synthesized in maternal tissues and transported from there to developing embryos (Fig. 1e). To account for the possibility of translocation, we excluded isolated embryos from the analysis and computed the Pearson correlation coefficients across the seven remaining tissues (Fig. 1f). We then looked closely at the 20 genes most tightly correlated with vicine as represented by cluster_103 (Supplementary Data 4-5). Among them, evg_1250620 stood out by showing the highest expression level in whole seeds (seed coats plus embryos) at an early seed-filling stage (Fig. 2a) (9, 10). The gene encoded an isoform of 3,4-dihydroxy-2-butanone-4-phosphate synthase/GTP cyclohydrolase II, a bifunctional enzyme normally involved in riboflavin biosynthesis (Extended Data Fig. 1). A fragment of this gene, mis-annotated as reticuline oxidase-like, had been identified previously among five other gene fragments based on gene expression comparison between normal- and low-vicine cultivars (11). More recently, Khazaei et al. (2017) (12) showed that a SNP coding for a silent mutation within this fragment could distinguish between normal- and low-vicine cultivars in a diversity panel of 51 faba bean accessions.
Fig. 2. Identification of VC1.
(a) Expression profile of the 20 genes most tightly correlated with vicine accumulation. The gene with the highest expression in whole seeds at an early maturation stage (EF seeds) is VC1 (evg_1250620). None of these genes had detectable expression levels in leaf samples. (b) Narrowing of the genetic vc- interval using a Hedin/2 (normal-vicine) x Disco/1 (low-vicine) fine mapping population. Genotypes were assessed using competitive allele-specific PCR (KASP) markers. The genotypes and phenotypes of the parent lines are color-coded and shown at the top. Allele calls and phenotypes of 48 informative recombinants are shown below using the same color coding. Markers with an asterisk are positioned within the VC1 gene. Marker sequences are described in Table S2, and vicine and convicine levels are shown in Extended Data Fig. 2. V&C, vicine and convicine. (c) Syntenic context view of the alignment between the V. faba vc- interval and collinear segments of M. truncatula (i -chr 2 from 1,801,324 to 1,875,086 bp) and Pisum sativum (ii -chr1 from 364,253,845 to 364,332,337 bp, iii -chr1 from 364,630,606 to 364,960,000 bp). Protein-coding genes are shown as differently colored triangles, where triangles of the same color represent a group of orthologous genes. Gene annotations are taken from the M. truncatula assembly Mt4.0v2. The genetic distance between markers on chromosome 1 of V. faba (Chr1) is shown in centimorgans (cM). (d) VC1 transcript abundance in embryo and seed coat of the normal-vicine line Hedin/2 as determined by ddPCR. Individual data points represent biological replicates, with the number of replicates (n) indicated under each tissue label. For each tissue, the mean ± SD is presented as the measure of center.
All known low-vicine cultivars are derived from a single genetic source. The low-vicine trait is inherited as a single recessive locus, termed vc-, whose identity remains unknown (8). Previous work had placed the vc- locus within a 3.6 cM interval on chromosome 1 (13). We greatly refined the genetic interval carrying vc- to 0.21 cM by mapping the low-vicine phenotype in a population of 1,157 pseudo F2 individuals from a cross between normal-(Hedin/2) and low-vicine (Disco/1) inbred lines (Fig. 2b-c, Extended Data Fig. 2). Within an overall context of conserved micro-colinearity, vc- was bounded by markers defining an approximately 52-kb interval containing only eight genes in the genome of Medicago truncatula (Medtr2g009220 to Medtr2g009340, corresponding to chr2:1,834,249-1,886,637). One of these eight Medicago genes, Medtr2g009270, encodes an isoform of 3,4-dihydroxy-2-butanone-4-phosphate synthase/GTP cyclohydrolase II (Fig. 2c). Moreover, the SNP identified by Khazaei et al. (12) and a second, independent SNP within evg_1250620 co-segregated fully with the low-vicine phenotype, indicating that evg_125620 is present within the refined 0.21-cM vc- interval (Fig. 2b). Together with the gene-to-metabolite correlation results presented above, these genetic mapping results make evg_1250620 a prime candidate for the vc- gene. From here on, we will refer to evg_1250620 as VC1.
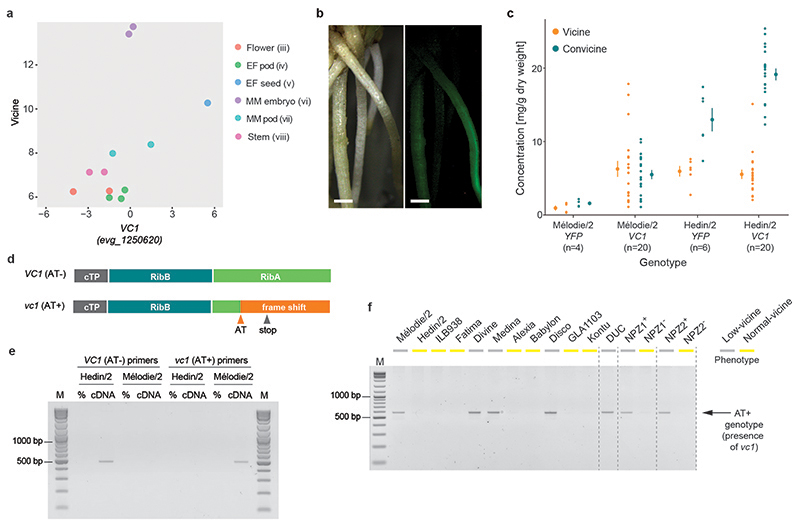
In our gene expression profiling, VC1 displayed high expression levels in whole seeds and low expression levels in isolated embryos (Fig. 2a). Because whole seeds are composed of seed coats and embryos, we hypothesized that VC1 was highly expressed in seed coats, which are of maternal origin. In order to verify this, we conducted an additional gene expression study comparing seed coats to embryos of Hedin/2 (normal-vicine) using droplet digital PCR (ddPCR). This revealed that the expression of VC1 was 8 times higher in seed coats than in embryos (p<0.01 on a two-tailed Student’s t-test) (Fig. 2d). It is worth noting that, in our combined gene expression and metabolite profiling, embryos stood out as having the highest vicine content, while showing only a moderate VC1 gene expression (Fig. 3a). These results are consistent with the biosynthesis of seed vicine and convicine occurring mostly in the seed coat (Fig. 1e) (9) and suggest that VC1 catalyzes a key step in vicine biosynthesis.
Fig. 3. Characterization of VC1 as the vc- gene.
(a) Correlation between the logarithms of vicine content (metabolic feature 89) and VC1 transcript abundance across Hedin/2 tissues as shown by the initial gene expression analysis and metabolite profiling. (b) Hairy roots of faba bean transformed with YFP under the control of the pLjUbi promoter. Pictures taken under white light (left) and UV light (right) are shown. The scale bar corresponds to 1 mm. (c) Vicine and convicine content in hairy roots transformed with YFP (control) or VC1 under the control of the pLjUbi promoter in the background of either Mélodie/2 (low-vicine) or Hedin/2 (normal-vicine) lines. Individual data points represent biological replicates, with the number of replicates (n) indicated under each genotype label. For each tissue, the mean ± SEM is presented as the measure of center. (d) Predicted functional domains of VC1 and the effect of the AT dinucleotide insertion (AT) in vc1. cTP, chloroplast transit peptide; RibB, 3,4-dihydroxy-2-butanone-4-phosphate synthase domain, RibA, GTP cyclohydrolase II domain. (e) Selective PCR amplification of VC1 from Hedin/2 seed coat cDNA and vc1 from Mélodie/2 seed coat cDNA. No cDNA was added to the negative controls (%). M, size marker. The experiment was carried out twice with similar results. (f) Selective PCR amplification of vc1 from genomic DNA of four low-vicine cultivars, seven normal-vicine cultivars, a descendant of the original low-vicine line by Duc et al., and two pairs of near-isogenic lines (NPZ1+/NPZ1- and NPZ2+/NPZ2-). The vicine phenotype of each line is color-coded and shown on top of each lane. The experiment was carried out twice with similar results.
We then investigated whether VC1 was able to rescue the low-vicine phenotype. In the absence of an efficient transformation method for faba bean (14), we adopted a hairy root transformation protocol based on Agrobacterium rhizogenes (15). We found that the ubiquitin promoter from Lotus japonicus (pLjUbi) (16) could successfully drive the expression of YFP in hairy roots (Fig. 3b), and that hairy roots of the normal-vicine line Hedin/2 accumulated several-fold more vicine and convicine than hairy roots of the low-vicine line Mélodie/2 (p<0.01 for both vicine and convicine) (Fig. 3c). Transformation of Mélodie/2 hairy roots with the VC1 coding sequence from Hedin/2 (also under the control of pLjUbi) led to a 7-fold increase in vicine levels compared to the YFP control (p=0.04), reaching similar levels as in the Hedin/2 YFP control. At the same time, a 3-fold increase in convicine levels was observed (p=0.01), reaching approximately half the values of the Hedin/2 YFP control (Fig. 3c). Hairy roots of Hedin/2 transformed with VC1 did not accumulate more vicine than the Hedin/2 YFP control, but the levels of convicine increased by a factor of 1.5 (p<0.01) (Fig. 3c). The ability of VC1 to complement the low-vicine phenotype of Mélodie/2 in hairy roots supports the hypothesis that VC1 is the causal gene associated with the vc- locus.
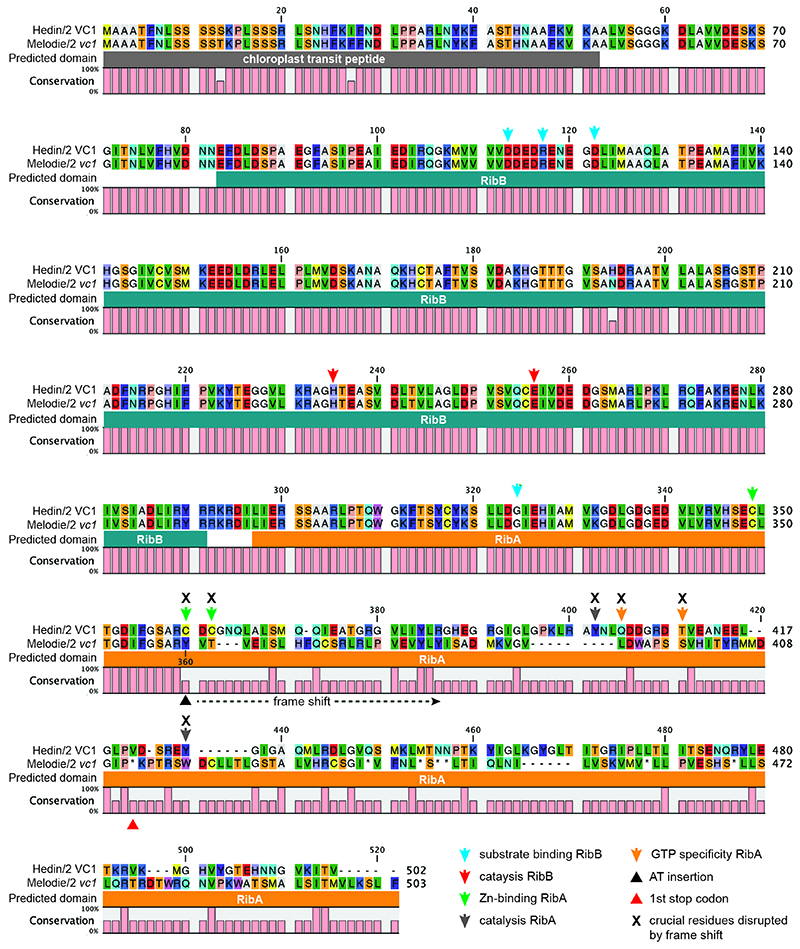
Next, we looked into the causal mutation leading to the low-vicine phenotype. First, we examined VC1 expression in the seed coat, where VC1 from Hedin/2 had shown high expression. Based on ddPCR, the expression level of VC1 in Mélodie/2 was 5 times lower than in Hedin/2 (p<0.01). This difference is not commensurate with the much lower vicine and convicine levels in seeds of Mélodie/2 (typically between 10- and 40-times lower compared to Hedin/2). We then examined the VC1 coding sequences cloned from seed coat cDNA. The coding sequence from Hedin/2 matched the sequence derived from our RNA-seq data exactly. In contrast, the sequence from Mélodie/2, which we designate vc1, contained a 2-nucleotide AT insertion causing a reading frame shift in the region encoding the GTP cyclohydrolase II (Fig. 3d, Extended Data Fig. 3, Supplementary Data 6). Using seed coat cDNA and PCR primers able to distinguish between VC1 and vc1 (Extended Data Fig. 4), we detected only VC1 in Hedin/2 whereas vc1 was predominant in Mélodie/2 (Fig. 3e). The AT insertion is located within the first half of the region encoding the GTP cyclohydrolase II and prevents the correct synthesis of at least half of the enzyme, including key residues that are necessary for activity (17) (Fig. 3d, Extended Data Fig. 3). This suggests that this AT insertion is the direct cause of the low vicine and convicine levels of Mélodie/2 and that the GTP cyclohydrolase II domain of VC1 is involved in the biosynthesis of vicine and convicine.
Mélodie/2 is one of a handful of faba bean cultivars into which the low-vicine trait has been introgressed. The single genetic origin of the trait is a low-vicine line identified in 1989 by Duc et al. (8). We examined an inbred descendant of this line, which we here call DUC, and found that it carried vc1 in its genome (Fig. 3f). We analyzed four additional low-vicine lines (Mélodie/2, Divine, Medina, and Disco) and compared them to seven normal-vicine lines (Hedin/2, ILB938, Fatima, Alexia, Babylon, GLA1103, and Kontu). All the low-vicine lines carried vc1 in their genomes, whereas the normal-vicine lines did not (Fig. 3f). Finally, we created two pairs of near-isogenic lines (NILs) via the identification of rare, segregating F5 or F7 individuals derived from a cross between a low-vicine cultivar (Fabelle) and a normal-vicine line (Limbo_PC9.7901). Both of the low-vicine NILs carried vc1, whereas their normal-vicine counterparts did not (Fig. 3f). Given the many independent introgression and recombination events represented in our set of analyzed lines, these results offer additional support for the AT insertion in vc1 being the cause of the low-vicine phenotype.
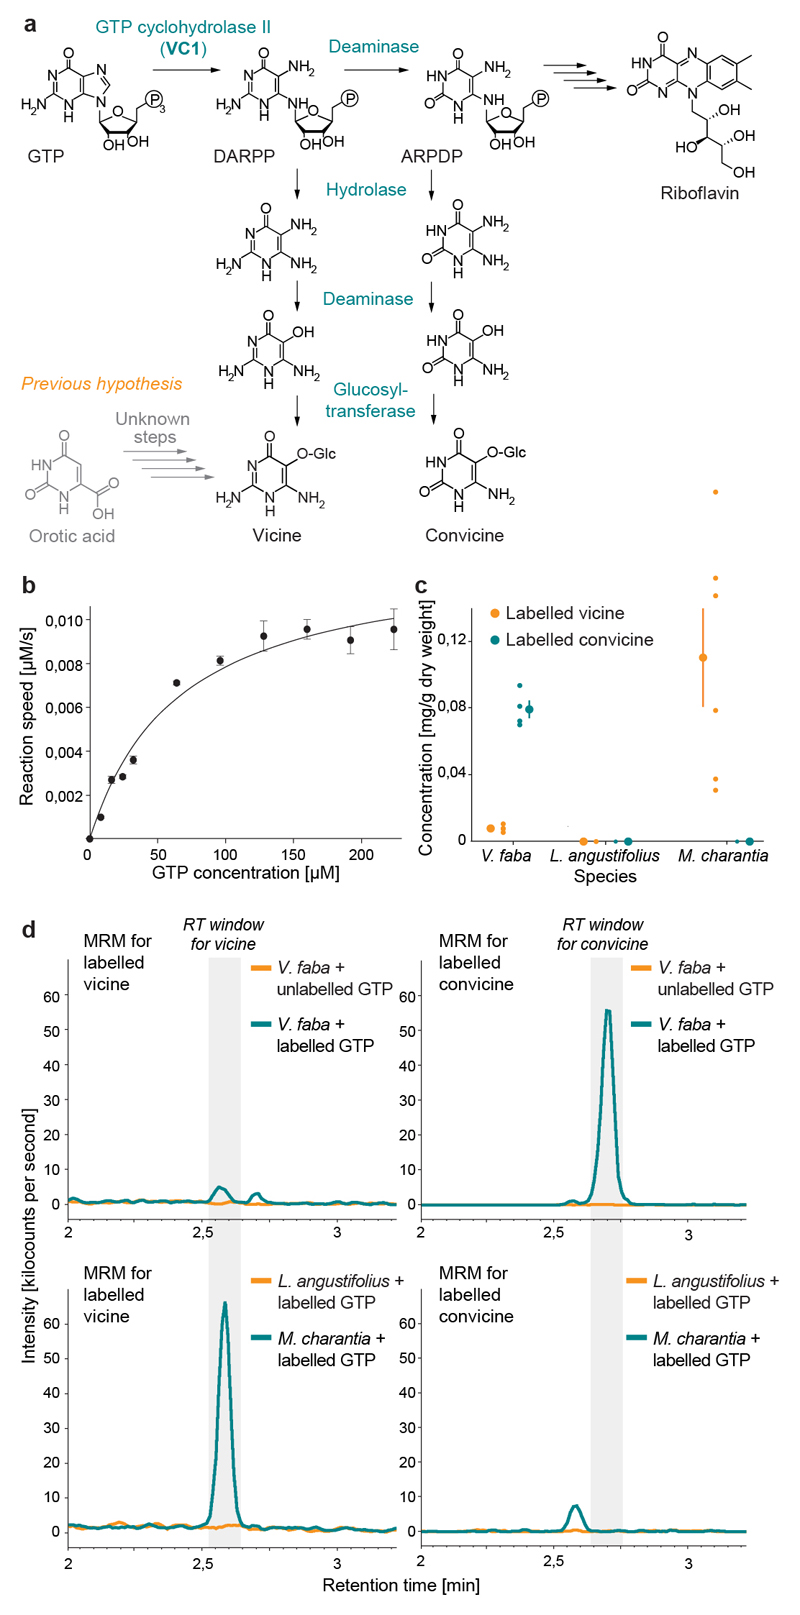
Vicine and convicine are pyrimidine glucosides previously thought to be derived from the orotic acid pathway of pyrimidine biosynthesis (Fig. 4a) (18). This is not consistent with our identification of VC1, which is presumably involved in purine-based riboflavin biosynthesis. Of the two putative enzymes encoded by the bifunctional VC1, GTP cyclohydrolase II catalyzes the first step of the riboflavin pathway, which is the conversion of the purine nucleoside triphosphate GTP into the unstable intermediate 2,5-diamino-6-ribosylamino-4(3H)-pyrimidinone 5’ -phosphate (DARPP). Next, a deaminase converts DARPP into a second unstable intermediate, 5-amino-6-ribosylamino-2,3(1H,3H)-pyrimidinedione 5’ -phosphate (ARPDP). We noticed a structural similarity between DARPP/ARPDP and vicine/convicine, respectively. Accordingly, we hypothesize that vicine and convicine are derived respectively from DARPP and ARPDP via a parallel, 3-step biochemical transformation (Fig. 4a). The first of these proposed transformations is a hydrolysis that has recently been shown to be catalyzed by COG3236 in bacteria and plants (19). Only two more steps would be necessary to produce vicine and convicine: a deamination and a glucosylation (Fig. 4a).
Fig. 4. Characterization of VC1 as a GTP cyclohydrolase II and establishment of GTP as a precursor for vicine and convicine.
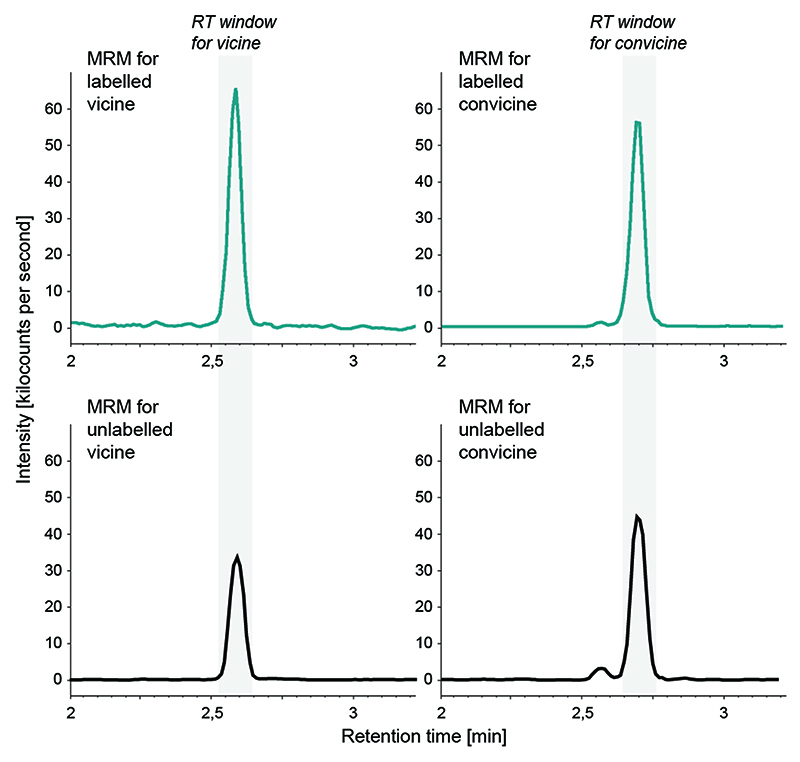
(a) Proposed pathway for the biosynthesis of vicine and convicine. (b) Saturation kinetics of the GTP to DARPP conversion catalyzed in vitro by His-tagged VC1. Data points represent the means of 4 replicates; error bars represent standard errors (SEs). The data was fit to a Michaelis-Menten curve with a K M of 66 ± 12 μM (SE) and a V max of 0,013 + 0,001 μM/sec (SE). (c) Conversion of 13C10,15N5-GTP (labeled GTP) into 13C4,15N4-vicine (labeled vicine) and 13C4,15N3-convicine (labeled convicine) by roots of V. faba, L. angustifolius, and M. charantia. Individual data points represent biological replicates, with the number of replicates (n) indicated under each tissue label. For each tissue, the mean ± SEM is presented as the measure of center. (d) Representative chromatograms (multiple reaction monitoring, MRM) showing the elution of labeled vicine (panels on the left) and labeled convicine (panels on the right) from the precursor feeding experiments. The retention time (RT) windows for vicine and convicine are shaded in grey (see Extended Data Fig. 7 for comparison to unlabeled standards). The top two panels correspond to the feeding of faba bean roots with unlabeled and labeled GTP (chromatograms in orange and dark green, respectively). The bottom two panels correspond to the feeding of labeled GTP to roots of Lupinus angustifolius (Fabaceae, non-producer; chromatogram in orange) and Momordica charantia (non-Fabaceae, vicine producer; chromatogram in dark green).
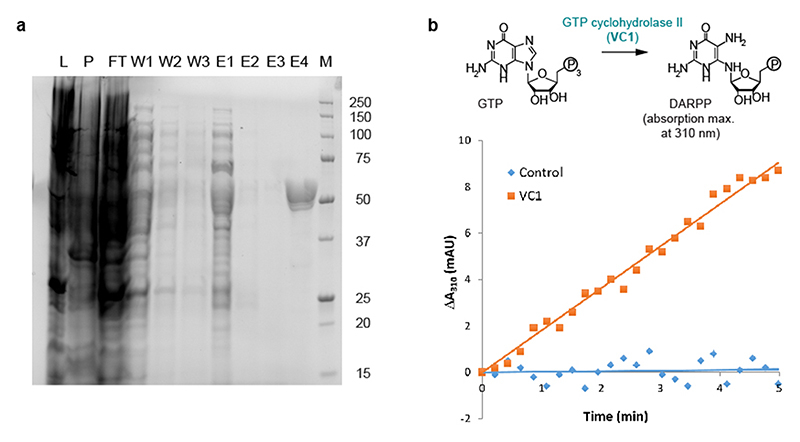
To test our pathway hypothesis, we first analyzed the activity of the VC1 protein in vitro. For this, we constructed a His-tagged version without the predicted chloroplast targeting signal (Fig S5). We expressed this VC1 version in E. coli and subjected it to affinity chromatography (Extended Data Fig. 6a). The final enzyme preparation was able to convert GTP to DARPP (Extended Data Fig. 6b) with a K M of 66 ± 12 μM (SE) (Fig. 4b), which is close to what has been reported for other His-tagged GTP cyclohydrolase II enzymes (20, 21). Then, we fed 13C10,15N5-GTP to Hedin/2 roots to determine whether GTP was a precursor for vicine and convicine. This resulted in the detection of both 13C4,15N4-vicine and 13C4,15N3-convicine, whereas the feeding of unlabeled GTP did not (Fig. 4c-d). We performed analogous feeding studies with narrow-leafed lupin (Lupinus angustifolius), a legume that accumulates neither vicine nor convicine; these did not result in the detection of labeled vicine or convicine (Fig. 4c-d). Finally, we fed 13C10,15N5-GTP to roots of bitter melon (Momordica charantia), which is a phylogenetically remote species (Cucurbitaceae) that accumulates vicine but not convicine. This resulted in the detection of the same labeled vicine species seen previously in faba bean (13C4,15N4-vicine) (Fig. 4c-d). These feeding experiments establish GTP as a precursor for vicine and convicine and suggest that vicine biosynthesis from GTP may have evolved independently at least twice.
In summary, we have identified VC1 as a key gene in the biosynthesis of vicine and convicine as well as the mutated vc1 gene that represents the single known genetic source of low vicine and convicine content. Our study also demonstrates that the pyrimidine glucosides vicine and convicine are not derived from pyrimidine metabolism but from purine metabolism, specifically from intermediates in the riboflavin pathway. This work represents a stepping-stone towards the complete elucidation of the biosynthetic pathway of vicine and convicine as well as the full elimination of these anti-nutritional compounds from faba bean.
Methods
Gene expression analysis, metabolite profiling, and gene-to-metabolite correlations of eight faba bean tissues
Plant growth and sampling
Faba bean plants of the inbred line Hedin/2 were grown in the field at Sejet International ApS (Horsens, Denmark). The following tissue types were collected: i) young leaf (closest to the shoot meristem, not fully open); ii) mature leaf (fully open); iii) flower (banner petals open); iv) pod at early seed-filling (EF) stage; v) whole seed at EM stage (containing seed coat and embryo); vi) embryo at mid-maturation (MM) stage; vii) pod at MM stage; viii) stem (4 - 5 cm segments positioned 5 cm below the top of the shoot meristem). Sample collection was carried out at the same time of the day to reduce the influence of circadian rhythm. Tissue samples were harvested, flash frozen on-site, and later ground and split into pools for RNA isolation and metabolite extraction. For EF seeds, due to a prolonged dissection time resulting in a small volume of samples that were difficult to split, six separate replicates were harvested, of which three were used for transcriptome analysis and another three for metabolite profiling. The ground tissue pools were stored at -80 °C until further analysis.
Gene expression analysis
Total RNA was extracted from ground tissues using a NucleoSpin RNA Plant extraction kit (Macherey-Nagel). Non-strand-specific cDNA libraries of 250-300 bp were synthesized and sequenced by Novogene (Hong Kong) using the HiSeq PE150 sequencer (Illumina), resulting in 30-43 million reads per sample. Additionally, two strand-specific Illumina libraries (Novogene) and one PacBio library (Earlham Institute, UK) prepared from a pool of the RNA samples were sequenced, yielding 64 and 0.5 million reads, respectively. A de novo assembly of the V. faba Hedin/2 gene set was created using Trinity 2.4.0 (22). First, an assembly was made independently for each tissue. Biological triplicates were used alongside the reads from the PacBio dataset. For the pool of RNA samples, only two duplicates were employed. To reduce the redundancy within each assembly, they were subjected to CD-HIT-EST clustering with a sequence identity threshold of 0.95 and a word size of eight (23). The clustered assemblies were then merged into one to create a combined gene set. Next, the EvidentialGene pipeline (tr2aacds.pl script v2016.07.11) was run using standard settings to filter for quality and further decrease redundancy (24). The quality of the assemblies were accessed by mapping reads back to the assemblies using BWA-mem v0.7.5aand BUSCO v3.0.2 (25, 26). Transcripts were quantified with Bowtie2, R v3.4, and RSEM v1.2.29 (27, 28). Bowtie2 was run in the following modes: “no-discordant”; “no gaps in the first 1,000 bases”; “no-mixed”; “end-to-end”. Finally, the set of transcripts was filtered with an expression cut-off set to 1 transcript per million mapped reads (TPM) across the tissues.
Metabolite profiling
Ground tissues were freeze-dried. About 2.5 mg of dry material was extracted with 200 μl of 60% MeOH containing 50 μM caffeine as internal standard. The mixture was shaken for 15 min at 1200 rpm and centrifuged at 13 500 x g for 5 min. The supernatant was diluted 10x with 15% MeOH and cleared through 0.22 μm filters. Reversed-phase LC-MS analysis was performed on a Thermo Fisher Dionex UltiMate 3000 RS HPLC/UHPLC system fitted with a Kinetex EVO C18 column (100 x 2.1 mm, 1.7 μm, 100 Å, Phenomenex) and interfaced to an ESI compact QqTOF mass spectrometer (Bruker, Bremen, Germany). The eluent flow rate was 0.3 ml/min and the column temperature was kept constant at 40 °C. Mobile phases A and B consisted of 0.05% formic acid in water and 0.05% formic acid in acetonitrile, respectively. The elution profile was 0 – 5 min, 0% B constant; 5 – 24 min, 0 – 100% B linear; 24 – 26 min, 100% B linear, 26 – 27 min, 100% – 0% B linear; 27 – 35 min, 100% B constant. ESI mass spectra were acquired in positive ionization mode with the following parameters: capillary voltage, 4500 V; end plate offset, −500 V; source temperature, 250 °C; desolvation gas flow, 8.0 l/min; nebulizer pressure, 2.5 bar. Nitrogen was used as desolvation and nebulizer gas. The scanned m/z range was 50 to 1,000. Sodium formate clusters were used for internal mass calibration and were introduced at the beginning of each run (first 0.5 min). The software used for data acquisition was Bruker Daltonics HyStar v3.2 SR4. Each tissue extract was injected twice (technical replicates) and a blank sample was run every 10 injections. The raw LC-MS chromatograms were mass calibrated, converted to mzXML format and submitted to XCMS Online (ver. 3.7.1) for alignment, feature detection and quantification (29). A multi-job analysis was performed using the default settings for UPLC/Bruker Q-TOF instruments and considering the following sample groups: EF pods (n = 8), MM pods (n = 4), EF seeds (n = 6), MM embryos (n = 6), flowers (n = 4), stems (n = 4), young leaves (n = 4), mature leaves (n = 3), and blanks (n = 8). Biological and technical replicates were treated as independent samples. Metabolite features were defined as mass spectral peaks of width between 5 and 20 seconds and a signal-to-noise ratio of at least 6:1. Metabolic features derived from the mass calibrant (retention time < 0.5 min) were removed. The dataset was further filtered by removing metabolic features whose intensity in any of the tissue sample groups was not significantly different from that in the blank sample group (p < 0.01 in Student’s t-test). After filtering, the intensities of the remaining metabolite features were normalized to the dry weight of the samples and to the signal of the internal standard (the protonated molecular ion of caffeine). The normalized intensity profile of each metabolite feature was centered and scaled. Using MultiExperiment Viewer (ver. 4.9) (30), the metabolite features were subjected to complete-linkage hierarchical clustering analysis (HCA) based on the Pearson’s correlation coefficient between their centered and scaled intensity profiles. The HCA dendrogram was manually divided into discrete metabolic clusters of the largest possible height and composed entirely of metabolite features with overlapping median retention times (difference of < 6 s). As indicated in the main text, we identified a cluster (cluster 108) composed of two features, corresponding to protonated vicine (median m/z 305.1099) and protonated vicine aglucone (median m/z 143.0567). The separate running of a commercial vicine standard confirmed that these two features represented vicine. Two analogous metabolic features were found for convicine (median m/z 306.0994 and 144.0491). However, due to vicine and convicine having the same retention time in our experimental setup, these features represented not only the convicine-related [M+1] ions, but also the respective vicine-related [M+2] ions. Accordingly, these additional features were not investigated further.
Gene-to-metabolite correlations
Prior to calculating correlation coefficients, expression and metabolite data was normalized using Poisson-seq v1.1.2 (31). We also removed metabolic features that represented a metabolic cluster on their own, leaving 843 features. We then used the ‘cor’ function of R v3.4.3 (32) to calculate the Pearson correlation coefficients for gene expression (quantified as TPM) versus the normalized intensity of metabolic features. The correlations obtained were then averaged across the metabolic features in each metabolic cluster. For all tissues except EF seeds, individual samples were directly matched in the correlation analysis. For EF seeds, separate samples were used for gene expression and metabolite profiling, and the mean of the replicates was used for the correlation analysis. Since vicine and convicine are likely to be produced in maternal tissues and transported to the embryo (see main text), MM embryos were excluded from the analysis. Altogether 17 samples from the following tissues were used in this analysis: flowers (3); stems (3); young leaves (3); mature leaves (2); EF pods (3); EF seeds (1); and MM pods (2). See Supplementary Data 5 for full details and the R scripts used.
ddPCR-based quantification of VC1/vc1 expression
Plants were grown in the greenhouse of the Viikki Plant Science Centre (Helsinki, Finland). Embryo and seed coat tissues were harvested from Hedin/2 or Mélodie/2 plants at the mid-maturation stage and flash-frozen. Frozen tissues were ground using a TissueLyser MM300 oscillatory mixer mill (Qiagen Retsch). For embryo tissue, RNA was extracted from single embryos using 1 ml TRIzol (Thermo Fisher Scientific) following the manufacturer’s instructions. The extracted RNA was treated with DNaseI (Ambion) and purified with an RNeasy MinElute Cleanup Kit (Qiagen). For seed coats, RNA was extracted from 100 mg of powdered tissue using the RNeasy Plant Mini Kit (Qiagen) including DNAse treatment. Extractions were made as three technical replicates per plant and as three plants for each tissue. First-strand cDNA was synthesized using Superscript IV reverse transcriptase (Invitrogen) and primed with oligo(dT). Droplet digital PCR was carried out on a QX200 AutoDG Droplet Digital PCR System (Bio-Rad). The PCR reaction contained 10 μL of 2x QX200 ddPCR EvaGreen Supermix (Bio-Rad), 100 nM forward primer (CTTCTTGCATTCTCCTCATTTCCTC) and 100 nM reverse primer (CCCTCCAGATACCAATGCAGCTTTAACC), 1 μl cDNA, and nuclease-free water to a final volume of 20 μL. The PCR program consisted of 95 °C for 5 min; 40 cycles of denaturation at 95 °C for 30 s followed by annealing/extension at 58 °C for 1 min (ramp rate of 2 °C s-1); and signal stabilization at 4 °C for 5 min. The resulting data were analyzed with QuantaSoft software v1.7 (Bio-Rad).
Specific amplification of VC1 and vc1 from seed coat cDNA of Hedin/2 and Mélodie/2
Seed coat RNA was extracted and converted to cDNA as described in the previous section. For the diagnostic specific amplification of vc1 (with AT insertion) versus VC1, we designed primers with small mismatches to control amplification efficiencies. For vc1, we used forward primer GACATATTTGGATCTGCCACATATG and reverse primer TCCTCAAAGACCAGTAGCACC. The specificity relies on the forward primer having two mismatches to the VC1 sequence (…GACATATTTGGATCTGCCAgATgTG…) but only one to the vc1 sequence (…GACATATTTGGATCTGCCAgATATG…) (Supplementary Data 6). For the specific amplification of the active VC1 form (no AT insertion), an alternative forward primer was used: GACATATTTGGATCTGCCACTTG, which has three mismatches to the vc1 sequence (…GACATATTTGGATCTGCCAgaTa…) but only two to the VC1 sequence (…GACATATTTGGATCTGCCAgaTG…) (Supplementary Data 6). The 50-μl PCR reactions were carried out using LongAMP© Taq DNA polymerase (Biorad), 1 μl cDNA, and the following temperature program: 94 °C for 2 min; 30 cycles of denaturation at 94 °C for 30 sec, annealing at 58 °C for 30 sec, and extension at 72 °C for 40 sec.
Generation of near-isogenic lines
We created two pairs of near-isogenic lines from a breeder’s cross between the low-vicine cultivar Fabelle and the normal-vicine line Limbo_PC9.7901. From the F5 generation of the breeder’s program, we identified a rare individual that was still segregating for vicine seed content and was therefore heterozygous for the vc- gene. We derived the near-isogenic lines NPZ1+ and NPZ1- from this individual by further self-fertilization and phenotyping for vicine seed content. Separately, we obtained the near-isogenic lines NPZ2+ and NPZ2- using a similar process, but starting with the F7 generation of the breeder’s program. Compared to F5, the F7 generation underwent two further cycles of meiotic recombination, and thus, this second pair of near-isogenic lines is likely to represent a narrower introgression event.
Specific amplification of vc1 from genomic DNA of different faba bean lines
Seeds of Mélodie/2 and ILB938 were collected from plants grown in the greenhouse of the Viikki Plant Science Centre. Seeds of Alexia and GLA1103 were obtained from Saatzucht Gleisdorf Ges.mbH (Gleisdorf, Austria). Kontu seeds were from Boreal Plant Breeding Ltd (Jokioinen, Finland). Seeds of Fatima, Divine, and Disco were gifts from Agri Obtentions (Guyancourt), France. Babylon seeds were supplied by Nickerson Seeds (Rothwell, Lincolnshire, UK). Fatima seeds were sourced from the Crop Development Centre, University of Saskatchewan (Saskatchewan, Canada). The near-isogenic lines NPZ1+/- and NPZ2+/- were constructed as described immediately above. From each line, genomic DNA was isolated from three-day-old germinated axes. Three axes were frozen with liquid nitrogen, then ground as described above. To the ground axes, 800 μl of 2.5% CTAB (cetyl trimethylammonium bromide) and 8 μl of RNaseA (10 mg/ml) were added and the slurry was incubated at 65° C for 2h. After adding 700ul of chloroform, the sample was centrifuged at 15,000 x g for 5 min. The upper phase was taken to another tube, 700ul chloroform added, and the sample centrifuged again. DNA was precipitated with one volume of isopropanol and pelleted by centrifugation at 15,000 x g for 15 min. The pellet was washed with 70% ethanol, re-centrifuged at 15,000 x g for 5 min, lightly dried, then dissolved in milliQ water. For the specific amplification of vc1, the primers and PCR conditions were as described above for cDNA amplification, except that 35 instead of 30 cycles were used, and a final signal stabilization period of 5 min at 72° C was used. The identity of the PCR products was confirmed via Sanger sequencing, which revealed the presence of a small, 95-bp intron.
Targeted analysis of vicine and convicine
Approximately 2.5 mg of dry tissue was weighed, ground, and extracted with 200 μl of 60% MeOH containing 8 μM uridine as an internal standard. The mixture was shaken for 15 min at 1200 rpm at room temperature, followed by a 5-min centrifugation at 12,000 rpm. The supernatant was diluted 10-fold with 90% acetonitrile and cleared using a 0.22-μm filter. HILIC chromatography coupled to mass spectrometry served to detect vicine and convicine through a method developed by Purves et al (Purves, 2018). Chromatography was performed on an Advance UHPLC system (Bruker) with an Acquity UPLC BEH Amide column (2.1 x 50 mm, 1.7 μm, Waters). The mobile phases consisted of solvent A (10 mM ammonium acetate and 0.1% formic acid in water) and solvent B (10 mM ammonium acetate and 0.1% formic acid in 90:10 acetonitrile:water). The following gradient program was run at a flow rate of 400 μl/min: from 100% -90% B for 0.5 min; from 90% to 75% B for 3.5 min; from 75% to 100% B for 0.2 min; 100% B for 3.8 min. The HILIC column was coupled to an EVOQ Elite triple quadrupole mass spectrometer (Bruker) equipped with an electrospray ionization source (ESI). The ion spray voltage was maintained at −5000 V. Cone temperature was set to 350 °C and cone gas pressure to 20 psi. The temperature of the heated probe was set to 275° C and the probe gas pressure to 30 psi. Nebulizing gas was set to 40 psi and collision gas to 1.6 mTorr. Nitrogen was used as cone gas, probe gas, and nebulizing gas, whereas argon served as collision gas. Multiple reaction monitoring (MRM) was carried out in negative mode and the transitions used were 303 → 141 for vicine (collision energy (CE) = 15 eV), 304 → 141 for convicine (CE = 19 eV), and 243 → 200 for uridine (CE = 6 eV). Uridine signals were used for normalization, and external standard curves (1-2,000 nM) were used for quantification of vicine and convicine. The standards of vicine and convicine were kindly provided by Randy Purves (University of Saskatchewan). Bruker MS Workstation software (Version 8.2.1) was used for data acquisition and processing.
Fine mapping of vc-
Inbred lines Hedin/2 and Disco/1 (normal- and low-vicine phenotype, respectively) were crossed to obtain an F2 population of 73 F2 individuals. Selfed seeds from 39 F3 individuals, which were heterozygous across the previously defined vc- interval (13), were grown to form a pseudo-F2 population of 1,157 individual plants segregating for the vc- gene. Individual SNP (Single Nucleotide Polymorphism) KASP assays were selected from previous maps based on the 3.4-cM interval reported by Khazaei (13) or designed based on markers mined from RNA-seq data. The markers used are described in Table S2. KASP markers developed by Webb et al. (33) bounding the vc- interval described by Khazaei et al. (13) were initially used to screen the Hedin/2 x Disco/1 pseudo-F2 population for putative recombinants. 90 recombinants were found, which were then genotyped for the full panel of vc--targeted polymorphisms together with the parental stocks. A genetic map fragment was constructed using R/QTL version 1.42-8 (built in R version 3.3.3) (34). Dry seeds of 48 informative recombinants were harvested, ground to flour, and analyzed for vicine and convicine using the targeted analysis described above.
Cloning of VC1 and vc1 coding sequences
The VC1 coding sequence was cloned from Hedin/2 roots as well as from seed coats. For roots as starting material, we used 2-week-old seedlings grown on vermiculite at room temperature. We extracted RNA with a Spectrum Plant Total RNA Kit (Sigma-Aldrich). cDNA was synthesized from RNA using the SuperScript™ III First-Strand Synthesis System (Thermo Fisher Scientific) and oligo (dT)20 primers. The coding region was amplified by PCR using cDNA as template and the following primers: ATGGCAGCTGCTACTTTCAAT and TCAAACAGTGATTTTAACACCATTGTTA. The PCR product was cloned into vector pJET1.2/blunt using a CloneJet PCR Cloning Kit (Thermo Scientific) and then sequenced. When using seed coats as the starting material, RNA was extracted as described above for ddPCR and cloned as described below for vc1. To determine the full-length mRNA sequence of VC1, 5’ RLM-RACE and 3’ RLM-RACE were used as described earlier (35), then the products cloned and sequenced as described above.
The vc1 coding sequence was cloned from Melódie/2 seed coats harvested from greenhouse-grown plants. The seed coats were isolated 20-25 days after tripping (hand pollination). RNA was extracted from frozen seed coat powder as described above for ddPCR. First-strand cDNA was carried out also as described above for ddPCR. The coding sequence of vc1 was amplified by PCR using cDNA as template as well as primers CTTCTTGCATTCTCCTCATTTCCTC (forward) and TCCTCAAAGACCAGTAGCACC (reverse), which target the 5’ and 3’ ends of the transcript, respectively. The PCR product was cloned into pGEM®-T (Promega) and sequenced.
Overexpression of VC1 in hairy roots
In order to introduce 3 silent mutations that removed the BpiI and BsaI restriction sites, we synthesized the coding sequence of VC1 cloned from root cDNA (GeneScript). The synthesized sequence was PCR amplified using primers ATGAAGACGGAATGATGGCAGCTGCTACTTTCAAT and ATGAAGACGGAAGCTCAAACAGTGATTTTAACACC, which added GoldenGate overhangs for creating an SC module (36). The level-0 plasmid SC-VC1 was created in a 20 μl reaction containing 100 ng of the gel-purified PCR product, 100 ng of the target pICH vector, 5 U of T4 ligase (Thermo Scientific), 2.5 U of BpiI (Thermo Scientific), and 2 μl of 10x T4 ligase buffer. The following temperature program was used: 25x (37 °C for 3 min, 16 °C for 4 min), 65 °C for 5 min, and 80 °C for 5 min. The overexpression construct LjUbi:VC1 (Supplementary Data 7) was created in a 20 μl reaction containing 100 ng of each of the following plasmids: PU-LjUbi, SC-VC1, T-35s, and pIV10. The reaction also contained 5U of T4 ligase, 2.5 U of BsaI (New England BioLabs), and 2 μl 10x T4 ligase buffer.
Seeds of Mélodie/2 and Hedin/2 were surface-sterilized for 10 min on 0.5% sodium hypochlorite and subsequently rinsed 5 times with sterile water. The sterilized seeds were germinated on Petri dishes lined with moist filter paper and transferred to magenta boxes containing moist vermiculite. Plants were grown at 21 °C with a photoperiod of 16/8 h. In parallel, plasmids LjUbi:YFP (37) and LjUbi:VC1 were conjugated into Agrobacterium rhizogenes GV3101 using triparental mating (38). We then infected the in-vitro-grown plants with the transformed A. rhizogenes using a protocol adapted from Kereszt et al (15). Briefly, seedlings that had produced two true leaves were wounded at the hypocotyls and inoculated with a high-density suspension of A. rhizogenes. Inoculated plants were incubated in the dark for 48 h and then grown at 21 °C with a photoperiod of 16/8 h for 3-4 weeks. Hairy root tissue was flash frozen in liquid nitrogen and freeze-dried for targeted vicine and convicine analysis.
Stably labeled precursor feeding experiments
Seeds of faba bean (Hedin/2), narrow-leafed lupin (cv. Oskar, purchased from HR Smolice, Poland) and bitter gourd (purchased from Bjarne’s Frø og Planter, Denmark) were germinated on moist paper. 3-4-day seedlings were transferred to 2-ml Eppendorf tubes, where they were fed for 72 h with 1.5 ml of 1 mM 13C10,15N5-GTP in 5 mM Tris buffer at pH 7.2 through the roots. As controls, seedlings were fed with unlabeled GTP instead. The entire roots were cut from the seedlings, frozen in liquid nitrogen, and freeze-dried. The targeted analysis of labeled vicine and convicine was carried out as described above for unlabeled vicine and convicine, except for the MRM transitions used, which were 311 → 149 (CE = 15 eV) for labeled vicine (13C4,15N4-vicine) and 311 → 148 (CE = 19 eV) for labeled convicine (13C4,15N3-convicine). For quantification, labeled vicine and convicine were assumed to have the same ionization efficiencies as their unlabeled forms.
Expression and purification of His-tagged VC1
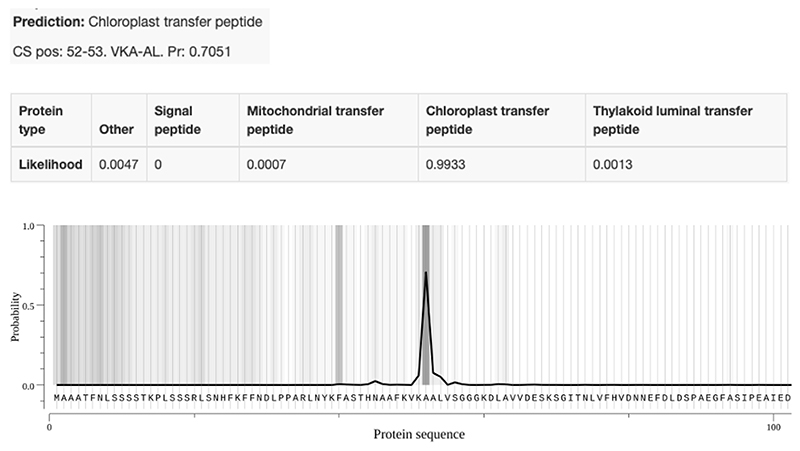
We predicted the chloroplast transit peptide (cTP) of VC1 using TargetP online (version 2.0) (39) (Extended Data Fig. 5). An E. coli codon-optimized version of VC1 coding for an N-terminal His-tag and lacking the predicted cTP-coding region (Supplementary Data 7) was synthesized (GenScript) and cloned into expression vector pET22b(+) using restriction sites NdeI and HindIII. The plasmid was transformed into ArcticExpress (DE3) RIL E. coli competent cells (Agilent Technologies) and protein expression was performed mainly as described by Hiltunen et al. (17). Cells were grown at 37 °C and 220 rpm in 750 ml of selective LB media up to an OD600 of 0.5-0.7. The culture was cooled on ice and subsequently induced by adding IPTG to a final concentration of 1 mM. Protein expression took place for 24 h at 13°C and 170 rpm. After pelleting, cells were resuspended in 2 ml of lysis buffer (50 mM Tris, 300 mM NaCl, 0.01% β-mercaptoethanol, 2 mM imidazole, pH 7.5), and 400 μl of 25x cOmplete EDTA-free protease inhibitor was added before adding 0.2 mg of lysozyme. Following a 1 h incubation on ice and subsequent sonication, the lysate was cleared by centrifugation at 17,000 x g and 4 °C for 25 min. The His-tagged protein was subsequently enriched from the cleared lysate using affinity chromatography with stepwise elution. The lysate was gently shaken with 0.5 ml of Ni-NTA agarose suspension (Qiagen) for 1 h at 4 °C and transferred to a filter column where the liquid was drained. The matrix was washed 3 times with 1.5 ml washing buffer (50 mM Tris, 300 mM NaCl, 0.01% β-mercaptoethanol, 5 mM imidazole, pH 7.5). Elution was carried out using 1 ml of four different elution buffers with different imidazole concentrations (50 mM Tris, 300 mM NaCl, and either 20 mM, 50 mM, 100 mM, or 250 mM imidazole, pH 7.5). The different eluate fractions were analyzed by SDS-PAGE, which revealed that most of the heterologously expressed protein eluted in the fraction with 250 mM imidazole (Extended Data Fig. 6a). To remove imidazole and concentrate the protein, the 250 mM imidazole fraction was buffer-exchanged into storage buffer (20 mM Tris, 200 mM NaCl, 5% (v/v) glycerol, pH 8.0) using a 30K Amicon filter. The final enzyme preparation was assayed immediately or stored at -20 °C, which preserved enzyme activity. A typical yield of His-tagged VC1 from a 750 ml culture was 6 mg. Protein concentration was estimated using the Pierce™ BCA Protein Assay Kit (ThermoFisher).
Enzyme assays and kinetics
Enzyme activity was analyzed as previously reported (20, 21). Assays were carried out in quadruplicates in a final volume of 200 μl containing 50 mM Tris at pH 8.0, 100 mM NaCl, 10 mM MgCl2, and GTP at concentrations varying from 0 to 244 μM. Reactions were started by adding 5 μg of His-tagged VC1 to each reaction mixture. Conversion of GTP to the product 2,5-diamino-6-β-ribosyl-4(3H)-pyrimidinone-5’-phosphate (DARPP) was monitored by measuring absorbance at 310 nm for 5 min using a microplate reader (Spectramax M5, Molecular Devices) under the control of SoftMax Pro v6.2.2 software. The reaction rate was calculated using the extinction coefficient for DARPP (7.43 cm-1 mM-1) as previously reported (20, 21). The kinetic parameters K M and V max were calculated by non-linear regression to fit the data to the Michaelis-Menten equation using SigmaPlot v13.0.
Extended Data
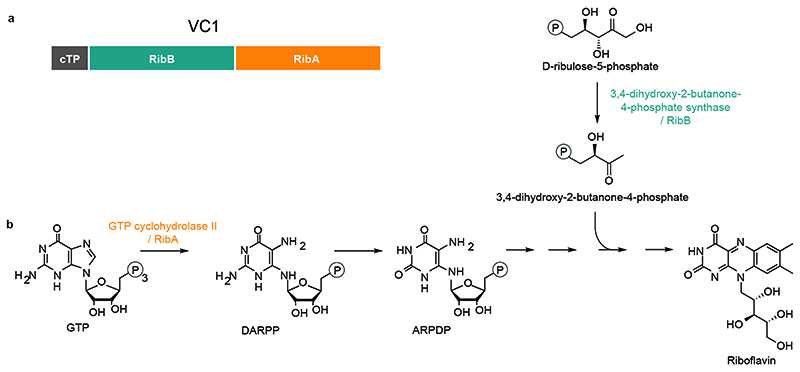
Extended Data Fig. 1. Canonical function of the bifunctional enzyme 3,4-dihydroxy-2-butanone 4-phosphate synthase/GTP cyclohydrolase II in plants.
(a) Domain structure. The protein is composed of a chloroplast targeting peptide (cTP) fused to two catalytic domains: the 3,4-dihydroxy-2-butanone-4-phosphate synthase domain, also called RibB, and the GTP cyclohydrolase II domain, also called RibA. (b) Biochemical function of each catalytic domain in the context of the riboflavin biosynthesis pathway.
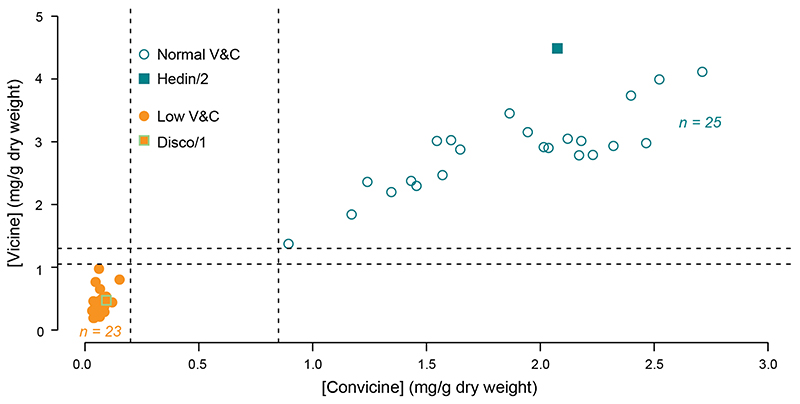
Extended Data Fig. 2. Seed vicine and convicine phenotypes of Hedin/2 x Disco/1 pseudo-F2 recombinants within the vc - interval.
Recombinants are classified as Normal V&C (blue open circles) where vicine levels are >1.3 mg/g and convicine levels are >0.85 mg/g or as Low V&C (green open circles) where vicine levels are <1.05 mg/g and convicine levels are <0.2 mg/g. Parental means (n=2) are shown as squares for Hedin/2 (green) and Disco/1 (blue).
Extended Data Fig. 3. Consequence of the additional AT dinucleotide on the predicted VC1 protein.
An alignment of Hedin/2 VC1 and Mélodie/2 vc1 amino acid sequences is shown. Predicted domains are shown underneath the alignment (RibB, 3,4-dihydroxy-2-butanone-4-phosphate synthase domain; RibA, GTP cyclohydrolase II domain). A measurement of residue conservation is shown underneath the predicted domains, distinguishing between identical residues and other scenarios (non-identical ones as well as gaps/insertions). The position of the AT insertion, which results in a frame shift, is marked with a black triangle underneath the conservation score (position 360). The following key residues in VC1 enzymatic domains are marked: blue arrows, substrate binding in RibB; red arrows, catalysis in RibB; green arrows, Zn binding in RibA; grey arrows, catalysis in RibA; orange arrows, GTP specificity. The prediction of key resides is based on Hiltunen et al. (Int. J. Mol. Sci. 13:14086, 2012) and Ren et al. (J. Biol. Chem. 280:36912, 2005).
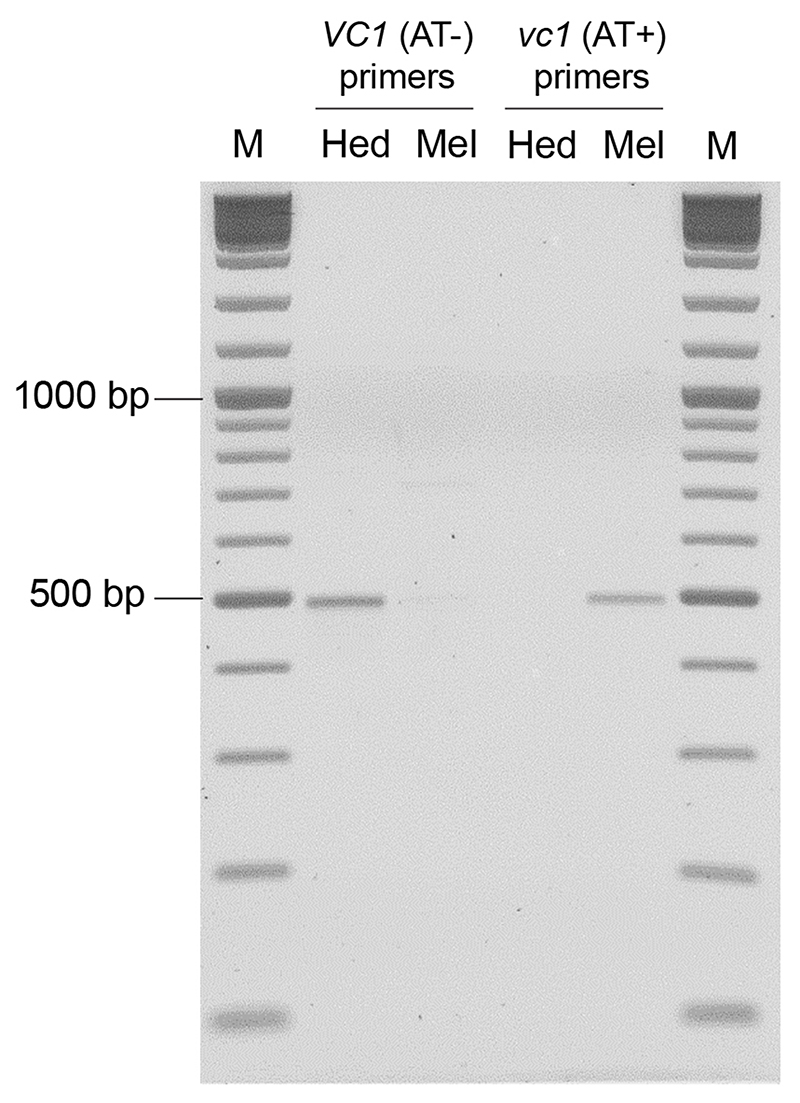
Extended Data Fig. 4. Control reactions for VC1 and vc1 primer pairs.
1 ng of pGEM-T plasmids carrying VC1 cloned from V. faba cv. Hedin/2 (Hed) or vc1 from Mélodie/2 (Mel) were subjected to PCR with primer pairs for either VC1 or vc1. The reaction mixtures and temperature program are the same as described in Methods for “specific amplification of VC1 and vc1 from seed coat cDNA of Hedin/2 and Mélodie/2”, except 25 cycles were used for the vc1 primer pair and 35 for the VC1 primer pair to account for their different efficiencies. This control experiment was carried out twice with similar results.
Extended Data Fig. 5. Predicted subcellular localization of VC1 by TargetP 2.0.
The protein sequence of VC1 from Hedin/2 was run through the prediction server TargetP 2.0 (http://www.cbs.dtu.dk/services/TargetP/) giving the output shown above. The protein is predicted to have an N-terminal chloroplast transfer peptide of 52 amino acids with a likelihood of 0.9933.
Extended Data Fig. 6. VC1 expression, purification, and assays.
(a) Polyacrylamide gel electrophoresis (PAGE) showing the affinity chromatography of His-tagged VC1 on a Ni-NTA matrix. Protein was visualized on a Stain-Free™ pre-cast gel using the ChemiDoc™ gel imaging system (BioRad). L, lysate; P, pellet; FT, flow-through; W1-3, three consecutive wash fractions; E1-4, elutions with increasing concentration of imidazole (20, 50, 100, and 250 mM, respectively); M, molecular weight marker (given in kDa). The expected molecular weight of His-tagged VC1 was 51.3 kDa. After buffer exchange to remove the imidazole, fraction E4 was used for the subsequent assays. The expression and purification of VC1 was carried out several times with similar results. (b) Representative result of the GTP cyclohydrolase II assays measuring the appearance of DARPP, which presents an absorption maximum at 310 nm. The graph shows the increase in absorbance at 310 nm (ΔA310) against time for a control (no enzyme) and for an assay with purified VC1.
Extended Data Fig. 7. Co-elution of labeled vicine and convicine with their respective unlabeled forms.
The top panels show two of the chromatograms shown in Fig. 3d for labeled vicine and convicine, respectively. The bottom panels show two chromatograms obtained when analysing a mixture of unlabeled vicine and convicine standards. The panels on the left show the result of multiple reaction monitoring (MRM) for vicine, while chromatograms on the right show the result of MRM for convicine.
Supplementary Material
Transcriptome coding sequences in FASTA format. To open as FASTA file, please change file extension to “.fa”.
Gene expression counts in transcripts per million (TPM).
List of metabolic features, their grouping into clusters, and their abundances across tissue samples.
List of top-20 genes correlated with vicine accumulation levels in all tissues except mid-maturation embryos.
R scripts used to analyze gene-to-metabolite correlations. To open as R file, please change file extension to “.R”.
VC1 and vc1 cDNA sequences and predicted amino acid sequences.
Design of the expression constructs used in the study.
Acknowledgments
We acknowledge the technical assistance of Anne-Mari Narvanto and Laura Vottonen (University of Helsinki, Finland) as well as the bioinformatic support and analyses by Jaakko Tanskanen (University of Helsinki, Finland). We also acknowledge the analytical support of Randy Purves (University of Saskatchewan, Canada) as well as his kind gift of vicine and convicine standards. We are grateful to NPZ Lembke KG for providing the F5 generation of one of their faba bean crosses. We thank Gérard Duc (INRA, Dijon, France) for providing 6 seeds of the original, low-vicine faba bean line. We also thank Fred Rook and Svend Christensen (University of Copenhagen, Frederiksberg, Denmark) for their contributions towards the funding of this work.
Funding
This work was supported by Innovation Fund Denmark grant number 5158-00004B; Academy of Finland decisions 298314 and 314961; UK Biotechnology and Biological Science Research Council award BB/P023509/1; VILLUM Foundation project 15476; Danish National Research Foundation grant DNRF99; Guangzhou Elite project JY201722; and German Federal Ministry of Food and Agriculture grant 2815EPS004.
Footnotes
Author contributions statement
FGF, SUA, and AHS conceived the research plan; EB, MN, WC, LEH, DM, DA, XX, and RT carried out experiments and data analysis; HK, CC, DOS, FLS, and WL provided instrumentation and resources; JS, DOS, AHS, AV, SUA, FLS, and FGF developed the project design and acquired funding; JS coordinated the project; MN and SUA prepared figures; SUA and FGF wrote the manuscript with input from all authors.
Competing interests statement
The authors declare no competing interests.
Data Availability
All data is available in the Main Text, Extended Data Figures, Supplementary Information, and Supplementary Data. In addition, the RNAseq reads as well as the final transcript sequences have been uploaded to NCBI under BioProject ID PRJNA725986.
Code Availability
Supplementary Data 5 contains the R scripts used for obtaining gene-to-metabolite correlations.
References
- 1.Duc G, et al. Faba Bean. In: De Ron A, editor. Grain Legumes. Handbook of Plant Breeding. Vol. 10 Springer; New York: 2015. [Google Scholar]
- 2.Luzzatto L, Arese P. Favism and glucose-6-phosphate dehydrogenase deficiency. N Engl J Med. 2018;378:1068–1069. doi: 10.1056/NEJMc1801271. [DOI] [PubMed] [Google Scholar]
- 3.Shukla PR, et al. IPCC, 2019: Summary for Policymakers. Climate Change and Land: an IPCC special report on climate change, desertification, land degradation, sustainable land management, food security, and greenhouse gas fluxes in terrestrial ecosystems. 2019 In press. [Google Scholar]
- 4.FAOSTAT. Food and Agriculture Organization of the United Nations. http://www.fao.org/faostat/en/#home. Visited 27.02.2020.
- 5.Feedipedia -Animal Feed Resources Information System -INRA, CIRAD, AFZ and FAO. https://www.feedipedia.org. Visited 27.02.2020.
- 6.Stoddard FL. Grain legumes: an overview. In: Murphy-Bokern D, Stoddard FL, Watson CA, editors. Legumes in Cropping Systems. CAB International; Oxford, UK: 2017. pp. 70–87. chapter 5. [Google Scholar]
- 7.Meletis J, Konstantopoulos K. Favism-from the ‘avoid fava beans’ of Pythagoras to the present. Haema. 2004;7:17–21. [Google Scholar]
- 8.Duc G, Sixdenier G, Lila M, Furstoss V. 1. International Workshop on Antinutritional Factors (ANF) in Legume Seeds, Wageningen (Netherlands), 23-25 Nov 1988. Pudoc: 1989. Search of genetic variability for vicine and convicine content in Vicia faba L.: a first report of a gene which codes for nearly zero-vicine and zero-convicine contents. [Google Scholar]
- 9.Ramsay G, Griffiths DW. Accumulation of vicine and convicine in Vicia faba and V. narbonensis . Phytochemistry. 1996;42:63–67. [Google Scholar]
- 10.Lin JY, et al. Similarity between soybean and Arabidopsis seed methylomes and loss of non-CG methylation does not affect seed development. Proc Natl Acad Sci U S A. 2017;114:E9730–E9739. doi: 10.1073/pnas.1716758114. [DOI] [PMC free article] [PubMed] [Google Scholar]
- 11.Ray H, Bock C, Georges F. Faba Bean: Transcriptome analysis from etiolated seedling and developing seed coat of key cultivars for synthesis of proanthocyanidins, phytate, raffinose family oligosaccharides, vicine, and convicine. Plant Genome. 2015;8 doi: 10.3835/plantgenome2014.07.0028. [DOI] [PubMed] [Google Scholar]
- 12.Khazaei H, et al. Development and validation of a robust, breeder-friendly molecular marker for the vc- locus in faba bean. Mol Breed. 2017;37:140. [Google Scholar]
- 13.Khazaei H, et al. Flanking SNP markers for vicine-convicine concentration in faba bean (Vicia faba L.) Mol Breed. 2015;35:38. [Google Scholar]
- 14.O’Sullivan DM, Angra D. Advances in faba bean genetics and genomics. Front Genet. 2016;7:150. doi: 10.3389/fgene.2016.00150. [DOI] [PMC free article] [PubMed] [Google Scholar]
- 15.Kereszt A, et al. Agrobacterium rhizogenes-mediated transformation of soybean to study root biology. Nat Protoc. 2007;2:948–952. doi: 10.1038/nprot.2007.141. [DOI] [PubMed] [Google Scholar]
- 16.Reid D, et al. Cytokinin biosynthesis promotes cortical cell responses during nodule development. Plant Physiol. 2017;175:361–375. doi: 10.1104/pp.17.00832. [DOI] [PMC free article] [PubMed] [Google Scholar]
- 17.Hiltunen H-M, Illarionov B, Hedtke B, Fischer M, Grimm B. Arabidopsis RIBA proteins: two out of three isoforms have lost their bifunctional activity in riboflavin biosynthesis. Int J Mol Sci. 2012;13:14086–14105. doi: 10.3390/ijms131114086. [DOI] [PMC free article] [PubMed] [Google Scholar]
- 18.Brown EG, Roberts FM. Formation of vicine and convicine by Vicia faba . Phytochemistry. 1972;11:3203–3206. [Google Scholar]
- 19.Frelin O, et al. A directed-overflow and damage-control N-glycosidase in riboflavin biosynthesis. Biochem J. 2015;466:137–145. doi: 10.1042/BJ20141237. [DOI] [PMC free article] [PubMed] [Google Scholar]
- 20.Lehmann M, et al. Biosynthesis of riboflavin. Screening for an improved GTP cyclohydrolase II mutant. FEBS J. 2009;276:4119–4129. doi: 10.1111/j.1742-4658.2009.07118.x. [DOI] [PubMed] [Google Scholar]
- 21.Yadav S, Karthikeyan S. Structural and biochemical characterization of GTP cyclohydrolase II from Helicobacter pylori reveals its redox dependent catalytic activity. J Struct Biol. 2015;192:100–115. doi: 10.1016/j.jsb.2015.08.004. [DOI] [PubMed] [Google Scholar]
- 22.Grabherr MG, et al. Full-length transcriptome assembly from RNA-Seq data without a reference genome. Nat Biotechnol. 2011;29:644–652. doi: 10.1038/nbt.1883. [DOI] [PMC free article] [PubMed] [Google Scholar]
- 23.Fu L, Niu B, Zhu Z, Wu S, Li W. CD-HIT: accelerated for clustering the next-generation sequencing data. Bioinformatics. 2012;28:3150–3152. doi: 10.1093/bioinformatics/bts565. [DOI] [PMC free article] [PubMed] [Google Scholar]
- 24.Gilbert D. Gene-omes built from mRNA-seq not genome DNA; Poster presented at the 7th Annual Arthropod Genomics Symposium in Notre Dame, Indiana; 2013. [Google Scholar]
- 25.Li H. Aligning sequence reads, clone sequences and assembly contigs with BWA-MEM. arXiv:1303.3997 [q-bio.GN] 2013 [Google Scholar]
- 26.Waterhouse RM, et al. BUSCO applications from quality assessments to gene prediction and phylogenomics. Mol Biol Evol. 2018;35:543–548. doi: 10.1093/molbev/msx319. [DOI] [PMC free article] [PubMed] [Google Scholar]
- 27.Langmead B, Salzberg SL. Fast gapped-read alignment with Bowtie 2. Nat Methods. 2012;9:357–359. doi: 10.1038/nmeth.1923. [DOI] [PMC free article] [PubMed] [Google Scholar]
- 28.Li B, Dewey CN. RSEM: accurate transcript quantification from RNA-Seq data with or without a reference genome. BMC Bioinformatics. 2011;12:323. doi: 10.1186/1471-2105-12-323. [DOI] [PMC free article] [PubMed] [Google Scholar]
- 29.Tautenhahn R, Patti GJ, Rinehart D, Siuzdak G. XCMS Online: a web-based platform to process untargeted metabolomic data. Anal Chem. 2012;84:5035–5039. doi: 10.1021/ac300698c. [DOI] [PMC free article] [PubMed] [Google Scholar]
- 30.Saeed AI, et al. TM4: a free, open-source system for microarray data management and analysis. Biotechniques. 2003;34:374–378. doi: 10.2144/03342mt01. [DOI] [PubMed] [Google Scholar]
- 31.Li J, Witten DM, Johnstone IM, Tibshirani R. Normalization, testing, and false discovery rate estimation for RNA-sequencing data. Biostatistics. 2012;13:523–538. doi: 10.1093/biostatistics/kxr031. [DOI] [PMC free article] [PubMed] [Google Scholar]
- 32.R Core Team. R: A language and environment for statistical computing. R Foundation for Statistical Computing; Vienna, Austria: 2018. Available online at https://www.R-projectorg/ [Google Scholar]
- 33.Webb A, et al. A SNP-based consensus genetic map for synteny-based trait targeting in faba beanVicia faba L.) Plant Biotechnol J. 2016;14:177–185. doi: 10.1111/pbi.12371. [DOI] [PMC free article] [PubMed] [Google Scholar]
- 34.Broman KW, Wu H, Sen S, Churchill GA. R/qtl: QTL mapping in experimental crosses. Bioinformatics. 2003;19:889–890. doi: 10.1093/bioinformatics/btg112. [DOI] [PubMed] [Google Scholar]
- 35.Chang W, Jääskeläinen M, Li SP, Schulman AH. BARE retrotransposons are translated and replicated via distinct RNA pools. PLoS One. 2013;8:e72270. doi: 10.1371/journal.pone.0072270. [DOI] [PMC free article] [PubMed] [Google Scholar]
- 36.Weber E, Engler C, Gruetzner R, Werner S, Marillonnet S. A modular cloning system for standardized assembly of multigene constructs. PLoS One. 2011;6:e16765. doi: 10.1371/journal.pone.0016765. [DOI] [PMC free article] [PubMed] [Google Scholar]
- 37.Nadzieja M, Stougaard J, Reid D. A Toolkit for high resolution imaging of cell division and phytohormone signaling in legume roots and root nodules. Front Plant Sci. 2019;10:1000. doi: 10.3389/fpls.2019.01000. [DOI] [PMC free article] [PubMed] [Google Scholar]
- 38.Stougaard J. Agrobacterium rhizogenes as a vector for transforming higher plants. Application in Lotus corniculatus transformation. Methods Mol Biol. 1995;49:49–61. doi: 10.1385/0-89603-321-X:49. [DOI] [PubMed] [Google Scholar]
- 39.Armenteros JJA, et al. Detecting sequence signals in targeting peptides using deep learning. Life science alliance. 2019;2 doi: 10.26508/lsa.201900429. [DOI] [PMC free article] [PubMed] [Google Scholar]
Associated Data
This section collects any data citations, data availability statements, or supplementary materials included in this article.
Supplementary Materials
Transcriptome coding sequences in FASTA format. To open as FASTA file, please change file extension to “.fa”.
Gene expression counts in transcripts per million (TPM).
List of metabolic features, their grouping into clusters, and their abundances across tissue samples.
List of top-20 genes correlated with vicine accumulation levels in all tissues except mid-maturation embryos.
R scripts used to analyze gene-to-metabolite correlations. To open as R file, please change file extension to “.R”.
VC1 and vc1 cDNA sequences and predicted amino acid sequences.
Design of the expression constructs used in the study.
Data Availability Statement
All data is available in the Main Text, Extended Data Figures, Supplementary Information, and Supplementary Data. In addition, the RNAseq reads as well as the final transcript sequences have been uploaded to NCBI under BioProject ID PRJNA725986.
Supplementary Data 5 contains the R scripts used for obtaining gene-to-metabolite correlations.


