Abstract
Actomyosin machinery endows cells with contractility at a single cell level. However, within a monolayer, cells can be contractile or extensile based on the direction of pushing or pulling forces exerted by their neighbours or on the substrate. It has been shown that a monolayer of fibroblasts behaves as a contractile system while epithelial or neural progentior monolayers behave as an extensile system. Through a combination of cell culture experiments and in silico modeling, we reveal the mechanism behind this switch in extensile to contractile as the weakening of intercellular contacts. This switch promotes the buildup of tension at the cell-substrate interface through an increase in actin stress fibers and traction forces. This is accompanied by mechanotransductive changes in vinculin and YAP activation. We further show that contractile and extensile differences in cell activity sort cells in mixtures, uncovering a generic mechanism for pattern formation during cell competition, and morphogenesis.
The ability of cell monolayers to self-organize, migrate and evolve depends crucially on the interplay between cell-matrix and cell-cell interactions [1–4] which controls various phenomena including tissue morphogenesis [5, 6], epithelial-mesenchymal transition [1], wound healing and tumor progression [7]. Cells are active systems, engines that operate away from thermal equilibrium, transducing chemical energy into motion. Single isolated cells generate contractile force dipoles: the resultant of the forces due to actomyosin contraction, pulling on focal adhesion sites on the substrate, is typically a pair of approximately equal and opposite forces acting inwards along the cellular long axis [8]. It is reasonable to expect that contractile particles also generate contractile behaviour in the monolayer [9]. However, at the collective cell level, epithelial monolayers [10, 11] and a monolayer of neural progentior cells display extensile behaviour [12] i.e. the net force from the neighbours and substrate interaction act to elongate the cell further along its long axis. This immediately poses the question of how such a crossover occurs as the emergence of such differences in active behaviour may be crucial in understanding biological processes such as tissue homeostasis, cell competition and self organization [13].
Results
Cell-cell adhesion modifies the active nematic behavour of epithelial cells
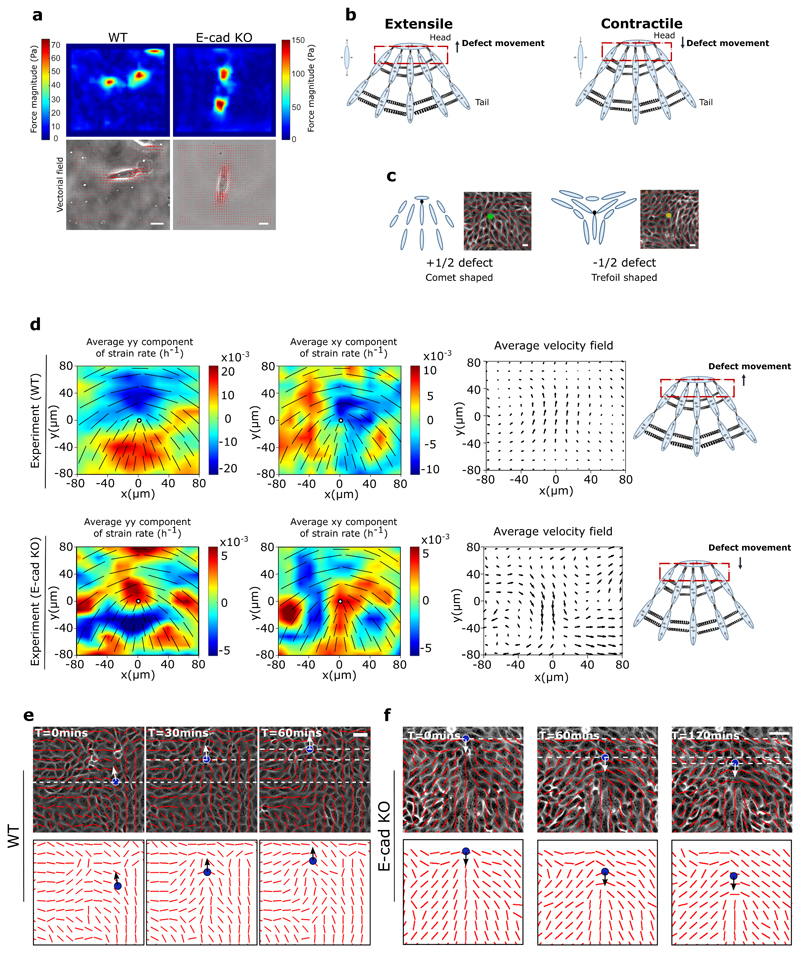
We first analyzed the contractility of single Madin-Darby Canine Kidney (MDCK) cells by determining the traction force patterns (Figure 1a). We confirmed that single epithelial cells exhibited large poles of opposite forces along their long axis. Within cell populations extensility or contractility are based on force balance as shown in Figure 1b and the nature of extensility or contractility can be determined by looking at the structure of flow fields around topological defects. Topological defects are singular points in the orientation field of the cell monolayers, where the orientation of cells were defined as the direction of their long axis (see Methods). Having identified the orientation of cells, we use the winding number parameter to identify the location of topological defects, using an automated defect detection method [10]. In a cellular monolayer two types of topological defects predominate: comet-shaped defects and trefoils (Figure 1c), which correspond to topological defects in nematic liquid crystals with charges + 1/2 and −1/2, respectively [9—12, 14].
Figure 1. Changes from extensile to contractile behaviours in the absence of E-cadherin.
a) Top, left and right: typical examples of traction force magnitude maps for a single MDCK WT and E-cadherin KO cell cultured on deformable PDMS surfaces. Bottom, left and right: vectorial maps of traction forces for a single MDCK WT and E-cadherin KO cell on a soft PDMS substrate. Scale bars, 20μm. b) Schematic showing the defect movement based on force balance for an extensile active nematic system (left) and contractile active nematic system (right) with an inset of forces exerted on neighbours by an extensile (left) and contractile (right) nematic particle. c) Schematic (left) and experimental (right) images of +1/2 defect (left, comet configuration) and -1/2 defect (right, trefoil configuration). Scale bars, 20μm. d) Average yy- and xy components of strain rate map around + 1/2 defect obtained from experiments (left and middle respectively) and corresponding average flow field (right) for MDCK WT cells (top) (n = 1934 defects from 2 independent experiments) and MDCK E-cadherin KO cells (bottom) (n = 1,884 defects from 2 independent experiments). Schematic on the extreme right illustrates the movement of defects. Colour code is positive for stretching and negative for shrinkage. e, f) Experimental data for MDCK WT (e) and MDCK E-cadherin KO (f) monolayers. Top panels: phase contrast images of the cells overlaid with the average local orientation of the cells (red lines). Bottom panels: average local orientation of the cells (red lines). The blue circle shows the location of a +1/2 defect and the corresponding arrow indicates the direction of motion of this defect over time. Dashed lines have been added for better reading of defect movement. Scale bars, 40μm.
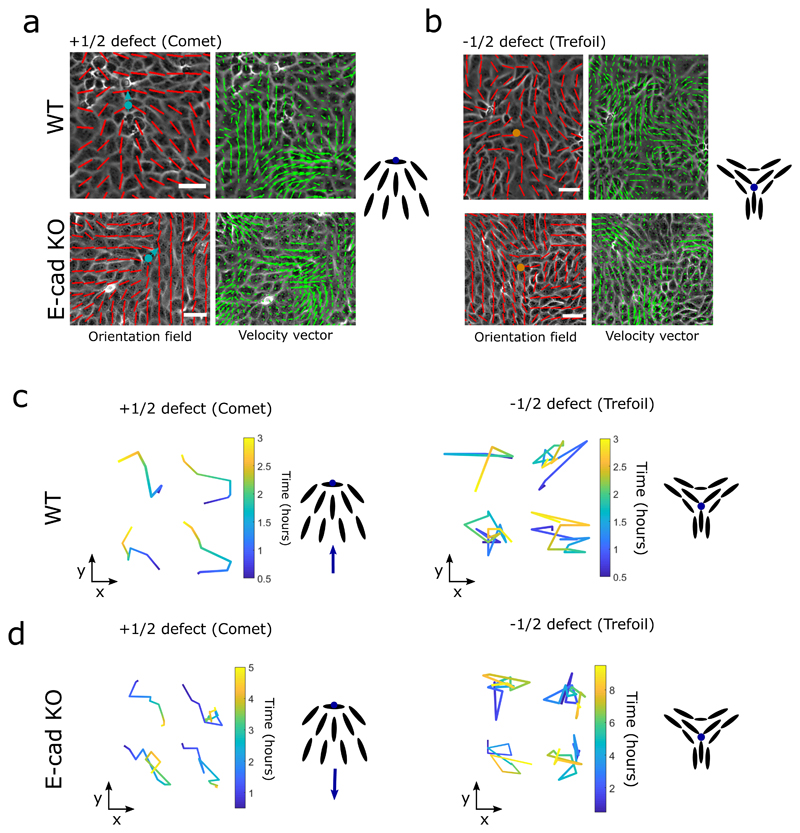
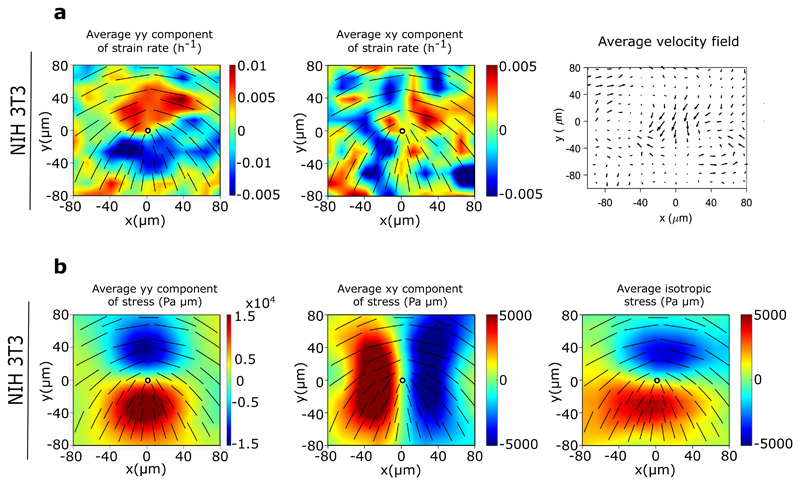
Of relevance here in active systems, the active nature of cells results in a directed motion of the comet shaped defects. For extensile systems, the defects move in the direction of the head of the comet, while topological defects in contractile systems move towards the comet tail (Figure 1b). Thus, we measured the average flow field around the comet defects in MDCK WT monolayers using Particle Image Velocimetry (PIV). The flow and orientation field were obtained from time lapse imaging after the cells reached confluency and before they became isotropic as the monolayers grew too dense. The results show clearly that the comet-shaped defects move in the tail-to-head direction (Figure 1d,e, Extended Figure 1a, c, Video 1), indicating that at a collective level the MDCK monolayer behaves as an extensile active system despite forming contractile dipoles at a single cell level (Figure 1a). The extensile behaviour of comet-shaped defects has been recently reported for Human Bronchial Epithelial Cells (HBEC) as well [11], indicating it to be a property of epithelial monolayers. By contrast, the flow field around comet shaped defects in a monolayer of fibroblasts has an opposite flow direction - from head-to-tail of the comet - indicating that fibroblasts behave as a contractile system at the collective level (Extended Figure 2a), in agreement with previous studies [9]. This difference in the direction of motion of defects is also reflected in the patterns of strain rates around the defects. While strain rate along the tail-to-head direction (yy-strain rates) show negative values at the head of a comet-shaped defect in MDCK WT monolayers indicating the presence of compression (Figure 1d), this is reversed for a monolayer of fibroblasts, where the yy-strain rate at the defect head is positive, indicating extensional deformation (Extended Figure 2a). But what causes epithelial cells to behave as an extensile system at the collective level, and mesenchymal cells as a contractile system, and what are the consequences during tissue organization are not well understood.
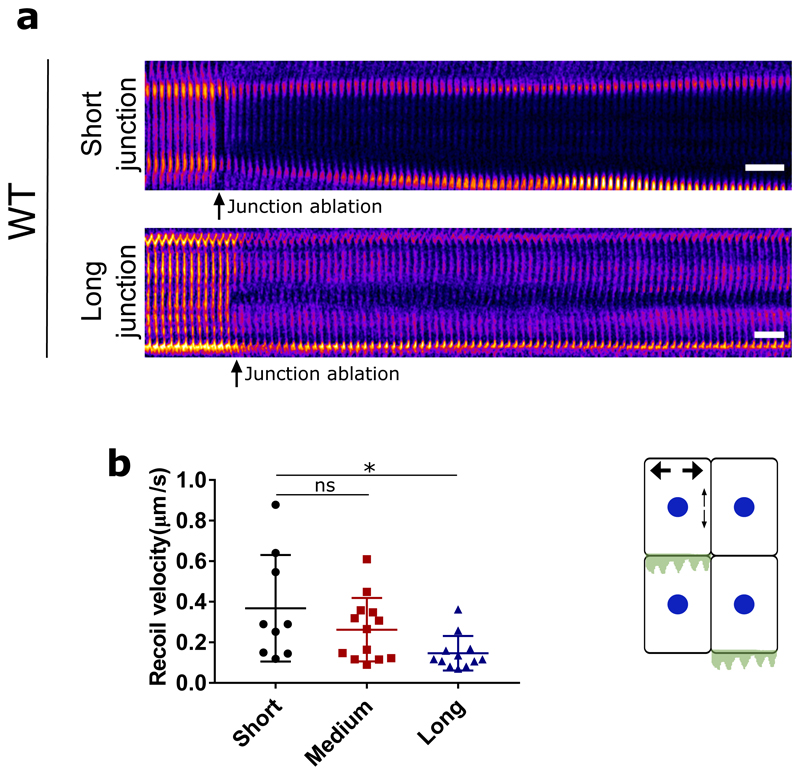
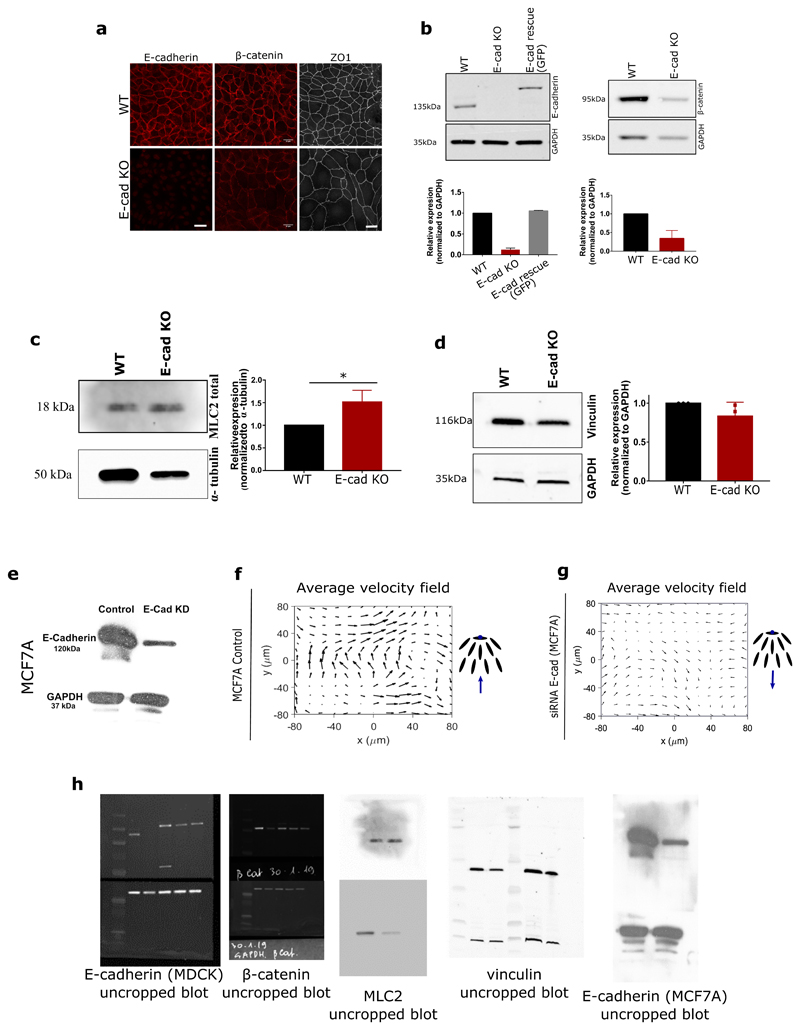
One fundamental difference between epithelial and mesenchymal cells is the ability of epithelial cells to form strong cell-cell adhesions through E-cadherin based junctional complexes, responsible for active intercellular force transmission [15]. In order to discern the origin of extensile behaviour at a collective level, we performed laser ablation experiments on MDCK WT monolayers (Extended Figure 3a,b), where we observed higher recoil at shorter junctions in comparison to long junctions. These results highlight that the smaller cortical tension along long junctions gives rise to a tension distribution that leads to an extensile stress on the cell further elongating it. We therefore asked if weakening this intercellular adhesion in epithelial cells results in a (mesenchymal-like) contractile behaviour at the collective level. To test this, we inactivated the E-cadherin gene in MDCK cells using CRISPR-Cas9 which was validated through immunostaining and western blot analysis (Extended Figure 4a,b,h). MDCK E- cadherin Knock-Out (E-cad KO) cells can still maintain their contacts through another form of cadherin (cadherin 6), albeit with a significantly weaker adhesion strength as observed through the reduced level of β-catenin at adherens junctions (Extended Figure 4a,b,h), while still being able to form tight junctions (Extended Figure 4a). Strikingly, in these E-cad KO monolayers, the average flow field around comet defects switches direction compared to WT monolayers (Figure 1d and e, Extended Figure 1a,d, Video 2), indicating a contractile behaviour at the collective level similar to that of fibroblasts where the comet shaped defects move towards the tail direction (Extended Figure 2). This change in direction of the flow field around the defect was accompanied by changes in the average strain rate patterns which are positive (extensile deformation) around the head of a comet shaped defect in E-cadherin KO monolayers in comparison to WT monolayers where the strain rate is negative (compressive deformation) around the head of the defect (Figure 1d). Therefore, epithelial monolayers behave as an extensile system due to the presence of strong cell-cell adhesions and loosening this adhesion by removing E-cadherin results in a contractile behaviour.
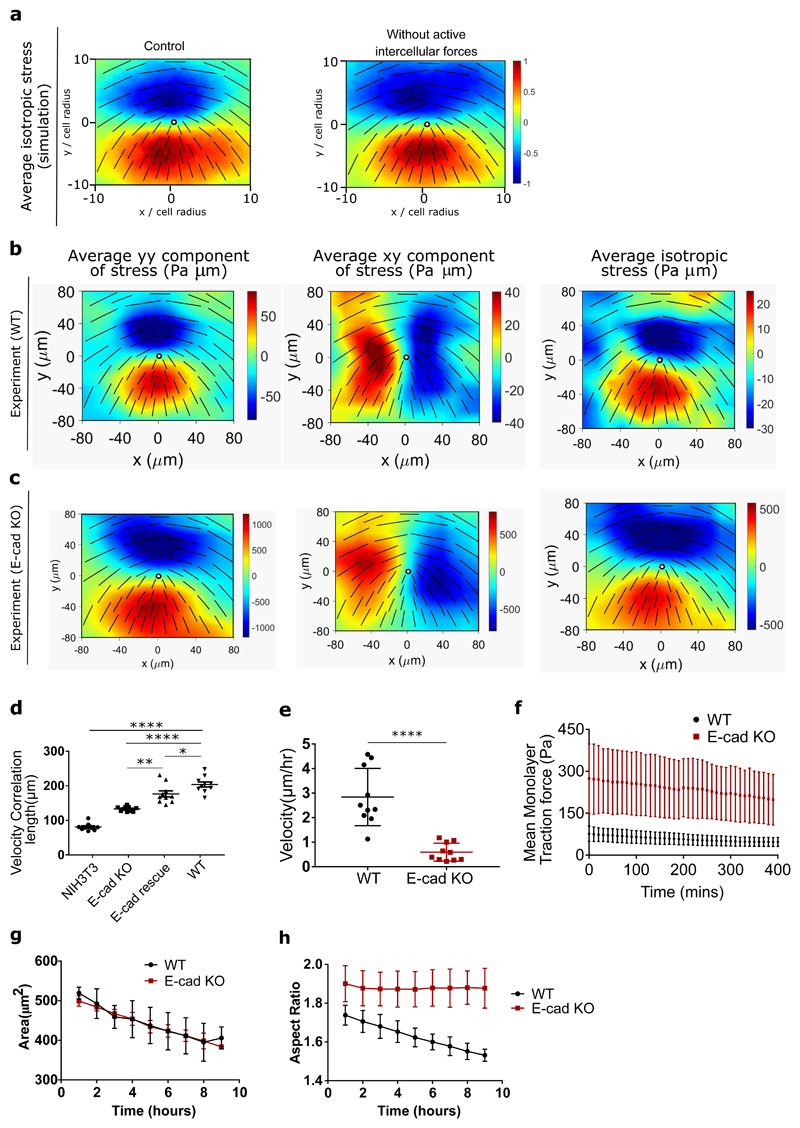
Figure 3. Knocking out E-cadherin increases cell-substrate interactions.
a) Average isotropic stress around a +1/2 defect obtained from simulations for the control condition (left) and condition without intercellular forces (right) (n = 2,083 defects). b,c) Average yy (left)-, xy (middle)- and isotropic (right) components of stress around a + 1/2 defect obtained from experiments for (b) MDCK WT (n = 1,899 defects) and (c) E-cadherin KO (n = 1,428 defects) from 2 independent experiments. For a and b colour code represents the strength of the stress with positive for tensile state, negative for compression. d, e, f) velocity correlation length (d) (n=10), velocity (e) (n=10) and mean traction force (f) (n=12) of cells within a monolayer for both MDCK WT and MDCK E-cadherin KO cells. g, h) Cell spreading area (g) and aspect ratio (h) of cells within the monolayer obtained from n=10 different images for MDCK WT and E-cadherin KO cells as a function of time from 2 independent experiments. The error bars represent the standard deviation. Unpaired t-test was performed resulting in *p<0.05, **p<0.01, ***p<0.001 and ****p<0.0001.
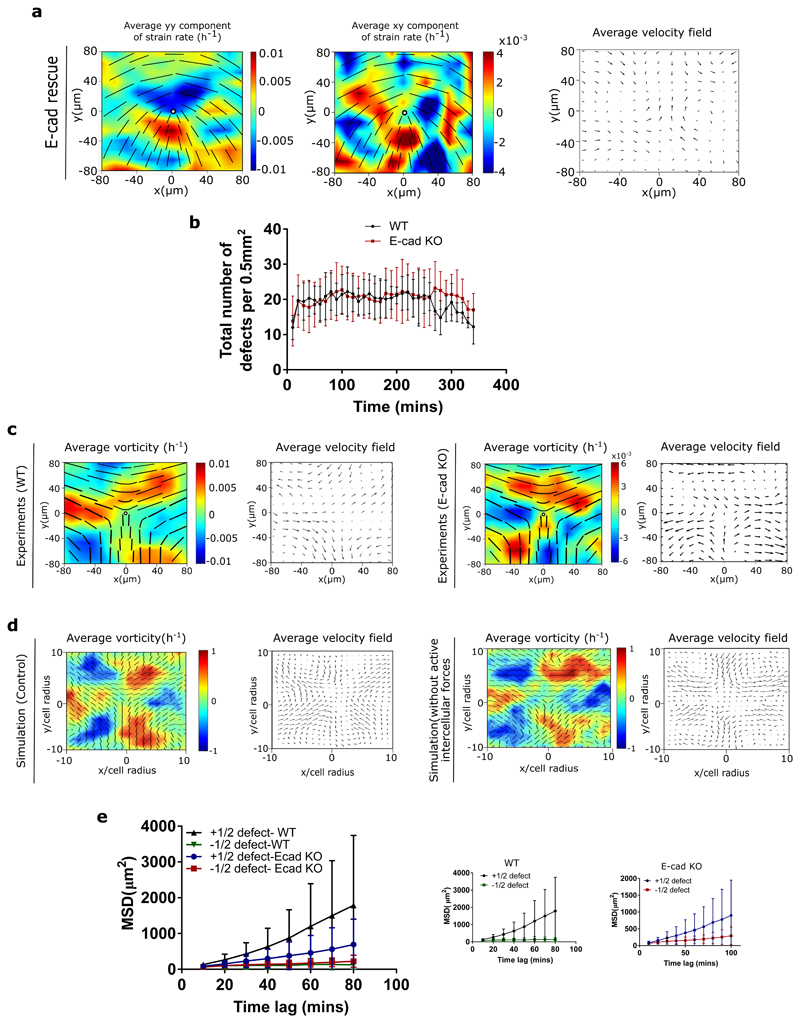
In order to check that this switch from extensile to contractile behaviour is not only specific to MDCK cells, we further validated the results by perturbing cell-cell contacts in the human breast cancer cell line MCF7, where depleting E-cadherin by RNAi (Extended Figure 4e) changed the behaviour from an extensile to a contractile system (Extended Figure 4f,g). We then validated that this switch was not a clonal effect by re-expressing E-cadherin which restored collective extensile behaviour to MDCK E-cad KO cells (Extended Figure 5a). Moreover, the total defect density within the monolayer of MDCK WT and MDCK E-cad KO cells did not reveal changes in the density of defects between WT and E-cad KO monolayers (Extended Figure 5b) indicating that the average distance between the defects and defect-defect interactions are not affected by E-cadherin removal. Furthermore, measuring average flows around −1/2 (trefoil) defects did not show any significant difference between WT and E-cad KO monolayers (Extended Figure 2b, and 5c). This is consistent with both simulations (Extended Figure 5d) and theories of active nematics [16, 17], which show that difference in activity affects the self-propulsion of +1/2 defects, while not altering the velocity field of −1/2 defects. Indeed, comparing the Mean-Square-Displacement (MSD) from defect trajectories in WT and E-cad KO monolayers clearly indicates that while +1/2 defects have propulsive behaviour and move faster in WT monolayers, the motion of −1/2 defects is diffusive in both conditions (Extended Figure 5e).
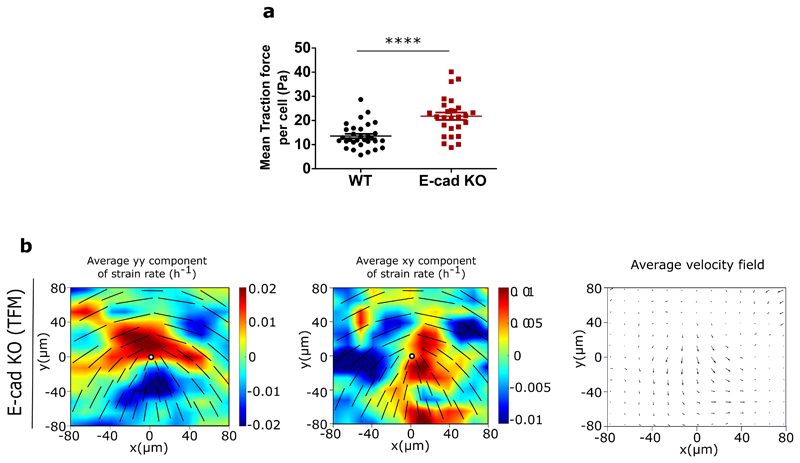
We next checked whether the extensile to contractile crossover could be the impact of a change in the behaviour of individual cells. However, based on our traction force data, both single isolated WT and single isolated E-cad KO cells showed contractile behaviour with the forces directed inwards along their elongation axes as cells pulled on the substrate (Figure 1a). This indicates that removing E-cadherin does not change the contractile pattern (intracellular stress) of single cells (Extended Figure 6a). Therefore, the change from contractile to extensile behaviour at the collective level can be linked to the presence of E-cadherin which mediates force transmission between neighbouring cells through intercellular interactions.
The balance of inter and intracellular stresses triggers extensile and contractile behaviours
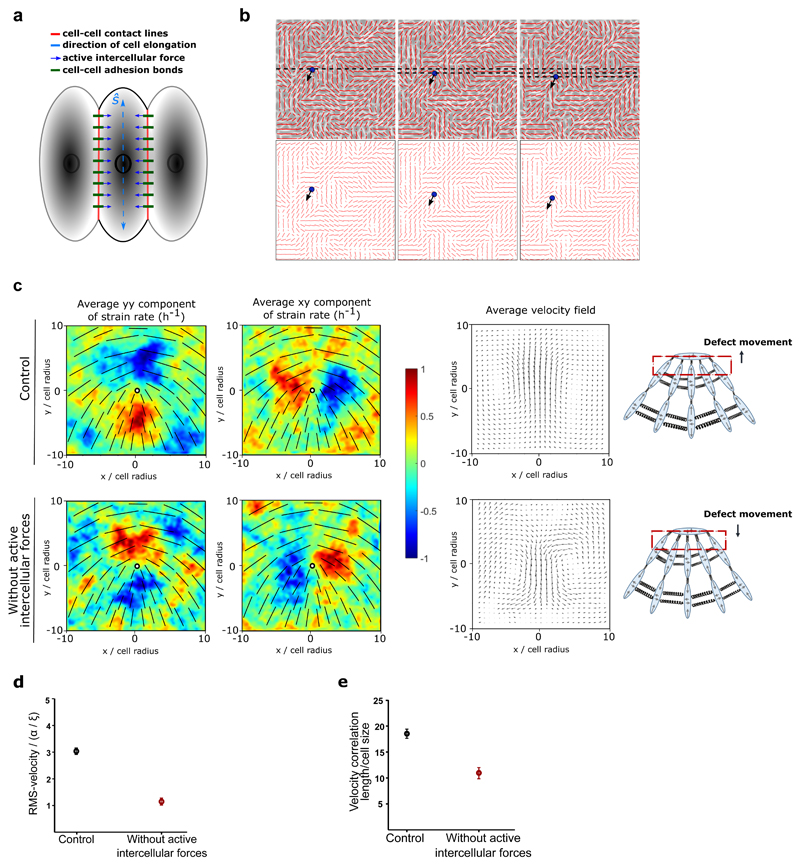
In order to better discern the competition between intracellular contractile stresses (generated by the actomyosin machinery throughout the cell) and the intercellular stresses (due to neighbour interactions), we varied these two stresses independently using a cell-based model. The model is based on a phase-field formulation [18] that captures the deformation of individual cells, and has recently been shown to reproduce the formation of topological defects in MDCK monolayers, along with their associated flow field and stress patterns [19]. In a similar manner as in the experimental analysis, where the orientation of cells were identified through their long axis, in the model a shape tensor, S, characterizes the magnitude and direction of cell elongation (Figure 2a). This parameter continuously evolves with the deformation of cells as they push/pull on their neighbours within the monolayer. Following our recent work [19], intercellular stresses are defined to be proportional to the shape tensor which allows us to model extensile stresses at the cell-cell contacts (Figure 2a). This form of modeling was inspired by previous studies on adherens junctions and actomyosin interaction which showed that force transduction at the junction can modify the actomyosin network and in turn the cell shape [20] and was experimentally validated on MDCK WT monolayers through laser ablation experiments where shorter junctions were under higher tension (higher recoil velocity) in comparison to longer junctions which were under lower tension (lower recoil velocity) (Extended Figure 3a,b). In addition, an intracellular stress is defined to mimic internal stresses generated by acto-myosin complexes within the individual cells (see Methods for the details of the model). The effect of E-cadherin removal is thus captured in the model by tuning down the intercellular stresses. Just as in the experiments both comet-shaped and trefoil topological defects (+1/2 and −1/2 charges, respectively) are found in the orientation field of the monolayer (Figure 2b) and the average flow fields and strain rate maps around comet shaped defects match those measured for the WT cells (Figure 2c). More importantly, we found that lowering intercellular stresses switched flow direction around comet-shaped topological defects and strain rates in agreement with experimental results of E-cad KO (Figure 2b and c). Quantitative analysis of the simulations showed that reducing the intercellular stresses results in slower dynamics characterized by a smaller root mean square (rms)-velocity (Figure 2d) and generates less correlated patterns of motion characterized by a smaller velocity correlation length (Figure 2e). Moreover, due to the dipolar symmetry of intercellular stresses in the model, simulation results predict that the switch from extensile to contractile behaviour does not alter the isotropic stress patterns, i.e., tension (positive isotropic stress) and compression (negative isotropic stress) around the defects (Figure 3a), when intercellular stresses are reduced.
Figure 2. Inter and intracellular stresses dictate extensile and contractile behaviours.
a) Schematic illustrating the model used in numerical simulations which incorporates cell-cell interaction through active intercellular forces. The direction of cell elongation is denoted by the headless vector ŝ, which is found from the eigenvector corresponding to the largest eigenvalue of the shape tensor 𝐬 for each cell. b) Numerical simulations for the case without active intercellular stresses, showing: (top), phase contrast images of the cells overlaid with the average local orientation of the cells (red lines) and (bottom), average local orientation of the cells (red lines). The blue circle shows the location of a +1/2 defect and the corresponding arrow indicates the direction of motion of this defect over time. c) Average yy- and xy-components of strain rate map around +1/2 defect obtained from simulations (left and middle respectively) and corresponding average velocity flow field (right: n = 2,083 defects) for the control condition (top) and the condition without active intercellular forces. Colour code is positive for stretching and negative for shrinkage. d) RMS velocity, and e) the velocity correlation length in the monolayer normalized to the individual cell size obtained from n=30 different simulations for the control condition and the condition without active intercellular forces.
To test the predictions of the model we first experimentally studied the effect of E-cad KO on the stress patterns around topological defects and collective motion of cells. Using traction force microscopy, we obtain traction forces in the monolayer, from which we infer the associated stress patterns using Bayesian Inversion Stress Microscopy (BISM) [21]. Using a similar approach as strain rate measurements around defects, we were able to compute the average stress fields around comet shaped defects. Our experiments agreed with the simulations in showing no difference in the average isotropic stress patterns around comet shaped defects between the WT (Figure 3b) and E-cad KO monolayers (Figure 3c), while they still show a difference in their flow field (Extended Figure 6b) [10], indicating that the tension and compression around defects are primarily controlled by local cellular organization and elongation, and not the flow field around them. Moreover, measuring the velocity correlation function [22], we found it to be consistent with the numerical predictions whereby removing E-cadherin reduces the correlation length compared to the WT monolayers (Figure 3d). This is also in agreement with previous reports which demonstrate a reduction in velocity correlation length of mesenchymal cells with respect to epithelial cells [22]. Interestingly, by performing rescue experiments to put E-cadherin back, we found an increase in velocity correlation length (Figure 3d) which was very close to that of WT monolayers. This indicates that the perturbation of junctional protein E-cadherin can be used as an effective way of tuning the collective contractility and extensility of the epithelial monolayer.
Comparing the average velocities in the monolayers with and without E-cadherin also agreed with the model’s prediction that the velocity of the monolayer is reduced upon E-cadherin depletion (Figure 3e) at similar density. Interestingly, traction force microscopy measurements revealed that this reduction in velocity is accompanied by a significant (about three fold) increase in the average traction forces that E-cad KO monolayers exert on their underlying substrate in comparison to WT monolayers (Figure 3f). Furthermore, we compared average cell areas within the monolayer for both WT and E-cad KO monolayers and did not notice an appreciable difference in spreading area, although for both WT and E-cad KO monolayers the average cell spreading area reduced over time (Figure 3g). In contrast, the aspect ratio of cells within the WT monolayers reduced over time while the aspect ratio of cells within E-cad KO monolayers did not change over time (Figure 3g). These measurements of velocity reduction, traction force increase, and changes in aspect ratio in the monolayers without E-cadherin, combined together, hinted that the cell-substrate interaction increased as the cell-cell interaction was weakened, indicating a possible cross-talk between intracellular and intercellular interactions as reported previously [23, 24].
E-cadherin removal triggers mechanotransductive changes within the monolayer
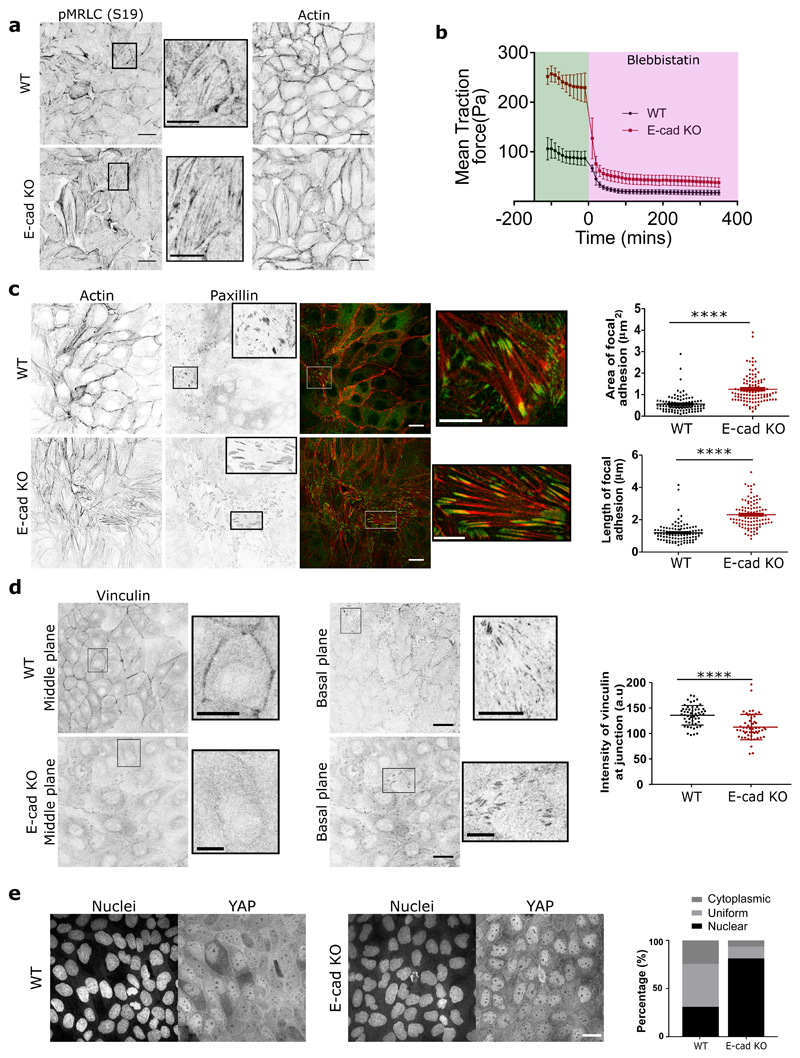
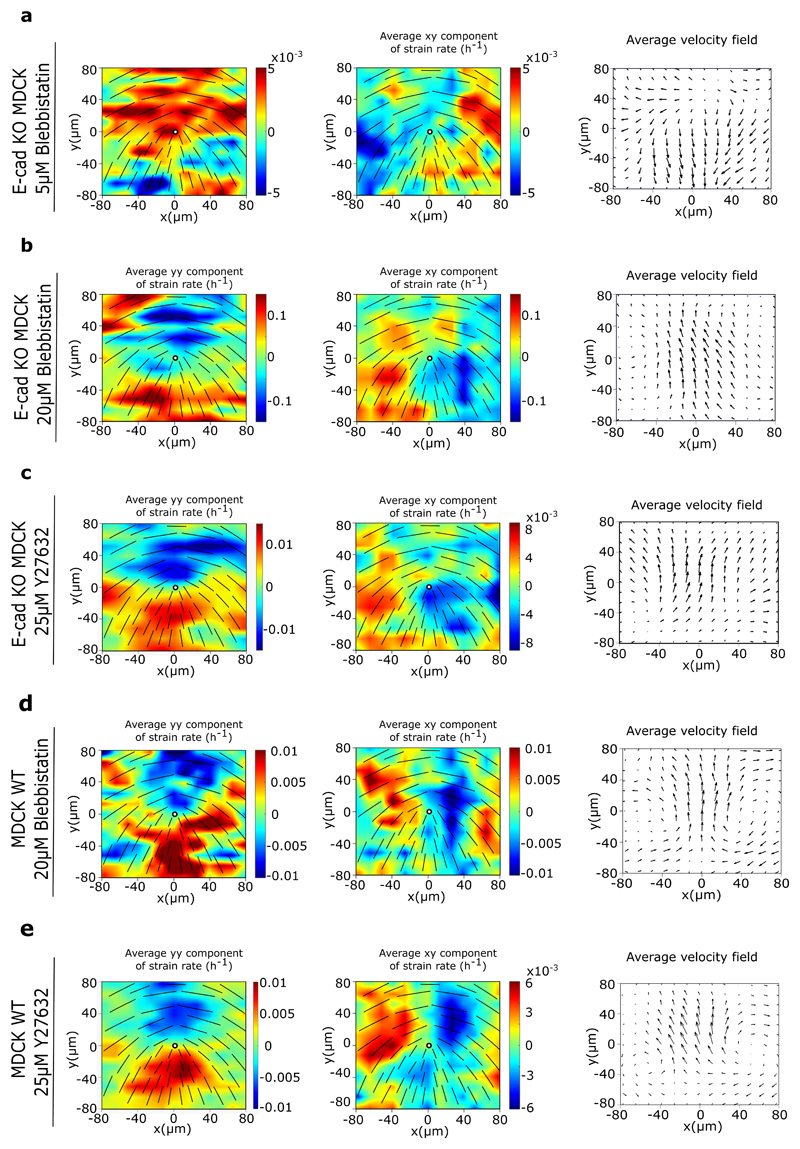
To test our initial results, and previous studies that showed changes in cellular response to substrate adhesions upon reduced cell-cell interactions [25, 26], we asked if the increase in the average traction force of E-cad KO monolayers was a result of changes in their mechanotrans-ductory response. Using actin staining we first checked for changes in the organization of stress fibers in the cells within a monolayer, as stress fiber formation is an important determinant of force generation by cells on a substrate [27, 28]. Indeed, comparing actin staining of WT and E-cad KO monolayers, we found a considerable increase in stress fibers in the absence of E-cadherin (Figure 4a). Concomitantly, immunostaining of WT and E-cad KO monolayers showed an increase in the number of phosphomyosin light chain (pMLC2) fibers (Figure 4a) generated at the basal surface within E-cad KO cells. Western blot analyses further revealed an increase in the total level of myosin light chains (MLC2) (Extended Figure 4c,h). Considering these results we reasoned that inhibiting cell contractility in E-cad KO cells may alter their active behaviour. Upon treatment with a mild dose of blebbistatin (5 μM), an inhibitor of Myosin II (Extended Figure 7a) E-cad KO monolayers still behave as a contractile system. However, a higher dose (20 μM) of blebbistatin (Extended Figure 7b) or 25 μM of Y27632, an inhibitor of ROCK 1 and 2 (Extended Figure 7c), resulted in a switch in behaviour from a contractile to that of an extensile system as summarized in Supplementary Table 1. As control, we showed that similar treatments did not affect the extensile behaviour of the WT monolayers (Supplementary Table 1, Extended Figure 7d and e). We then measured the traction forces exerted by cells when treated with 20 μM blebbistatin. As reported previously [29], treatment of both WT and E-cad KO monolayers with 20 μM of blebbistatin results in a drastic reduction of traction forces (Figure 4b). This reinforces the importance of cell substrate interaction in dictating the contractile behaviour of E-cad KO monolayers. Thus, removing E-cadherin not only reduces the extensile intercellular stresses, it also increases the intrinsic contractility (intracellular stress) generated by cells at the cell-substrate interface.
Figure 4. E-cadherin removal triggers mechanotransductive changes within the monolayer.
a) pMRLC (left), zoom of pMRLC (middle), actin (right) staining of MDCK WT (top) and E-cadherin KO (bottom) monolayers. b) Evolution of mean traction force of MDCK WT and E-cadherin KO monolayers before and after 20μM blebbistatin treatment (n=10 from 2 independent experiments). c, d, e) actin (red) and paxillin (green) (c), vinculin (d), YAP (green), and nucleus (blue) (e), staining within a monolayer for both MDCK WT and E-cadherin KO cells. c) Area of focal adhesion (left) and length of focal adhesion within the monolayer for n=106 focal adhesions. d) Mean intensity of vinculin at the cell-cell junction in the middle plane (n=54). e) Distribution of YAP in nucleus, cytoplasm, or uniform distribution calculated for n=1162 cells (MDCK WT) and n=1008 cells (MDCK E-cadherin KO). Error bars represent the standard deviation. Unpaired t-test was performed leading to *p<0.05, **p<0.01, ***p<0.001 and ****p<0.0001. Scale bars, 20μm and 10μm for the figure zooms.
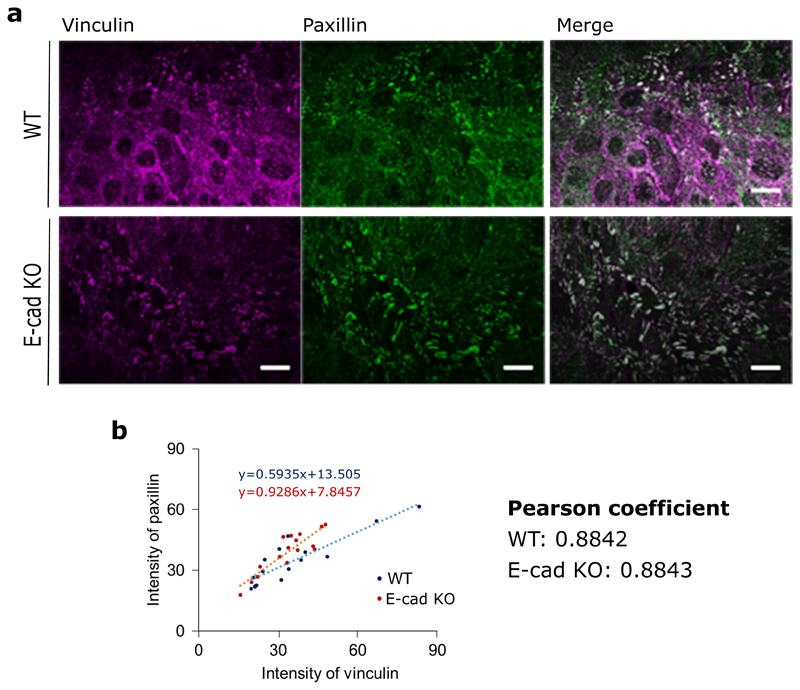
Since focal adhesions (FAs) are known to be mechanosensors at cell-matrix interface [30], we then investigated the assembly of FAs in E-cad KO and WT monolayers. By using paxillin staining to determine changes in FAs, we showed a marked increase both in length, and area within the cells (Figure 4c) in the E-cad KO monolayers in comparison to the WT monolayers. More importantly, we found that the E-cad KO modified the subcellular localization of vinculin, a protein which is known to respond and transmit force from both integrin and cadherin based adhesion complexes [31, 32]. While the total level of vinculin remained unchanged in both WT and E-cad KO monolayers (Extended Figure 4d,h), the localization of vinculin was altered, whereby vinculin was mostly present at the cell-cell junctions in WT monolayers, but basally located in E-cad KO monolayers (Figure 4d). We further verified if all paxillin positive FAs were vinculin positive in both WT and E-cad KO monolayers and observed a strong correlation between them (Pearson’s coefficient of 0.8842 and 0.8843 for WT and E-cad KO) as shown in Extended Figure 8, reiterating our observed increase in cell-substrate interaction in the absence of E-cadherin.
Since Yes-associated protein (YAP) transcriptional activity is also known to modify cell mechanics, force development and FA strength [33], we investigated the localization of YAP within E-cad KO monolayers. Interestingly, we found that YAP was predominantly localized to the nucleus in E-cadherin KO monolayers (Figure 4e), which corresponds to the active state of YAP. This is in agreement with previous studies that reported an activation of YAP through nuclear accumulation in the absence of E-cadherin or in well spread cells [34, 35]. Taken together, our results show that removing E-cadherin enhances the formation of stress fibers, promotes YAP activation, alters viculin localization, and leads to a marked increase in the formation of FAs and their linkage to the substrate, in turn triggering a contractile behaviour.
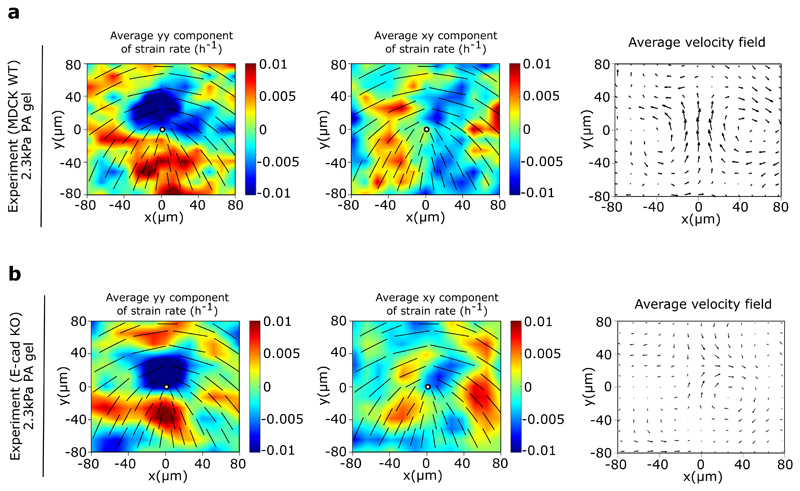
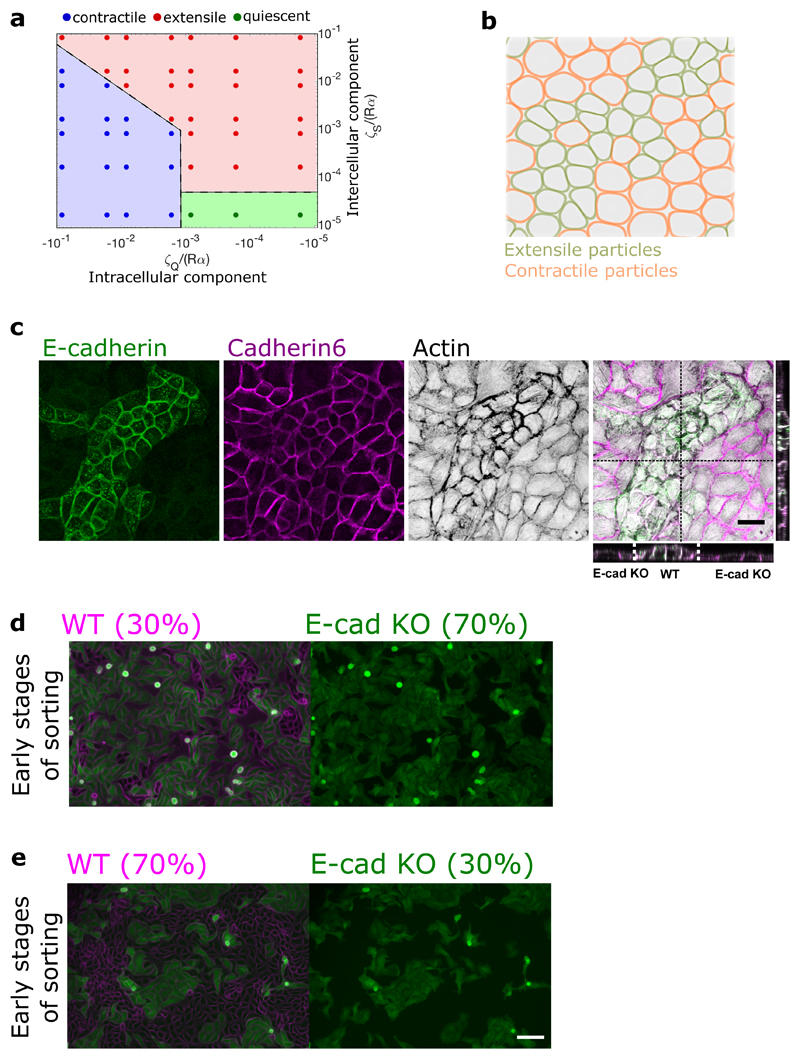
Our force measurements together with acto-myosin activity and adhesion patterns establish that the extensile or contractile nature of epithelial cells at a collective level relies on the interplay between active stresses at cell-cell and cell-matrix interfaces. To further explore this crossover we plated cells on a soft (2.3 kPa) polyacrylamide (PA) gels, recalling that cellular responses on soft substrates leads to lower contractility and less stable focal adhesions [36]. MDCK WT monolayers remained extensile regardless of substrate stiffness (Extended Figure 9a), while E-cad KO cells switched from contractile to extensile behaviour on a soft substrate (around 2.3 kPa) (Extended Figure 9b). Taken together, these experiments show that tuning cell-cell and cell-substrate adhesion can result in a switch between extensile and contractile behaviour of cell monolayers further validating our observation that blebbistatin treatment drastically reduced traction forces (Figure 4d) and switched the behaviour of E-cad KO monolayers from contractile to extensile. It is possible in the simulations to further explore this crossover by continuously varying the strength of intra- and inter-cellular stresses, independently. The results are summarized in a stablity-phase diagram that classifies the monolayer behaviour as extensile or contractile based on the direction of the defect motion (Extended Figure 10a). The non-symmetric structure of the stability-diagram further highlights the different impacts of intra- and inter-cellular stresses on the direction of defect motion. In our simulations, while intracellular stresses act within single cells and are along the direction of cell polarity, the intercellular stresses arise in between neighboring cells and are proportional to the cell deformation. As such, intercellular stresses can reinforce themselves: small cell deformations lead to intercellular stresses that further enhance cell deformation, generating stronger intercellular stresses. We conjecture that this bootstrap mechanism results in intercellular stresses to more strongly affect the collective behavior of the monolayer compared to their intracellular counterparts.
Cell sorting triggered by change in nematic behaviour of monolayers
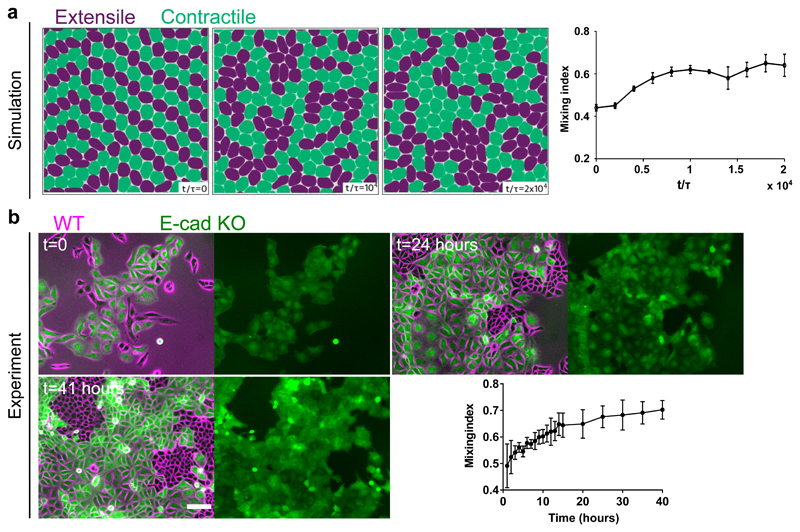
Based on this difference in contractile and extensile behaviour we then used the model to simulate the interaction between the extensile and contractile systems. The results showed that cells are able to separate out into two different phases over time when mixed at 50-50 ratio (Figure 5a and Extended Figure 10b, Video 3), where extensile cells are surrounded by contractile ones. We were able to replicate this experimentally (Figure 5b and Extended Figure 10c, Video 4) whereby WT and E-cad KO cells separate out into two different phases with WT (extensile) cells surrounded by E-cad KO (contractile) cells when plated at a 50-50 ratio (Figure 5a). While thermodynamic mechanisms such as differential adhesion and difference in line tension between two cell types have been shown to govern phase separation in 3D cell aggregates [37—39], active cell sorting in monolayers with strong substrate adhesion, has not been directly observed to the best of our knowledge. We, therefore, sought to further explore the possible distinctions between the cell sorting, as observed here, and the well-established differential adhesion and differential line tension hypotheses. To this end, we first quantified the degree of phase separation by measuring the mixing-index of a mixture of WT and E-cad KO cells defined as the number of homotypic neighbours over the total number of cells [40, 41]. In the segregation mechanism based on differential line tension this mixing-index grows with a power-law exponent with time and approaches one [41]. However, as evident from both experiments and simulations, the mixing-index in our system saturates and complete phase separation is never obtained (Figure 5a and b). We conjecture that this is partly because of strong cellsubstrate adhesion that dominates over any possible difference in line tensions and also due to a fundamental difference between activity-driven phase separation and thermodynamic mechanisms. In addition, phase separation based on differential line tension posits that – independent of the asymmetry of the binary mixture - the phase with higher line tension always forms aggregates that are enveloped by the cells with lower line tension to minimize the free energy of the mixture [37, 39].
Figure 5. Cell sorting triggered by change in nematic behaviour of monolayers.
a,b) Time lapse sorting of extensile and contractile cells observed over time represented by mixing index in simulations (a) and experiments (b) of MDCK WT (magenta) and E-cadherin KO cells tagged with LifeAct GFP (green). In (a) ζs/Rα = 0.042, ζQ/Rα = -0.062 for the extensile cells and ζs/Rα = 0.0, ζQ/Rα = -0.062 for the contractile cells. Mixing index was obtained from two independent simulations and the error bars mark the standard deviation. Mixing index in experiments (b) was obtained from n=5 different clusters from 2 independent samples. Error bars represent the standard deviation. Scale bars: 100μm.
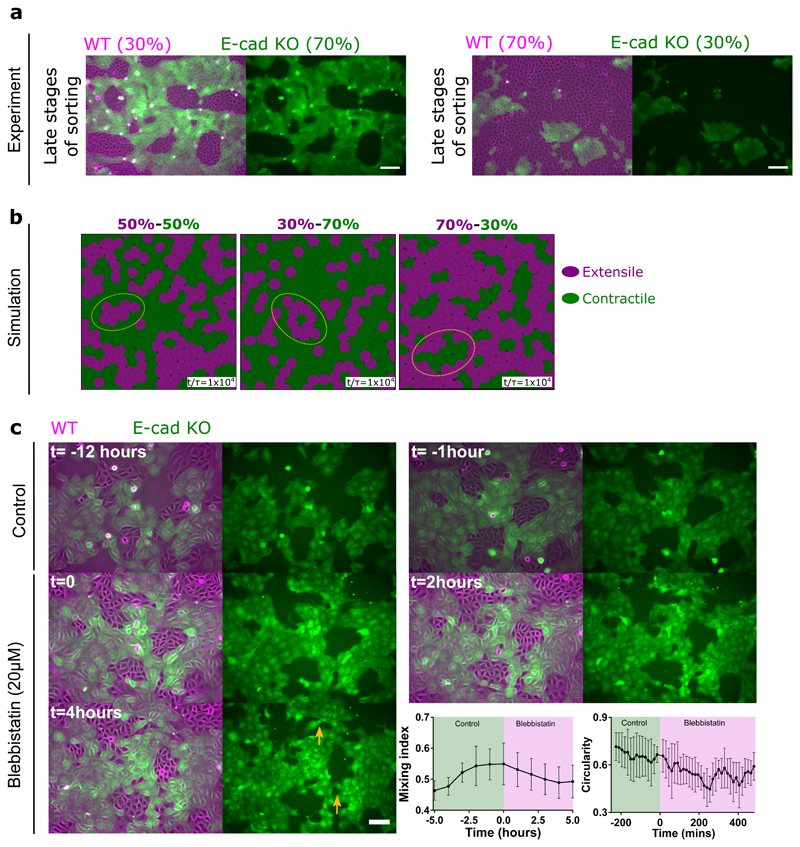
To test this, we performed mixing experiments by varying the percentage of WT versus Ecad KO cells, (30/70 and 70/30, respectively; Figure 6a and Extended Figure 10d,e). In the latter case, we could even observe E-cad KO colonies surrounded by WT cells which could not be simply explained by the differential adhesion hypothesis and was not observed in previous adhesion based studies governed by cortical/line tension [37, 39–43]. We were able to replicate this in our simulations (Figure 6b). Moreover, to further test the unmixing phase we thought to probe the unmixing of two cell types with and without E-cadherin, but both showing extensile behaviour. Since 20 μM blebbistatin was shown to reverse the contractile behaviour of Ecad KO monolayers from contractile to extensile (Supplementary Table 1 and Extended Figure 7), we treated a mixture of WT and E-cad KO plated at 50/50 ratio with blebbistatin after unmixing. Upon blebbistatin treatment, we saw a drop in the mixing index (Figure 6c, Video 5). In addition, the clear boundaries formed in an untreated sample were lost, characterized by the loss of circularity of WT colonies upon blebbistatin treatment (Figure 6c).
Figure 6. Cell sorting is governed by activity of the system.
a) Demixing of MDCK WT and E-cadherin KO at different starting densities, WT (30%) and E-cadherin KO (70%) (left) and WT (70%) and E-cadherin KO (30%) (right). b) Demixing of extensile and contractile particles obtained from simulations at different starting densities. Extensile and contractile particles are mixed at 50-50 (left), 30-70 (middle) and 70-30 (right) respectively. In (b) ζs/Rα = 0.016, ζQ/Rα = -0.016 for the extensile cells and ζs/Rα = 0.0, ζQ/Rα = -0.016 for the contractile cells. c) Demixing phase observed before and after the addition of 20μM blebbistatin characterized by mixing index (left) (n=5) and circularity of several colonies (right) (n=5). Error bars represent the standard deviation. Scale bars: 100μm.
Taken together, these results reinforce the fundamental distinctions between phase separation in systems with differences in activity in comparison to well-established differential line tension or differential adhesion mechanisms. Even though tissue segregation was first exemplified based on differences in cadherin-mediated surface tension [37, 38, 42], it was later shown that intercellular adhesion is not the only mechanism that triggers cell sorting [44]. Theoretical predictions have suggested that cell sorting could be driven by a combination of cell surface tension and contractility [39, 40]. While, we cannot completely rule out the contribution of differential adhesion or differential line tension towards the sorting between WT and E-cad KO cells, our results clearly demonstrate the importance of cell-substrate interaction and intracellular stresses as key regulators of cell sorting in cellular monolayers with strong adhesion to substrate.
Discussion
The results presented in this work show that epithelial cells are able to maintain their collective behaviour through a coordination of intercellular and intracellular stresses. Intercellular stresses are mediated through adherens junctions, while intracellular stresses could be mediated through changes in substrate interaction and actomyosin machinery. Using a combination of in-silico modelling and extensive experimental studies we have shown that perturbation of E-cadherin in MDCK cells increases their substrate interaction in addition to changing their active nematic behaviour from extensile (WT) to contractile (E-cad KO) similar to a monolayer of fibroblast which behaves as a contractile unit. Our experimental results also show that perturbation of adherens junctions are accompanied by molecular level changes, including reduced levels of vinculin at cell-cell contacts, together with an increase in focal adhesion size and area in the absence of E-cadherin, and increase in the number of actin stress fibers on the basal layer. Using our numerical model we were able to study how varying inter and intracellular stresses impacts the active behaviour of cells. In addition, mixing the two different systems revealed that these differences in active behaviour were sufficient to drive sorting of these domains into an unmixed phase over time. Comparing our observations of sorting with previously observed studies and hypothesis [37–39] highlights fundamental distinctions that arise due to the difference in the nature of active forces. These observations bring in a new understanding to the existing models of differential adhesion. Having understood the role of extensility and contractility in dictating demixing (sorting) of cells, this approach could be expanded to studying other biological processes such as tissue growth, development and tissue homeostasis. For instance, recent studies demonstrated the importance of nematic organization of actin cytoskeleton in Hydra during morphogenesis [45], while other studies have begun to explore the role of liquid-crystal ordering during morphogenesis [46] and in — vivo epithelial tissue patterning [47]. These findings highlight the importance of active nematic behaviours at a collective level to understand tissue shape and organization, factors central to morphogenesis [45, 46, 48–50]. As such, the adaptation of cellular systems from extensile to contractile behaviours might be a crucial mechanism by which a collective living system undergoes morphological changes (sorting or tissue organization) based on a transition from a cohesive to a less coordinated organization. Such a transition relying on the cross-talk between cell-cell and cell-matrix interactions may provide a new mechanism to understand cell migration during development, wound healing, and collective cancer cell invasion.
Methods
Cell culture and reagents
MDCK WT (ATCC CCL-34) cells, MCF7 cells (ATCC HTB-22), MDCK E-cadherin Knock-Out (KO) cells and shMCF7 E-cadherin KD cells were cultured in DMEM (containing Glutamax, High Glucose, and Pyruvate, Life Technologies) supplemented with 10% foetal bovine serum (Life Technologies) and 1% penicillin-streptomycin (Life Technologies) at 37°C with 5% CO2. For cell migration experiments, cells were left to spread overnight before imaging so that the cells form a complete monolayer. Prior to imaging, normal culture media (DMEM) was changed to low glucose DMEM (containing Pyruvate, Life Technologies) in order to minimize cell division as cell divisions were known to generate extensile flow [51]. In our coculture mixing experiments, in order to ensure we have a mixed population at the start of imaigng, cells were plated with low Ca2+ media (no FBS) for 3 hours, and changed to normal media once the cells attach. For immunofluorescent stainings, cells were fixed with 4% paraformaldehyde (PFA), permeabilized with 0.5% Triton-X 100 for 5 minutes, blocked with 1% BSA/PBS for 1 hour, and incubated with primary antibody overnight at 4°C. The samples were then incubated with secondary antibody and Hoescht (Thermo Fisher)(1:10000) for 1 hour and mounted on Mowiol 4-88 (Sigma Aldrich C2081) before imaging. The primary antibodies used were directed against E-cadherin (24E10-Cell Signaling Technology; DECMA1-Sigma Aldrich) (1:100), cadherin 6(1:50) [52], paxillin (Y133-Abcam) (1:100), pMLC2 (Cell Signaling) (1:100), vinculin (kindly provided by Marina Glukhova) (1:2) [53], α-catenin (Sigma Aldrich)(1:100), β-catenin (BD Biosciences) (1:100), ZO1 (a generous gift from Sylvie Robin) (1:50), YAP (Santa Cruz Biotechnology) (1:100). Anti-mouse, anti-rat, and anti-rabbit secondary antibodies conjugated with Alexa (488 or 568)(used at 1:200 dilution), Alexa 647 (1:50) conjugated phalloidin were purchased from Life Technologies. A slightly different fixation protocol was used to stain vinculin at the cell-cell junction and focal adhesion sites. In order to label vinculin at cell-cell contact sites, cells were fixed with a mix of 4% PFA and 0.5% Triton-X 100 for 1 minute 30 seconds, followed by fixation with 4% PFA for 10 minutes. While staining for vinculin at focal adhesion sites, cells were fixed with 4% PFA for 10 minutes, followed by premeabilization with 0.5% Triton-X 100 for 10minutes. For experiments requiring inhibition of contractility blebbistatin 5 μM, 20 μM (Sigma Aldrich) or Y27632 25 μM (Sigma Aldrich) were added just before imaging.
Generation of E-cadherin KO cell line
MDCK E-cadherin KO stable cells were generated using a CRISPR-Cas9 double nickase plasmid (Santa Cruz Biotechnology). The following gRNA sequences were used: TGATGACACCCGATTCAAAG and ATAGGCTGTCCTAG-GTAGAC. Around 2 million cells were electroporated (Neon Transfection System Invitrogen) with 3μg of plasmid in one pulse of 20 ms and at 1650V. Twenty four hours later, cells were selected by adding 2.5 μg/ml puromycin in the culture media. Fourty eight hours later, GFP positive single cells were sorted in 96 well plates by flow cytometry using Influx 500 sorteranalyzer (BD BioSciences). The clonal populations were then selected based on the absence of E-cadherin by immunofluorescence staining. The absence of E-cadherin in the clones generated was confirmed by Western blot analysis of protein extracts (Extended Figure 2b).
Generation of siRNA E-cadherin KD cells
Lipofectamine RNAiMAX (Invitrogen) was used for siRNA transfection. siRNA sequences were control (on-target plus nontargeting pool), UGGUUUACAUGUCGACUAA. siRNA against E-cadherin : GGGACAACGUUUAUUACUA was used. The levels of E-cadherin was confirmed by Western blot analysis of protein extracts (Extended Figure 3a).
Live cell and fixed sample imaging
Live imaging was performed with a 10X objective on BioStation IM-Q (Nikon) at 37°C and 5% CO2. Images are acquired every 10 min. For migration experiments, just the phase contrast images were captured every 10 min. For TFM experiments, phase contrast and fluorescent beads were imaged.
Calculation of cell area, aspect ratio and molecular markers
The cellular area and aspect ratio were obtained from time lapse imaging of phase contrast images. Cells were then segmented using MorphoLibJ, an ImageJ plugin for cell segementation. The area and length of paxillin was obtained by fitting them with an ellipse. Nuclear-cytoplasmic ratio of YAP intensity was quantified using an in-house ImageJ script. If the nucleus-cytoplasmic ratio was greater than 1.1 then YAP was considered to be nuclear while a value less than 0.99 was considered to be more cytoplasmic while any value in between was considered to be uniformly distributed through the cell.
Western Blot
Proteins for MDCK cells were extracted using RIPA buffer without SDS (50mM Tris pH 7.5, 150mM NaCl, 1% NP40, 5mM EDTA, 1mM Na3VO4, 10mM NaF, 1mM PMSF, 1X protease inhibitor cocktail (Roche) and 1X phosphatase inhibitor (Phosphostop, Roche). Proteins from MCF7 cells were extracted using sample buffer (50mM Tris pH 7.5, SDS 2%, Glycerol 10%, Bromophenol blue 0.1%, Dithiothreitol 400nM, sterile water). Protein concentration was quantified by a Bradford assay (BioRad). 30 μg of protein were loaded onto NuPage 4-12% Bis-Tris gel using a mini gel tank and dry transferred using iBlot transfer system (Invitrogen). Non-specific sites were blocked using 5% non fat dry milk in 0.1% PBS Tween. For MLC total, blots were blocked with BSA/TBST (Tris buffered saline with Tween 20). Primary antibodies were diluted in PBS Tween at E-cadherin (24E10-1:1000 for MDCK cells) (Santa Cruz, SC7870-1:200 for MCF7 cells), α-catenin (1:1000), β-catenin (1:1000), vinculin (gift from Marina Glukhova, 1:500), GAPDH (Protein Tech Europe 60004-1 for MDCK cells and abcam- 1:5000, ab181603 for MCF7 cells- 1:500), alpha-tubulin (1:5000) (Sigma T9026) overnight on a shaker at 4 °C. Anti-MLC (Cell Signaling) antibodies were diluted in TBST. The blots were then washed 3-4 times for 10 minutes each in PBS 0.1% Tween or TBST (for pMLC2 and MLC total antibodies). They were then incubated with either Gampox, HRP linked (Sigma Aldrich, Pierce or Santa Cruz) or Dylight 800 linked secondary antibodies (ThermoFisher Scientific) for 2 hours. The blots were then washed three times with PBS 0.1% Tween or TBST for 10 minutes each. The blots were then revealed using CHEMIDOC MP (BioRad) using Super West Femto (34095 Thermo Scientific) or chemiluminescence.
Traction force microscopy
Soft silicone substrates were prepared as described previously [54]. CyA and CyB were mixed in the ratio 1:1 and directly poured on glass bottom Petri dishes (fluorodish) in order to obtain a 100 μm thick layer. The substrate was cured at room temperature overnight on a flat surface. To ensure complete curing, the samples were cured at 80°C for 1 hour the next day. The surface was silanized using a solution of 5% APTES diluted in absolute ethanol for 5 min. The substrate was then washed with absolute ethanol and dried at 80°C for 10 min. 200 nm carboxylated fluorescent beads (Invitrogen) were diluted in deionized water solution at 1:500 for 10 min, washed with deionized water and dried at 80°C for 10 min. We then coated these substrates with 50 μg/ml fibronectin for 1 hour and washed with PBS prior to cell seeding. Around 200,000 cells were seeded in each petridish 40-50 min and washed with media when enough cells have attached. The cells were let to attach and spread overnight. The cells are imaged for 24 hours and at the end of the experiment, cells were removed with the addition of 500 μL of 10% SDS in the media so that the resting position of beads can be obtained.
Laser ablation
The apical section of the cell which showed the highest Lifeact-Ruby intensity was used for junctional ablation. This experiment was performed using the ultraviolet laser ablation system (355nm, 300ps pulse duration, 1 kHz repetition rate, PowerChip PNV-0150- 100, team photonics) [55]. Junctions between two tricellular contacts were ablated using the following parameters: laser power - 120nW, exposure time - 0.3sec and imaging interval - 2.2sec. Recoil velocity was computed by i) calculating the internodal distance after ablation by tracking the cartesian coordinates of the tricellular junctional nodes using MTrackJ plugin in Fiji [56] ii) fitting the calculated internodal distance into a single/double exponential function iii) obtaining recoil velocity using derivative of the function through a custom-made MATLAB algorithm [55]. The length of the junction was measured by drawing a line ROI in Fiji [57]. Junctional length and associated recoil velocity were plotted.
Soft polyacrylamide gel patterning
Glass coverslips were plasma activated and coated with 0.1mg/ml PLL-g-PEG (SuSoS Technology). 1mm diameter circles were patterned on the passivated glass coverslips using deep UV and incubated the glass coverslips with 20 μg/ml fibronectin for 30 minutes. After incubation, glass coverslips were rinsed in 1x PBS to remove excess protein. Simultaneously, silanization of another set of glass coverslips were performed by plasma activation of clean coverslips followed by incubation with an ethanol solution containing 2% (v/v) 3-(trimethoxysilyl) propyl methacrylate (Sigma-Aldrich, St Louis, Missouri, USA) and 1% (v/v) acetic acid. The silanised coverslips were heated at 120°C. Freshly made polyacrylamide (PA) mix (7.5% acrylamide, 0.075% bis-acrylamide, 0.05% ammonium persulphate and 0.75 μl TEMED) was sandwiched between the patterned glass coverslip and silanized coverslip. The acrylamide, bis-acrylamide concentration was the same as [58], to generate 2.3 kPa PA gels. After polymerization, the patterned coverslips were peeled off to reveal the patterns of protein on PA gels. Samples were kept submerged in 1x PBS until cell seeding.
Analysis methods
Nematic analysis
Orientation field and defects were detected as described previously [10]. In short, the largest eigenvector of the structure tensor was obtained for each pixel while the orientation of cells were obtained using a plugin on ImageJ called OrientationJ. Using the winding number parameter, we identify defects within the monolayer. Then we obtain the local nematic order parameter tensor Q (which is averaged over a region of 3-4 cells). The largest eigenvector of Q was taken to be the orientation of 3-5 cells and plotted as red lines over the phase image to ensure that orientation identified is correct. Using this Q value automated defect detection can be done using the winding number parameter thereby detecting the various defects (+1/2, -1/2, +1 and -1) although we have more +1/2 or -1/2 defects. In order to reduce noise, only stable defects which are found in at least six consecutive frames (60 mins) are used in the following analysis as described in [10]. In addition, we manually tracked a few defects over time to verift their movement direction.
Velocity analysis
We use PIVlab (a tool implemented using Matlab) to analyse the velocity of cellular monolayers. An interrogation window of 64x64 (40.96 μm) and 32x32 pixels (20.48 μm) with an overlap of 50% were used for this analysis. Outlier vectors were manually removed and a local standard deviation filter was applied. The velocity correlation length was obtained using the formula as detailed in [22].
Strain rate and stress measurement: Having identified the location of defects, we obtain the velocity field around the defects identified by aligning these defects. The strain rate was calculated from the gradient of the velocity field as = ∇v. By plotting the strain rate and velocity around the defect, we can characterize the system as an extensile or contractile system. For force measurement, the beads images obtained during cell migration are merged with the reference bead images obtained after SDS treatment. The images are stabilized using the Image Stabilizer plugin in ImageJ after which the illumination is corrected to remove background noise. We then obtain the displacement of beads using PIV of interrogation window 32x32 pixel with an overlap of 50%. Using the ImageJ plugin FTTC [59] we correlate the bead displacement to traction forces using a regularization parameter of 9 × 10⁻⁹. Stress within the monolayer was estimated using Bayesian Inversion Stress Microscopy (BISM) with a regularisation parameter of Λ = 10-6 [21]. This method obtains the stress directly from traction forces irrespective of epithelial rheology. Isotropic stress was obtained as half the trace of the stress tensor ((sxx + syy) /2) in the tissue. Since the stress values obtained through this method are not reliable very close to the boundary, only defects in the center of the monoloyer have been taken into account in these calculations. The heatmaps obtained for strain rate and stress were smoothed through linear interpolation.
Statistics
Differences between data were assessed using unpaired t-test implemented in Matlab and further verified using Graphpad Prism. On the plots, n.s.: not significant, *p < 0.05, **p < 0.01, ***p < 0.001 and ****p < 0.0001.
Computational model
The model used in this manuscript is the extension of a recently developed phase-field model that has been shown to reproduce active nematic behavior in cellular tissues [19] and has been quantitatively compared with experiments showing coherent oscillations in confined epithelial monolayers [60]. We consider a two-dimensional tissue and describe each cell i independently by a phase-field ϕi, where ϕi ≃ 1 indicates the interior of the cell and ϕi ≃ 0 its exterior. The interface of each cell thus lies at ϕi = 1/2. The phase-field dynamics is given by a Cahn-Allen type evolution equation:
| (1) |
where v i is the cell velocity that is determined from an over-damped equation for force balance as detailed below. 𝓕 is the free energy that determines both mechanical properties of the cell - including cell stiffness and compressibility - and details of the passive interactions between the cells. As such the free energy 𝓕 = 𝓕G-L + 𝓕area + 𝓕rep is composed of (i) Ginsburg-Landau term 𝓕G-L, that stabilises the interface, (ii) a soft constraint for area conservation 𝓕area, that penalises deviations from an initial circular morphology of the cell, and (iii) Frep, which prevents two phase-fields from overlapping:
where λ sets the interface width, γ sets the stiffness, μ determines cells compressibility, and ĸ sets the strength of repulsion between two phase-fields. For the details of these free energy definitions, the reader is referred to recent reviews of phase-field models [61, 62] and to [19, 60, 63, 64] for recent implementations. Note that because here we model highly-packed, confluent tissues we do not introduce any thermodynamic attraction between the cells.
Force balance
We consider over-damped dynamics of cells moving on a substrate:
| (2) |
where ξ is the friction coefficient between the cells and the substrate, and denotes the total forces acting on each cell. This encompasses self-propulsion forces generated by the cell and the interaction forces that a cell experiences from the neighbouring cells in the monolayer.
The self-propulsion force of an individual cell is achieved through an intricate coordination of actin polymerisation and myosin contractility. First, actin polymerisation at the cell front results in the formation of (lamelipodium) protrusions that deform the cell. Myosin contractility then retracts the cell rear to propel the cell forward. To account for the protrusion effects we introduce a polarity force αp i, that is distributed over the front edge of the cell in the direction of the cell polarity p i, where α sets the strength of the polarity force. To account for the cell contractility, we then introduce a contractile stress ζcQi, where ζc is the strength of the contractility and is the tensor that characterises the orientation of the polarity: the largest eigenvector of Qi is p i meaning that the contractile stress acts along the direction of protrusions formation. Considering that the vectors ∇ϕi describe the normal vector to the interface we obtain the following expression for the self-propulsion force:
| (3) |
where matrix multiplication is implied in the last term.
Next we consider the interaction stresses to define the interaction forces ∇ϕi. Note that is only non-zero at the interfaces between the cells and as such the interaction force is acting at the cell-cell interfaces. We decompose the interaction stress in between the cells into passive and active contributions : the passive contribution has a thermodynamic nature and is calculated from the free-energy:
| (4) |
while the active contribution leads to the force generation between cells at their interface through adherens junction. Following our recent work [19] this takes the form
| (5) |
where is the deformation tensor for cell i, characterising the anisotropy of the cell shape such that the largest eigenvector of Si corresponds to the direction of the elongation of the cell.
Alignment dynamics
We now introduce the dynamics of the cell polarity, modeling the mechanism that determines in which direction the polar force should act. There are many ways to introduce a dynamics of the polarisation [65]. One such way is through modeling the phenomenon of “contact inhibition of locomotion (CIL)”, aligning the polarity of the cell to the direction of the total interaction force acting on the cell [66]: We define the dynamics of the polarisation to be given by
| (6) |
where θi ∈ [–π, π] is the angle that the polarity vector is pointing at – such that p i = (cosθi, sinθi) – and η is a Gaussian white noise with zero mean, unit variance, and the rotational diffusivity Dr. The positive constant J sets the time scale for the alignment of the polarity to the total interaction force, as was suggested theoretically [66] and has been recently confirmed in the experiments on epithelial cells [60]. As explained in [60] this model of alignment has the advantage that (i) it contains an explicit timescale and (ii) does not require that a cell ‘knows’ about the position of its neighbours.
Simulation details
We simulated equation (1) using a finite difference scheme on a square lattice with a predictor-corrector step. Throughout this article, we used the following numerical values for the simulation parameters: R = 8, λ = 3.0, γ = 0.04, μ = 4.0, κ = 0.4, =1, α = 0.2, ζc = 0.08, and ζs = —0.02 for the wild type case, while ζs = 0.0 for the case with no cell-cell interaction stresses. We simulated square domains of edge length W = 100, 200,400 lattice sites with a packing fraction of Φ = 1.2 cells and set Dr = 1 × 10⁻³ and J = 0.1.
Extended Data
Extended Data Fig. 1. MDCK WT behave as an extensile system.
Kymograph of a short junction (<10μm) (top) and long junction (>15μm) (bottom) before and after laser ablation. B) Recoil velocity after laser ablation for short (<10μm) (n=9) (N=4), medium (10-15μm) (n=13)(N=4) and long junctions (> 15μm) (n=12) (N=6). n, is the number of junctions ablated and N is the number of independent experiments from which these results were obtained. Error bars represent the standard deviation. ANOVA test was performed leading to *p<0.05, **p<0.01, ***p<0.001 and ****p<0.0001. Scale bars, 20μm.
Extended Data Fig. 2. MDCK WT behaves as an extensile system and MDCK E-cadherin KO behave as a contractile system.
a, b) Orientation field (left) and velocity vectors (right) around a single comet shaped (+1/2) defect (a) and trefoil (-1/2) defect obtained from WT (top) and E-cadherin KO (bottom) monolayers. c, d) Trajectory of several comet (+1/2) (left) and trefoil (-1/2) (right) shaped defects obtained from MDCK WT (c) and MDCK E-cadherin KO (d) monolayers. Scale bars: 40μm.
Extended Data Fig. 3. Fibroblasts behave as a 2D contractile active nematic.
a) Average yy- and xy-components of strain rate map around +1/2 defect obtained from experiments (left and middle respectively) and corresponding average flow field (right) (n = 1489 defects from 2 independent experiments) for NIH3T3 cells. Colour code is positive for stretching and negative for shrinkage. b) Average yy (left)-, xy (middle)- and isotropic (right) components of stress around a +1/2 defect obtained from experiments for NIH3T3 (n = 1,428 defects from 2 independent experiments).
Extended Data Fig. 4. Characterization of MDCK E-cadherin KO cells and extensile/contractile behaviour of MCF7A cells.
Immunofluorescence staining (top) of E-cadherin (left), β-catenin (middle) and ZO1 (right), along with a b) representative western blot and quantification for E-cadherin (left) (n=3) and β-catenin (right) (n=3). Scale bars, 20μm. c) Western blot analysis of total MLC and quantification from 3 independent experiments normalized to α-tubulin. d) Western blot analysis of vinculin and quantification from 3 independent experiments normalized to GAPDH. Error bars represent the standard deviation. e) Western blot showing the reduced level of E-cadherin in siRNA generated E-cadherin KD cell line for MCF7A cells. f and g) Average flow field for MCF7A control cells (n = 2047 defects from 3 independent experiments) (f) and siRNA E-cadherin KD MCF7A cells (n = 1256 defects from 3 independent experiments) (f). (h) Uncropped blots of all the western blots shown so far.
Extended Data Fig. 5. E-cadherin rescue changes the behaviour to a 2D extensile active nematic liquid crystal and flow field around trefoil shaped defects.
a) Average yy- and xy-components of strain rate map around comet (+1/2) defect obtained from experiments (left and middle respectively) and corresponding average flow field (right) (n = 1767 defects from 2 independent experiments) for MDCK E-cadherin KO cells rescued with E-cadherin GFP. b) Total number of defects obtained per 0.55mm2 as a function of time on MDCK WT and MDCK E-cadherin KO monolayers. (n=10) from 2 independent experiments. c) Average vorticity and velocity field around trefoil (-1/2) defects in WT (left) (n=1934) and E-cadherin KO (right) (n=2028) monolayers. d) Average vorticity and velocity field around trefoil (-1/2) defects in control (left) (n=3200) and condition without active intercellular forces (right)(n=3200) monolayers obtained from simulations. e) Mean square displacement (MSD) plotted against time lag for comet (+1/2) and trefoil (-1/2) defects obtained from MDCK WT and MDCK E-cadherin KO monolayers (n=11). Error bars represent the standard deviation.
Extended Data Fig. 6. E-cadherin removal does not affect the contractile behaviour of single cells.
a) Mean traction force for both MDCK WT (n=31) and MDCK Ecadherin KO cells (n=27). b) Average yy- and xy-components of strain rate map around comet (+1/2) defect obtained from experiments (left and middle respectively) and corresponding average velocity flow field (right) (n = 1428 defects from 2 independent experiments) for MDCK E-cadherin KO cells plated on PDMS substrates of stiffness 15kPa from which stress maps were obtained in Figure 3b’.
Extended Data Fig. 7. Drug treatment changes 2D active nematic behaviour of MDCK E-cadherin KO cells.
a, b, c) Average yy- and xy-components of strain rate map around +1/2 defect obtained from experiments (left and middle respectively) and corresponding average velocity flow field (right) for MDCK E-cadherin KO cells treated with 5μM blebbistatin (a) (n = 2174 defects from 2 independent experiments), 20μM blebbistatin (b) (n = 1223 defects from 2 independent experiments), and 25μM Y27632 (c) (n = 1965 defects from 2 independent experiments). d, e) Average yy- and xy components of strain rate map around +1/2 defect obtained from experiments (left and middle respectively) and corresponding average velocity flow field (right) for MDCK WT cells treated with 20μM blebbistatin (d) (n = 1287 defects from 2 independent experiments), and 25μM Y27632 (e) (n = 2472 defects from 2 independent experiments).
Extended Data Fig. 8. Colocalization of vinculin and paxillin.
a) Immunostaining of basal plane of vinculin (left), paxillin (middle) and merge (right) in MDCK WT (top) and MDCK E-cadherin KO monolayers. b) Intensity of vinculin plotted against paxillin for n=15 focal adhesions in MDCK WT and n=16 focal adhesions in MDCK Ecadherin KO monolayers. Scale bars: 20μm.
Extended Data Fig. 9. Substrate rigidity alters E-cadherin KO behaviour.
a, b) Average yy- and xy-components of strain rate map around +1/2 defect obtained from experiments (left and middle respectively) and corresponding average flow field (right) for MDCK WT cells (a) (n = 1426 defects from 2 independent experiments) and E-cadherin KO cells (b) (n = 1041 defects from 2 independent experiments).
Extended Data Fig. 10. Phase diagram on activity change and activity based cell sorting in a mixed culture of MDCK WT and MDCK E-cadherin KO.
a) Phase diagram showing the transition of extensile and contractile behaviour with varying values of intercellular and intracellular stresses obtained from simulations. b) Phase separation (demixing) observed from simulations where the contractile particles (orange) are surrounded by extensile particles (green). c) Cell sorting (demixing) observed for a mixture of MDCK WT and MDCK E-cadherin KO cells, where WT cells are surrounded by E-cadherin KO cells (E-cadherin, green, cadherin 6, red, actin, black). XZ and YZ projection show the height difference between the two cells when mixed. Scale bars, 20μm. d,e) Early stages of cell sorting when MDCK WT (magenta) and MDCK E-cadherin KO (green) monolayers are mixed at 30-70 (d) and 70-30 (e) ratio. Scale bars: 100μm.
Supplementary Material
Acknowledgements
This work was supported by the European Research Council (Grant No. CoG-617233), LABEX Who Am I? (ANR-11-LABX-0071), the Ligue Contre le Cancer (Equipe labellisée), and the Agence Nationale de la Recherche (‘POLCAM’ (ANR-17-CE13-0013 and ‘MechanoAdipo’ ANR-17-CE13-0012). We acknowledge the ImagoSeine core facility of the IJM, member of IBiSA and France-BioImaging (ANR-10-INBS-04) infrastructures. A. D. acknowledges support from the Novo Nordisk Foundation (grant No. NNF18SA0035142), Villum Fonden (Grant no. 29476), and funding from the European Union’s Horizon 2020 research and innovation program under the MarieSklodowska-Curie grant agreement No. 847523 (INTERACTIONS). LB has received funding from the European Union’s Horizon 2020 research and innovation programme (Marie Sklodowska-Curie grant agreement 665850-INSPIRE). T.B.S. acknowledges support from the Lee Kuan Yew (LKY) Postdoctoral fellowship and Singapore Ministry of Education Academic Research Fund Tier 1 (R-397-000-320-114). S.G and A. Y were supported by project grants and fellowships from the National Health and Medical Research Council of Australia (1123816 and 1139592) and Australian Research Council (DP190102871). We would like to thank Phillipe Marcq for help with implementation of BISM code, Marina A. Glukhova for providing the vinculin antibody and Sylvie Robine for the ZO1 antibody. AD and JMY acknowledge Guanming Zhang for helpful discussions regarding the model. We also thank the members of cell adhesion and mechanics team at Institut Jacques Monod, Matthieu Piel and Francois Gallet for insightful discussions.
Footnotes
Author contributions
L.B, T.B.S, A.D, J.Y, R.M.M and B.L designed the research. G.H.N.S.N and T.D developed the E-cadherin KO cell line. L.B performed experiments and analysed the results. S.S helped in the PA gel experiments. M.T performed and quantified laser ablation experiments. S.G performed the MCF7 experiments. A.D, R.M, performed the in silico simulations. T.B.S contributed to the analysis tools. A.S.Y, Y.T, R.M.M, A.D, J.Y, and B.L supervised the project.
Competing Financial Interests
The authors declare no competing interests.
Data availability statement
Source data and codes for cell orientation detection, and Bayesian inference of tissue stress are available upon request. Numerical analyses were performed using a custom made code “CELADRO: Cells as Active Droplets”, which is an open source code that has been deposited on GitHub (https://github.com/rhomu/celadro).
References
- [1].Barriga EH, et al. Tissue Stiffening Coordinates Morphogenesis by Triggering Collective Cell Migration in vivo. Nature. 2018 Feb;554(7693):523–527. doi: 10.1038/nature25742. [DOI] [PMC free article] [PubMed] [Google Scholar]
- [2].Onodera T, et al. Btbd7 Regulates Epithelial Cell Dynamics and Branching Morphogenesis. Science. 2010 Jul;329(5991):562–565. doi: 10.1126/science.1191880. [DOI] [PMC free article] [PubMed] [Google Scholar]
- [3].Chen XL, et al. VEGF-Induced Vascular Permeability Is Mediated by FAK. Developmental Cell. 2012 Jan;22(1):146–157. doi: 10.1016/j.devcel.2011.11.002. [DOI] [PMC free article] [PubMed] [Google Scholar]
- [4].Malinverno C, et al. Endocytic Reawakening of Motility in Jammed Epithelia. Nature Materials. 2017 May;16(5):587–596. doi: 10.1038/nmat4848. [DOI] [PMC free article] [PubMed] [Google Scholar]
- [5].Cetera M, et al. Epithelial Rotation Promotes the Global Alignment of Contractile Actin Bundles during Drosophila Egg Chamber Elongation. Nature Communications. 2014 Nov;5:5511. doi: 10.1038/ncomms6511. [DOI] [PMC free article] [PubMed] [Google Scholar]
- [6].Wang S, Matsumoto K, Yamada KM. bioRxiv. Publisher: Cold Spring Harbor Laboratory Section: New Results; 2020. Jun, Reconstituting Stratified Epithelial Branching Morphogenesis by Engineering Cell Adhesion. 2020.06.24.165795. [DOI] [Google Scholar]
- [7].De Pascalis C, Etienne-Manneville S. Single and Collective Cell Migration: The Mechanics of Adhesions. Weaver VM, editor. Molecular Biology of the Cell. 2017 Jul;28(14):1833–1846. doi: 10.1091/mbc.e17-03-0134. [DOI] [PMC free article] [PubMed] [Google Scholar]
- [8].Schwarz US, Safran SA. Elastic Interactions of Cells. Physical Review Letters. 2002 Jan;88(4):048102. doi: 10.1103/PhysRevLett.88.048102. [DOI] [PubMed] [Google Scholar]
- [9].Duclos G, et al. Topological Defects in Confined Populations of Spindle-Shaped Cells. Nature Physics. 2017 Jan;13:58–62. doi: 10.1038/nphys3876. [DOI] [Google Scholar]
- [10].Saw TB, et al. Topological Defects in Epithelia Govern Cell Death and Extrusion. Nature. 2017 Apr;544(7649):212–216. doi: 10.1038/nature21718. [DOI] [PMC free article] [PubMed] [Google Scholar]
- [11].Blanch-Mercader C, et al. Turbulent Dynamics of Epithelial Cell Cultures. Physical Review Letters. 2018 May;120(20):208101. doi: 10.1103/PhysRevLett.120.208101. [DOI] [PubMed] [Google Scholar]
- [12].Kawaguchi K, Kageyama R, Sano M. Topological Defects Control Collective Dynamics in Neural Progenitor Cell Cultures. Nature. 2017 Apr;545(7654):327–331. doi: 10.1038/nature22321. [DOI] [PubMed] [Google Scholar]
- [13].Xi W, et al. Material Approaches to Active Tissue Mechanics. Nature Reviews Materials. 2019 Jan;4(1):23–44. doi: 10.1038/s41578-018-0066-z. [DOI] [Google Scholar]
- [14].Gruler H, Dewald U, Eberhardt M. Nematic Liquid Crystals Formed by Living Amoeboid Cells. The European Physical Journal B. 1999;11:6. [Google Scholar]
- [15].Ladoux B, Mège R-M. Mechanobiology of Collective Cell Behaviours. Nature Reviews Molecular Cell Biology. 2017 Dec;18(12):743–757. doi: 10.1038/nrm.2017.98. [DOI] [PubMed] [Google Scholar]
- [16].Giomi L, et al. Defect dynamics in active nematics. Philosophical Transactions of the Royal Society a. 2014;372(2029):20130365. doi: 10.1098/rsta.2013.0365. [DOI] [PMC free article] [PubMed] [Google Scholar]
- [17].Doostmohammadi A, et al. Active nematics. Nature communications. 2018;9(1):1–13. doi: 10.1038/s41467-018-05666-8. [DOI] [PMC free article] [PubMed] [Google Scholar]
- [18].Marth W, Voigt A. Signaling Networks and Cell Motility: A Computational Approach Using a Phase Field Description. Journal of Mathematical Biology. 2014 Jul;69(1):91–112. doi: 10.1007/s00285-013-0704-4. [DOI] [PubMed] [Google Scholar]
- [19].Mueller R, Yeomans JM, Doostmohammadi A. Emergence of Active Nematic Behavior in Monolayers of Isotropic Cells. Physical Review Letters. 2019 Feb;122(4) doi: 10.1103/PhysRevLett.122.048004. 048004. [DOI] [PubMed] [Google Scholar]
- [20].Ng MR, et al. Mapping the Dynamics of Force Transduction at Cell–Cell Junctions of Epithelial Clusters. Paluch E, editor. eLife. 2014 Dec;3:e03282. doi: 10.7554/eLife.03282. [DOI] [PMC free article] [PubMed] [Google Scholar]
- [21].Nier V, et al. Inference of Internal Stress in a Cell Monolayer. Biophysical Journal. 2016 Apr;110(7):1625–1635. doi: 10.1016/j.bpj.2016.03.002. [DOI] [PMC free article] [PubMed] [Google Scholar]
- [22].Petitjean L, et al. Velocity Fields in a Collectively Migrating Epithelium. Biophysical Journal. 2010 May;98(9):1790–1800. doi: 10.1016/j.bpj.2010.01.030. [DOI] [PMC free article] [PubMed] [Google Scholar]
- [23].Garcia S, et al. Proceedings of the National Academy of Sciences. 50. Vol. 112. Publisher: National Academy of Sciences Section: Physical Sciences; 2015. Dec, Physics of active jamming during collective cellular motion in a monolayer; pp. 15314–15319. [DOI] [PMC free article] [PubMed] [Google Scholar]
- [24].Goodwin K, et al. Molecular Biology of the Cell. 10. Vol. 28. Publisher: American Society for Cell Biology (mboc); 2017. Mar, Cell–cell and cell–extracellular matrix adhesions cooperate to organize actomyosin networks and maintain force transmission during dorsal closure; pp. 1301–1310. [DOI] [PMC free article] [PubMed] [Google Scholar]
- [25].Dupont S, et al. Role of YAP/TAZ in Mechanotransduction. Nature. 2011 Jun;474(7350):179–183. doi: 10.1038/nature10137. [DOI] [PubMed] [Google Scholar]
- [26].Giannone G, et al. Periodic Lamellipodial Contractions Correlate with Rearward Actin Waves. Cell. 2004 Feb;116(3):431–443. doi: 10.1016/S0092-8674(04)00058-3. [DOI] [PubMed] [Google Scholar]
- [27].Zemel A, et al. Optimal Matrix Rigidity for Stress-Fibre Polarization in Stem Cells. Nature Physics. 2010 Jun;6(6):468–473. doi: 10.1038/nphys1613. [DOI] [PMC free article] [PubMed] [Google Scholar]
- [28].Gupta M, et al. Adaptive Rheology and Ordering of Cell Cytoskeleton Govern Matrix Rigidity Sensing. Nature Communications. 2015 Nov;6(1):7525. doi: 10.1038/ncomms8525. [DOI] [PMC free article] [PubMed] [Google Scholar]
- [29].Saraswathibhatla A, Notbohm J. Tractions and Stress Fibers Control Cell Shape and Rearrangements in Collective Cell Migration. Physical Review X. 2020 Jan;10(1):011016. doi: 10.1103/PhysRevX.10.011016. [DOI] [Google Scholar]
- [30].Riveline D, et al. Focal Contacts as Mechanosensors. The Journal of Cell Biology. 2001;153(6):1175–1186. doi: 10.1083/jcb.153.6.1175. eprint: http://jcb.rupress.org/content/153/6/1175.full.pdf. [DOI] [PMC free article] [PubMed] [Google Scholar]
- [31].Yonemura S, et al. Alpha-Catenin as a Tension Transducer That Induces Adherens Junction Development. Nature Cell Biology. 2010 Jun;12(6):533–542. doi: 10.1038/ncb2055. [DOI] [PubMed] [Google Scholar]
- [32].Bays JL, DeMali KA. Vinculin in Cell–Cell and Cell–Matrix Adhesions. Cellular and Molecular Life Sciences. 2017;74(16):2999–3009. doi: 10.1007/s00018-017-2511-3. [DOI] [PMC free article] [PubMed] [Google Scholar]
- [33].Halder G, Dupont S, Piccolo S. Transduction of Mechanical and Cytoskeletal Cues by YAP and TAZ. Nature Reviews Molecular Cell Biology. 2012 Sep;13(9):591–600. doi: 10.1038/nrm3416. [DOI] [PubMed] [Google Scholar]
- [34].Benham-Pyle BW, Pruitt BL, Nelson WJ. Mechanical Strain Induces E-Cadherin-Dependent Yap1 and β-Catenin Activation to Drive Cell Cycle Entry. Science (New York, NY) 2015 May;348(6238):1024–1027. doi: 10.1126/science.aaa4559. [DOI] [PMC free article] [PubMed] [Google Scholar]
- [35].Kim N-G, et al. E-Cadherin Mediates Contact Inhibition of Proliferation through Hippo Signaling-Pathway Components. Proceedings of the National Academy of Sciences; 2011. Jul, pp. 11930–11935. [DOI] [PMC free article] [PubMed] [Google Scholar]
- [36].Discher DE, Janmey P, Wang Y-l. Tissue Cells Feel and Respond to the Stiffness of Their Substrate. Science. 2005;310(5751):1139–1143. doi: 10.1126/science.1116995. eprint: https://science.sciencemag.org/content/310/5751/1139.full.pdf. [DOI] [PubMed] [Google Scholar]
- [37].Maître J-L, et al. Adhesion Functions in Cell Sorting by Mechanically Coupling the Cortices of Adhering Cells. Science. 2012 Oct;338(6104):253–256. doi: 10.1126/science.1225399. [DOI] [PubMed] [Google Scholar]
- [38].Steinberg MS. Does differential adhesion govern self-assembly processes in histogenesis? Equilibrium configurations and the emergence of a hierarchy among populations of embryonic cells. Journal of Experimental Zoology. 1970;173(4):395–433. doi: 10.1002/jez.1401730406. [DOI] [PubMed] [Google Scholar]
- [39].Manning ML, et al. Coaction of intercellular adhesion and cortical tension specifies tissue surface tension. Proceedings of the National Academy of Sciences; 2010. pp. 12517–12522. eprint: https://www.pnas.org/content/107/28/12517.full.pdf. [DOI] [PMC free article] [PubMed] [Google Scholar]
- [40].Sahu P, et al. Soft Matter. 13. Vol. 16. Publisher: The Royal Society of Chemistry; 2020. Apr, Small-scale demixing in confluent biological tissues; pp. 3325–3337. [DOI] [PubMed] [Google Scholar]
- [41].Krajnc M. Soft Matter. 13. Vol. 16. Publisher: The Royal Society of Chemistry; 2020. Apr, Solid–fluid transition and cell sorting in epithelia with junctional tension fluctuations; pp. 3209–3215. [DOI] [PubMed] [Google Scholar]
- [42].Thomas WA, et al. Two distinct adhesion mechanisms in embryonic neural retina cells: III. Functional specificity. Developmental Biology. 1981;81(2):379–385. doi: 10.1016/0012-1606(81)90304-3. [DOI] [PubMed] [Google Scholar]
- [43].Foty RA, Steinberg MS. Cadherin-mediated cell-cell adhesion and tissue segregation in relation to malignancy. The International Journal of Developmental Biology. 2004;48(5-6):397–409. doi: 10.1387/ijdb.041810rf. [DOI] [PubMed] [Google Scholar]
- [44].Niessen CM, Gumbiner BM. Cadherin-mediated cell sorting not determined by binding or adhesion specificity. The Journal of Cell Biology. 2002;156(2):389–400. doi: 10.1083/jcb.200108040. eprint: http://jcb.rupress.org/content/156/2/389.full.pdf. [DOI] [PMC free article] [PubMed] [Google Scholar]
- [45].Maroudas-Sacks Y, et al. Topological defects in the nematic order of actin fibers as organization centers of Hydra morphogenesis. Publisher: Cold Spring Harbor Laboratory Section: New Results; 2020. Mar, [DOI] [Google Scholar]
- [46].Comelles J, et al. Epithelial colonies in vitro elongate through collective effects. Publisher: Cold Spring Harbor Laboratory Section: New Results; 2020. Apr, [DOI] [Google Scholar]
- [47].Morales-Navarrete H, et al. Liquid-crystal organization of liver tissue. Sens P, Chakraborty AK, Ladoux B, editors. eLife. 2019 Jun;8:e44860. doi: 10.7554/eLife.44860. [DOI] [PMC free article] [PubMed] [Google Scholar]
- [48].Aigouy B, et al. Cell Flow Reorients the Axis of Planar Polarity in the Wing Epithelium of Drosophila. Cell. 2010;142(5):773–786. doi: 10.1016/j.cell.2010.07.042. [DOI] [PubMed] [Google Scholar]
- [49].Hannezo E, Prost J, Joanny J-F. Theory of Epithelial Sheet Morphology in Three Dimensions. Proceedings of the National Academy of Sciences; 2014. Jan, pp. 27–32. [DOI] [PMC free article] [PubMed] [Google Scholar]
- [50].Morales-Navarrete H, et al. Liquid-crystal organization of liver tissue. In: Sens P, Chakraborty AK, Ladoux B, editors. eLife. Vol. 8. Publisher: eLife Sciences Publications, Ltd; 2019. Jun, p. e44860. [DOI] [PMC free article] [PubMed] [Google Scholar]
- [51].Doostmohammadi A, et al. Celebrating Soft Matter’s 10th Anniversary: Cell division: a source of active stress in cellular monolayers. Soft Matter. 2015;11(37):7328–7336. doi: 10.1039/C5SM01382H. [DOI] [PubMed] [Google Scholar]
- [52].Marthiens V, et al. Complementary Expression and Regulation of Cadherins 6 and 11 during Specific Steps of Motoneuron Differentiation. Molecular and Cellular Neuroscience. 2002 Jul;20(3):458–475. doi: 10.1006/mcne.2002.1130. [DOI] [PubMed] [Google Scholar]
- [53].Glukhova MA, Frid MG, Koteliansky VE. Developmental changes in expression of contractile and cytoskeletal proteins in human aortic smooth muscle. Journal of Biological Chemistry. 1990;265(22):13042–6. eprint: http://www.jbc.org/content/265/22/13042.full.pdf+html. [PubMed] [Google Scholar]
- [54].Vedula SRK, et al. Epithelial Bridges Maintain Tissue Integrity during Collective Cell Migration. Nature Materials. 2014 Jan;13(1):87–96. doi: 10.1038/nmat3814. [DOI] [PubMed] [Google Scholar]
- [55].Hara Y, Shagirov M, Toyama Y. Current Biology. 17. Vol. 26. Publisher: Elsevier; 2016. Sep, Cell Boundary Elongation by Non-autonomous Contractility in Cell Oscillation; pp. 2388–2396. [DOI] [PubMed] [Google Scholar]
- [56].Meijering E, Dzyubachyk O, Smal I. Methods for cell and particle tracking. Methods in Enzymology. 2012;504:183–200. doi: 10.1016/B978-0-12-391857-4.00009-4. [DOI] [PubMed] [Google Scholar]
- [57].Schindelin J, et al. Fiji: an open-source platform for biological-image analysis. Nature Methods. 2012 Jul;9(7):676–682. doi: 10.1038/nmeth.2019. [DOI] [PMC free article] [PubMed] [Google Scholar]
- [58].Plotnikov SV, et al. High-resolution traction force microscopy. Methods in cell biology. 2014;123:367–394. doi: 10.1016/B978-0-12-420138-5.00020-3. [DOI] [PMC free article] [PubMed] [Google Scholar]
- [59].Tseng Q, et al. Spatial Organization of the Extracellular Matrix Regulates Cell–Cell Junction Positioning. Proceedings of the National Academy of Sciences; 2012. Jan, pp. 1506–1511. [DOI] [PMC free article] [PubMed] [Google Scholar]
- [60].Peyret G, et al. Sustained Oscillations of Epithelial Cell Sheets. Biophysical Journal. 2019 Aug;117(3):464–478. doi: 10.1016/j.bpj.2019.06.013. [DOI] [PMC free article] [PubMed] [Google Scholar]
- [61].Aronson IS, editor. Biological and Medical Physics, Biomedical Engineering. Springer International Publishing; 2016. Physical Models of Cell Motility. [Google Scholar]
- [62].Camley BA, Rappel W-J. Physical Models of Collective Cell Motility: From Cell to Tissue. Journal of Physics D: Applied Physics. 2017;50(11) doi: 10.1088/1361-6463/aa56fe. [DOI] [PMC free article] [PubMed] [Google Scholar]
- [63].Palmieri B, et al. Multiple Scale Model for Cell Migration in Monolayers: Elastic Mismatch between Cells Enhances Motility. Scientific Reports. 2015 Jul;5:11745. doi: 10.1038/srep11745. [DOI] [PMC free article] [PubMed] [Google Scholar]
- [64].Winkler B, Aranson IS, Ziebert F. Confinement and Substrate Topography Control Cell Migration in a 3D Computational Model. Communications Physics. 2019 Jul;2(1):1–11. doi: 10.1038/s42005-019-0185-x. [DOI] [Google Scholar]
- [65].Alert R, Trepat X. Physical Models of Collective Cell Migration. Annual Review of Condensed M. 2020;11(1) doi: 10.1146/annurev-conmatphys-031218-013516. [DOI] [Google Scholar]
- [66].Smeets B, et al. Emergent Structures and Dynamics of Cell Colonies by Contact Inhibition of Locomotion. Proceedings of the National Academy of Sciences; 2016. Dec, pp. 14621–14626. [DOI] [PMC free article] [PubMed] [Google Scholar]
Associated Data
This section collects any data citations, data availability statements, or supplementary materials included in this article.
Supplementary Materials
Data Availability Statement
Source data and codes for cell orientation detection, and Bayesian inference of tissue stress are available upon request. Numerical analyses were performed using a custom made code “CELADRO: Cells as Active Droplets”, which is an open source code that has been deposited on GitHub (https://github.com/rhomu/celadro).


