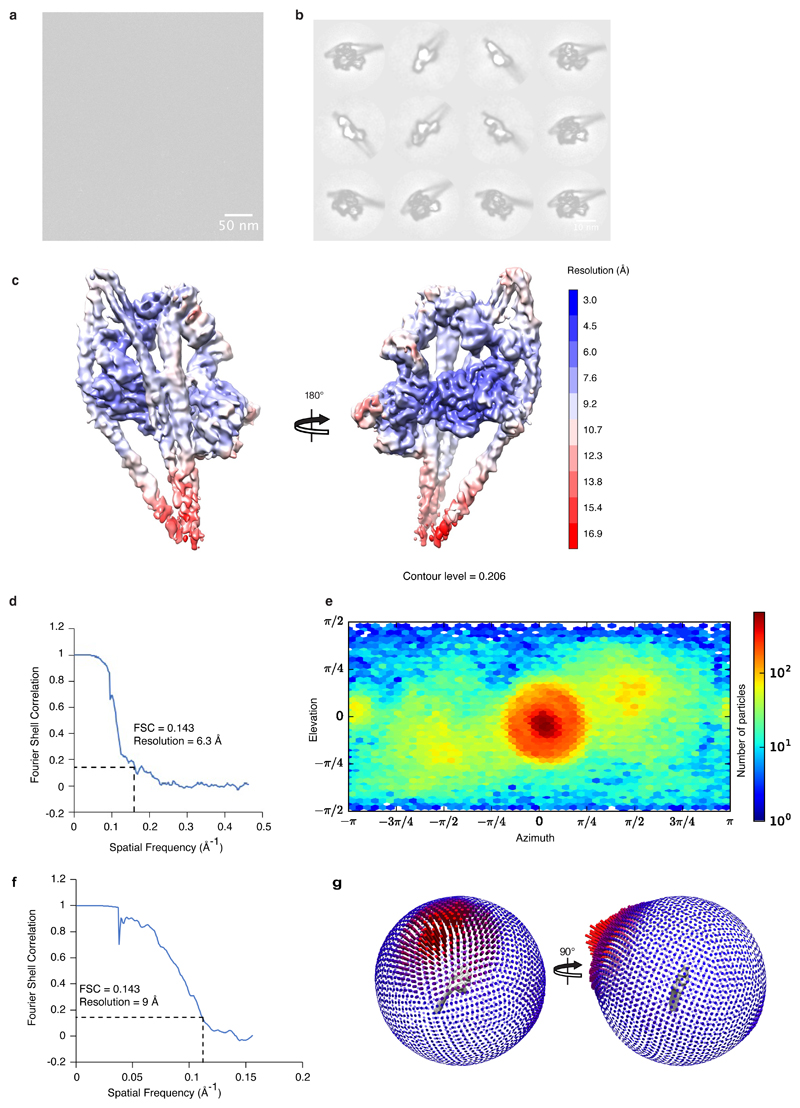
Extended Data Figure 1. Micrograph, 2-D classification, angular distribution and resolution parameters.
a, Representative micrograph of shutdown SmM molecules from 28,817 micrographs. Scale bar 50 nm. b, Representative 2D classes (representing approximately 25% of particles that contributed to the final reconstruction). Scale bar 10 nm. c, Local resolution of SmM shutdown heads region cryoEM map. d, FSC curve of the heads region reconstruction, illustrating 6.3 Å resolution at 0.143 FSC. e, Angular distribution of particles in the heads region 3D reconstruction. f, FSC curve of the whole molecule reconstruction. g, Angular distribution of particles contributing to the whole molecule 3D reconstruction.

