Summary
Neutrophils display distinct gene expression patters depending on their developmental stage, activation state and tissue microenvironment. To determine the transcription factor networks that shape these responses in a mouse model, we integrated transcriptional and chromatin analyses of neutrophils during acute inflammation. We show active chromatin remodelling at two transition stages: bone marrow-to-blood and blood-to-tissue. Analysis of differentially accessible regions revealed distinct sets of putative transcription factors associated with control of neutrophil inflammatory responses. Using ex vivo and in vivo approaches, we confirmed that RUNX1 and KLF6 modulate neutrophil maturation, whereas RELB, IRF5 and JUNB drive neutrophil effector responses, and RFX2 and RELB promote survival. Interfering with neutrophil activation by targeting one of these factors, JUNB, reduced pathological inflammation in a mouse model of myocardial infarction. Our study therefore represents a blueprint for transcriptional control of neutrophil responses in acute inflammation and opens possibilities for stage-specific therapeutic modulation of neutrophil function in disease.
Introduction
Neutrophils are important effector cells of the innate immune system and are produced in large numbers in the bone marrow (BM) through stepwise differentiation of myeloid progenitors, featuring distinct morphological changes and stage-specific expression pattern of surface receptors1, 2, 3. Upon entering the circulation, they patrol blood vessels and tissues for microbial and sterile challenges. Neutrophil functional responses are diverse, including but not limited to phagocytosis, generation of reactive oxygen species (ROS) and production of cytokines and other inflammatory factors, to influence and regulate inflammatory as well as adaptive immune responses4, 5. Neutrophil populations are, however, not homogeneous4, 6, 7, 8. Increasing evidence supports the notion that neutrophils are transcriptionally active cells9, 10, 11, 12. They possess the ability to adapt their genome accessibility and change the transcriptional programme en route to naive tissues13, and to exhibit phenotypic and functional heterogeneity in various immune disorders and cancers7, 14, 15, 16. However, the cell-intrinsic molecular regulators orchestrating adaptations in neutrophil phenotype and function remain largely unexplored.
There is partial understanding of the transcriptional factors (TFs) that promote neutrophil differentiation. PU.1 and CCAAT/enhancer-binding protein α (C/EBP α), are essential for neutrophilic lineage commitment and early differentiation17, 18; C/EBPɛ and growth factor independent-1 (Gfi-1) function in promoting neutrophil terminal differentiation2, 19, and C/EBPβ regulates emergency granulopoiesis20. These and other TFs instruct a transcriptional programme that allows developmental transition from neutrophil precursors into mature neutrophils21, 22.
Mature neutrophils possess the full range of effector functions, including reactive oxygen species (ROS) production, phagocytosis and chemotaxis, which enable rapid responses to stimulation and orchestration of protective immunity2, 11. Under different activating conditions they additionally upregulate the expression of genes involved in cytokine production and pathogen clearance11, 23. Multiple signaling pathways activated during neutrophil stimulation are predicted to converge at common TFs, which are utilized in a combinatorial manner depending on the activating stimuli. These include interferon regulatory factors, CCAAT-enhancer-binding proteins and NF-κB family members, which together orchestrate inflammatory responses9, 24.
Recent scRNA-seq of murine neutrophils revealed a heterogeneous and complex neutrophil population under steady-state and bacterial infection conditions, and proposed neutrophil-specific networks, including previously reported TFs and new regulons11. However, which of the proposed multitude of regulators actually control neutrophil differentiation and activation remain unknown. Here we have combined transcriptional and chromatin profiling of neutrophils en route to sites of inflammation with genetic perturbation approaches to identify and functionally validate key regulators of neutrophil function in inflammation.
Results
Inflammatory neutrophils are under dynamic transcriptional control
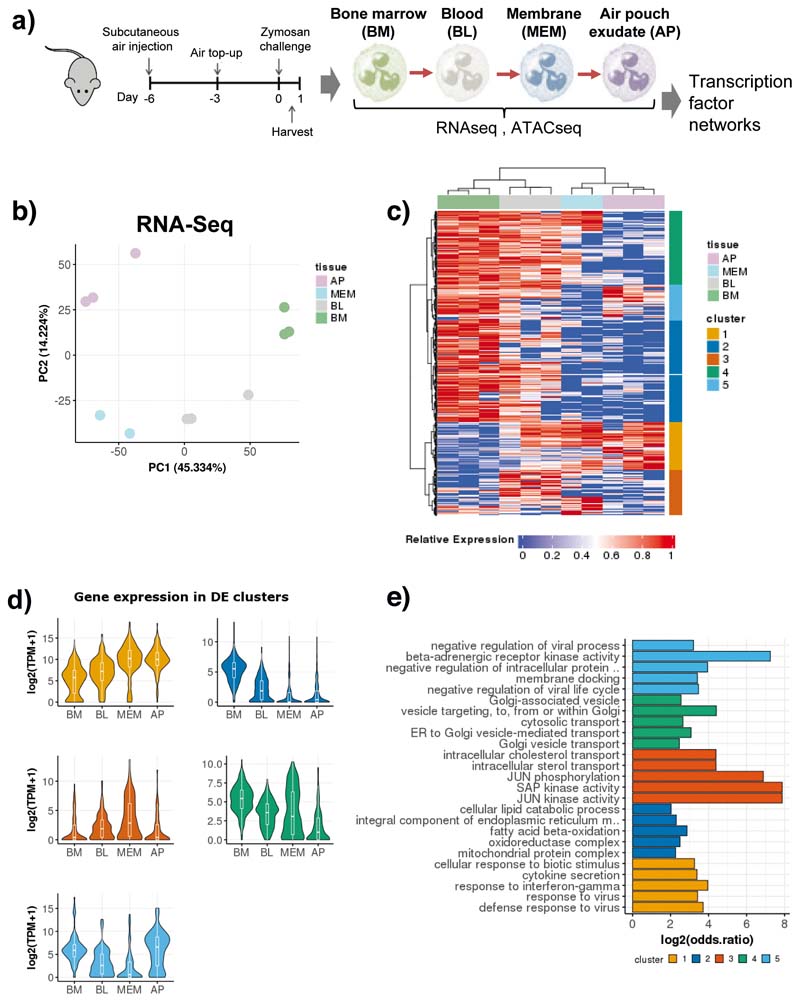
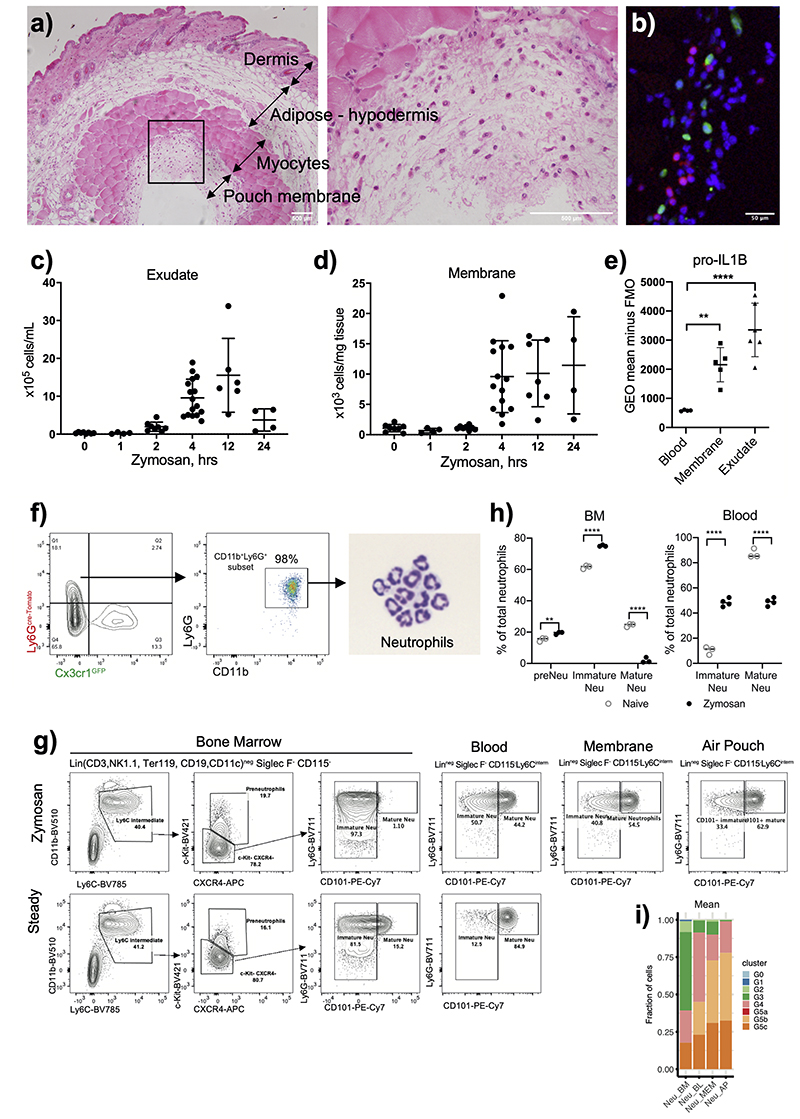
To identify putative transcription factors in control of neutrophil inflammatory responses, we assessed chromatin and transcriptional changes during neutrophil recruitment and activation in the air pouch model of acute inflammation (Fig. 1a), which provides a robust and reliable method to quantify early neutrophil infiltration into the granulation tissue lining and air pouch cavity25. In this model, a cavity is created on the dorsal surface of the mice, and granulation tissue (membrane) is formed over a period of 6 days (Extended Data Fig. 1a), composed primarily of fibroblasts and macrophages26, 27, 28. Injection of 1mg of zymosan, a ligand for dectin-1 and TLR 2/6, into the pouch cavity results in efficient infiltration of immune cells from the blood into the membrane and pouch (Data Fig. 1b,c,d), a large proportion being neutrophils29. Neutrophil recruitment initiated at 4hrs (Data Fig. 1c,d), and peaked at 12h after stimulation in the pouch (Extended Data Fig 1c), while remaining up to 24h in the membrane (Extended Data Fig 1d). Phenotypic assessment of neutrophils from the blood, membrane, and pouch at 4h post zymosan challenge revealed progressively elevated levels of intracellular pro-IL1β in the membrane and pouch, indicating that neutrophils undergo activation as they traversed to the tissue (Extended Data Fig. 1e).
Fig. 1. Neutrophil transcriptional re-wiring en route to the site of inflammation is parsimonious.
a) Ly6Ghi CD11b+ cells were sorted from the bone marrow, blood, air pouch membrane, and air pouch exudate in mice subjected to air pouch model and zymosan challenge for 4 hours. Small bulk RNA-seq analysis powered by Smart-seq2 library preparations52 for transcriptional changes and ATAC-seq analysis for chromatin changes were conducted.
b) Principal component analysis (PCA) of 1,865 differentially expressed genes derived from small bulk RNA-seq analysis (n=300 cells / sample) of neutrophils isolated from the bone marrow, blood, membrane and exudate of two mice subjected to the air pouch model and zymosan challenge.
c) Hierarchical clustering of all differentially expressed genes (LRT test, padj < 0.01), based on Manhattan distances using the Ward method. Data are presented as heatmap normalised to the minimum and maximum of each row.
d) Violin plots showing the expression of all genes within each cluster identified in B) across different compartments from two mice. For the box plot within each violin plot, middle lines indicate median values, boxes range from the 25th to 75th percentiles, and upper/lower whiskers extend from the hinge to the largest/smallest value no further than 1.5 times the interquartile range (IQR) from the hinge.
e) Gene ontology (GO) analysis, showing the top 5 enriched GO categories for each cluster from Fig. 1c).
We isolated Ly6Ghi CD11b+ cells from the bone marrow (BM), blood, membrane, and air pouch exudate (AP) 4h after challenge with zymosan (Extended Data Fig. 1f) and conducted small bulk mRNA-seq and ATAC-seq analyses (Fig. 1a). In zymosan-challenged animals, a significant proportion of neutrophils in the blood, AP membrane and exudate expressed CD101 (Extended Data Fig. 1g), a marker of mature neutrophils2, whereas BM neutrophils were largely CD101-negative and represented immature neutrophils (Extended Data Fig. 1g, h). Zymosan challenge induced egress of BM immature neutrophils into circulation, which were largely absent in naive mice (Extended Data Fig. 1h).
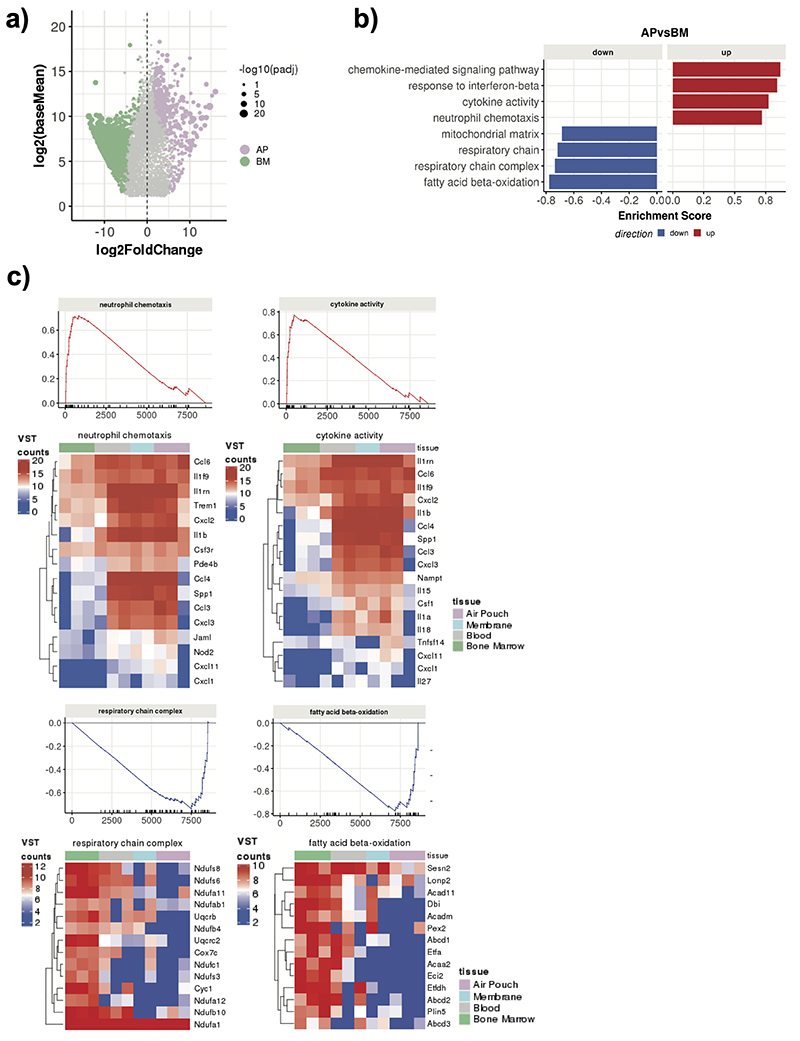
Firstly, we mapped transcriptional changes associated with neutrophil progression to the site of inflammation in vivo (Fig. 1a). Principal component analysis (PCA) of 1,865 differentially expressed genes (DEGs) (p-adj < 0.1) clearly separated neutrophils from the compartments and indicated that changes were incremental, initiating with the transition from the BM to the blood and continuing gradually as neutrophils migrate into sites of inflammation (Fig. 1b). Comparison between the BM and AP neutrophils revealed 445 up-regulated and 1,303 down-regulated genes (Extended Data Fig. 2a). Gene set enrichment analysis (GSEA) of DEGs between the AP and BM (p-adj < 0.05 and fold change >1.5) revealed that chemotaxis, cytokine activity and signaling pathways genes are gradually up-regulated along the maturation trajectory and the inflammatory cascade, whilst respiratory chain complex, mitochondrial matrix and fatty acid beta-oxidation genes are gradually down-regulated (Fig. 1c, Extended Data Fig. 2b, c).
Hierarchical clustering of the DEGs across all the compartments identified five clusters (Fig. 1c), that encompassed genes progressively up-regulated in the blood, membrane and AP (cluster 1), transiently up-regulated in the blood (cluster 3), rapidly down-regulated in the membrane and AP (cluster 2), slowly down-regulated in the AP (cluster 4), and transiently down-regulated in the blood (cluster 5) genes (Fig. 1d). Gene ontology analysis (GO) revealed that down-regulated genes in clusters 2 and 4 primarily correlated to metabolic processes (cluster 2: cellular lipid catabolism, fatty acid beta oxidation) and protein transport (cluster 4: cytosolic transport, Golgi vesicle transport) (Fig. 1e). The up-regulated genes in cluster 3 represented stress response JNK/SAP kinases, and in cluster 1 pro-inflammatory and interferon response genes (cytokine secretion, response to interferon gamma) (Fig. 1e).
Overall, our global analyses of the transcriptional landscape during inflammation reveals loss of anabolic capacity as neutrophils leave the BM, transient reduction in their toxic potential coupled with gain of signal transduction in the circulation, and final acquisition of an inflammatory and effector profile at the site of challenge.
Chromatin changes underpin transcriptional activation
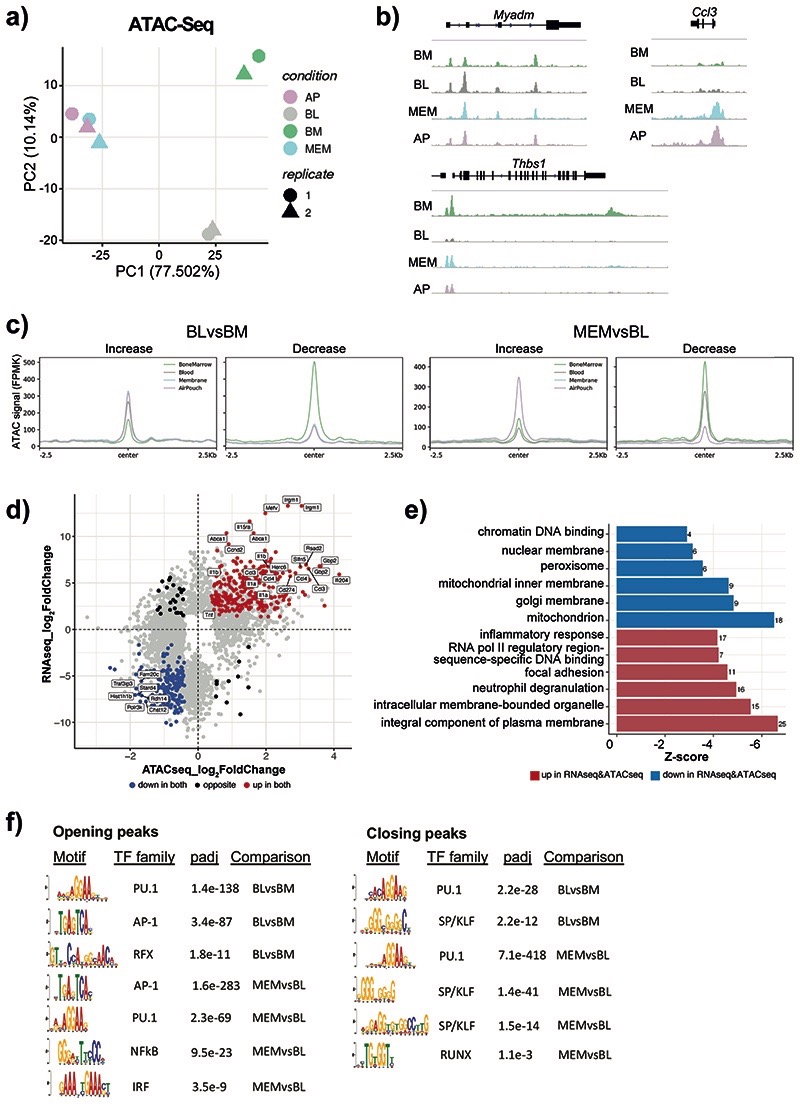
Secondly, we mapped chromatin changes associated with neutrophil activation in vivo (Fig. 1a). The PCA analysis of 11,881 differentially accessible ATAC-Seq peaks (DAPs) (p-adj < 0.05) revealed marked diversity in chromatin landscapes between neutrophils in the BM, blood and membrane (Fig. 2a), therefore chromatin remodelling is likely to underpin the changes in transcriptional profiles seen along the inflammatory cascade. Remarkably, we observed no further chromatin remodelling events at the transition from inflamed tissue to exudate (Fig. 2a), suggesting that the detected change in gene expression at this final step of neutrophil migration does not require global alterations in transcriptional control.
Fig. 2. Neutrophils dynamically alter their chromatin landscape en route to the site of inflammation.
a) ATAC-Seq analysis was conducted on Ly6Ghi CD11b+ cells sorted from the BM, blood, membrane, and air pouch exudate in mice subjected to air pouch model and zymosan challenge for 4 hours. ATAC-Seq peak calling with MACS2 revealed 47,164 peaks detected across all four neutrophil stages. Principal component analysis (PCA) of 11,881 differentially accessible ATAC-Seq peaks derived from ATAC-seq analysis (n=50,000 cells/samples) of neutrophils isolated from the bone marrow, blood, membrane and exudate of two mice subjected to the air pouch model and zymosan challenge.
b) Representative snapshots of normalised read counts (FPKM) at gene loci.
c) Distribution histogram of differentially accessible ATAC-seq peaks over 2.5 kb regions centered on the peaks in neutrophils from different compartments.
d) Intersection of RNA-seq and ATAC-seq data: genes which are both upregulated and located in the regions of opening ATAC-Seq peaks (increased chromatin accessibility) (as in Fig. 2b) are highlighted in red, genes which are both downregulated and located in the regions of closing ATAC-Seq peaks (decreased chromatin accessibility) are highlighted in blue.
e) Gene ontology analysis of genes that are differentially expressed and located in differentially accessible regions (as in Fig. 2c). The top 6 gene ontology terms for upregulated genes with opening peaks (red) and downregulated genes with closing peaks (blue) are shown.
f) De novo motif enrichment analysis for ATAC-Seq peaks increasing (left) and decreasing (right) in accessibility using MEME-ChIP. Numbers indicate adjusted p values.
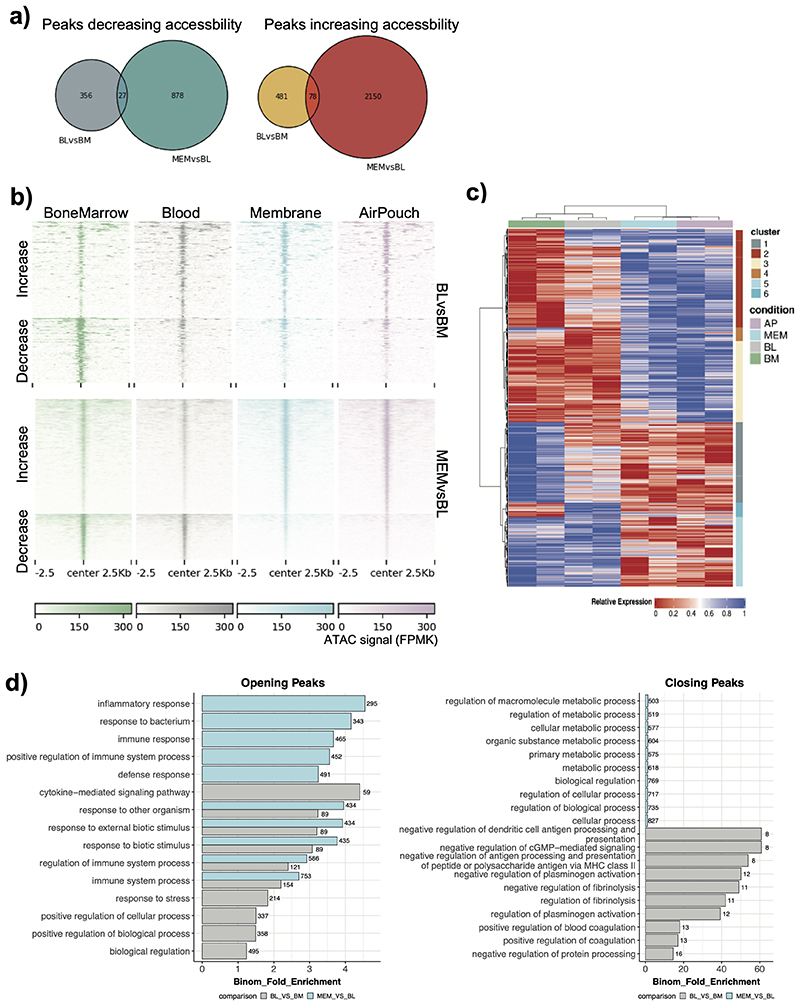
The ATAC-seq analyses identified two distinct remodeling events, the transition of neutrophils from BM to blood (481 opening and 356 closing peaks), and from blood to the inflamed tissue (2,150 opening and 878 closing peaks) (Extended Data Fig. 3a). For instance, accessibility of the myeloid differentiation marker Myadm increased as neutrophils were released into the blood, whereas the Thbs1 locus closed. In turn, the basally inaccessible promoter of Ccl3 opened drastically once neutrophils reached the site of inflammation (Fig. 2b). The analysis of DAPs over 2.5 kb regions centered on the peaks revealed comparable number of peaks with increased and decreased accessibility at the two transition points: BM-to-blood and blood-to-tissue (Fig. 2c, Extended Data Fig. 3b), and suggested that neutrophil reprogramming is parsimonious and under strict control.
Hierarchical clustering of the DAPs identified six clusters of distinct patterns of chromatin behavior, including the ones that gained or lost accessibility at the BM-to-blood transition (clusters 1 and 2), at the blood-to-tissue transition (clusters 5 and 3), or transiently in blood (clusters 4 and 6) (Extended Data Fig. 3c). When DAPs were mapped to the neighboring genes, the blood-to-tissue transition was linked to increased accessibility of inflammatory response regulators and signaling pathways; while the BM-to-blood transition was mainly associated with antigen presentation and metabolic activity (Extended Data Fig. 3d). Next, we compared the change in accessibility in promoter proximal peaks to that of the associated gene expression levels (Fig. 2d). The categories of genes which showed both upregulation of gene expression and increase in chromatin accessibility included inflammatory response, neutrophil degranulation, and focal adhesion (Fig. 2e).
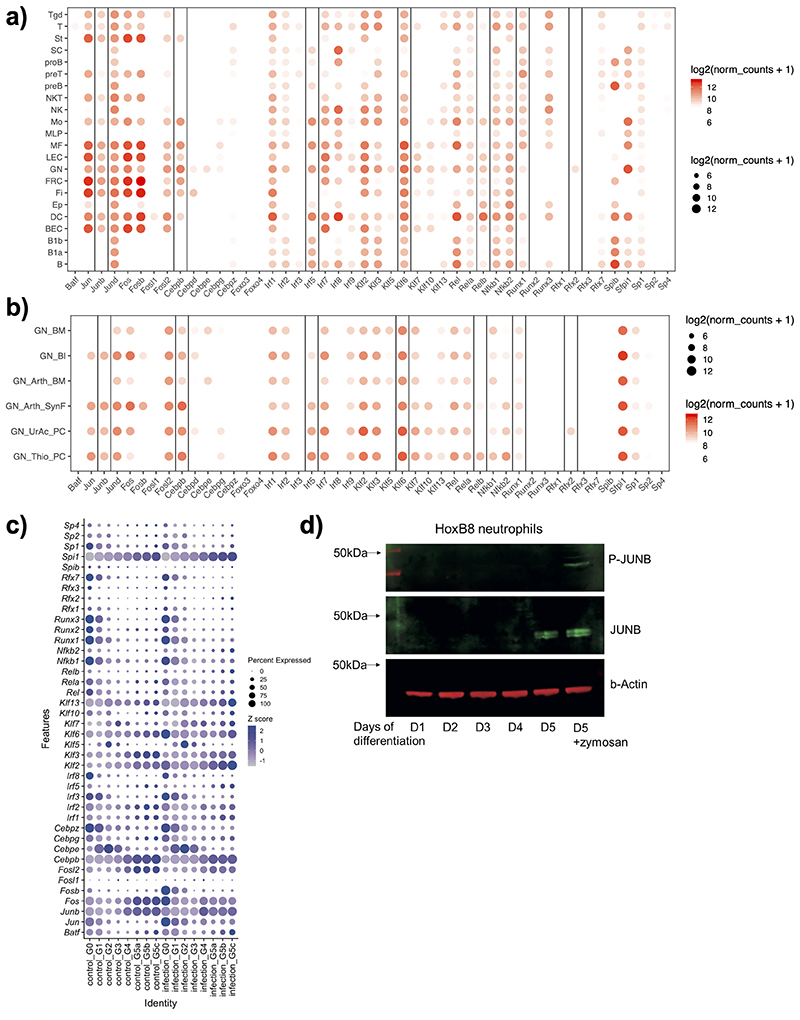
By conducting de novo motif discovery at DAPs from BM-to-blood and blood-to-tissue (membrane) we identified putative TFs controlling neutrophil inflammatory responses (Fig. 2f). Consistent with the known role of PU.1 in myeloid cell development30, PU.1 motifs were detected at DAPs at both transitions (Fig. 2f). Other TFs displayed greater selectivity: regulatory factor X (RFX) motifs were detected exclusively at peaks with increasing accessibility from BM-to-blood, while Interferon regulatory factor (IRF) and Nuclear Factor kB (NF-kB) motifs - at peaks with increased accessibility from blood-to-membrane (Fig. 2f). Activator protein 1 (AP-1) motifs were detected at both transitions, but more strongly enriched in the blood-to-membrane opening peaks. We also noted SP/KLF, and RUNX motifs at peaks with reduced accessibility from BM-to-blood and blood-to-membrane. In search of TFs highly expressed in neutrophils, we checked the expression of each family member across immune cells (Extended Data Fig. 4a) or neutrophil populations (Extended Data Fig. 4b) at ImmGen31. Rfx2 was the only gene of the RFX family and Runx1 of the RUNX family expressed in neutrophils, while Klf6 expression was strongest among the KLF family members (Extended Data Fig. 4a). Furthermore, we queried an scRNA-seq dataset which mapped neutrophil sub-populations G0 to G5 to progressively maturing neutrophils11. Runx1 expression was highest at the earliest stages of neutrophil differentiation (G0-G3), whereas RelB, Irf5 and JunB expression increased with neutrophil maturation (G4-G5) and remained unaffected by E. coli challenge. Klf6 expression was detected throughout G0-G5 populations (Extended Data Fig. 4c).
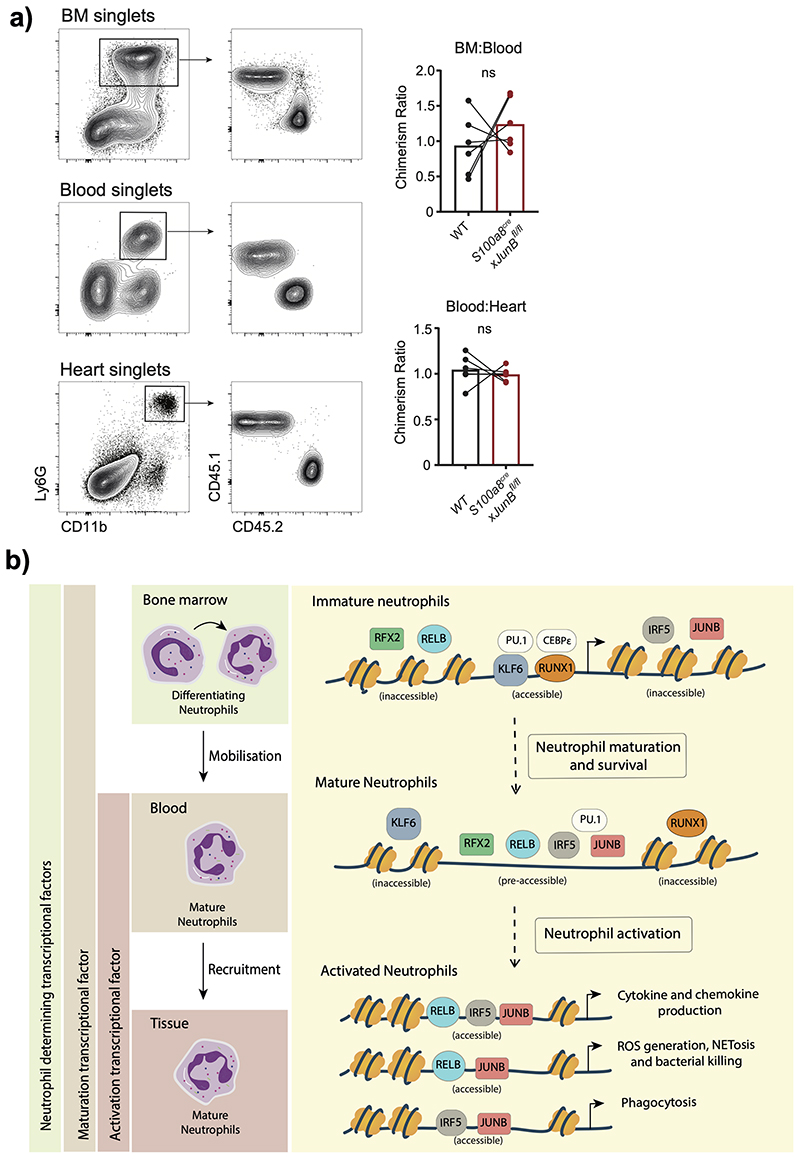
Taken together, these data suggest an incremental program of neutrophil activation, with RFX2, KLF6, RUNX1 linked to initial transition of neutrophils to blood, and ongoing neutrophil maturation, whereas signal-dependent transcription factors JUNB, RELB, IRF5 predicted to play a role in the inflamed tissue.
BM-to-blood transition TFs control neutrophil maturation
For further functional validation of RFX2, KLF6, RUNX1, JUNB, RELB, IRF5, as well as previously noted neutrophil TFs C/EBPβ32 and CEBPε33, we utilized a model system of immortalised myeloid HoxB8 progenitor cells, which differentiate into non-proliferating neutrophils after G-CSF-induced ex vivo differentiation for 5 days34. At day 1 (D1)/D2 they resemble myelocytes/metamyelocytes and express c-Kit, CXCR4 and CD49d; at D3/D4 - band neutrophils; at D5 mature neutrophils expressing CXCR2 and CD10135. We confirmed highest protein levels of JUNB in D5 neutrophils (Extended Data Fig. 4d), matching the mRNA expression data (Extended Data Fig. 4c) Stimulation with zymosan led to JUNB phosphorylation without affecting its protein levels (Extended Data Fig. 4d), indicating the post-translational role of inflammatory signals in activation of signal-dependent TFs.
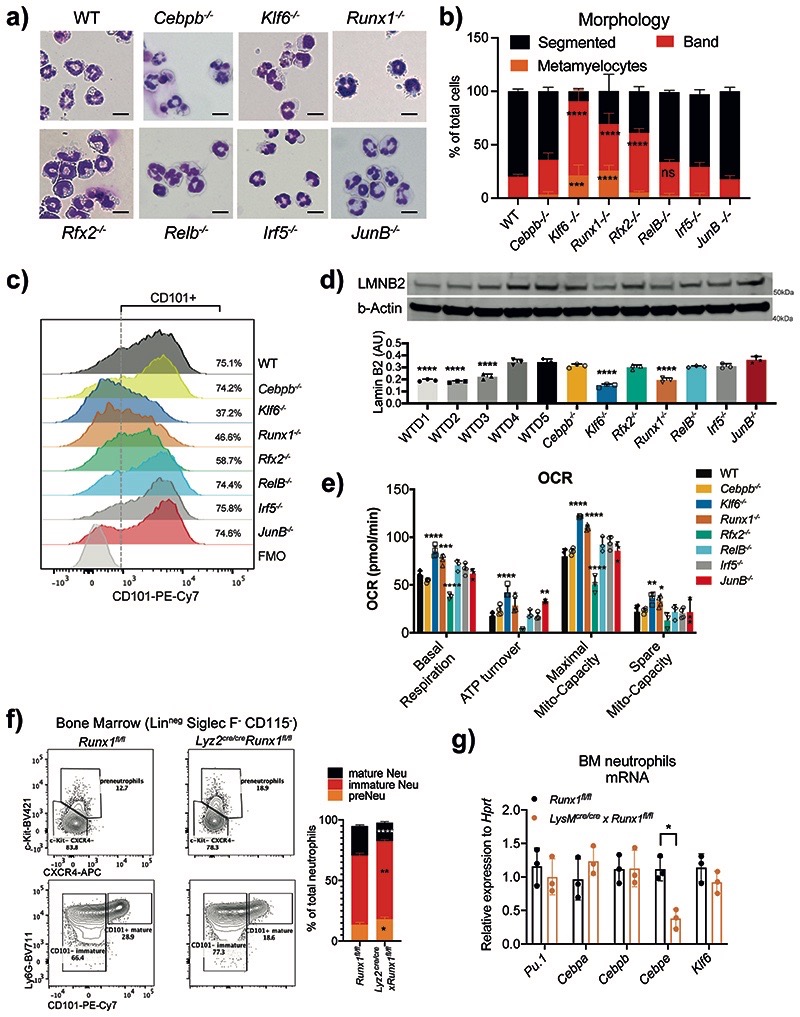
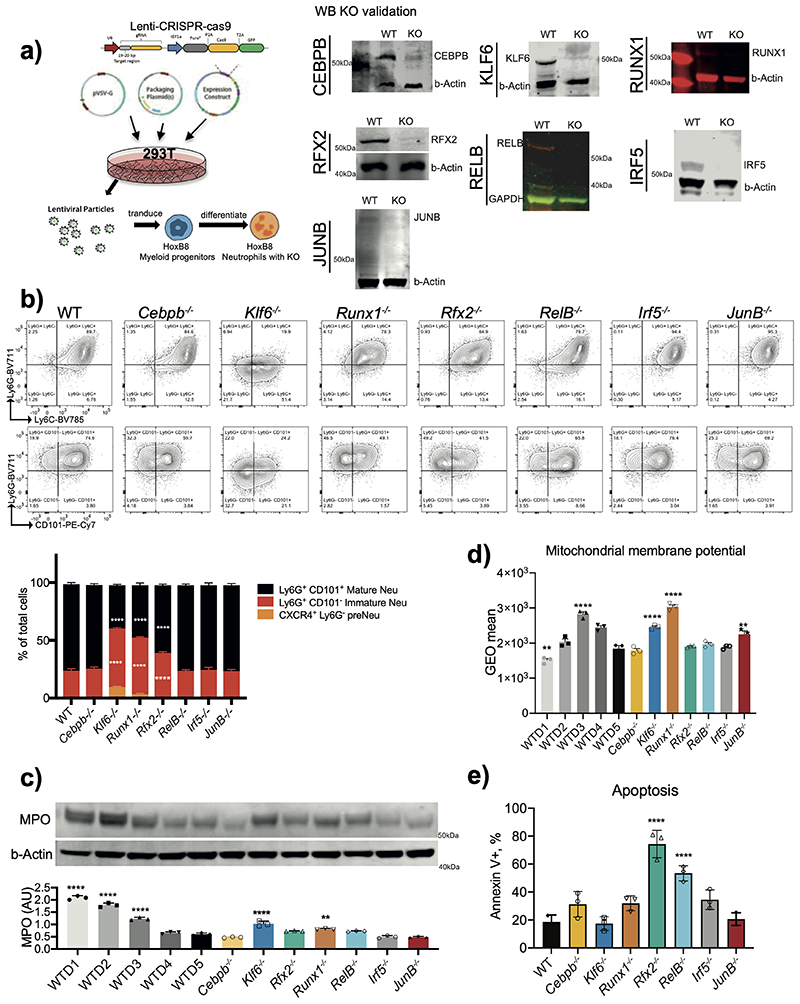
Using CRISPR/Cas9, we generated stable knockout (KO) lines for selected TFs in Hoxb8 progenitors, and validated their deletion by western blot analysis (Extended Data Fig. 5a). After 5 days of ex vivo differentiation, HoxB8 progenitors with genetic deletion of Irf5, JunB or Cepbβ genes gave rise to morphologically mature neutrophils, whereas Klf6-/- and Runx1-/-cells resembled a mix of band and immature neutrophils, suggesting a roadblock in neutrophil maturation (Fig. 3a,b). Deletion of Rfx2 and RelB affected neutrophil maturation to a lesser extent (Fig. 3a,b). CEBPε-deficient cells did not survive beyond D3 of ex vivo differentiation, consistent with the previously assigned critical role in neutrophil development33. FACS analysis confirmed that KLF6-, RUNX1-, RFX2-deficient cells generated a lower percentage of fully mature (Ly6GhiCD101+) neutrophils (Extended Data Fig. 5b). Klf6–/–, Runx1–/–, Rfx2–/– also expressed lower levels of CD101, a marker of mature neutrophils2, than WT cells (Fig. 3c).
Fig. 3. RUNX1 and KLF6 deficiency impairs the maturation of neutrophils.
a) Morphology assessment of WT and indicated KO HoxB8 neutrophils differentiated for 5 days. Scale bar represents 10μm. Representative images from three independent experiments are shown.
b) Quantification of different maturation stages in WT and TF-deficient HoxB8 neutrophils as in A). The results are expressed as percentages of segmented, band neutrophils and metamyelocyte, and at least 200 cells counted from different fields. Data are shown as means and SD from three independent experiments. Significant differences compared with the WT control group are denoted as: ns, not significant, **P<0.01, ***P<0.001, and ****P<0.0001; (two-way ANOVA with Dunnett’s multiple comparisons test).
c) Differential expression of CD101 in HoxB8 neutrophils differentiated for 5 days. Data are shown as a representative of three independent experiments.
d) Lamin-B2 (LMNB2) expression in HoxB8 neutrophils. Top: one representative Western blot probed for LMNB2 and b–Actin is shown. Bottom: The arbitrary units of LMNB2 expression normalized to b–Actin amount are calculated and shown as means and SD from three independent experiments. Significant differences compared with WT cells are denoted as: ****P<0.0001; (Oridinary one-way ANOVA with Dunnett’s multiple comparisons test).
e) Oxygen consumption rate (OCR) of WT and indicated KO HoxB8 neutrophils. Data are shown as means and SD from three independent experiments. Significant differences compared with WT day5 neutrophils are denoted as: *P<0.05, **P<0.01, ***P<0.001, and ****P<0.0001; (Oridinary two-way ANOVA with Turkey’s multiple comparisons test).
f) Runx1 deficiency affects neutrophil maturation in vivo. Left: representative scatter plot of neutrophil subsets from Runx1fl/fl and Lyz2Cre/cre xRunx1fl/fl mice. Right: Statistical analysis of percentages of indicated neutrophil subsets.
g) Pu.1, Cebpa, Cebpb, Cebpe and Klf6 mRNA expression in CD11b+ Ly6G+ neutrophils sorted from Runx1fl/fl and Lyz2Cre/cre xRunx1fl/fl mice.
f, g) Data are shown as means and SD derived from three mice. Significant differences compared with WT mice are denoted as: *P<0.05, **P<0.01, ***P<0.001, ****P<0.0001; (RM two-way ANOVA with Šidák’s multiple comparisons test).
Expression of primary granule enzyme myeloperoxidase (MPO) is downregulated during neutrophil maturation2. We observed the same trend in WT but not Klf6–/–, Runx1–/– HoxB8 cells, where MPO levels remained high (Extended Data Fig. 5c). A hallmark of neutrophil terminal maturation is segmentation of the nucleus. LaminB2 (LB2) is considered important in lobulation of the nucleus and becomes a predominant lamin in mature neutrophils36. Indeed, levels of LB2 steadily increased from D1 to D5 of HoxB8 WT differentiation and reached maximum at D4/D5 but remained low in Klf6–/–, Runx1–/– cells (Fig. 3d).
Another feature of neutrophil maturation is the decrease in their mitochondrial activity. Mature neutrophils possess a limited number of mitochondria and are defective in ATP production37. Indeed, mitochondrial membrane potential (MMP), a key indicator of mitochondrial activity and the driving force behind ATP production, was significantly lower in D5, compared to D3 HoxB8 neutrophils (Extended Data Fig. 5d). Consistent with their arrested maturation, Klf6–/– and Runx1–/– neutrophils displayed higher MMP (Extended Data Fig. 5d), compared to WT cells. Interestingly, deletion of JUNB also led to higher MMP, without affecting neutrophil maturation (Fig. 3a,b and Extended Data Fig. 5d). To further investigate a possible impact of selected TFs on the metabolic aspects of neutrophil development, we utilized the Seahorse Assay to measure oxygen consumption rate (OCR), as a key indicator of mitochondrial respiration (Supplementary Fig. 1). Klf6-/- or Runx1-/- neutrophils displayed higher levels of mitochondrial basal respiration, ATP turnover, mitochondrial maximal and spare capacities compared to WT cells (Fig. 3e). Other mutants had little impact on neutrophil mitochondrial activity, with the exception of Rfx2-/-, which on average displayed a lower level in all metabolic measurements (Fig. 3e). We examined if RFX2 deficiency may lead to spontaneous apoptosis, using Annexin V staining, and observed a dramatic increase in apoptotic rate compared to WT (Extended Data Fig. 5e). Deficiency in RELB also led to an increase in neutrophil apoptosis, consistent with the known function of NF-κB in supporting neutrophil survival and blocking spontaneous apoptosis38.
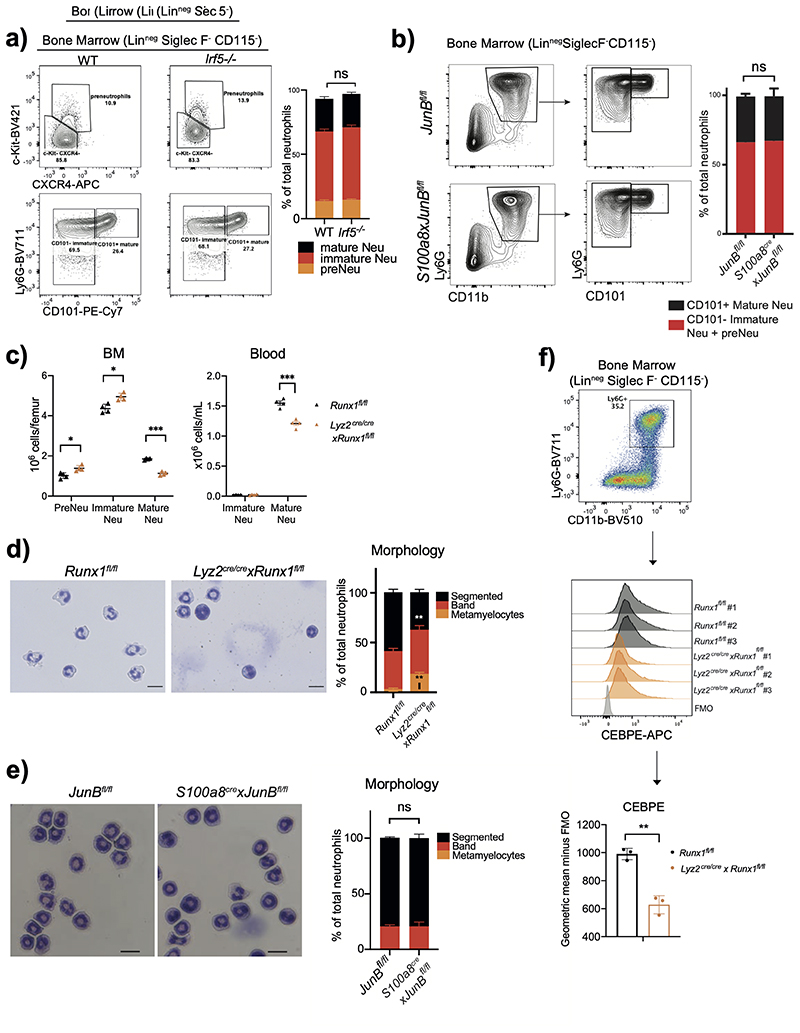
Akin to findings in the HoxB8 system in vitro, conditional deletion of Runx1 in myeloid populations produced a lower percentage (Fig. 3f) and absolute counts (Extended Data Fig. 6c) of Ly6Ghi CD101+ mature neutrophils in the BM of naive Lyz2re/cre xRunx1fl/fl mice, whereas no significant difference was observed in either Irf5 –/– mice or S100a8crexJunBfl/fl mice, with conditional deletion of JunB in neutrophils (Extended Data Fig. 6a,b). Corresponding percentages of immature Ly6Ghi CD101- and c-Kit+CXCR4+ pre-neutrophils were increased in the BM of naive Lyz2cre/cre xRunx1fl/fl mice (Fig. 3f). Morphological characterization revealed a significantly lower percentage of segmented neutrophils and increased number of metamyelocyte-like cells in the BM of Lyz2cre/cre xRunx1fl/fl (Extended Data Fig. 6d), but not S100a8crexJunBfl/fl mice (Extended Data Fig. 6e). We investigated dependence of known neutrophil TF expression on RUNX1 and found that expression of Cebpe was significantly reduced in Runx1-/- neutrophils (Fig. 3g), reminiscent of human data39. Furthermore, CEBPɛ protein levels were significantly reduced in BM neutrophils of Lyz2cre/cre xRunx1fl/fl mice (Extended Data Fig. 6f). Expression of Klf6 was independent of RUNX1 (Fig. 3g).
Thus, KLF6 and RUNX1, associated with neutrophil chromatin closing en route to the tissue, are independently involved in neutrophil maturation. RFX2 and RELB, linked to chromatin opening, support neutrophil survival.
RUNX1 and KLF6 deficiency impairs neutrophil recruitment
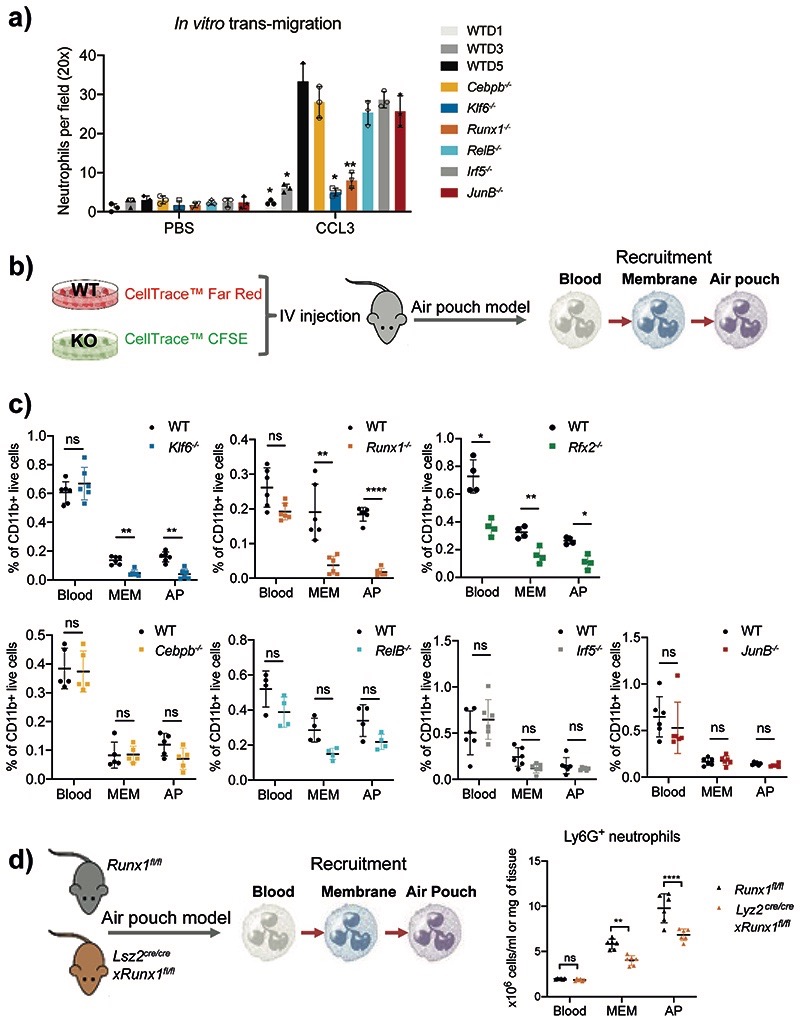
Neutrophil precursors display reduced migratory capacity in tissue2. We hypothesized that KLF6 and RUNX1 deficient neutrophils may display impaired (trans-)migration properties. Using Boyden chamber migration assay, we observed a significant reduction in migration of D5 Runx1-/- and Klf6-/- neutrophils, comparable to D3 WT HoxB8 neutrophils (Fig. 4a).
Fig. 4. Runx1–/– and Klf6–/– neutrophils are deficient in migration and recruitment to inflamed tissue.
a) In vitro migration of HoxB8 neutrophils through a 5μm porous membrane towards CCL3 chemoattractant was measured by Boyden chamber migration assay. Migrated cell numbers were counted as means and SD and are representative of three independent experiments, each assessed by average cell number within different fields and independent replicates. Significant differences compared with WT cells are denoted as: *P<0.05, **P<0.01 (RM two-way ANOVA with Dunnett’s multiple comparisons test).
b) An equal mix of CellTracker™ Red-labelled WT and CellTracker™ CFSE-labelled KO HoxB8 neutrophils was intravenously injected into WT mice, 10 minutes prior to injection of 1mg zymosan into the air pouch cavity. The recruitment of neutrophils was assessed by the percentage of differentially labeled HoxB8 neutrophils recovered from the blood, AP membrane and AP exudate.
c) Percentages of HoxB8 neutrophils recovered in the bone marrow, blood, air pouch membrane and air pouch exudate recovered from mice subjected to air pouch model and zymosan challenge. All results are shown as means and SD from four to six mice within one experiment. Significant differences compared between KO and WT neutrophils are denoted as: *P<0.05, **P<0.01; ns, not significant (RM two-way ANOVA with Šidák’s multiple comparisons test).
d) Experimental set-up (left), and the recruitment (right) of neutrophils. Neutrophil recruitment was assessed by percentages of neutrophils recovered from the blood, air pouch membrane, and air pouch exudate in Runx1fl/fl or Lyz2creRunx1fl/fl mice subjected to air pouch model and zymosan challenge. The results are shown as means and SD derived from six mice. Significant differences compared between Runx1fl/fl or Lyz2creRunx1fl/fl mice are denoted as: **P<0.01, ****P<0.0001; ns, not significant (RM two-way ANOVA with Šidák’s multiple comparisons test).
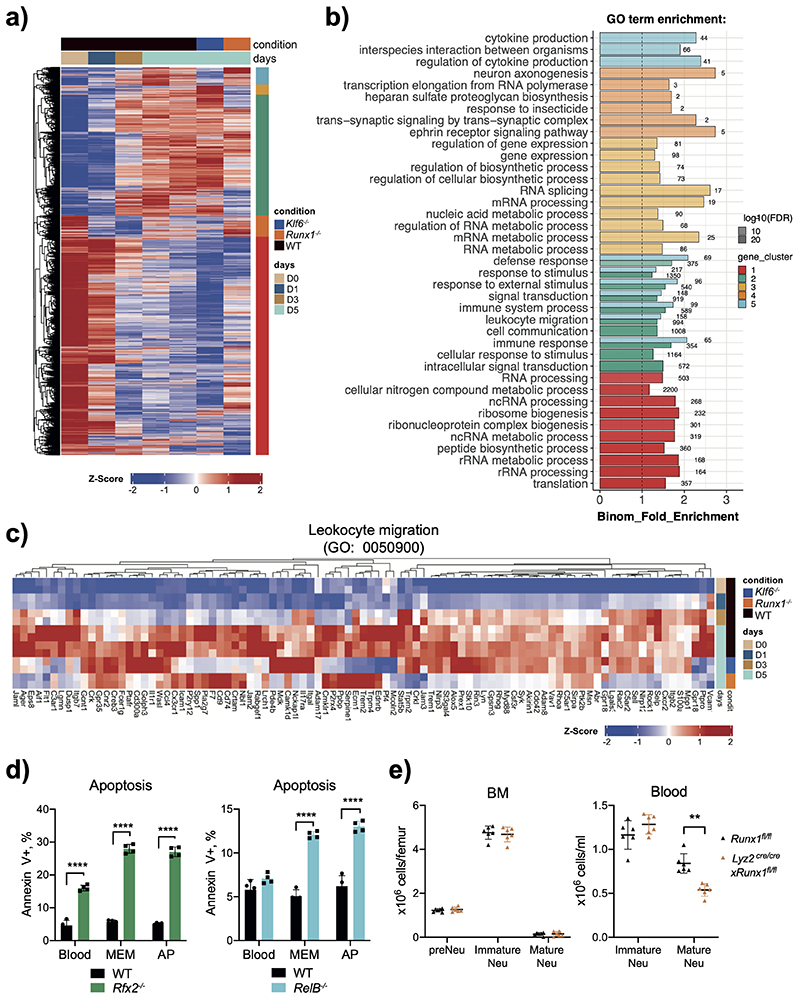
To assess the impact of RUNX1 and KLF6 on transcriptional programs involved in neutrophil maturation and migration, we performed mRNA-seq analysis of WT Hoxb8 neutrophils at D0, D1, D3 and D5 and of Runx1-/- and Klf6-/- neutrophils at D5. 3,306 and 2,611 genes were differentially expressed in Runx1–/– and Klf6–/– neutrophils compared to D5 WT cells, respectively. Hierarchical clustering of the DEGs identified five clusters, which encompassed genes downregulated (clusters 1 and 4) or upregulated with maturation (cluster 2, 3 and 5). Genes in clusters 2 and 5 were downregulated in Runx1–/– or Klf6–/– neutrophils, respectively (Extended Data Fig. 7a). GO annotation analysis revealed that these two clusters encompassed transcriptional programs of immune responses, cytokine production and leukocyte migration (Extended Data Fig. 7b). Genes in clusters 4 and 3 were upregulated in Runx1–/– or Klf6–/– neutrophils, respectively, with programs capturing metabolic and biosynthetic processes (Extended Data Fig. 7b). RUNX1 and KLF6 controlled a significant number of genes involved in leukocyte migration, such as important cell adhesion and chemotaxis molecules including Cxcr2, Sell, S100a8 or Itgal for RUNX1; and Vcam1, Cd9, C3ar1, Cx3cr1 and Icam1 for KLF6 (Extended Data Fig. 7c).
To examine the role of selected TFs in neutrophil recruitment in vivo, we intravenously injected an equal mix of CellTracker™ Red-labelled WT and CellTracker™ CFSE-labelled KO HoxB8 neutrophils into the AP cavity (Fig. 4b). The recruitment of WT and KO cells was monitored at 4h post zymosan injection (Supplementary Fig. 2). We observed reduced infiltration of Klf6 –/– Runx1–/– and Rfx2–/– HoxB8 neutrophils into the sites of inflammation, while the recruitment of C/ebpβ–/–, RelB–/–, Irf5–/– and JunB–/– HoxB8 neutrophils was unaffected (Fig. 4c). Deficiency in RELB and RFX2, shown to accelerate neutrophil apoptosis at steady state (Extended Data Fig. 5e), also limited neutrophil survival upon inflammation, with RFX2 showing the strongest effect in all compartments (Extended Data Fig. 7d).
When Lyz2cre/crexRunx1fl/fl and control Runx1fl/fl mice were subjected to the AP model, zymosan induction led to depletion of mature neutrophils in the BM and stimulated egress of immature neutrophils into the circulation (Extended Data Figs. 7e, 1g,h), with a shift towards fewer mature neutrophils and a trend towards higher number of immature neutrophils in the blood of Lyz2cre/crexRunx1fl/fl mice (Extended Data Fig. 7e). The total number of neutrophils in circulation was comparable between the genotypes, but the number of neutrophils mobilized into the site of inflammation was significantly lower in the Lyz2cre/cre xRunx1fl/fl mice (Fig. 4d), most likely attributed to fewer circulating mature neutrophils (Extended Data Fig. 7e).
In summary, our data place KLF6 and RUNX1 at the apex of neutrophil differentiation cascade, where they may independently control multiple associated processes, including neutrophil segmentation, migration, granular content and metabolism.
RELB, IRF5, JUNB control neutrophil activation and effector functions
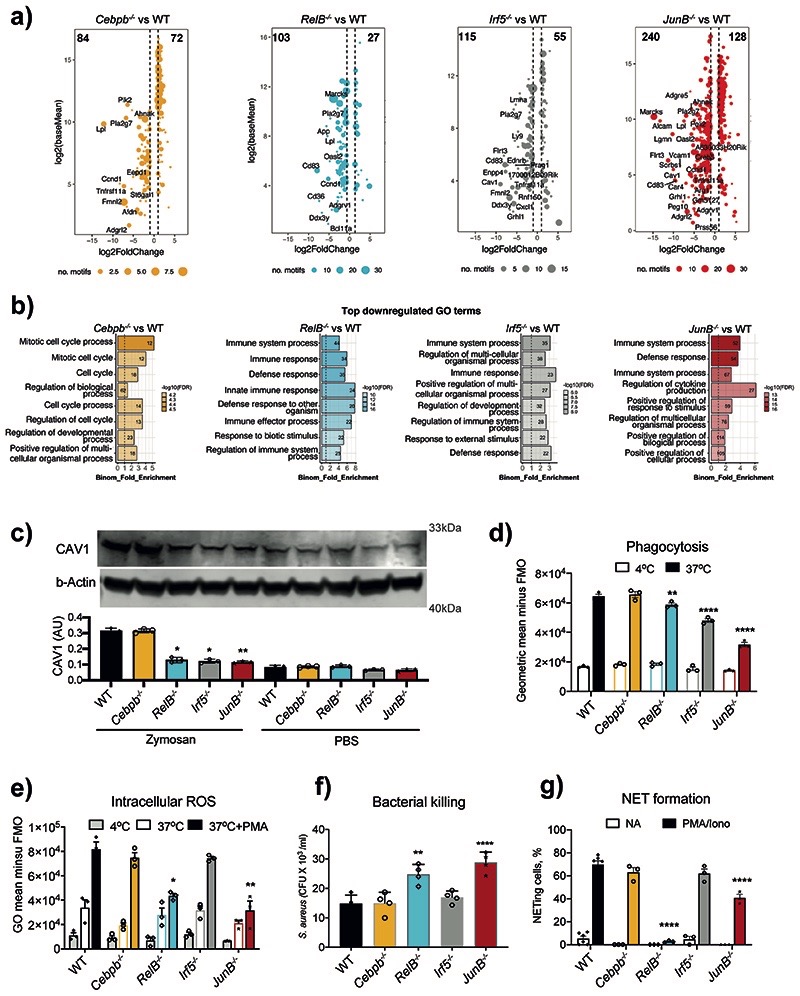
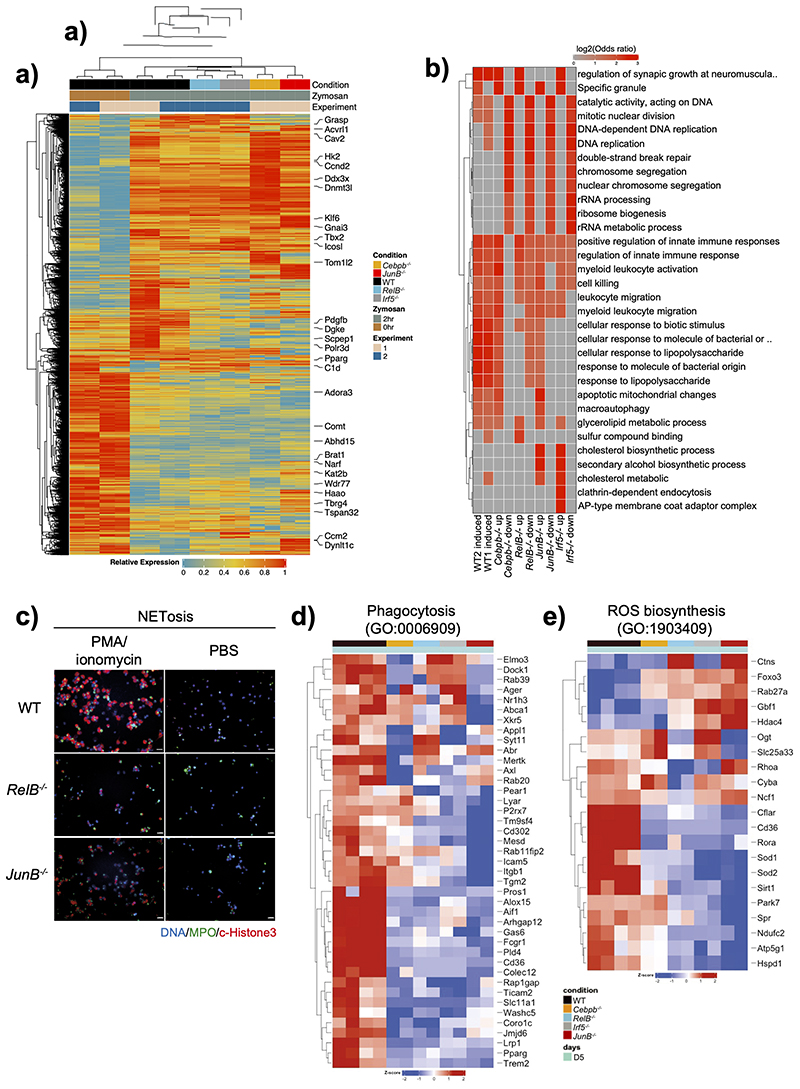
Next, we investigated whether TFs associated with chromatin opening, expressed more highly in circulating, activated, and tissue neutrophils, and not implicated in neutrophil development (C/EBPβ, RELB, IRF5, JUNB), regulated neutrophil activation. We conducted mRNA-seq analysis of WT and TF-deficient HoxB8 neutrophils challenged with zymosan for 2h. Expression of 4,887 genes was affected in WT cells by zymosan stimulation. 2914, 3047, 3691 and 6292 genes were differentially expressed in Cebpb-/-, RelB–/–, Irf5–/– or JunB–/– zymosan-stimulated neutrophils compared to corresponding WT cells, respectively (Extended Data Fig. 8a). GO annotation analysis of global gene expression revealed the role for RELB, IRF5 and JunB in regulation of zymosan-induced immune genes and pathways, as well as contribution to zymosan-independent cellular processes, e.g. DNA recombination and replication, or ribosome biosynthesis (Extended Data Fig. 8b). Since both direct and indirect targets of selected TFs contribute to the DEG pool, we attempted to define putative “target genes” for each TF. Firstly, we searched for consensus TF binding motifs in the regions of open chromatin identified by ATAC-Seq (Fig. 2). Then, we selected genes proximal to these motifs. Lastly, we intersected these genes with the DEG for a corresponding TF KO in stimulated Hoxb8 neutrophils (Extended Data Fig. 8a) and found that JUNB appeared to control the highest number of “target genes”, whereas RELB, IRF5 and CEBPβ had a more limited impact (Fig. 5a). GO annotation analyses revealed JUNB, RELB and IRF5 were likely to control immune genes and categories, while C/EBPβ was most likely involved in regulation of cellular processes (Fig. 5b). For example, calveolin 1 (Cav1), a gene target for both IRF5 and JUNB (Fig. 5a), is involved in neutrophil activation, adhesion, and transendothelial migration40. We confirmed that CAV1 protein expression was significantly diminished in RelB–/–, Irf5–/– or JunB–/–, but not Cebpb-/- zymosan-stimulated neutrophils (Fig. 5c).
Fig. 5. RELB, IRF5 and JUNB control immune responses of neutrophils.
a) Putative “target genes” for each TF: differentially expressed genes (HoxB8 WT vs TF KO in zymosan-induced HoxB8 neutrophils, padj < 0.05, fold change > 2) stratified by the identified binding sites for corresponding TFs (FIMO p-value < 0.0001) within differentially accessible ATAC-seq peaks (padj < 0.05, fold change > 1.5) in gene vicinity.
b) GO biological-process terms enriched for putative “target genes” (as in Fig. 5a).
c) Caveolin-1 (CAV1) expression in HoxB8 neutrophils. Top: one representative Western blot probed with antibodies specific for CAV1 and b–Actin is shown. Bottom: statistical analysis of Cav1 expression normalized against b–Actin amount in the lysates (and expressed as arbitrary unit of CAV1). Data are shown as means and SD from three independent experiments. Significant differences compared with the unstimulated WT neutrophils are denoted as: *P<0.05, **P<0.01; (Oridinary one-way ANOVA with Dunnett’s multiple comparisons test).
d) Phagocytosis of fluorescein conjugated E. coli by WT and indicated KO HoxB8 neutrophils, measured by flow cytometry.
e) Intracellular ROS production by WT and indicated KO HoxB8 neutrophils.
f) Bacterial killing by HoxB8 neutrophils incubated with Staphylococcus aureus (S. aureus) for 90 minutes before cell lysis. Values represent absolute CFU counts generated by surviving bacteria. Data are shown as means and SD derived from four independent experiments.
g) NET formation in response to stimulation by PMA/Ionomycin in WT and indicated KO HoxB8 neutrophils. The data are expressed as percentages of neutrophils undergoing NETosis out of at least 200 cells counted from different fields and independent replicates. Data are shown as means and SD derived from three independent experiments.
d, e, g) Significant differences compared between KO and WT neutrophils are denoted as: *P<0.05, **<0.01, ***<0.001, ****P<0.0001; (DM one-way ANOVA with Dunnett’s multiple comparisons test).
To validate the importance of selected TFs in neutrophil activation, we examined the consequence of their knockout on neutrophil effector functions2. IRF5- and JUNB-deficiency affected the ability of neutrophils to phagocytose bacteria (Fig. 5d), while RELB and JUNB were important for ROS production (Fig. 5e), bacterial killing (Fig. 5f) and NET formation (Fig. 5g, Extended Data Fig. 8c). This was supported by decreased expression of key genes involved in ROS generation and phagocytosis (Extended Data Fig. 8d,e). For example, RELB was required for expression of Cyba and Ncf1, two components of the NADPH oxidase complex (Extended Data Fig. 8d). JUNB had the strongest effect on genes involved in phagocytosis, such as Cd302, Icam5, Itgb, Tgm2 (Extended Data Fig. 8e).
Thus, among the TFs active in the blood-to-tissue transition, JUNB demonstrated the most consistent overall effect on neutrophil effector functions, while the contributions of IRF5 and RELB were more nuanced, and of C/EBPβ - minimal.
RELB, IRF5, JUNB control expression of inflammatory mediators
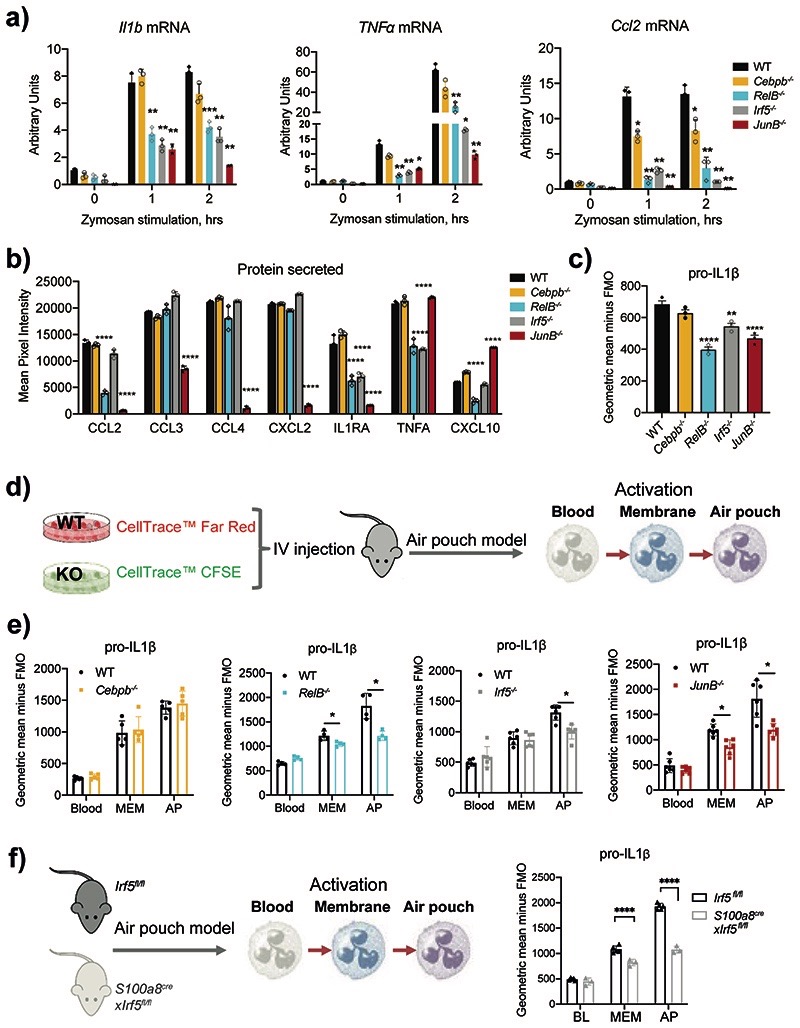
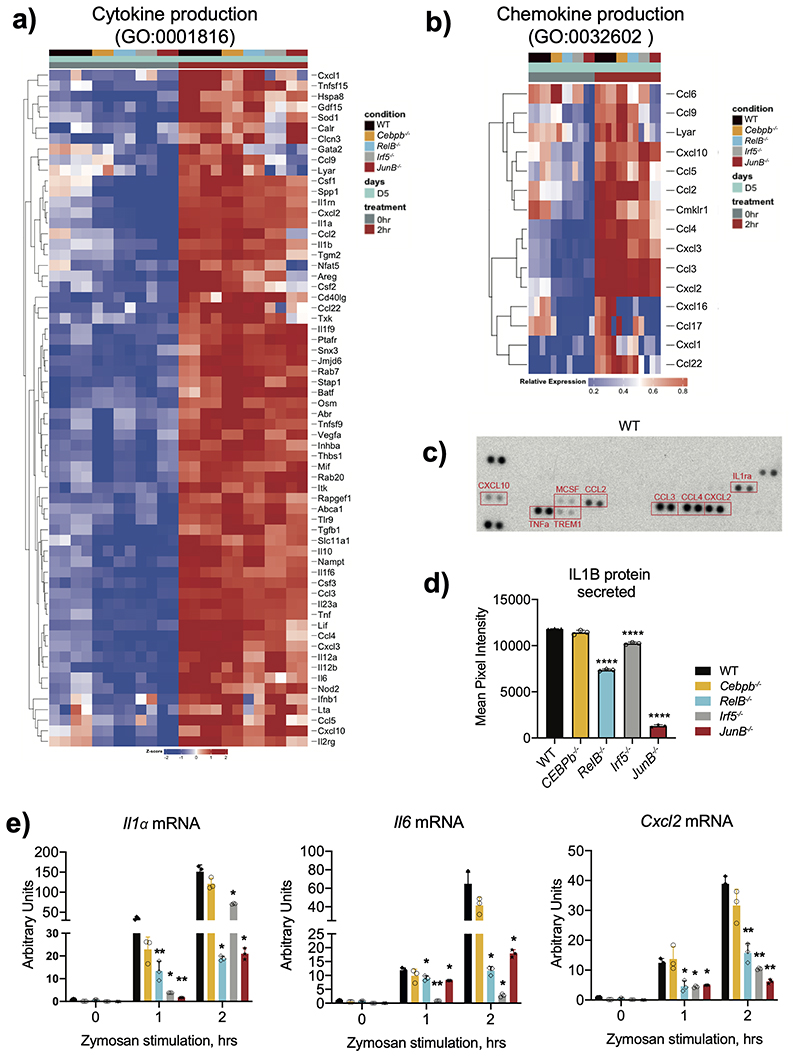
Expression of cytokines and chemokines by HoxB8 neutrophils was strongly and globally upregulated in response to zymosan treatment and affected by RELB-, IRF5- and JUNB-deficiency (Extended Data Fig. 9a,b). Zooming in, we observed a significant reduction in mRNA expression of pro-inflammatory cytokines Il1a, Il1β, Tnf, Il6 and chemokines Ccl2, Cxcl2 in zymosan-stimulated RelB–/–, Irf5–/– or JunB–/– cells (Fig. 6a, Extended Data Fig. 9c). Impaired mRNA expression led to reduced protein production, measured by multiplex antibody array (Extended Data Fig. 9d). After a 15min (short) exposure we detected CCL2, CCL3, CCL4, CXCL2, CXCL10, TNF, IL1ra (Fig. 6b). RelB–/– cells displayed reduced levels of CCL2, IL1ra, TNF and CXCL10, Irf5–/– - of IL1ra and TNF (Fig. 6b). Once again, deficiency in JUNB affected the widest range of mediators (Fig. 6b). After 30 min (long) exposure we detected a significant decrease in the secretion of IL1B by RelB–/–, Irf5–/– and JunB–/– HoxB8 neutrophils in comparison to WT cells (Extended Data Fig. 9e), mirrored by a decrease in pro-IL1B expression (Fig. 6c).
Figure 6. RELB, IRF5 and JUNB deficiency impair neutrophil inflammatory responses.
a) Il1β, Tnf-α and Ccl2 mRNA induction in HoxB8 neutrophils stimulated with zymosan (50ug/ml) for 0, 1, 2 hours. Gene expression was measured by qPCR. Data are shown as means and SD from three independent experiments.
b) Cytokine and chemokine production of HoxB8 neutrophils stimulated with zymosan (50ug/ml) for 2 hours. Cytokines and chemokines secreted into the supernatant were measured by proteome array. Results are shown as means and SD from three biologically independent samples.
a, b) Significant differences compared between KO and WT neutrophils are denoted as: *P<0.05, **P<0.01, ***P<0.001, and ****P<0.0001; (DM one-way ANOVA with Dunnett’s multiple comparisons test).
c) pro-IL1β production by HoxB8 neutrophils stimulated with zymosan (50ug/ml) for 2hours, assessed by intracellular flow cytometry staining. Data are shown as means and SD derived from three independent experiments. Significant differences compared between KO and WT neutrophils are denoted as: *P<0.05; ns, not significant (Ordinary one-way ANOVA with Dunnett’s multiple comparisons test).
d) Experimental set-up of differentially labelled WT and TF KO HoxB8 neutrophils adoptively transferred into air pouch model of acute inflammation, and the activation of neutrophils was assessed by pro-IL1β expression.
e) Expression of pro-IL1β, as measured by flow cytometry, in HoxB8 neutrophils recovered from the bone marrow, blood, air pouch membrane and air pouch exudate of mice subjected to the air pouch model and zymosan challenge. Data are shown as means and SD from four to six mice within one experiment.
f) Experimental set-up (left), and pro-IL1β production (right) by neutrophils in Irf5fl/fl or S100a8creIrf5fl/fl mice subjected to the air pouch model and zymosan challenge. Data are shown as means and SD from five mice.
e, f) Significant differences compared between Irf5fl/fl and S100a8creIrf5fl/fl mice are denoted as: ****P<0.0001; (RM two-way ANOVA with Šidák’s multiple comparisons test).
We used an adoptive HoxB8 neutrophil transfer into the AP model (Fig. 4c) to examine the effect of TF KO on neutrophil ability to produce inflammatory mediators in vivo (Fig. 6d). RelB–/–, Irf5–/– or JunB–/– HoxB8 neutrophils in the membrane and/or exudate produced less pro-IL1β than WT neutrophils (Fig. 6e). When mice with conditional deletion of Irf5 in neutrophils, S100a8crexIrf5fl/fl, were subjected to the AP model, IRF5-deficient neutrophils displayed a significant reduction in pro-IL1β at the site of inflammation (Fig. 6f), matching the adoptive transfer experiments (Fig. 6e).
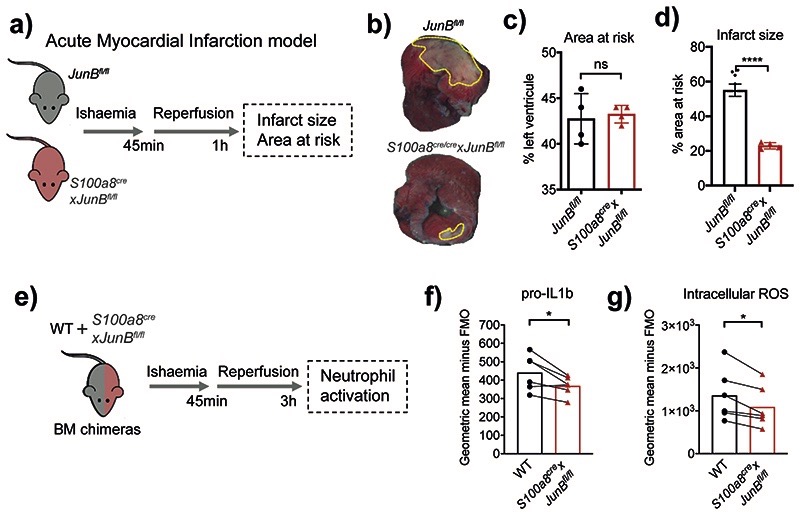
Finally, we sought to demonstrate that interference with neutrophil activation would curb pathological inflammation in vivo by applying a neutrophil-dependent model of acute myocardial infarction (AMI) induced by ischemia reperfusion of the left anterior descending coronary artery6 to S100a8crexJunBfl/fl mice (Fig. 7a). The analysis revealed a significant reduction in infarct size in mice with neutrophil-specific ablation of JunB compared to littermate controls (Fig. 7b–d). To examine whether JUNB intrinsically controls neutrophil activation at inflamed sites, we generated mixed chimeric mice harboring both control and JUNB-deficient (S100a8crexJunBfl/fl) neutrophils by BM transplantation into WT recipient mice. 3h after induction of cardiac ischemic-reperfusion injury we analyzed neutrophils in the myocardia and confirmed no significant change in the chimerism ratio in BM:Blood or Blood:Heart transitions (Extended Data Fig. 10a), corroborating our finding that neutrophil recruitment to the site of inflammation is not affected by depletion of JUNB in neutrophils (Fig. 4c). In agreement with our in vitro and in vivo analyses (Fig. 5e, 6c,e), we found consistent reductions in levels of pro-IL1b (Fig. 7e) and intracellular ROS (Fig. 7f) in JUNB-deficient neutrophils compared to their WT counterparts.
Fig. 7. Neutrophil-specific knock-out of JunB limits pathological destruction of tissue during neutrophil-driven inflammation.
a) Mouse model of acute myocardial infarction. The left anterior descending coronary artery is occluded for 45 min followed by reperfusion for 1 h.
b) Representative images of heart slices stained with triphenyltetrazolium chloride and normalized to area at risk (negative Evans blue staining) from JunBfl/fl and S100a8cre/crexJunBfl/fl mice subjected to ischemia reperfusion. Dotted yellow lines highlight areas of dead myocardium.
c, d) Histological evaluation of left ventricle area at risk (C) and infarct size (D) in mice subjected to ischemia reperfusion. All results are shown as means and SD derived from four mice from each group within one experiment. Significant differences compared between JunBfl/fl and S100a8cre/crexJunBfl/fl mice was determined by unpaired student t test analysis. ns, not statistically significant; *p < 0.05; ****p < 0.0001.
e) Mixed bone marrow chimera setup to measure neutrophil activation in shared inflammatory environment of acute myocardial infarction.
e, g) Production of pro-IL1b (e) or ROS (g), as measured by flow cytometry in WT and JunB-deficient neutrophils in mixed bone marrow chimera mice, subjected to permanent myocardial infarction. Data are shown as means and SD derived from three mice from each group within one experiment. Statistical comparison was made by paired student-t test; *p<0.05.
Together, these data suggest that IRF5, RELB and JUNB have limited roles in neutrophil maturation, but significantly regulate inflammatory cytokines production in vitro and at the sites of inflammation in vivo. Moreover, neutrophil-specific inhibition of JUNB limits pathological destruction of tissue during neutrophil-driven inflammation (Extended Data Fig. 10b).
Discussion
It is becoming increasingly clear that neutrophils, which have previously been considered as transcriptionally inactive cells, display distinct gene expression profiles at different developmental stages2, activation states9 and microenvironments41, 42. Nevertheless, the transcriptional networks that shape neutrophil function have not yet been defined. Here, we investigated the transcriptional and chromatin landscape of neutrophils during sterile inflammation and identified previously unappreciated transition points in neutrophil transcriptional regulation, from bone marrow to the blood and from the blood to the tissue, each associated with the involvement of a distinct set of TFs. Further functional validation of candidate TFs in vitro and in vivo, dissociated cell-state-specific TFs that modulate neutrophil maturation (RUNX1, KLF6) from TFs driving neutrophil effector responses (RELB, IRF5, JUNB) and/or neutrophil survival (RFX2, RELB), thus opening new possibilities for specific stage-specific modulation of neutrophil function in disease.
The capture of transcriptional changes related to neutrophil maturation at the transition from bone marrow to the blood was likely to reflect on differences in proportion of immature Ly6G+CD101- and mature Ly6G+CD101+ neutrophils in the bone marrow and blood samples, consistent with recently published studies2, 11. Genomic and transcriptomic differences separating bone marrow and blood neutrophils may in part be the reason for a long held view on immaturity of mouse neutrophils and their differences with human neutrophils11, 22, 43, 44, as most of mouse studies focused on bone marrow neutrophils and most human studies used blood neutrophils. This highlights the need for careful consideration of the experimental source of cells in neutrophil studies.
In differentially accessible chromatin regions between the bone marrow and blood we identified binding motifs for transcription factors, such as RUNX1 and KLF6, which promote neutrophil maturation. RUNX1 is a TF with a major role in myelopoiesis and it promotes neutrophil terminal differentiation in a Cebpe-dependent manner39, which we confirmed in this study. KLF6 is a TF linked to the pathogenesis of acute myeloid leukemia45, its role in neutrophil maturation has not been previously addressed. Differentiating neutrophils undergo a metabolic reprogramming toward glycolysis upon maturation46, which ensures that neutrophils can function in an inflammatory environment where the oxygen tension may be low or even absent47, 48. At the same time, we and others observed the decrease in their mitochondrial activity during the final stages of neutrophil maturation. In line with their immature phenotype, KLF6- and RUNX1-deficient neutrophils display higher mitochondrial membrane potential, associated with respiratory chain activity and oxidative phosphorylation. They are also characterized by a higher level of mitochondrial basal respiration, ATP turnover, mitochondrial maximal and spare capacities compared to WT. Another consequence of neutrophil maturation is their ability to rapidly migrate toward sites of inflammation2, 22. Indeed, neutrophils deficient in RUNX1 or KLF6 could not efficiently reach the site of inflammation. RNA-seq analysis confirmed that these TFs positively control transcriptional programs upregulated with maturation, such as immune responses or leukocyte migration, but also inhibit programs related to metabolic and biosynthetic processes. Further mapping of transcriptional control of neutrophil differentiation trajectory and functional validation of TFs involved would provide new insights into the current model of neutrophil development. Single-cell RNA-seq profiling of neutrophils2, 11 are the essential basis for such analysis, while emerging spatial genomics technologies would help to avoid impact of cell isolation.
Importantly, factors regulating the transition from blood into the tissue (IRF5, JUNB and RELB) do not affect respiration and mitochondrial function of neutrophils, nor do they impair their migration into the tissue. Instead, they contributed to cytokine and chemokine expression and production and various effector functions, such as phagocytosis, generation of ROS, bacterial killing or NETosis. JUNB demonstrated the strongest overall effect on neutrophil effector functions, consistent with previously reported role of JUNB in setting up neutrophil inflammatory response49. Neutrophil-specific ablation of JUNB has a profound effect on the extent of infarct in the model of acute myocardial infarction, supporting the notion that neutrophil transcriptional reprogramming could offer alternative therapeutic strategies to manage cardiovascular disease. As previously highlighted9, IRF5 plays a role in regulating inflammatory gene expression but also contributes to regulation of neutrophil phagocytosis, while its involvement in ROS production and NETosis is limited. On the contrary, RELB is critical for formation of NETs and drives ROS production via expression of specific subunits of the catalytic NOX2 complex of NADPH. RELA, another member of the NF-kB family, was also implicated in ROS induction in myeloid cells via different NADPH complex subunits50, raising the possibility for their coordinated action.
RFX2 and RELB are critical for neutrophil survival at the steady state and during inflammation. While the role of the NF-κB family in supporting neutrophil survival and blocking spontaneous apoptosis has been previously documented38, the pro-survival function of RFX2 in immune cells has not been previously described. RFX2-deficient mice do not have an obvious embryonic phenotype, but absence of RFX2 results in germ cell apoptosis51, suggesting a general role for RFX2 in controlling cell survival across cell lineages. Considering high levels of RFX2 expression in neutrophils compared to other immune cells, it will be important to examine how Rfx2 –/– mice control infection and inflammation.
In summary, our study provides a significant advance in understanding the molecular mechanisms underlining neutrophil development and function during inflammation by depicting key TF modules that modulate development vs inflammatory responses or survival. It extends our understanding of neutrophil transcriptional reprogramming from adaptation to local tissue environment at homeostasis13, to acquisition of specific effector functions under inflammation. We generate the first draft of the neutrophil transcriptional blueprint in the context of in vivo inflammation, which will undoubtedly be edited and filled in with more details in the future. Moreover, the distinct repertoires of TFs controlling neutrophil maturation and activation may lead to multiple therapeutic strategies tailored to specific conditions. For example, stimulation of neutrophil maturation may be beneficial for post-chemotherapy cancer patients. Inhibition of neutrophil activation, in contrast, may help to reduce the inflammatory burden suffered during inflammation-associated diseases, such as cardiovascular diseases. Induction of neutrophil effector functions may be needed in infectious diseases and early stages of cancer.
Methods
Materials and Reagents
Details of commercially available reagents and other materials used in this study are summarized in Supplementary Table 1.
Air pouch model of acute inflammation
Mice were bred and maintained under SPF conditions in accredited animal facilities at the University of Oxford and were housed in individually ventilated cages at a constant 20-23.3 degree Celsius with 12h dark/light cycle, supplied with food and water and libitum. All experimental procedures were approved by the local Animal Care and Ethics Committees (Oxford and Madrid). Animal housing, handling and experimental procedures in Oxford were conducted under the UK Home Office Project licence to I Udalova. Air pouch model of acute inflammation was established as previous described29. Briefly, C57BL/6J male mice (Charles River) were maintained at 9 weeks of age and allowed to acclimatize for one week. Mice were anaesthetised with isoflurane and 3 ml of air injected subcutaneously to create a dorsal air pouch with a top-up of air 3 d later. At 5 d after the creation of the air pouch, mice were challenged with 1mg zymosan injected directly into the pouch. Challenged mice were culled after 1, 2, 4, 12 and 24 hours after zymosan injection, and bone marrow, blood, membrane and exudate were harvested.
Cell and tissue preparation
Blood was obtained via cardiac puncture and then red blood cells were lysed in ACK lysis buffer (Thermo Fisher). For BM cells, mice femurs were flushed using a 23-gauge needle in PBS and passed through a 70-mm nylon mesh sieve. Membrane tissue was harvested from mice and digested with 20 mL RPMI + 10% FCS +1% PS + 2.5 U/mL Collagenase VIII (Sigma-Aldrich) + 2 U/mL DNAse I (Roche), and passed through a 70-mm nylon mesh sieve. Exudate was passed through a 70-mm nylon mesh sieve. Cells were pelleted by centrifugation at 400 rcf for 5minutes before counting.
Flow cytometry and cell sorting
For the identification of pre-neutrophils, immature and mature neutrophils, cells were washed and pre-incubated with Fc Block (BD) before surface staining with 1:200-diluted fluorophore-conjugated anti-mouse antibodies against CD11b (M1/70), cKit (2B8), Ly6C (HK1.4), Ly6G (1A8), CXCR2 (SA044G4), CXCR4 (2B11) and CD101 (Moushi101), together with exclusion lineage markers that include CD3e (145-2C11), B220 (RA3-6B2), NK.1.1 (PK136), Sca-1 (D7), CD11c (N418), CD19(6D5), Siglec-F (E50-2440) (Supplementary Table1). Upon surface staining, neutrophils were segregated into preneutrophils, immature and mature neutrophils (Supplementary Fig. 3). For intracellular cytokine staining, surface staining was followed by fixation and then permeabilization to allow for intracellular staining with pro–IL-1β (NJTEN3). Flow cytometry acquisition were performed using FACs DIVA (v 6.1.3 on BD LSR and BD LSRFortessa X20). Data analysis was performed using FlowJo v10 (Tree Star, Inc., Ashland OR).
RNA-sequencing analysis
Neutrophils from bone marrow, blood, membrane and exudate were sorted from CX3CR1GFP Ly6GCre-tdTomato mice subjected to air pouch of inflammation, based on the gating strategy depicted in Extended Data Fig. 1f. 300 cell samples were sorted through a 100 μm diameter nozzle into 2 μL of lysis buffer and amplified cDNA was prepared for “small bulk” RNA-sequencing using the Smart-seq2 protocol52. Libraries were prepared using Nextera XT kits (Illumina) and sequenced to a mean depth of 17M read pairs (Illumina HiSeq 4000).
HoxB8 neutrophils differentiated for five days were incubated with Zymosan(50ug/ml) or DMSO vehicle for two hours. Total RNA was extracted using RNeasy mini kit (Qiagen) according to the manufacturer’s instruction. Subsequently, poly-A selected mRNA libraries were sequenced on Illumina HiSeq4000 yielding 20-30x106 150 b.p. paired end reads per sample. These were mapped to the mm10 genome using STAR with the options: “—runMode alignReads –outFilterMismatchNmax 2.” Uniquely mapped read pairs were counted over annotated genes using feature Counts with the options: “-T 18 -s 2 -Q 255.” Differential expression was then analysed with DESeq253. Variance stabilised (VST) counts for all DESeq2 differentially expressed genes, likelihood ratio test, false discovery rates (FDRs) < 0.01, were used for dimensionality reduction and heatmaps. Gene set enrichment analysis was performed using one-sided Fisher’s exact tests (as implemented in the ‘gsfisher’ R package https://github.com/sansomlab/gsfisher/).
ATAC sequencing analysis
ATAC-seq was performed using the published ATAC protocol54. Samples were quality checked for ATAC-seq specific patterning on a bioanalyzer chip and were pooled at an equimolar ratio and sequenced on a HiSeq2500 using 75 b.p. paired-end chemistry the Welcome Trust Centre for Human Genetics, Oxford.
Raw sequencing reads were trimmed with cutadapt prior to mapping to the mm10 version of the mouse genome using Bowtie2 with the following parameters --local --X 2000. PCR duplicates were removed with PicardTools, additionally, reads mapping to chrM, with MAPQ < 10, and insert sizes > 150 bp were removed prior to peakcalling. Peaks were called with MACS2 with the following settings: --format BAMPE --nomodel --keep-dup all --mfold 5 50. Peaks found in at least 2 biological replicates were kept for further analysis and merged peakset consisting of all discovered peaks was used for differential accessibility testing. Reads were counted over the merged peakset using BedTools and tested using DESeq2. Significantly differentially accessible peaks were deemed as having adjusted p-values < 0.05 (LRT test), and adjusted p-values < 0.05, and fold change > 1.5 (Wald test). Gene ontology was conducted using GREAT 55. DeepTools was used to generate normalised BigWigs from all biological replicates, which were merged for visualisation in IGV. ATAC-seq peaks were annotated with the nearest gene and comparisons between mRNA and ATAC -seq data were limited to genes with ATAC-seq peaks within 2.5 k.b. of the TSS.
De novo motif discovery was conducted on DNA sequences from the central regions of differentially accessible peaks. DNA sequences were softmasked to remove repetitive regions and custom background sequences were created from the flanking regions of the DNA sequences with the “fasta-get-markov -m 2” command. Motif analysis was then performed using MEME-ChIP 56 with the options: “-meme-minw 5 -meme-maxw 30 - meme-nmotifs 10”. The motif discovery mode (“-meme-mod”) option was set to “zero or one occurrence per sequence” (zoops). To find occurrences of known motifs within ATAC-seq peaks FIMO56 was used with 1,000 b.p. sequences centred on the ATAC-seq peak summits and peak flanking regions of an equal length were used for the background, as above.
Generation of HoxB8 neutrophils with targeted knockouts
HoxB8 C57BL/6N myeloid progenitors and stem cell factor (SCF)-producing CHO cells were kindly provided by Barbora Walzog (LMU Biomedizinsches Centrum). HoxB8 myeloid progenitors were tested for Mycoplasma and routinely cultured in RMPI-1640 medium supplemented with 10% FCS, 30 mM β-mercaptoethanol (Life Technologies), 1% supernatant from SCF-producing CHO cells and 1 μM β-estradiol (Sigma-Aldrich). Differentiation was induced by estrogen removal and culture in medium containing 1% SCF supernatant. The progenitor cells were differentiated into neutrophils by culturing with complete RPMI 1640 medium supplemented with 30 μM β-mercaptoethanol, 4% SCF containing supernatant and 20 ng/mL G-CSF in 5% CO2 tissue culture incubator at 37°C. For generating CRISPR-Cas9-mediated knockout, progenitors were transduced with lentiCas9-v2 lentiviruses targeting exon 1 of CEPBb (ID: ENSMUSG00000056501, gRNA AGGCTCACGTAACCGTAGT), exon1 of KLF6 (ID: ENSMUSG00000000078, gRNA TCGCTGTCGGGAAAACAGGG), exon3 of Runx1 (ID: ENSMUSG00000022952, gRNA TAGCGAGATTCAACGACCTC), exon5 of RFX2 (ID: ENSMUSG00000024206, gRNA CTGCTGGGGGCGTAAAGCTG), exon4 of RELB (ID: ENSMUSG00000002983, gRNA CTGCACGGACGGCGTCTGCA), exon2 of IRF5 (ID: ENSMUSG00000029771, gRNA ACCCTGGCGCCATGCCACGAGG) and exon1 of JUNB (ID: ENSMUSG00000052837, gRNA GGAACCGCAGACCGTACCGG). Briefly, lentiCas9-v2 lentivirus were produced from HEK-293FT cells transfected with the lentiCas9-v2 plasmid mixed with lentiviral packaging plasmids pVSVG (Addgene plasmid #8454) and psPAX2 (Addgene plasmid #12260). 48 hours post transfection, the lentivirus containing supernatants were harvested, filtered and selected with 6ug/ml Puromycin for the targeted knockout of C/EBPβ, KLF6, RUNX1, RFX2, RELB, IRF5, JUNB.
Cytospin
For morphological analysis, differentiated HoxB8 neutrophils were spun onto glass slides by centrifugal forces using a Cytospin 3 Cytocentrifuge (Shandon, ThermoScientific) at 400 g for 5 minutes. The slides were stained with ready to use modified Wight-Giemsa stain from Sigma-Aldrich (Cat no: WG16) according to the manufacturer’s protocol. Images were obtained from stained slides under bright field using an Olympus BX51 Ostometric fluorescence microscope (Olympus).
Western blots
Cells were lysed in 1% TX-100 lysis buffer (1% v/v TX-100, 10% v/v glycerol, 1 mM EDTA, 150 mM NaCl, 50 mM Tris pH 7.8) supplemented with protease inhibitor cocktails (Roche). Lysates were incubated on ice for 30 min and cleared by centrifugation at 13,000 rpm for 10 min at 4°C. Protein quantification was performed with the Qubit assay (Thermo Fisher Scientific) according to the manufacturer’s protocol. 20 μg of lysates were boiled in Laemmli sample buffer (Bio-Rad), resolved on a NUPAGE 4-12% Bis-Tris gel (Invitrogen), and transferred onto a PVDF membrane (GE Healthcare) by wet western blotting. Membranes were blotted for primary antibodies (Supplementary Table1), followed by IRDye conjugated secondary antibodies. Complexes were detected with the Odyssey Infrared Imaging System (LI-COR) and analyzed using Image Studio™ Lite (Version 5.2.5).
Estimation of mitochondrial transmembrane potential
Mitochondrial membrane potential was monitored with the voltage-sensitive fluorescent indicator TMRM. For that, HoxB8 neutrophils (2 × 10⁶ cells/mL) were loaded with 200 nM TMRM for 20 min for 10 min. The TMRM fluorescence was estimated using a BD LSR II flow cytometer.
Metabolic flux analysis
The real-time extracellular acidification rate (ECAR) and oxygen consumption rate (OCR) were measured using a XF 96 extracellular flux analyzer (Seahorse Bioscience). 2 × 10⁶ HoxB8 neutrophils were washed twice in RPMI 1640 without sodium bicarbonate, 20 mM glucose, 1% FCS, 2mM pyruvate and seeded in corresponding assay medium in an XF plate coated with poly-L-lysine (Sigma-Aldrich). Neutrophils were rested at 37°C for one hour before analysis. Three independent experiments were performed with four independent replicates per group.
Intracellular ROS measurement
Intra-cellular ROS was measured by a FACS based method. HoxB8 neutrophils were incubated with 2.5 μg/mL (7 μM) Dihydrorhodamine 123 (DHR123) (ThermoFisher Scientific) in complete RPMI 1640 medium, and stimulated by 50nM Phorbol 12-Myristate 13-Actetate (PMA) (Sigma-Aldrich) for 20 minutes at 37°C. Cells were subsequently washed with PBS and the fluorescence intensities of each subset/cells were measured by flow cytometry.
Phagocytosis
Phagocytosis capacity of HoxB8 neutrophils was measured by FACS based method using fluorescent E. coli (25922GFP, ATCC). Briefly, HoxB8 neutrophils were incubated with fluorescent E. coli at a multiplicity of infection (MOI) of 10 in complete RPMI 1640 medium for 15 minutes in at 37°C. Neutrophils were subsequently washed with PBS and the fluorescence intensities of each subset/cells were measured by flow cytometry.
Bacterial killing assay
Bacterial killing assay was performed with S. aureus (NCTC 6571), which was used at a MOI of 10. For the bacterial killing assay, HoxB8 neutrophils were infected for 2 hours with S. aureus and then lysed in 1% triton buffer and the lysate was plated on agar plates. Bacterial culture plates were incubated at 37 °C overnight, and the colony number on each plate was counted the following morning as an absolute CFU count.
NETosis
To induce NETosis, HoxB8 neutrophils were seeded into 8 well lab-Tek II chamber slide (VWR international) coated with 2% poly-lysine (Sigma-Aldrich) at a volume of 100 uL at the density of 1x10⁶/mL. Neutrophils were stimulated with 5μM ionomycin and PMA (Sigma-Aldrich) overnight at 37°C in 5% CO2 tissue culture incubator and were subsequently fixed with 4% paraformaldehyde (Sigma-Aldrich) in DPBS for 30 minutes at RT. Following blocking, primary antibodies: rabbit anti-citrullinated histone 4 (ab5103, Abcam) and mouse anti-mouse MPO (HM1051BT, Hycult) at 1:100 dilution overnight at 4°C. Cells were washed with DPBS before adding secondary antibodies: mouse anti rabbit DyLight 647 conjugated secondary antibody (ThermoFisher Scientific) and rabbit anti mouse IgG secondary antibody conjugated with Alexa fluro-488 (ThermoFisher Scientific). Images were obtained by an Olympus BX51 Ostometric fluorescence microscope. Neutrophils with a clear formation of fibres stained by citrullinated-histone 3, colocalized with a diffuse nucleus stained by SYTOX and colocalization with MPO, were counted as neutrophils under NETosis. Images were analysed using Fiji (Version 2.1.0/1.53h).
Cell viability
10,000 cells/well HoxB8 myeloid progenitors were seeded and differentiated for five days. Cell viability was assessed using the Annexin V staining and the Fixable Viability Dye eFluor®780 live/dead staining (ThermoFisher) and analyzed by flow cytometry to determine the percent undergoing apoptosis. Samples were tested in triplicate and normalized to FMO wells.
Neutrophil migration assay with Boyden chamber
For the neutrophil migration assay, Hoxb8 neutrophils were washed with the migration medium RPMI-1640 containing 2.5mM HEPES and 0.1% BSA and tested for migration in 96-well microchamber using a 5 μm-pore size, polycarbonate filter (Boyden Chamber, Neuro Probe Inc., Gaithersburg, MD, USA). The lower wells of the Boyden chambers were filled with the migration medium supplemented with either PBS or 10nM murine recombinant chemokine (C-C motif) ligand 3 (Ccl3) (R&D). In the upper wells, 5 × 10⁴ Hoxb8 neutrophils were added and the chamber were incubated for 90 minutes at 37 °C and 5% CO2. After incubation, nonmigrating cells in the upper chamber were removed using a cotton-tipped applicator. Cells that had migrated to the bottom side of the membrane were fixed in 70% ethanol and stained with DAPI before mounting onto poly-lysine coated slides. Each condition was performed in duplicate. The number of migrated neutrophils counted in five random fields was analyzed using Fiji (Version 2.1.0/1.53h).
RNA extraction and Quantitative Real-Time PCR
Total RNAs were isolated from cells using RNeasy Mini Kit (Qiagen) and reverse transcribed to cDNA using High-Capacity cDNA Reverse Transcription Kit (Life Technologies) as per the manufacturer’s protocol. RNA from sorted cells was isolated utilising the RNeasy Micro kit (Qiagen). Real-time PCR reactions were performed on a ViiA7 system (Life Technologies) with Taqman primer sets (Supplementary Table 1). Gene expression was analysed using the comparative Ct (ΔΔCt) method and normalised against the levels of housekeeping gene Hprt as arbitrary unit.
Measurement of cytokine production
For the cytokine array, 1x10⁶ HoxB8 neutrophils seeded in 2ml RPMI were stimulated with 50ug/ml Zymosan or DMSO vehicle for two hours. R&D Systems Mouse Cytokine Array, Panel A (R&D Systems, catalog ARY006) was used to simultaneously detect the levels of 40 different cytokines and chemokines in 400μl supernatant of stimulated HoxB8 neutrophils, following the manufacturer’s instruction. Signals were detected by chemical luminescence and subsequently quantitated with Image Studio (LI-COR, Version 5.2.5).
Adoptive transfer of HoxB8 neutrophils
HoxB8 neutrophils were transferred intravenously into mice subjected to air pouch model of in vivo inflammation, as shown in Supplementary Fig. 2. WT and knockout HoxB8neutrophils were labelled with CellTrace™ Far Red (Life Technologies) and CellTrace™ CFSE (Life Technologies), respectively, at a final concentration of 5 μM following the manufacturer’s procedure. Next, 10x106 differentially labelled WT and knockout neutrophils were mixed at an equal ratio and adoptively transferred into air pouch model of in vivo inflammation at a volume of 300μl, followed by subcutaneous zymosan stimulation. 4 hours post zymosan challenge, blood, membrane and exudate were collected for flow cytometry.
Model of Acute Myocardial Infarction
Female 8- to 12-week-old mice were subjected to 45 min occlusion of the left anterior descending (LAD) coronary artery followed by 1h reperfusion (for infarct size), as previously described 6. Briefly, fully anesthetized animals were intubated and temperature controlled throughout the experiment at 36.5°C to prevent hypothermic cardioprotection. Thoracotomy was then performed, and the LAD was ligated with a nylon 8/0 monofilament suture for 45 min. For quantification of infarct size, mice were re-anesthetized and re-intubated, and the LAD coronary artery was re-occluded by ligating the suture in the same position as the original infarction. Animals were then sacrificed and 1 mL of 1% Evans Blue dye (Sigma) was infused IV to delineate the Area at Risk (AAR: myocardium lacking blood flow, i.e., negative for blue dye staining). The left ventricle (LV) was isolated, cut into transverse slices (5-7 1-mm thick slices per LV), and both sides were imaged. To delineate the infarcted (necrotic) myocardium, slices were incubated in triphenyltetrazolium chloride (TTC, Sigma) at 37°C for 15 min. The slices were then re-photographed, weighed, and regions negative for Evans Blue staining (AAR) and for TTC (infarcted myocardium) were quantified using ImageJ (NIH, Bethesda, MD). Percentage values for AAR and infarcted myocardium were corrected to mg independently for each slice. Absolute AAR and infarct size were determined as the mg:mg ratio of AAR:LV and infarcted myocardium:AAR, respectively.
Mixed Bone Marrow Chimera and Acute Myocardial Infarction
Recipient wild-type C57BL/6 mice were lethally irradiated (two 6Gy doses, 3 h apart) before receiving 1 million bone marrow nucleated cells by intravenous injection. For mixed chimeras, equal numbers of donor CD45.1 or S100a8cre Junbfl/fl BM cells, harvested by flushing the femur with PBS, were mixed before intravenous injection. Engraftment of recipient animals was assessed 6 weeks after transplantation by analysis of the percentage of CD45.1 or CD45.2 leukocytes in blood by flow cytometry. 8 weeks after transplantation mice were subjected to 45 min occlusion of the left anterior descending (LAD) coronary artery followed by 3h reperfusion. Heart, blood and bone marrow were collected and processed for flow cytometry analysis. Briefly, blood was taken through cardiac puncture, BM cells mice were flushed from femurs using a 23–gauge needle and hearts were harvested and cut dry into small pieces before digested in liberase TM (Roche) and DNase1 (Sigma) for 45min at 37C and homogenized into single-cell sus-pensions using 70–mm nylon mesh sieves and syringe plungers. Single cell suspensions were lysed in RBC lysis buffer (eBioscience) for 4min, stained with fluorochrome-conjugated antibodies and then fixed and permeabilized using the Fix/Perm and Perm Buffers (eBiosciences) according to manufacturer’s instructions to determine pro-IL1B production or incubated with 2.5ug/ml of DHR123 (Invitrogen) at 37C for 20 min to quantify ROS.
Statistical analysis
GraphPad Prism 8.0 software was used for data analysis. Data are represented as mean ± SD. Unless otherwise noted, statistical significance was determined by unpaired, two-tailed Student’s t-test for two-group comparisons, one-way analysis of variance (ANOVA) with Dunnett’s multiple comparisons test for comparisons of more than two groups, two-way ANOVA for comparisons of more than two groups with two or more timepoints. P values <0.05 were considered to be statistically significant, where *P <0.05, **P <0.01, ***P <0.001 and ****P <0.0001.
Extended Data
Extended Data Fig. 1. Administration of zymosan into the air pouch cavity induces neu-trophil transcriptional remodeling.
a) Representative H&E staining showing the formation of the granulation tissue (membrane) and infiltration of leukocytes. Representative (left) and zoomed-in (right) images of air
pouch cavity from mice subjected to air pouch and zymosan challenge are shown with indicated scale bars.
b) Representative image of immunofluorescence imaging on the pouch cavity of Ly6gcre-tdTomato x Cx3cr1GFP illustrates typical neutrophil infiltration. Neutrophils and macrophages appear reddish and green, respectively, and cell nuclei stained with DAPI appear blue.
a, b) Representative images from four mice are shown.
c) Total number of neutrophils per milliliter of air-pouch exudate (AP) post challenge with zymosan.
d) Total number of neutrophils per milligram of air-pouch membrane (MEM) post challenge with zymosan.
e) Expression of pro-IL1β, as measured by flow cytometry, in neutrophils from indicated tissues recovered from mice subjected to the air pouch model and zymosan challenge.
c, d, e) Results are the means?and?SD of 15 mice. Significant differences are denoted as: *P<0.05, **P<0.01, ***P<0.001, and ****P<0.0001; (DM one-way ANOVA with Dunnett’s multiple comparisons test).
f) Gating strategy of neutrophil sorting from Ly6gcre-tdTomato × Cx3cr1GFP mice for subsequent RNA sequencing analysis and ATAC sequencing analysis.
g) Gating strategy used to quantify neutrophils under different maturation stages.
h) Percentage distribution of neutrophil subsets in BM and blood between steady condition and zymosan-induced inflammation. Data are shown as means and SD from three naïve mice and four mice with zymosan challenge. Significant differences are denoted as: **P<0.01, ****P<0.0001 (RM two-way ANOVA with Šidák’s multiple comparisons test).
i) Correlation between indicated neutrophil samples with scRNA-seq-defined neutrophil populations reported by Xie et al. 11. The mean fraction of indicated scRNA-seq defined clusters (G0-G5) in each group of neutrophil samples. G0-G4: BM neutrophils (G0-CMP, G1-GMP, G2-pre-neutrophils; G3-immature neutrophils; G4-mature neutrophils). G5a, G5b, G5c: peripheral mature neutrophils.
Extended Data Fig. 2. GSEA reveals top enriched pathways in up- and down-regulated gene sets.
A) Global changes in gene expres-sion between the bone marrow and air pouch (padj < 0.05, fold change > 1.5).
B) Top gene ontology terms associ-ated with the bone marrow and air pouch identified by gene set en-richment analysis (GSEA) padj < 0.01.
C) Gene set enrichment analysis (GSEA) of genes differentially ex-pressed between the bone marrow and air pouch. Line plot shows the distribution of genes ranked by their normalised enrichment score (ES). Heatmaps show variance stabilised counts of the leading-edge genes most associated with each tissue.
Extended Data Fig. 3. Discrete changes occur in neutrophil chromatin landscape en route to the site of in-flammation.
a) Venn diagrams showing the overlap of differentially accessible peaks (padj < 0.05, fold change > 1.5) between the indicated transitions.
b) Heat maps of normalised read counts (FPKM) over 2.5 k.b regions centred on ATAC-seq peaks from each tissue. Only differentially accessible peaks between the blood and bone marrow, and between blood and membrane are shown (padj < 0.05, fold change > 1.5).
c) Hierarchical clustering of all differentially accessible peaks (LRT test padj < 0.01) based on Manhattan distances using the Ward method. Data are presented as a heatmap normalised to the minimum and maximum of each row.
d) Gene ontology analysis for differentially accessible peaks between the blood and bone marrow, and between blood and membrane (padj < 0.05, fold change > 1.5). The top 10 most significant results are shown and the number of differentially accessible peaks within each GO term are annotated.
Extended Data Fig. 4. Expression of predicted transcription factor family members in neutrophils.
a) Expression of identified transcription factor (TF) family members across immune cell populations (ImmGen), subpopulation level counts are averaged. Highlighted TFs have high levels of neutrophil expression.
b) Expression of predicted transcription factor (TF) family members across neutrophil sub-populations (ImmGen). Highlighted TFs have high levels of neutrophil expression and/or neutrophil specific expression compared with other family members.
c) Expression of predicted transcription factors in each of G0 to G5 clusters, mapped to progressively maturing neutrophils in scRNA-Seq analysis 11, before and after intraperitoneal E. coli challenge, coloured by the average expression of each gene in each cluster scaled across all clusters.
d) Western blot analysis of JUNB activation (P-JUNB) and levels of expression (JUNB) over the time course of HoxB8 neutrophil differentiation/maturation (D0 to D5) and under zymosan stimulation, and representative blot from three independent experiments is shown.
Extended Data Fig. 5. Validation and maturation of TF knockout neutrophils.
a) Targeted TF knockout of HoxB8 neutrophils. Left: Schematic of in vitro generation, CRISPR-Cas9 lentivirus transduction and subsequent differentiation into neutrophils in the presence of G-CSF. Right: Immunoblots for validating TF knockout from HoxB8 neutrophils, and representative blots from three independent experiments are shown.
b) Representative flow cytometry plots(top) of WT or CEBPβ–/–, Klf6–/–, Runx1–/–, Rfx2–/–, RelB–/–, Irf5–/– or JunB–/– HoxB8 neutrophils co-labelled with Ly6C, Ly6G and CD101. Quantification of flow cy-tometry data as percentages of pre-neutrophils Ly6G-CXCR4+, immature Ly6G+CD101- and mature Ly6G+CD101+ neutro-phils (bottom). Data are shown as means and SD and are representa-tive of three independent experi-ments. Significant differences com-pared with the WT control group are denoted as: ****P<0.0001 (two-way ANOVA with Dunnett’s multiple comparisons test).
c) Myeloperoxidase (MPO) expression in HoxB8 neutrophils. A representative Western blot probed with antibodies specific for MPO and b–Actin is shown. MPO expression is normalized against b-Actin amount in the lysates (and expressed as arbitrary unit of MPO).
d) Mitochondrial transmembrane potential of WT and indicated KO HoxB8 neutrophils measured by flow cytometry using TMRM.
e) Early apoptosis rates of HoxB8 neutrophils differentiated for five days as assessed by the percentage of cells positive for the Annexin V staining and negative for the live/dead staining. Data are shown as means and SD from three independent experiments, each with duplicate.
c, d, e) Data are shown as means and SD and are representative of three independent experiments. Significant differences compared with WT neutrophils are denoted as: **P<0.01, ***P<0.001, ****P<0.0001; (Oridinary one-way ANOVA with Dunnett’s multiple comparisons test).
Extended Data Fig. 6. RUNX1 deficiency impairs neutrophil maturation.
a) Irf5 deficiency does not affect neutrophil maturation. Left: representative flow cytometry of neutrophil subsets (pre-neutrophils, immature and mature neutrophils) from WT and Irf5–/– mice.
b) JunB deficiency does not affect neutrophil maturation. Left: representative flow cytometry of neutrophil subsets (pre-neutrophils, immature and mature neutrophils) from JunBfl/fl and S100a8cre/crexJunBfl/fl mice. Right: Statistical analysis of percentages of indicated neutrophil subsets. Data are shown as means and SD derived from three mice from each group. Statistical comparison was made by ordinary one-way ANOVA with Dunnett’s multiple comparisons test: ns, no significant difference.
c) Absolute quantification of neutrophil subsets (pre-neutrophils, immature and mature neutrophils) in the bone marrow (left) and the blood (right) from Runx1fl/fl and Lyz2Cre/cre xRunx1fl/fl mice.
d) Morphology assessment of CD11b+Ly6G+ neutrophils sorted from Runx1fl/fl and Lyz2Cre/crexRunx1fl/fl mice.
e) Morphology assessment of CD11b+Ly6G+ neutrophils sorted from JunBfl/fl and S100a8cre/crexJunBfl/fl mice.
d, e) Results are expressed as percentages of segmented, banded neutrophils and metamyelocyte out of at least 200 cells counted from different fields and independent replicates. Scale bars represent 10μm.
a, c, d, e) Data are shown as means and SD from three mice from each group within one experiment. Significant differences compared between two individual groups are denoted as: *P<0.05, **P<0.01, ***P<0.001, and ****P<0.0001 (RM two-way ANOVA with Šidák’s multiple comparisons test).
f) Differential expression of Cebpe in CD11b+Ly6G+ neutrophils sorted from Runx1fl/fl and Lyz2Cre/crexRunx1fl/fl mice, measured by flow cytometry. Gating strategy (top) of neutrophils for identifying CD11b+Ly6G+ neutrophils. Fluorescence histogram (middle) and geometric mean (bottom) of CEBPE expression in CD11b+Ly6G+ neutrophils. Data are shown as means and SD derived from three mice from each group. Significant differences compared with Runx1fl/fl and Lyz2Cer/crexRunx1fl/fl mice are denoted as: **P<0.01 (unpaired student t test).
Extended Data Fig. 7. RUNX1 and KLF6 in transcriptional control of neutrophil migration.
a) Hierarchical clustering of all differentially expressed genes (LRT test padj < 0.01, |log2FC| >1), based on Manhattan distances using the Ward method. Data are presented as heatmap normalised to the minimum and maximum of each row.
b) Gene ontology (GO) analysis, showing the top 10 enriched GO categories for each cluster from Extended Data Fig. 7a.
c) Leukocyte-migration-related gene expression in WT, Klf6–/–, or Runx1–/– HoxB8 neutrophils.
b, c) Significant differences compared with Runx1fl/fl and Lyz2Cer/crexRunx1fl/fl mice are denoted as: **P<0.01, ****P<0.0001 (RM two-way ANOVA with Šidák’s multiple comparisons test).
d) Early apoptosis rates of HoxB8 neutrophils recovered from blood, air pouch membrane and exudate from mice subjected to into air pouch model of acute inflammation and zymosan stimulation, assessed by the percentage of cells positive for the Annexin V staining and negative for the live/dead staining. Data are shown as means and SD from four mice from each group.
e) Percentage distribution of neutrophil subsets (pre-neutrophils, immature and mature neutrophils) in BM and blood under zymosan-induced inflammation. Data are shown as means and SD from six mice from each group.
Extended Data Fig. 8. RELB, IRF5, and JUNB deficiency impair neutrophil inflammatory responses.
a) Hierarchical clustering of all DEGs (padj < 0.05, |log2FC|>1). Data are presented as heatmap normalized to the minimum and maximum of each row.
b) Gene ontology (GO) analysis showing the log2 odds ratio of genes regulated by specific TF knockout with the indicated GO annotation.
c) Representative immunofluorescence images of NETosis from WT, RelB–/– and JunB–/– HoxB8 neutrophils stimulated with 5μM ionomycin and PMA overnight, stained for DNA (blue), MPO (green) and citrullinated histone3 (red). Representative images from three independent experiments are shown. Scale bar indicates 10μm.
d) Phagocytosis-related gene expression in in Cebpβ–/–, RelB–/–, Irf5–/– or JunB–/– HoxB neutrophils.
e) ROS-biosynthetic-process-related gene expression in WT, Cebpβ–/–, RelB–/–, Irf5–/– or JunB–/– HoxB8 neutrophils.
Extended Data Fig. 9. RELB, IRF5, and JUNB affect neutrophil inflammatory production.
a) Cytokine-production-related gene expression in WT, Cebpβ–/–, RelB–/–, Irf5–/– or JunB–/– HoxB8 neutrophils.
b) Chemokine-production-related gene expression in Cebpβ–/–, RelB–/–, Irf5–/– or JunB–/– HoxB8 neutrophils.
c) Il1α, Il6 and Cxcl2 mRNA induction in HoxB8 neutrophils stimulated with zymosan (50ug/ml) for 0, 1, 2 hours. Gene expression was measured by qPCR. Data are shown as means and SD from three independent experiments. Significant differences compared between KO and WT neutrophils are denoted as: *P<0.05, **P<0.01, ****P<0.0001, and ****P<0.0001; (DM one-way ANOVA with Dunnett’s multiple comparisons test).
d) Cytokines and chemokines secreted from WT HoxB8 neutrophils challenged with Zymosan for 2h, measured by the proteome array shown in Fig. 6b.
e) Densitometric quantification of IL1β secretion from HoxB8 neutrophils stimulated with stimulated with zymosan (50ug/ml) for 2 hours, measured with 30 minutes exposure time. Data are shown as mean and SD of three biologically independent samples. Significant differences compared between KO and WT neutrophils are denoted as: *P<0.05, **P<0.01; (Ordinary one-way ANOVA with Dunnett’s multiple comparisons test).
Extended Data Fig. 10. Assessment of chimerism in MBMC and proposed TF blueprint.
a) Representative flow cytometry (left) and the chimerism ratio (right) of neutrophils in the bone marrow, blood, and heart in mice subjected to permanent myocardial infarction 6 weeks after bone marrow transplant. Data are shown as means and SD derived from three mice from each group within one experiment. Statistical comparison was made by paired student-t test. ns, no significant difference.
b) Model of transcriptional regulation of neutrophils during in-flammation. In the process of differentiation in bone marrow, lineage-determining transcriptional factors, including RUNX1, KLF6, CEBPE, and PU.1, are highly ex-pressed and ensure gene expression programmes that promote proper neutrophil maturation. During the mobilization from the bone marrow into the blood, RFX2, RELB, IRF5 and JUNB become upregulated and transcriptionally accessible to sup-port neutrophil cell survival and es-tablish their effector function reper-toire, whereas RUNX1 and KLF6 expression are silenced. Upon in-flammation, circulating neutrophils migrate into the inflammatory sites, where they are exposed to inflam-mation-derived signals and become activated. Neutrophil activation leads to the activation of TFs, in-cluding RELB, IRF5 and JUNB, and subsequent TF binding to already accessible binding sites, thereby resulting in diverse TFs genomic occupancy and distinct transcriptional outputs.
Supplementary Material
Acknowledgements
We are grateful to Jonathan Webber (KIR, NDORMS, Oxford) for providing the cell sorting service, Drs Thomas Nicol and Mark Crabtree (NDM, Oxford) for help with the Seahorse assay, and Genomic core facility (WTCHG, Oxford) for sample sequencing and technical support. We thank Prof Fiona Powrie for scientific discussions and Dr Elizabeth Thompson and Miss Dorothee Berthold (KIR, NDORMS, Oxford) for helpful suggestions on the manuscript and assistance with figures.
This work was supported by the Oxford-Celgene fellowship (T.E.K.), the Chinese Science Council (Z.A.), the Wellcome Trust Investigator Award 209422/Z/17/Z to I.A.U (E.v.G. and H.E.), Novo Nordisk Foundation Tripartite Immunometabolism Consortium [TrIC] NNF15CC0018486 (S.M and L.W.) and Erasmus Foundation (N.W. and V.v.W.).
Footnotes
AUTHOR CONTRIBUTIONS
Conceptualization, I.A.U.; Methodology, I.A.U., S.M., H.E., T.E.K. and Z.A.; Experiments, T.E.K., Z.A., S.M., H.E., I.B., S.M-S, L.W., N.W., V.v.W., As.H.; Analysis and/or interpretation of experimental data, T.E.K., Z.A., I.B., E.v.G., I.A.U; Computational genomic analysis, T.E.K., Z.A. Provision of materials, A.Z. B.W.; Writing the manuscript and Review & Editing I.A.U., Z.A., A.H., T.E.K., E.v.G., H.E.
DECLARATION OF INTERESTS
All the authors declare that they have no financial interests.
Data Availability
RNA-seq (Fig. 1) and ATAC-seq (Fig. 2) data using neutrophils from mice subject to air pouch and zymosan stimulation, RNAseq data using HoxB8 neutrophils (Fig. 5, 7, Extended Fig. 7–9) are available with the GEO accession number GSE161765. The previous published RNA-seq data were retrieved from the GEO, with accession numbers, GSE147910 and GSE109125. To align the neutrophil subpopulations from bone marrow, blood, air pouch membrane and exudate in current study (Extended Data Fig. 1i), we also utilized the published scRNA-seq data: GSE137540.
Code Availability
All codes used in current study have been stored in:
References
- 1.Cowland JB, Borregaard N. Granulopoiesis and granules of human neutrophils. Immunological reviews. 2016;273:11–28. doi: 10.1111/imr.12440. [DOI] [PubMed] [Google Scholar]
- 2.Evrard M, et al. Developmental analysis of bone marrow neutrophils reveals populations specialized in expansion, trafficking, and effector functions. Immunity. 2018;48:364–379.:e368. doi: 10.1016/j.immuni.2018.02.002. [DOI] [PubMed] [Google Scholar]
- 3.Lawrence SM, Corriden R, Nizet V. The Ontogeny of a Neutrophil: mechanisms of granulopoiesis and homeostasis. Microbiol Mol Biol Rev. 2018;82:e00057-00017. doi: 10.1128/MMBR.00057-17. [DOI] [PMC free article] [PubMed] [Google Scholar]
- 4.Nauseef WM, Borregaard N. Neutrophils at work. Nature immunology. 2014;15:602. doi: 10.1038/ni.2921. [DOI] [PubMed] [Google Scholar]
- 5.Scapini P, Cassatella MA. Social networking of human neutrophils within the immune system. Blood, The Journal of the American Society of Hematology. 2014;124:710–719. doi: 10.1182/blood-2014-03-453217. [DOI] [PubMed] [Google Scholar]
- 6.Adrover JM, et al. A neutrophil timer coordinates immune defense and vascular protection. Immunity. 2019;50:390–402.:e310. doi: 10.1016/j.immuni.2019.01.002. [DOI] [PubMed] [Google Scholar]
- 7.Beyrau M, Bodkin JV, Nourshargh S. Neutrophil heterogeneity in health and disease: a revitalized avenue in inflammation and immunity. Open biology. 2012;2:120134. doi: 10.1098/rsob.120134. [DOI] [PMC free article] [PubMed] [Google Scholar]
- 8.Silvestre-Roig C, Hidalgo A, Soehnlein O. Neutrophil heterogeneity: implications for homeostasis and pathogenesis. Blood, The Journal of the American Society of Hematology. 2016;127:2173–2181. doi: 10.1182/blood-2016-01-688887. [DOI] [PubMed] [Google Scholar]
- 9.Ericson JA, et al. Gene expression during the generation and activation of mouse neutrophils: implication of novel functional and regulatory pathways. PloS one. 2014;9:e108553. doi: 10.1371/journal.pone.0108553. [DOI] [PMC free article] [PubMed] [Google Scholar]
- 10.Ostuni R, Natoli G, Cassatella MA, Tamassia N. Epigenetic regulation of neutrophil development and functioN Seminars in immunology; 2016. Elsevier; 2016. pp. 83–93. [DOI] [PubMed] [Google Scholar]
- 11.Xie X, et al. Single-cell transcriptome profiling reveals neutrophil heterogeneity in homeostasis and infection. Nature Immunology. 2020;21:1119–1133. doi: 10.1038/s41590-020-0736-z. [DOI] [PMC free article] [PubMed] [Google Scholar]
- 12.Zhu Y, et al. Comprehensive characterization of neutrophil genome topology. Genes & development. 2017;31:141–153. doi: 10.1101/gad.293910.116. [DOI] [PMC free article] [PubMed] [Google Scholar]
- 13.Ballesteros I, et al. Co-option of Neutrophil Fates by Tissue Environments. Cell. 2020 doi: 10.1016/j.cell.2020.10.003. [DOI] [PubMed] [Google Scholar]
- 14.Kolaczkowska E, Kubes P. Neutrophil recruitment and function in health and inflammation. Nature Reviews Immunology. 2013;13:159. doi: 10.1038/nri3399. [DOI] [PubMed] [Google Scholar]
- 15.Sagiv JY, Voels S, Granot Z. The Tumor Microenvironment. Springer; 2016. Isolation and characterization of low-vs. high-density neutrophils in cancer; pp. 179–193. [DOI] [PubMed] [Google Scholar]
- 16.Yvan-Charvet L, Ng LG. Granulopoiesis and Neutrophil Homeostasis: A Metabolic, Daily Balancing Act. Trends in immunology. 2019;40:598–612. doi: 10.1016/j.it.2019.05.004. [DOI] [PubMed] [Google Scholar]
- 17.Hohaus S, et al. PU. 1 (Spi-1) and C/EBP alpha regulate expression of the granulocyte-macrophage colony-stimulating factor receptor alpha gene. Molecular and cellular biology. 1995;15:5830–5845. doi: 10.1128/mcb.15.10.5830. [DOI] [PMC free article] [PubMed] [Google Scholar]
- 18.Nerlov C, Graf T. PU. 1 induces myeloid lineage commitment in multipotent hematopoietic progenitors. Genes & development. 1998;12:2403–2412. doi: 10.1101/gad.12.15.2403. [DOI] [PMC free article] [PubMed] [Google Scholar]
- 19.Hock H, et al. Intrinsic requirement for zinc finger transcription factor Gfi-1 in neutrophil differentiation. Immunity. 2003;18:109–120. doi: 10.1016/s1074-7613(02)00501-0. [DOI] [PubMed] [Google Scholar]
- 20.Yamanaka R, et al. Impaired granulopoiesis, myelodysplasia, and early lethality in CCAAT/enhancer binding protein ɛ-deficient mice. Proceedings of the National Academy of Sciences. 1997;94:13187–13192. doi: 10.1073/pnas.94.24.13187. [DOI] [PMC free article] [PubMed] [Google Scholar]
- 21.Ai Z, Udalova IA. Transcriptional regulation of neutrophil differentiation and function during inflammation. Journal of Leukocyte Biology. 2020;107:419–430. doi: 10.1002/JLB.1RU1219-504RR. [DOI] [PubMed] [Google Scholar]
- 22.Grassi L, et al. Dynamics of transcription regulation in human bone marrow myeloid differentiation to mature blood neutrophils. Cell reports. 2018;24:2784–2794. doi: 10.1016/j.celrep.2018.08.018. [DOI] [PMC free article] [PubMed] [Google Scholar]
- 23.Jarvis JN, et al. Gene expression profiling in neutrophils from children with polyarticular juvenile idiopathic arthritis. Arthritis & Rheumatism. 2009;60:1488–1495. doi: 10.1002/art.24450. [DOI] [PMC free article] [PubMed] [Google Scholar]
- 24.Cloutier A, et al. Inflammatory cytokine production by human neutrophils involves C/EBP transcription factors. The Journal of Immunology. 2009;182:563–571. doi: 10.4049/jimmunol.182.1.563. [DOI] [PubMed] [Google Scholar]
- 25.Tessier PA, et al. Chemokine networks in vivo: involvement of CXC and CC chemokines in neutrophil extravasation in vivo in response to TNF-alpha. The Journal of Immunology. 1997;159:3595–3602. [PubMed] [Google Scholar]
- 26.Harris JG, Flower RJ, Perretti M. Endogenous corticosteroids mediate the neutrophilia caused by platelet-activating factor in the mouse. European journal of pharmacology. 1995;283:9–18. doi: 10.1016/0014-2999(95)00274-o. [DOI] [PubMed] [Google Scholar]
- 27.Ryckman C, et al. Role of S100A8 and S100A9 in neutrophil recruitment in response to monosodium urate monohydrate crystals in the air‐pouch model of acute gouty arthritis. Arthritis & Rheumatism: Official Journal of the American College of Rheumatology. 2003;48:2310–2320. doi: 10.1002/art.11079. [DOI] [PubMed] [Google Scholar]
- 28.Wilkinson L, Moore A, Pitsillides A, Willoughby D, Edwards J. Comparison of surface fibroblastic cells in subcutaneous air pouch and synovial lining: differences in uridine diphosphoglucose dehydrogenase activity. International journal of experimental pathology. 1993;74:113. [PMC free article] [PubMed] [Google Scholar]
- 29.Blazek K, et al. IFN-λ resolves inflammation via suppression of neutrophil infiltration and IL-1β production. Journal of Experimental Medicine. 2015;212:845–853. doi: 10.1084/jem.20140995. [DOI] [PMC free article] [PubMed] [Google Scholar]
- 30.Monticelli S, Natoli G. Transcriptional determination and functional specificity of myeloid cells: making sense of diversity. Nature Reviews Immunology. 2017;17:595. doi: 10.1038/nri.2017.51. [DOI] [PubMed] [Google Scholar]
- 31.Jojic V, et al. Identification of transcriptional regulators in the mouse immune system. Nature immunology. 2013;14:633–643. doi: 10.1038/ni.2587. [DOI] [PMC free article] [PubMed] [Google Scholar]
- 32.Hirai H, et al. C/EBPβ is required for’emergency’granulopoiesis. Nature immunology. 2006;7:732. doi: 10.1038/ni1354. [DOI] [PubMed] [Google Scholar]
- 33.Paul F, et al. Transcriptional heterogeneity and lineage commitment in myeloid progenitors. Cell. 2015;163:1663–1677. doi: 10.1016/j.cell.2015.11.013. [DOI] [PubMed] [Google Scholar]
- 34.Wang GG, et al. Quantitative production of macrophages or neutrophils ex vivo using conditional Hoxb8. Nature methods. 2006;3:287–293. doi: 10.1038/nmeth865. [DOI] [PubMed] [Google Scholar]
- 35.Wang L, et al. ROS producing immature neutrophils in Giant Cell Arteritis are linked to vascular pathologies. JCI insight. 2020 doi: 10.1172/jci.insight.139163. [DOI] [PMC free article] [PubMed] [Google Scholar]
- 36.Manley HR, Keightley MC, Lieschke GJ. The neutrophil nucleus: an important influence on neutrophil migration and function. Frontiers in immunology. 2018;9:2867. doi: 10.3389/fimmu.2018.02867. [DOI] [PMC free article] [PubMed] [Google Scholar]
- 37.Van Raam BJ, et al. Mitochondrial membrane potential in human neutrophils is maintained by complex III activity in the absence of supercomplex organisation. PloS one. 2008;3:e2013. doi: 10.1371/journal.pone.0002013. [DOI] [PMC free article] [PubMed] [Google Scholar]
- 38.Ward C, et al. NF-κB activation is a critical regulator of human granulocyte apoptosis in vitro. Journal of Biological Chemistry. 1999;274:4309–4318. doi: 10.1074/jbc.274.7.4309. [DOI] [PubMed] [Google Scholar]
- 39.Ng K, et al. Runx1 deficiency permits granulocyte lineage commitment but impairs subsequent maturation. Oncogenesis. 2013;2:e78. doi: 10.1038/oncsis.2013.41. [DOI] [PMC free article] [PubMed] [Google Scholar]
- 40.Hu G, Ye RD, Dinauer MC, Malik AB, Minshall RD. Neutrophil caveolin-1 expression contributes to mechanism of lung inflammation and injury. American Journal of Physiology-Lung Cellular and Molecular Physiology. 2008;294:L178–L186. doi: 10.1152/ajplung.00263.2007. [DOI] [PubMed] [Google Scholar]
- 41.Casanova-Acebes M, et al. Rhythmic modulation of the hematopoietic niche through neutrophil clearance. Cell. 2013;153:1025–1035. doi: 10.1016/j.cell.2013.04.040. [DOI] [PMC free article] [PubMed] [Google Scholar]
- 42.Sionov RV, Fridlender ZG, Granot Z. The multifaceted roles neutrophils play in the tumor microenvironment. Cancer microenvironment. 2015;8:125–158. doi: 10.1007/s12307-014-0147-5. [DOI] [PMC free article] [PubMed] [Google Scholar]
- 43.Borregaard N. Neutrophils, from marrow to microbes. Immunity. 2010;33:657–670. doi: 10.1016/j.immuni.2010.11.011. [DOI] [PubMed] [Google Scholar]
- 44.Kwok I, et al. Combinatorial Single-Cell Analyses of Granulocyte-Monocyte Progenitor Heterogeneity Reveals an Early Uni-potent Neutrophil Progenitor. Immunity. 2020 doi: 10.1016/j.immuni.2020.06.005. [DOI] [PubMed] [Google Scholar]
- 45.Humbert M, et al. Deregulated expression of Kruppel-like factors in acute myeloid leukemia. Leukemia research. 2011;35:909–913. doi: 10.1016/j.leukres.2011.03.010. [DOI] [PubMed] [Google Scholar]
- 46.Riffelmacher T, et al. Autophagy-dependent generation of free fatty acids is critical for normal neutrophil differentiation. Immunity. 2017;47:466–480.:e465. doi: 10.1016/j.immuni.2017.08.005. [DOI] [PMC free article] [PubMed] [Google Scholar]
- 47.Borregaard N, Herlin T. Energy metabolism of human neutrophils during phagocytosis. The Journal of clinical investigation. 1982;70:550–557. doi: 10.1172/JCI110647. [DOI] [PMC free article] [PubMed] [Google Scholar]
- 48.Walmsley SR, et al. Hypoxia-induced neutrophil survival is mediated by HIF-1α-dependent NF-κB activity. Journal of Experimental Medicine. 2005;201:105–115. doi: 10.1084/jem.20040624. [DOI] [PMC free article] [PubMed] [Google Scholar]
- 49.Fischer J, et al. Safeguard function of PU. 1 shapes the inflammatory epigenome of neutrophils. Nature immunology. 2019;20:546. doi: 10.1038/s41590-019-0343-z. [DOI] [PubMed] [Google Scholar]
- 50.Anrather J, Racchumi G, Iadecola C. NF-κB regulates phagocytic NADPH oxidase by inducing the expression of gp91phox. Journal of Biological Chemistry. 2006;281:5657–5667. doi: 10.1074/jbc.M506172200. [DOI] [PubMed] [Google Scholar]
- 51.Wu Y, et al. Transcription factor RFX2 is a key regulator of mouse spermiogenesis. Scientific reports. 2016;6:1–13. doi: 10.1038/srep20435. [DOI] [PMC free article] [PubMed] [Google Scholar]
- 52.Picelli S, et al. Full-length RNA-seq from single cells using Smart-seq2. Nature protocols. 2014;9:171–181. doi: 10.1038/nprot.2014.006. [DOI] [PubMed] [Google Scholar]
- 53.Love MI, Huber W, Anders S. Moderated estimation of fold change and dispersion for RNA-seq data with DESeq2. Genome biology. 2014;15:550. doi: 10.1186/s13059-014-0550-8. [DOI] [PMC free article] [PubMed] [Google Scholar]
- 54.Buenrostro JD, Giresi PG, Zaba LC, Chang HY, Greenleaf WJ. Transposition of native chromatin for fast and sensitive epigenomic profiling of open chromatin, DNA-binding proteins and nucleosome position. Nature methods. 2013;10:1213. doi: 10.1038/nmeth.2688. [DOI] [PMC free article] [PubMed] [Google Scholar]
- 55.McLean CY, et al. GREAT improves functional interpretation of cis-regulatory regions. Nature biotechnology. 2010;28:495–501. doi: 10.1038/nbt.1630. [DOI] [PMC free article] [PubMed] [Google Scholar]
- 56.Machanick P, Bailey TL. MEME-ChIP: motif analysis of large DNA datasets. Bioinformatics. 2011;27:1696–1697. doi: 10.1093/bioinformatics/btr189. [DOI] [PMC free article] [PubMed] [Google Scholar]
Associated Data
This section collects any data citations, data availability statements, or supplementary materials included in this article.
Supplementary Materials
Data Availability Statement
RNA-seq (Fig. 1) and ATAC-seq (Fig. 2) data using neutrophils from mice subject to air pouch and zymosan stimulation, RNAseq data using HoxB8 neutrophils (Fig. 5, 7, Extended Fig. 7–9) are available with the GEO accession number GSE161765. The previous published RNA-seq data were retrieved from the GEO, with accession numbers, GSE147910 and GSE109125. To align the neutrophil subpopulations from bone marrow, blood, air pouch membrane and exudate in current study (Extended Data Fig. 1i), we also utilized the published scRNA-seq data: GSE137540.
All codes used in current study have been stored in:


