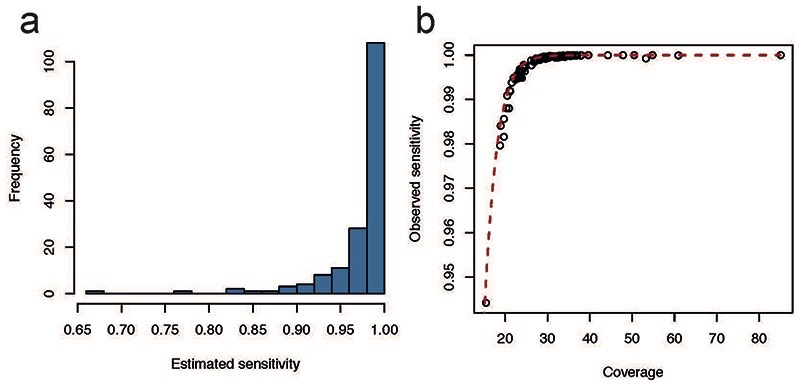
Extended Data Figure 9. Sensitivity of variant calling.
(a) Histogram of the estimated sensitivity for SNV calling in microdissected trophoblast clusters and bulk placenta samples. (b) The observed sensitivity of germline variants across placental samples plotted against the coverage of the sample. The red dashed line indicates our predicted sensitivity, which we would have used as sensitivity correction.

