Abstract
Intestinal organoids capture essential features of the intestinal epithelium such as crypt folding, cellular compartmentalization and collective movements. Each of these processes and their coordination require patterned forces that are currently unknown. Here we map three-dimensional cellular forces in mouse intestinal organoids grown on soft hydrogels. We show that these organoids exhibit a non-monotonic stress distribution that defines mechanical and functional compartments. The stem cell compartment pushes the ECM and folds through apical constriction, whereas the transit amplifying zone pulls the ECM and elongates through basal constriction. The size of the stem cell compartment depends on ECM stiffness and endogenous cellular forces. Computational modeling reveals that crypt shape and force distribution rely on cell surface tensions following cortical actomyosin density. Finally, cells are pulled out of the crypt along a gradient of increasing tension. Our study unveils how patterned forces enable compartmentalization, folding and collective migration in the intestinal epithelium.
Most epithelial tissues that line internal and external surfaces of the animal body perform their diverse physiological functions in a continuous state of self-renewal1. In the intestinal epithelium, rapid self-renewal is enabled by stem cells that reside at the bottom of highly curved invaginations called crypts, where they coexist with secretory Paneth cells2. To maintain homeostasis, stem cells constantly divide, giving rise to new cells that proliferate further at the transit amplifying zone, differentiate, and migrate to the tip of finger-like protrusions called villi, where they are extruded into the intestinal lumen3,4.
The intestinal epithelium self-renews while retaining a folded shape. Villus folding is driven by compressive stresses generated by the mesenchyme or the smooth muscle5–7. By contrast, how the crypt folds during morphogenesis and how folding is maintained during homeostasis is not well understood. Candidate folding mechanisms include buckling as a consequence of either increased mitotic pressure8–11, differentials in actomyosin forces between epithelial compartments12, or planar cellular flows13. Additionally, crypt folding could arise from bending by apical constriction14,15, basal expansion16 or transepithelial differences in osmotic pressure17,18. Importantly, the cellular forces that fold the epithelium must also enable other mechanical functions such as collective movement from crypt to villus4. How forces are distributed in the intestinal epithelium to drive its diverse mechanical functions is unknown. Using the mouse intestinal organoid as a model system19–24, here we provide high-resolution dynamic maps of cell-ECM and cell-cell forces exerted by the intestinal epithelium. Our experiments and computational model reveal that the intestinal epithelium is organized in mechanical compartments in which patterned forces drive folding by apical constriction while enabling cell migration along tensile gradients.
Results
Organoid monolayers display mechanical compartments
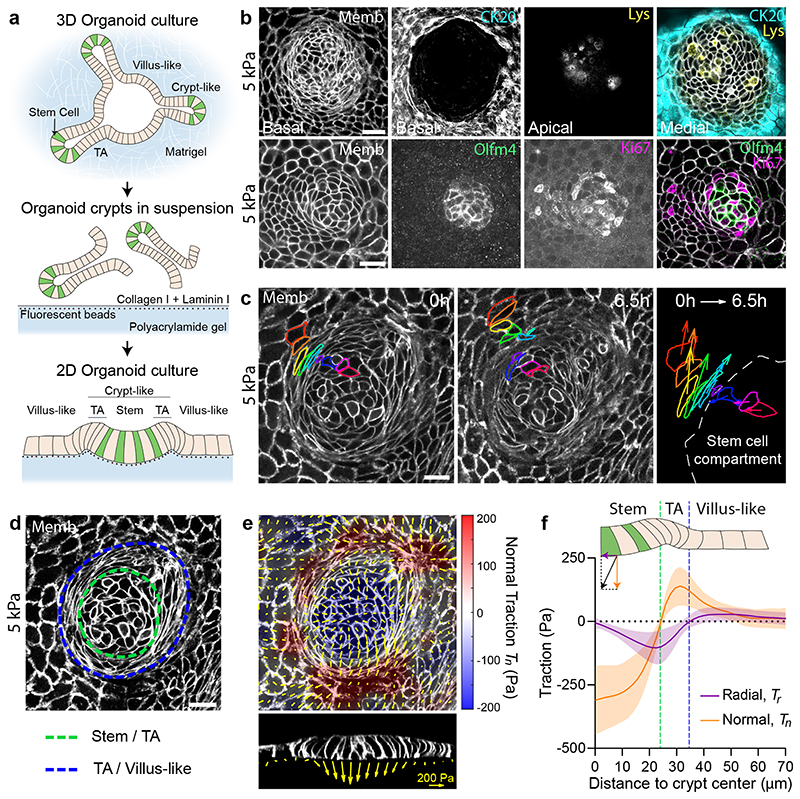
We isolated mouse intestinal crypts and seeded them on soft (5kPa) polyacrylamide gels coated with collagen-I and laminin-1. Crypts adhered readily on the flat substrates and spread in a process akin active tissue wetting (Fig. 1a, Supplementary Video 1)25. A few days after crypt spreading, the substrate was covered by a continuous monolayer that showed compartmentalization of the main cell types of the intestinal epithelium26–30 (Fig. 1b, Extended Data Fig.1). Stem cells (labelled with Lgr5 and Olfm4) and Paneth cells (labelled with lysozyme) were intermingled in a roughly circular compartment devoid of any other cell type. This stem cell compartment was surrounded by a ring of highly proliferative cells (positive for Ki67) elongated in the direction parallel to the crypt contour. Outside this ring, cells expressed differentiation marker Cytokeratin-20 and increased their spreading area. These results show that, whereas curvature may influence self-renewal of the intestinal epithelium31, it is not required for its compartmentalization.
Fig. 1. Tractions exerted by intestinal organoids define mechanical compartments.
a, Preparation of mouse intestinal organoids on 2D soft substrates. b, Organoids expressing membrane targeted tdTomato (Memb, basal plane) stained for cytokeratin 20 (CK20, basal plane), Lysozyme (Lys, apical plane), Olfm4 (basal plane) and Ki67 (basal plane). Scale bar, 20 μm. Images are representative of 3 independent experiments. c, Displacements of representative cells over 6.5h. Each color labels one cell. Note that one cell divided (green). Right: displacement vector of each cell. Scale bar, 20 μm. See also Supplementary Video 3. Representative of 3 independent experiments. d, Illustration of the boundaries between the stem cell compartment and the transit amplifying zone (green) and between the transit amplifying zone and the villus-like domain (blue). Scale bar, 20 μm. e, Top: 3D traction maps overlaid on a top view of an organoid. Yellow vectors represent components tangential to the substrate and the color map represents the component normal to the substrate. Bottom: lateral view along the crypt horizontal midline. Yellow vectors represent tractions. Scale vector, 200 Pa. Representative of 7 independent experiments. f, Circumferentially averaged normal tractions Tn (orange) and radial tractions Tr (purple) as a function of the distance to the crypt center. Blue and green dashed lines indicate the radii where Tn and Tr are zero, which closely correspond to the boundaries between functional compartments illustrated in d. Radial traction at villus is significantly different from 0 (One-Sample Wilcoxon test, p<0.0001). Data are represented as mean ± SD of n=37 crypts from 7 independent experiments.
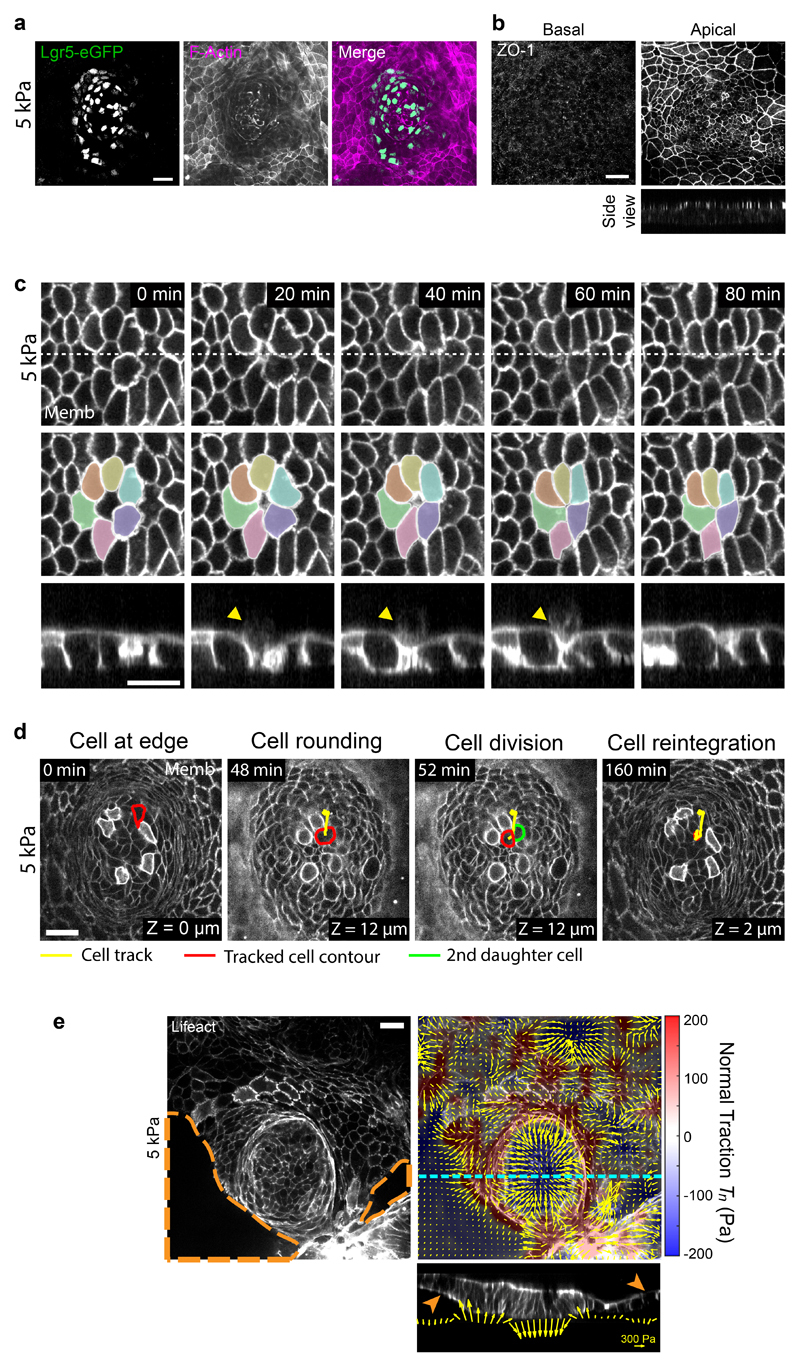
We next asked whether cells in each compartment retained their in vivo homeostatic functions. Time-lapse imaging showed that stem cells divided frequently and that daughter cells entered the highly proliferative zone, where they divided further (Fig. 1c, Supplementary Videos 2, 3). Upon leaving this zone, cells continued to move into the differentiated zone, where they were extruded (Fig. 1c, Extended Data Fig. 1c, Supplementary Video 4, 5). Following division at the boundary of the stem cell compartment, some daughter cells moved towards the center of the crypt, consistent with the notion that border cells can gain short-term self-renewal potential by changing their radial position within the niche3 (Extended Data Fig. 1d, Supplementary Video 6). Given the analogy between organoid monolayer and the intestinal epithelium in vivo, we adopt the following nomenclature: the region containing only stem cells and Paneth cells will be called the stem cell compartment; the region containing highly proliferative elongated cells will be called the transit amplifying zone (TA); and the region containing differentiated cells will be called the villus-like domain (Fig. 1b, d).
We used traction microscopy to map the 3D traction forces exerted by the epithelial monolayer on its underlying substrate18,32. Traction maps revealed systematic mechanical patterns that were radially symmetric about the crypt center (Fig. 1d, e). We decomposed these traction patterns into a normal component (Tn, perpendicular to the substrate) and a radial component (Tr, parallel to the substrate). At the stem cell compartment, normal tractions were negative, indicating that stem cells and Paneth cells pushed the substrate downward (Fig. 1e, f). The magnitude of normal tractions was highest at the crypt center, decreased radially away from it, and vanished at the margin of the stem cell compartment. At the transit amplifying zone, normal tractions became positive, indicating that cells in this region pulled the substrate upward. After peaking at the transit amplifying zone, normal tractions decreased in the villus-like domain except in a few areas where the monolayer had delaminated to form pressurized domes (Extended Data Fig. 1e)18. The radial component of the traction field was negligible at the center of the stem cell compartment and became progressively negative (i.e., pointing inward) towards its border, where it peaked near the transit amplifying zone. At the outer border of this zone, radial tractions vanished and became slightly but significantly positive (i.e., pointing outward) in the villus-like domain (Fig. 1e, f). These measurements reveal that the intestinal epithelium generates non-monotonic traction fields on the substrate, defining distinct mechanical compartments that colocalize with functional compartments; the stem cell compartment pushes downward, the transit amplifying zone pulls upward and shears inward, and the villus-like domain shears outward.
Crypt size and folding depend on substrate rigidity
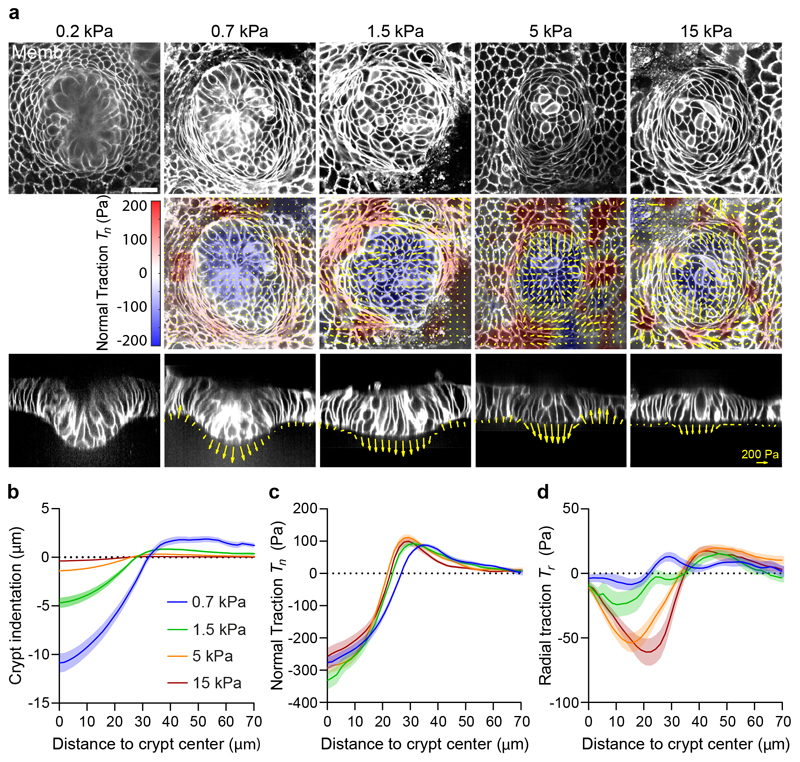
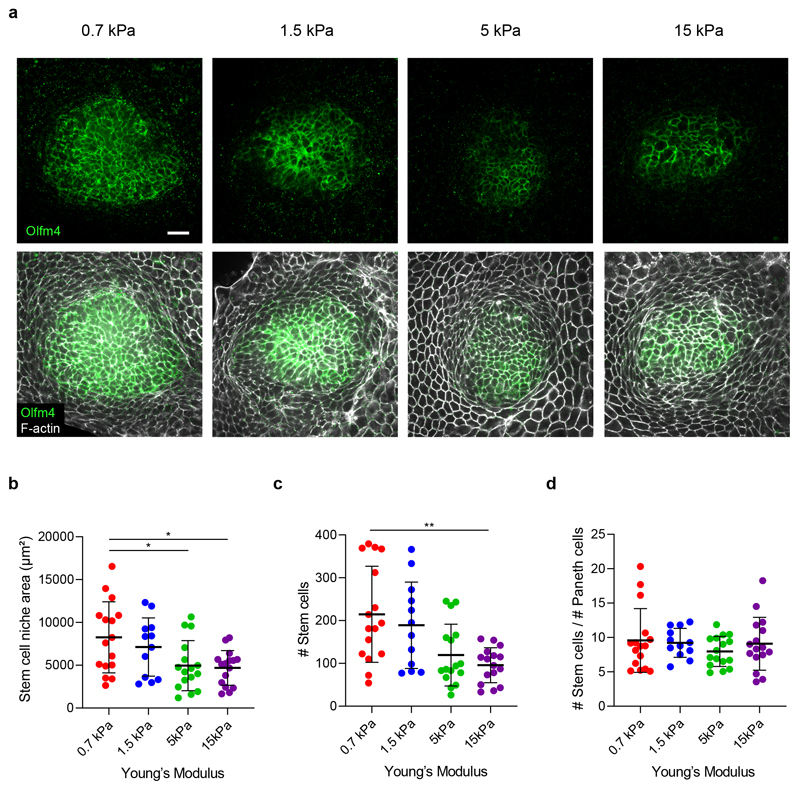
We next asked how these mechanical compartments control the shape and function of the crypt and its transition towards the villus-like domain. Our measurements of normal tractions (Fig. 1e, f) suggest that the crypt folds by pushing the stem cell compartment towards the substrate, but folding was frustrated because the underlying substrate was too stiff. Thus, we investigated whether a sufficiently soft substrate would enable the stem cell compartment to adopt the folded shape characteristic of 3D organoids and in vivo crypts. To study the interplay between substrate stiffness, tractions and folding, we cultured intestinal organoids on substrates of varying stiffness, spanning nearly two orders of magnitude. On the stiffest substrate (15kPa), the stem cell compartment bulged out of the monolayer (Fig. 2a). By contrast, when organoids were grown on progressively softer substrates, they showed an increasingly pronounced folding (Fig. 2a, b). We measured cell tractions for each substrate stiffness except for the 0.2kPa substrates, which displayed extreme deformations and hydrogel creasing instabilities that prevented an accurate calculation (Fig. 2a). The radial traction component was strongly dependent on substrate stiffness whereas the normal component was not (Fig. 2c,d). This observation prompted us to study whether substrate stiffness influences epithelial compartmentalization. We found that the size of the stem cell compartment and the number of stem cells therein decreased with substrate stiffness (Fig. 3a-c). By contrast, the ratio of stem cells to Paneth cells was insensitive to stiffness (Fig. 3d). These experiments show that the mechanical microenvironment regulates intestinal homeostasis.
Fig. 2. A stiffness-independent normal traction folds the crypt.
a, Top: single confocal plane of representative crypts on substrates of increasing stiffness. Center: 3D traction maps. Yellow vectors represent components tangential to the substrate and the color map represents the component normal to the substrate. Bottom: lateral view along the crypt midline. Yellow vectors represent tractions. Scale bar, 20 μm. Scale vector, 200Pa. Representative images of n=14 (0.2kPa), 23 (0.7kPa), 23 (1.5kPa), 37 (5kPa) and 30 (15kPa) crypts from 2, 3, 3, 7 and 4 independent experiments, respectively. Crypt indentation (b), normal traction (c) and radial traction (d) as a function of the distance to the crypt center for substrates of different stiffness. Data are represented as mean ± SEM of n=23 (0.7kPa), 23 (1.5kPa), 37 (5kPa) and 30 (15kPa) for indentation (b) and n=14 (0.7kPa), 12 (1.5kPa), 36 (5kPa) and 30 (15kPa) crypts for tractions (c-d) from 3, 3, 7 and 4 independent experiments, respectively.
Fig. 3. The size of the stem cell compartment decreases with substrate rigidity.
a, Immunostainings of Olfm4 and F-actin (phalloidin) on substrates of increasing stiffness. Due to pronounced crypt folding, for visualization purposes, the image on 0,7 kPa is a projection along the crypt medial plane. Representative images of 3 independent experiments. Scale bar, 20μm. b-d, Quantification of the stem cell compartment area (b); number of stem cells (c) and ratio between the number of stem and Paneth cells (d) for substrates of increasing stiffness. n = 16 (0.7kPa), 12 (1.5kPa), 16 (5kPa) and 16 (15kPa) crypts from 3 independent experiments. Statistical significance was determined by a one-way ANOVA followed by a Tukey multiple comparison test (b) and a Kruskal-Wallis followed by a Dunn’s multiple comparison test (c, d). Only statistically different pairwise comparisons are indicated. *(p<0.05) **(p<0.01); in b, p = 0.0305 for 0.7-5kPa and p = 0.0157 for 0.7-15kPa; in c, p = 0.0071 for 0.7-15kPa.
The crypt folds through apical constriction
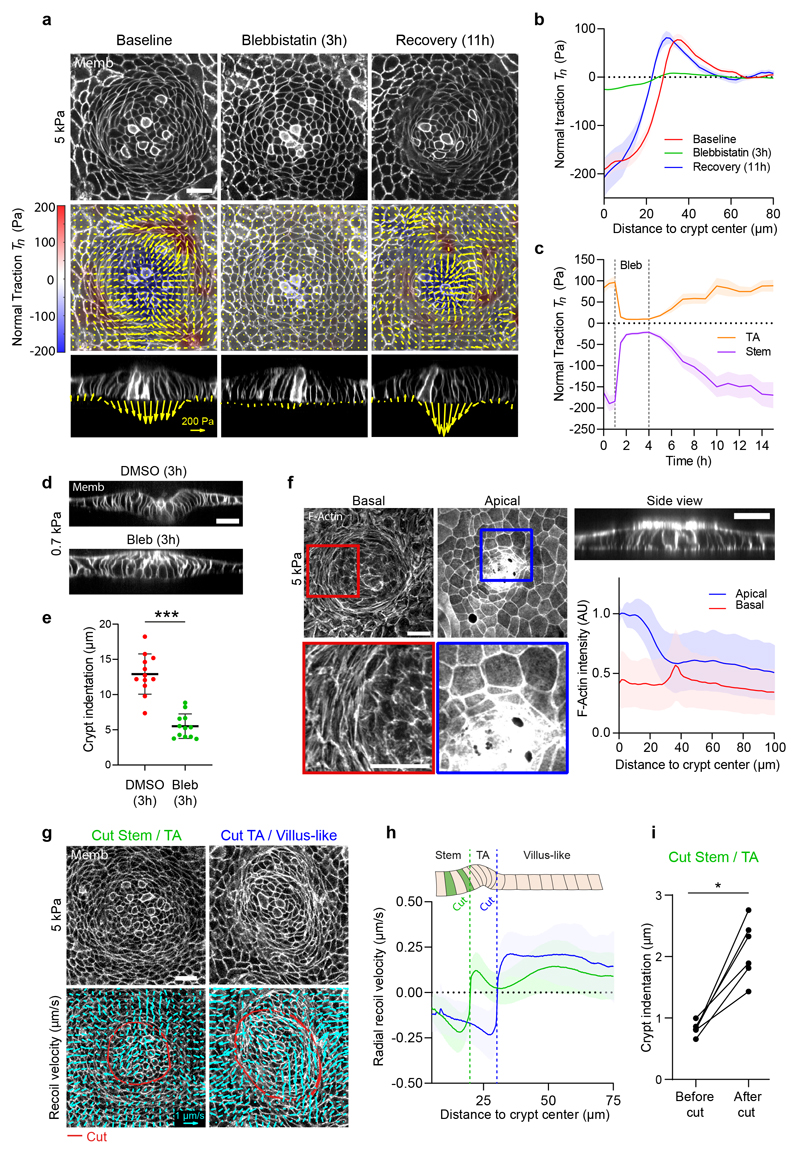
Two classes of folding mechanisms can explain the observed traction patterns and monolayer geometry. The first class relies on differentials in mitotic pressure8–10,33, which can induce a buckling instability that pushes the stem cell compartment towards the substrate. A second class is based on differentials in myosin contractility, either across the monolayer plane12 or along the apicobasal axis14–16. To discriminate between these two classes of mechanisms we treated cells with blebbistatin. Upon addition of increasing doses (0.5μM to 15μM) of this specific inhibitor of myosin II ATPase activity, traction forces were progressively impaired, and the monolayer flattened gradually (Extended Data Fig. 2a-c). At 15μM, all traction forces vanished (Fig. 4a-c, Supplementary Video 7) and crypt indentation was negligible (Fig. 4d, e). The elongated shape of the basal cell surface at the transit amplifying zone, which was unaffected by the stiffness of the gel, was largely lost by this treatment. When blebbistatin was washed out, traction patterns reemerged, the elongated morphology was recovered, and the monolayer refolded (Fig. 4a-c, Extended Data Fig. 2d). Remarkably, crypt size decreased after recovering from blebbistatin, further emphasizing a mechanical control of intestinal homeostasis (Fig. 4a, b).
Fig. 4. The crypt folds under tension generated by myosin II.
a, Traction maps under baseline conditions (left), after 3h of blebbistatin treatment (center), and after 11h of blebbistatin washout (right). Top: membrane targeted tdTomato (medial plane). Center: 3D traction maps. Yellow vectors represent components tangential to the substrate; color map represents the component normal to the substrate. Bottom: lateral view along the crypt midline. Representative images of 3 independent experiments. Scale vector, 200Pa. b, Normal traction as a function of the distance to crypt center before, during, and after blebbistatin. n=11 samples (3 independent experiments). c, Time evolution of normal traction for the stem cell compartment and the TA before, during and after blebbistatin treatment. n=11 samples (3 independent experiments). d, Lateral views of crypts seeded on 0.7kPa gels and treated with DMSO (top) or blebbistatin (bottom) for 3h. e, Indentation at the center of the crypt in cells treated with DMSO or blebbistatin for 3h. n=12 crypts from 2 independent experiments (p<0.0001, two-tailed unpaired Student’s t-test). f, F-actin (phalloidin) staining of crypts on 5kPa gels. Left and center: projections of basal (left) and apical (center) F-actin of a representative crypt. Top right: Lateral view of the same crypt. Bottom right: Radial distribution of apical (blue), basal (red) F-actin intensity as a function of the distance to crypt center. n=36 crypts (4 independent experiments). g, Bottom: Recoil velocity maps immediately after ablation of two crypts along the red lines. Left: cut inside the TA. Right: cut outside the TA. Scale vector, 1μm/s. Top: the two crypts before ablation. h, Radial recoil velocity as a function of distance to crypt center for cuts between stem cell compartment and TA (green) and between TA and villus-like domain (blue). n=14 (cut Stem/TA), n=11 (cut TA/Villus-like) crypts from 5 independent experiments. i, Indentation at the center of the crypt before and after cutting between the stem cell compartment and the TA. n=6 crypts from 2 independent experiments (p=0.0313, two-tailed Wilcoxon paired test). *** p<0.001, *p<0.05. Data represented as Mean ± SEM (b, c) or Mean ± SD (e, f, h). Scale bars, 20μm.
To study how the actomyosin cytoskeleton drives crypt folding, we measured the distribution of actin and myosin across organoid monolayers seeded on stiff (5kPa) and soft (0.7kPa) substrates. Irrespective of substrate stiffness, F-actin stainings (phalloidin) and live imaging of organoids expressing myosin IIA-eGFP revealed an actomyosin accumulation at the apical surface of the stem cell compartment (Fig. 4f, Extended Data 2e, 3a, b). In addition, they showed a basal ring of circumferential stress fibers under the elongated cells at the transit amplifying zone. This actomyosin distribution suggests two potential mechanisms that are not mutually exclusive. The first one is that myosin differentials across the apicobasal cell axis drive monolayer bending through apical constriction. The second one is that supracellular contraction of the transit amplifying zone compresses radially the stem cell compartment to induce its buckling. To assess the contribution of bending vs buckling, we reasoned that both mechanisms involve cell-cell stresses of opposite sign. In the bending scenario, cells in the stem cell compartment should pull on each other differentially along the apicobasal axis to indent the substrate, thereby generating an apical tensile stress. By contrast, in the buckling scenario, cells in the stem cell compartment should push on each other as a result of the compressive stress generated by the contractile ring at the transit amplifying zone.
To measure the sign of the stress field, we performed circular laser ablations along the internal or external boundaries of the transit amplifying zone. In both cases, ablations induced a radial recoil on both sides of the cuts (Fig. 4g, Extended Data Fig. 2f, Supplementary Videos 8-11). Recoils were asymmetric and showed non-monotonic velocity fields, suggesting that monolayer friction and viscosity follow a complex spatial distribution that prevents a straightforward readout of relative tensions from recoil dynamics (Fig. 4h, Extended Data Fig. 2g, h). However, the fact that monolayers recoiled on both sides of the cuts implies that the crypt is under tension. Moreover, after cutting the monolayer at the inner boundary of the transit amplifying zone, the stem cell compartment increased its indentation of the substrate (Fig. 4i). This set of experiments rules out compressive buckling driven by myosin differentials between crypt compartments or by mitotic pressure. Instead, it shows that the stem cell compartment bends by apical constriction.
The actomyosin cortex determines cell shape and traction
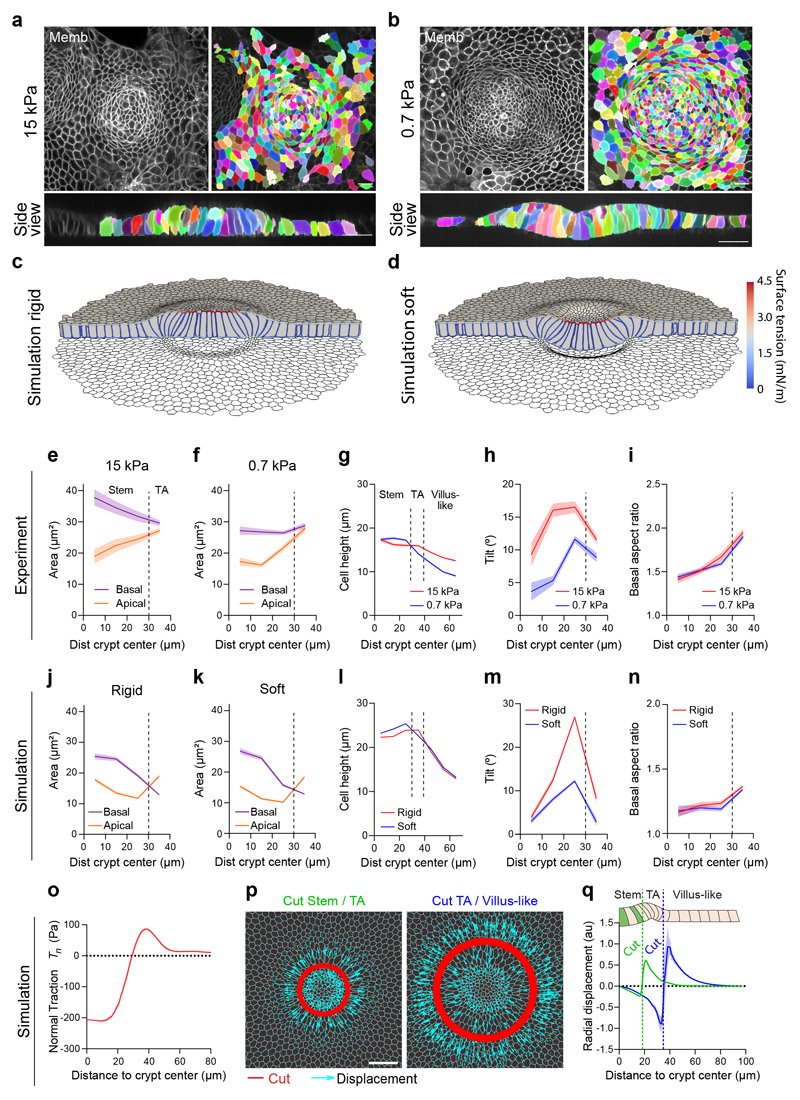
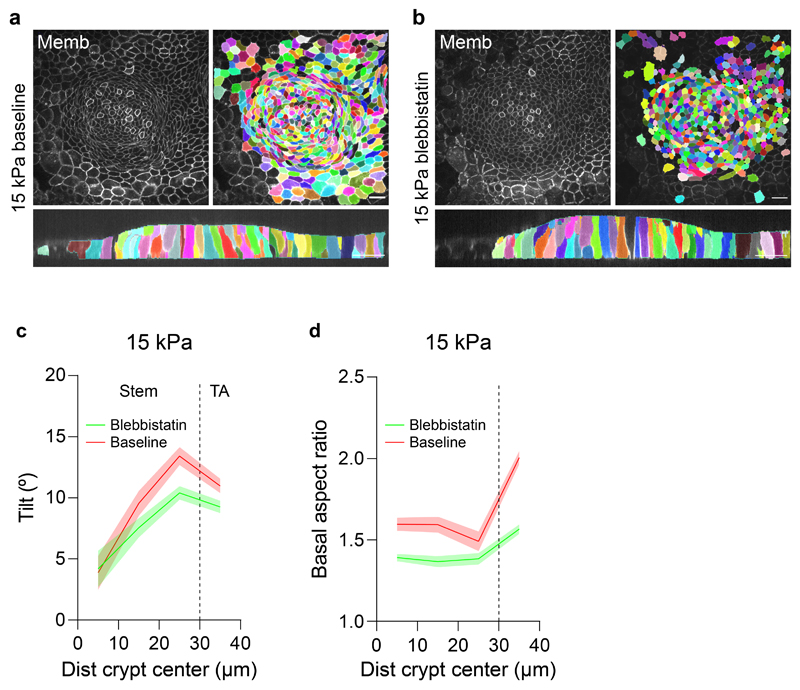
We next investigated how cell shape evolves between compartments (Fig. 5a-n). To this aim, we segmented individual cell shape in crypts grown on stiff (15kPa) and soft (0.7kPa) substrates. Cell shapes were heterogeneous (Extended Data Fig. 4a, Supplementary Videos 12, 13), but averages over all cells and crypts revealed consistent morphometric patterns (Fig. 5a, b). Both on stiff and soft substrates, the apical area of stem cells was smaller than the basal one (Fig. 5e, f). Paneth cells showed the opposite behavior (Extended Data Fig. 4a-d), indicating that stem but not Paneth cells drive apical constriction of the stem cell compartment. Both cell types were taller than differentiated cells (Fig. 5g) and displayed an apicobasal tilt towards the center of the crypt that peaked at the boundary between the stem cell compartment and the transit amplifying zone (Fig. 5h). Upon reaching this boundary, differences between apical and basal area vanished and cells became basally elongated along the circumferential direction (Fig. 5i). Treatment with blebbistatin for 3h reduced the tilt at the stem cell compartment and the basal aspect ratio of every cell type at the crypt (Extended Data Fig. 5).
Fig. 5. Crypts fold through apical constriction.
a-b, 3D Crypt segmentation on stiff (a, 15kPa) and soft (b, 0.7kPa) substrates. Representative of 3 crypts per stiffness from 2 (0,7kPa) and 3 (15kPa) independent experiments. Scale bar, 20 μm. c-d, 3D vertex model of a monolayer adhered to a stiff (c) and soft (d) substrate. The colors in the cell outlines indicate surface tension. e-f, Apical and basal area profiles on stiff (e, 15kPa) and soft (f, 0.7kPa) substrates (Mean ± SEM). Paneth cells were excluded from the analysis (see Extended Data Fig. 4). From center to edge bins, n=77, 198, 339, 307 cells for soft substrates and 32, 61, 102, 230 for stiff substrates from 2 (0,7kPa) and 3 (15kPa) independent experiments. g-i Cell height (g), apicobasal tilt (h) and basal aspect ratio (i) as a function of distance to crypt center on soft and stiff substrates (Mean ± SEM). Paneth cells were excluded from the analysis of the tilt and aspect ratio (see Extended Data Fig. 4). Vertical dashed line indicates boundary between stem cell compartment, the TA and the villus-like domain (in g). Crypts are the same as in panel e-f. For cell height profiles, from center to edge bins, n=77, 198, 339, 307, 242, 192, 159 cells for soft substrates and n=32, 61, 102, 230, 165, 125, 106 cells for stiff substrates. j-k, Simulated apical and basal area profiles on a rigid (j) and soft (k) substrate (Mean ± SEM). From center to edge bins, n=9, 26, 54, 230 simulated cells for soft substrate and n=10, 28, 54, 227 simulated cells for stiff substrate. l-n, Simulated cell height (l), apicobasal tilt (m) and basal aspect ratio (n) on soft and rigid substrates. Crypts are the same as in j-k. o, Simulated normal traction. p, Simulated tissue recoil after laser ablations (red) at the boundary between stem cell compartment and TA (left) or between TA and villus-like domain (right). Cyan vectors indicate tissue displacement right after ablation. Scale bar, 20 μm. q, Radial displacement in the two simulated cuts (Mean ± SD). Vertical dashed lines indicate cuts.
To investigate the link between tissue shape, cell shape, cell-ECM tractions, and actomyosin localization we developed a 3D vertex model34–36 of the crypt coupled to a soft hyperelastic substrate (Supplementary Note 1, Extended Data Figs. 6, 7). We considered a uniform flat monolayer with a pattern of cell surface tensions as suggested by the measured distribution of cortical components (Fig. 4f, Extended Data Figs. 2e, 3). Specifically, we prescribed apical and basal surface tensions with a profile following the measured F-actin density (Fig. 4f, Supplementary Note 1). We then allowed the monolayer to equilibrate its shape while adhering to the substrate. The model was able to recapitulate all morphological features of the monolayer, both at the cell and tissue scales, including cell height, shape and monolayer folding for both soft and stiff substrates (Fig. 5c, d). The model captured apical constriction (Fig. 5j, k) and increased cell height (Fig. 5l) at the stem cell compartment, apicobasal cell tilt (Fig. 5m), and basal tangential elongation at the transit amplifying zone (Fig. 5n). Besides cell and tissue morphology, the model also predicted the distribution of normal cell-substrate tractions (Fig. 5o), from which we estimated a maximum apical tension of 4.6 ± 1.7 mN/m (mean ± SD). The model also captured the local recoil of the monolayer following laser cuts (Fig. 5p, q). The overall agreement between model and experiments shows that a stereotyped contractility pattern in the crypt can explain its stiffness-dependent shape and normal traction patterns.
Cell fate and mechanics co-evolve during crypt formation
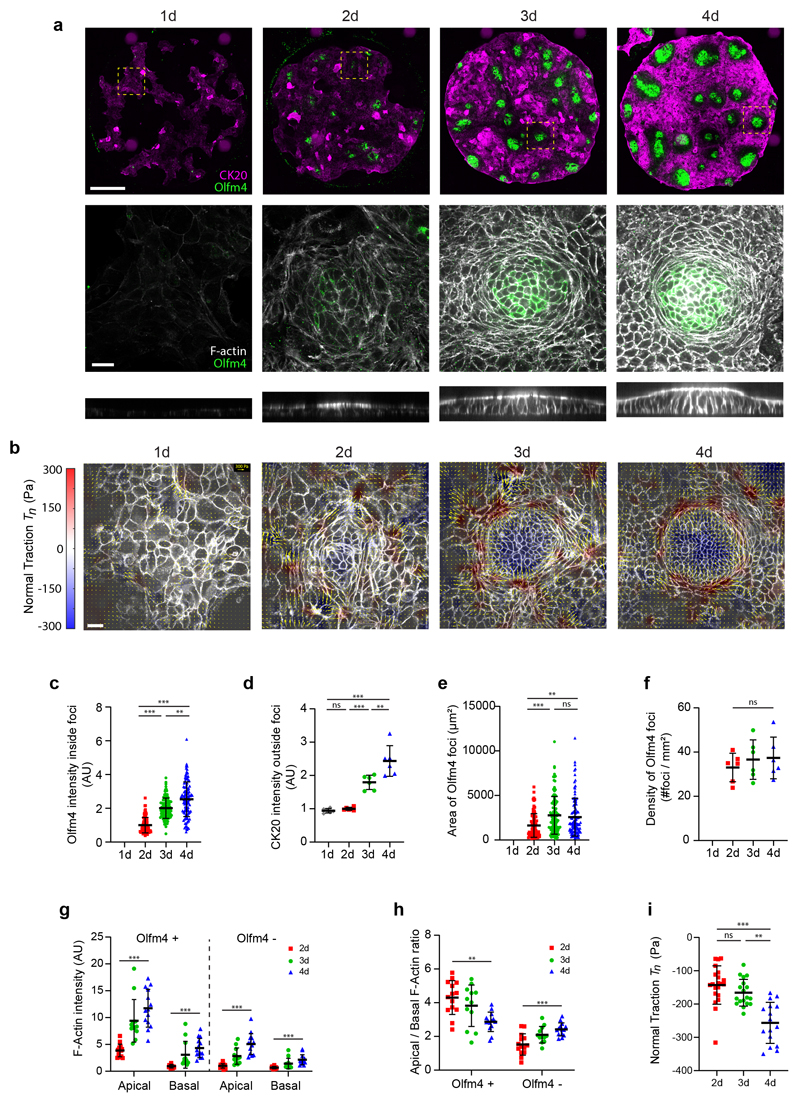
We next studied how this mechanical picture co-evolves with cell fate specification during crypt formation. We treated 3D organoids with ENR medium containing CHIR99021 and Nicotinamide for 48h to mimic a hyperproliferative fetal progenitor state37–39. Upon this treatment, organoids lost their buds and formed cysts. We then dissociated the cysts and seeded the resulting cells at high density on soft 2D substrates. Cells adhered readily, proliferated, and progressively formed a confluent monolayer. This monolayer lacked the packing geometry, the apical accumulation of actomyosin, the traction compartmentalization, and the expression pattern of Olfm4 and Cytokeratin-20 characteristic of crypts and villi. One day after replacing the culture medium with regular ENR, we observed the formation of cellular foci that expressed Olfm4, exhibited apical F-actin and myosin IIA, and generated downward traction (Fig. 6a, b). The expression levels of Olfm4 inside the foci and of Cytokeratin-20 outside them increased steadily over the following days (Fig. 6c, d). The number of foci was constant in time, and their size plateaued after 24 hours (Fig. 6e, f). F-actin and myosin IIA increased over time at apical and basal surfaces both at the crypt and villus-like compartments (Fig. 6g, Extended Data Fig. 8 a-c). Even though apical actin and myosin density at the stem cell compartment were the highest across the monolayer, their ratio to basal density decreased with time (Fig. 6h, Extended Data Fig. 8d). Yet, normal forces at the center of the stem cell compartment increased, likely because of the rise in total amount of actomyosin (Fig. 6i). These experiments show that apical constriction and pushing forces arise as early as Olfm4 foci are detected (day 2), before crypt size and density in the monolayer are established (day 3). Forces thus co-evolve with fate specification to progressively shape a mature compartmentalized epithelium.
Fig. 6. Co-evolution of cell fate and tissue mechanics during de novo crypt formation.
a, Immunostainings of Olfm4 and Cytokeratin 20 (CK20) following the development of the monolayers over 4 consecutive days (Top row). Scale bar, 200 μm. F-actin (phalloidin) and Olfm4 immunostaining (middle row) and lateral views of F-actin (bottom row) at the positions indicated with a dashed square in the corresponding monolayers of the top row. Scale bar, 20 μm. Representative images of 2 independent experiments. b, 3D tractions at the indicated time points. Yellow vectors represent components tangential to the substrate and the color map represents the component normal to the substrate. Scale bar, 20 μm. Scale vector, 300Pa. Representative images of 2 independent experiments. c-f, Quantification of Olfm4 intensity inside the Olfm4 positive foci (c); Cytokeratin 20 intensity (CK20) in the Olfm4 negative regions (d); area of the Olfm4 positive foci (e) and density of Olfm4 positive foci (f) at the indicated time points. n=90 (2d), 112 (3d) and 115 (4d) Olfm4 positive foci (c, e); n=6 (1d, 2d, 3d and 4d) circular patterns (d, f) from 2 independent experiments. g-h, Quantification of apical and basal F-actin intensity (g) and apical/basal F-actin ratio (h) in the Olfm4+ and Olfm4- regions for the indicated time points. n=14 (2d), 12 (3d) and 14 (4d) crypts from 2 independent experiments. i, Quantification of the mean normal traction at the stem cell compartment for the indicated timepoints. n=21 (2d), 18 (3d) and 16 (4d) crypts from 2 independent experiments. Data represented as Mean ± SD. Statistical significance determined by a Kruskal-Wallis followed by a Dunn’s multiple comparison test (c, e, i, g and h for Olfm4+), and a one-way ANOVA followed by a Tukey multiple comparison test (d, f and h for Olfm4-). In g-h, only the statistical comparison between 2d and 4d is shown. *(p<0.05), **(p<0.01), *** (p<0.001), ns (p>0.05).
Comparison with the intestinal epithelium in vivo
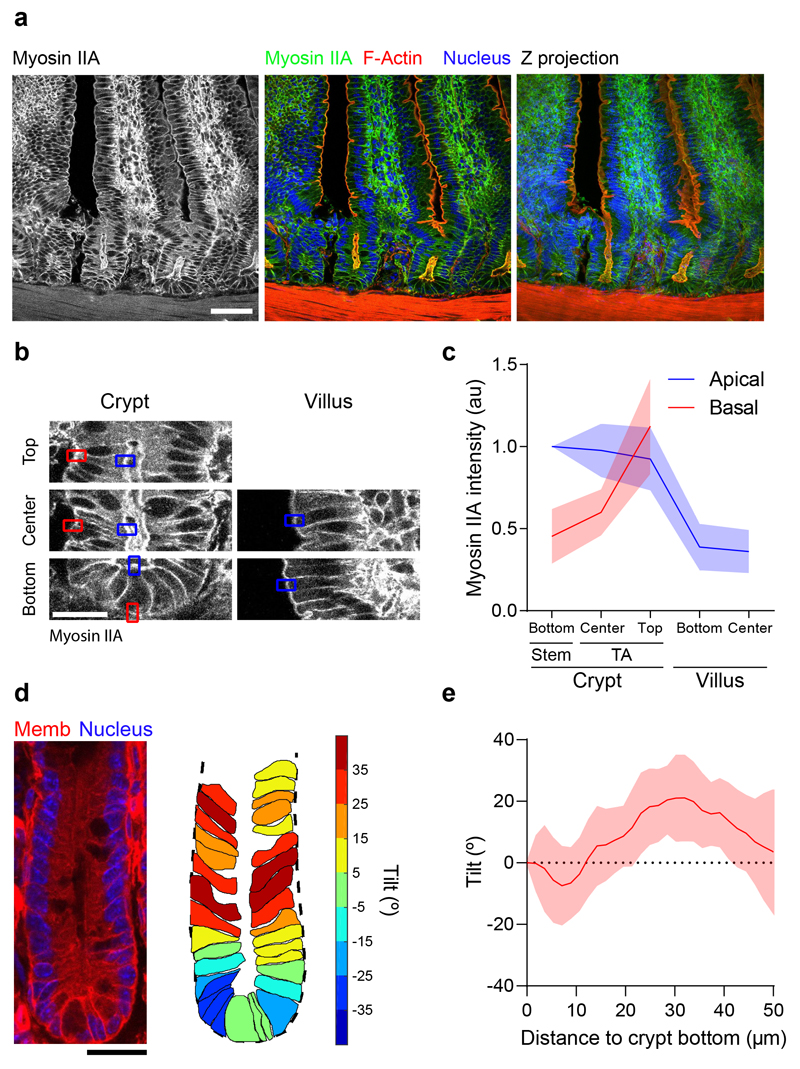
To assess whether our organoids captured the cellular morphology and cytoskeletal organization of the in vivo crypt and villus, we studied wholemount sections of the mouse small intestine. To avoid the confounding contribution of non-contractile F-actin at the brush border, we focused on myosin IIA (Fig. 7a). Apical myosin IIA was highest at the stem cell compartment and dropped at the villus. By contrast, basal myosin IIA increased progressively from the base of the crypt towards the villus, where the presence of stromal cells prevented further quantification (Fig. 7b, c). At the base of the crypt, cells were slightly tilted towards the villus. This tilt is in opposite direction to that observed in our organoids, showing that besides active processes, tilting is influenced by curvature and spatial constrains40. Beyond this highly curved region, cells were tilted towards crypt center, in agreement with our observations in organoids (Fig. 7 d, e). Taken together, these data reveal a substantial agreement between organoids and the intestinal epithelium.
Fig. 7. Cell morphology and cytoskeletal organization of the intestinal epithelium in vivo.
a, F-actin (phalloidin) and nuclei (DAPI) in small intestinal tissue sections from myosin IIA-eGFP mice. Left: myosin IIA-eGFP signal. Center: Overlay of myosin IIA-eGFP, F-actin and nuclei. Right: Maximum intensity Z-projection of the overlayed channels to better visualize the continuity of the crypt-villus axis. Representative image of 13 crypt-villus units from 3 mice. Scale bar, 40 μm. b, Illustration of the quantification approach of myosin IIA intensity along the crypt-villus axis in tissue sections. Myosin intensity was measured at the basal (red) and apical (blue) sides of cells at the indicated crypt and villus regions. Note that the high myosin IIA intensity of stromal cells prevented accurate quantification of basal epithelial intensity at the villus. Representative image of 13 crypt-villus units from 3 mice. Scale bar, 20 μm. c, Apical and basal myosin IIA distribution along the crypt villus axis of tissue sections. Data are represented as mean ± SD of n = 13 crypt-villus units from 3 mice. d, Left: example of an intestinal crypt from membrane-tdTomato mice. Membrane signal (Memb) is overlaid with the nuclear signal (DAPI). Right: Cell segmentation of the same crypt. The basal contour of the crypt is delineated with a black dashed line. Individual cells are colored according to their tilting angle respect to the normal direction to the crypt contour (positive indicates towards the crypt bottom; negative indicates away from the crypt bottom). Representative image of 16 crypts from 3 mice. Scale bar, 20 μm. e, Cell tilt along the crypt axis. Data are represented as mean ± SD of n=16 crypts from 3 mice.
Cells are dragged out of the crypt
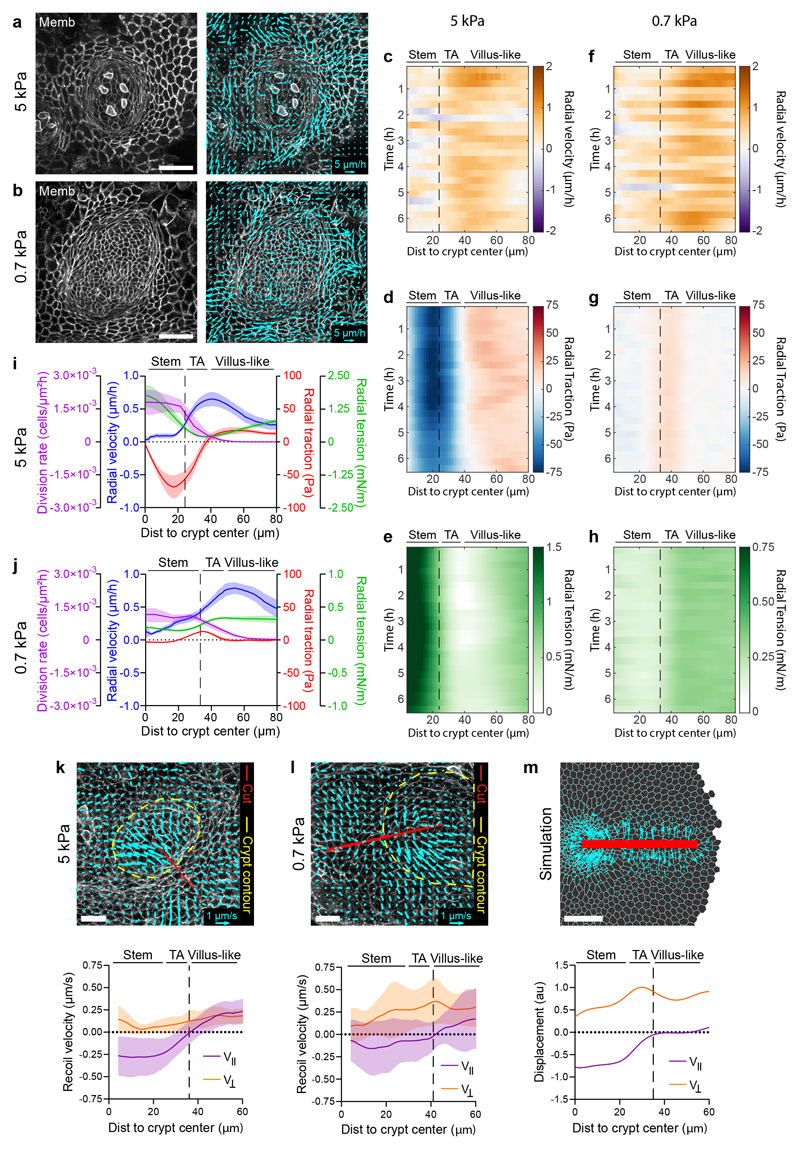
We next studied the dynamics of the cell monolayer. Cell movements at the villus are driven by active migration41, but mechanisms driving movements from crypt to villus remain unknown. The widely assumed mechanism for such movements, a pushing force arising from compression downstream of mitotic pressure42,43, is incompatible with our observation that the transit amplifying zone is under tension. To study the mechanisms underlying cell movements, we studied maps of cell velocities and forces in the organoid monolayers (Figs. 8a-j). On 5kPa gels, particle imaging velocimetry (PIV) revealed strong spatial fluctuations in cell velocities, characterized by clusters of fast-moving cells surrounded by nearly immobile ones (Fig. 8a, Supplementary Video 14). To average out these fluctuations and unveil systematic spatiotemporal patterns, we computed the average radial velocity as a function of the distance from crypt center. Kymograph representation of this average showed that radial velocity was weak in the central region of the stem cell compartment, begun to increase near the transit amplifying zone, and peaked at the boundary with the villus-like domain (Fig. 8c, i). The cell division rate followed an opposite profile characterized by a plateau at the stem cell compartment and a decrease thereafter.
Fig. 8. Cells are dragged out of the crypt towards the villus-like domain.
a-b, Representative velocity maps (right) overlaid on membrane-targeted tdTomato signal (shown in left panel) on 5kPa (a) and 0.7kPa (b) substrates. Due to pronounced crypt folding, for visualization purposes, the image on 0.7 kPa is a projection along the crypt medial plane. Representative image of 5 crypts from 3 independent experiments for 5kPa substrates and 7 crypts from 2 independent experiments for 0.7kPa. Scale bar, 40 μm. Scale vector, 5 μm/h. c-h, Kymographs showing the circumferentially averaged radial velocity (c, f), radial traction (d, g) and radial tension (e, h) on 5kPa (c-e) and 0.7kPa (f-h) substrates for 6.5 hours. Vertical dashed line indicates the boundary between the stem cell compartment and the transit amplifying zone. i-j, Time averaged radial profiles of traction, tension, velocity and cell division rate on 5kPa (i) and 0.7kPa (j) substrates. Vertical dashed line indicates the boundary between the stem cell compartment and the transit amplifying zone. Data are represented as mean ± SEM of n=5 crypts from 3 independent experiments for 5kPa substrates and n=7 crypts from 2 independent experiments for 0.7kPa (c-j). Note that for an unbounded monolayer, MSM computes stress up to a constant (Supplementary Note 2). Since laser cuts indicated tension everywhere in the monolayer, this constant was arbitrarily set so that the minimum tension throughout the time lapse was zero. k-m, Recoil velocity maps (top) and quantification of parallel and perpendicular velocity (bottom) immediately after laser ablation along the crypt-villus axis on 5kPa (k), 0.7kPa (l) substrates and simulations (m). Red line indicates ablated area. Yellow dashed line indicates crypt contour. Data are represented as mean ± SD of n=11 crypts from 3 independent experiments for 5kPa substrates and n=13 crypts from 4 independent experiments for 0.7kPa. Scale bars, 20 μm.
To understand how the spatial distribution of cell velocity arises from cellular forces, we turned to kymographs of radial cell-ECM tractions and radial cell-cell monolayer tension measured with Monolayer Stress Microscopy (MSM, Supplementary Note 2)44. Like velocity kymographs, traction and tension kymographs were stationary, confirming that our 2D organoids are in steady state within our window of observation (Fig. 8d, e). Kymographs of radial tractions displayed the three compartments already shown in Fig. 1e; in the stem cell compartment radial tractions pointed inwards, in the transit amplifying zone they vanished, and in the villus-like domain they pointed outwards (Fig. 8i). By contrast, kymographs of cell-cell tension showed a minimum at the transit amplifying zone flanked by two tension gradients that build-up towards the center of the crypt and towards the villus-like domain (Fig. 8e, i).
We repeated this set of experiments on softer substrates (0.7kPa) (Fig. 8b, Supplementary Video 15) which showed similar cell velocity profiles to those obtained on 5kPa substrates (Fig. 8f-h, j). In this compartment, radial tractions were nearly one order of magnitude weaker than on 5kPa substrates. Close to the transit amplifying zone, radial tractions changed direction and displayed a positive peak of similar magnitude but shorter length than on 5kPa substrates. The pronounced negative gradient in tension observed at the stem cell compartment on 5kPa nearly vanished on 0.7kPa substrates. However, we found a positive tension gradient that begins at the boundary of the stem cell compartment, persists through the transit amplifying zone, and decays thereafter. Thus, despite large quantitative differences at the stem cell compartment on soft and stiff substrates, radial tractions on both substrates displayed a region where they changed sign and pointed away from the crypt center, resulting in a positive tension gradient.
To further substantiate this tensional landscape, we resorted again to laser ablation, but this time we cut the monolayer radially. As commonly observed in laser ablation experiments, we found recoil perpendicular to the cut (Fig. 8k-m, Supplementary Video 16-17). Surprisingly, however, the dominant recoil component was parallel to the cut. This radial recoil was minimum at the boundary between the crypt and the villus-like domain and increased on either side of it. Our vertex model predicts radial recoil at the stem cell compartment as a consequence of apical constriction, but not at the villus-like domain. Recoil in this domain is consistent with a tensile gradient associated with migratory forces that pull cells out of the crypt, which are not included in our model.
Together, our data indicate that cells exit the crypt using a collective cell migration mode in which cell velocity is parallel to cell-substrate traction, rather than antiparallel to it. This alignment is opposite to that observed at the leading edge of advancing monolayers45,46. Because cells are under tension, outward-pointing tractions cannot arise from pushing forces generated at the stem cell compartment. Rather, our evidence indicates that cells at the crypt are dragged by other cells located further into the villus-like domain, much as the trailing edge of a cell cluster is dragged by the leading edge47. Thus, the boundary of the crypt can be understood as a multicellular trailing edge that is constantly being replenished with cells through proliferation.
Discussion
Organoid biology has revolutionized life sciences by providing accessible systems to study the interplay between tissue fate, form and function. Mechanics plays a central role in this interplay48–51, but our understanding of organoid mechanobiology has been impaired by the lack of approaches to map cellular forces within organoids. Traction maps can be obtained in organoids surrounded by 3D ECM but their resolution and accuracy is strongly limited by the non-linearity of the ECM, its degradability, and limited optical accessibility of the sample24,52. Here we presented mechanically accessible intestinal organoids that enable time-lapse force mapping with sub-cellular resolution. Besides enabling direct force mapping, our organoid monolayers offer several advantages over traditional 3D organoids surrounded by ECM. These advantages include versatile control of the mechanical environment, straightforward optical access, and an open lumen that better mimics the open tube configuration of gut and prevents the unphysiological accumulation of extruded cells 26–31. Moreover, cells in our organoids exhibit a collective migratory pattern from the crypt to the villus, a feature that is not well captured by traditional 3D organoids. As other organoid models, our system misses some features of the in vivo epithelium. Limitations include that the transit amplifying zone is shorter than in vivo, the villus geometry is not recapitulated, and cells in the villus-like domain are thinner than in vivo and lack a well-developed brush border.
Direct access to cellular forces allowed us to identify mechanical compartments in which cell-substrate tractions, monolayer stresses and their spatial derivatives differ in magnitude and sign. We showed how these compartmentalized mechanical variables enable both tissue folding and collective cell migration. In an accompanying paper, Yang et al53 studied the mechanics of crypt morphogenesis in intestinal organoids enclosing a pressurized lumen. In agreement with our results, they report apical constriction of stem cells (but not Paneth cells) and basal constriction beyond the boundary of the niche. They also report a contribution of volume changes in enterocytes, which we did not address in our study. We note that our finding that the stem cell compartment folds further when separated from the rest of the epithelium (Fig. 4i), indicates that basal accumulation of actomyosin at the villus or changes in volume in enterocytes are dispensable for folding. Both studies reveal the potential of organoid systems to study the mechanobiological principles of gut epithelial shape and compartmentalization. These approaches can also be applied to study the role of mechanics in other key processes in intestinal physiology and disease, such as proliferation, differentiation, inflammation, regeneration and malignancy.
Methods
Intestinal crypt isolation and organoid culture
Animal experimentation was approved by the Animal care and Use Committee of Barcelona Science Park (CEEA-PCB) and Animal Welfare Body, Research Centre, Institut Curie. All procedures were carried out in compliance with the European Regulation for the Protection of Vertebrate Animals used for Experimental and other Scientific Purposes (Directive 2010/63). Mice were housed with a 12h dark-light cycle, at 20±4°C and 20-85% of humidity. Intestinal crypts from mT/mG54, LifeAct-eGFP55, myosin IIA-eGFP56, and Lgr5-eGFP-IRES-CreERT22 3-6 months old male and female mice were isolated as described elsewhere19. The duodenum was isolated, washed in PBS and cut longitudinally. Villi were mechanically removed with a scalpel. The tissue was then dissociated in HBSS (Gibco) containing 8mM of EDTA (Sigma-Aldrich) for 20 minutes at 4°C. After vigorous shaking, the solution was filtered through a 70 μm pore cell strainer (Corning), obtaining the crypt fraction. The dissociation, shaking and filtration steps were repeated three times to increase the isolation’s yield. The final solution was centrifuged at 100xg for 5 minutes at room temperature (RT) and the pellet containing crypts was resuspended in 1:1 Matrigel (Corning):ENR and seeded in drops of 50 μL in 24 well plates. After 25 min incubation at 37°C 5%CO2 in a humified atmosphere, the drops were covered with ENR medium. The organoids were split every 3-4 days. For splitting, organoid-containing drops were mechanically disaggregated by pipetting in PBS supplemented with calcium and magnesium (Sigma-Aldrich) and centrifuged at 100xg at RT for 3.5 minutes. The pellet was resuspended in 1:1 Matrigel:ENR and seeded in drops as explained above.
ENR medium was composed of DMEM/F-12 (Gibco) supplemented with 2% Antibiotic/Antimycotic (Gibco), 2.5% Glutamax (Gibco), 20ng/mL mouseEGF (Peprotech), 100ng/mL Noggin (Peprotech), 500ng/mL R-spondin1 (R&D Systems), 10ng/mL mouse FGF (Peprotech), 1X B-27 (Gibco) and 1X N-2 (Gibco).
Polyacrylamide (PAA) gel polymerization
Glass bottom dishes (MatTek) were incubated 10 minutes at RT with Bind-Silane (Sigma-Aldrich) dissolved in ethanol absolute (PanReac) and acetic acid (Sigma-Aldrich) at volume proportions 1:12:1, respectively. After two washes with ethanol absolute, 22.5μL of the polyacrylamide mix (see Supplementary Table 1 for the different recipes used) were added on top of the glass and covered with an 18 mm coverslip. For traction measurements we used FluoSpheres of 0.2μm diameter (Thermo Fisher Scientific). For immunostainings, we used CML Latex Beads of 0.2μm diameter (Thermo Fisher Scientific). After 1h polymerization at RT, PBS was added, and the coverslips were removed with a scalpel.
PAA gel functionalization and ECM micropatterning
Organoid monolayers were confined in large circular ECM micropatterns (>900 μm). For this, PAA gels were functionalized with 2mg/mL of Sulpho-SANPAH (Cultek) irradiated for 7.5 minutes with UV light (365nm). Gels were then washed twice with HEPES 10mM (Gibco). For ECM micropatterning, Polydimethylsiloxane (PDMS) stencils with circular openings were used25. PDMS stencils were incubated with Pluronic acid F127 2% in PBS (Sigma-Aldrich) for 1 hour. Then, they were washed twice with PBS and allowed to dry at RT for 20 minutes. Stencils were carefully placed on top of the functionalized PAA gels. A solution of 250 μg/mL rat tail type I Collagen (First Link UK) and 100 μg/mL Laminin I (Sigma-Aldrich) dissolved in PBS was added on top of the PDMS stencils and incubated overnight at 4°C. Finally, the ECM solution was aspirated, the gels were washed twice with PBS and the PDMS stencils were carefully removed.
Seeding on PAA substrates
3D intestinal organoids were mechanically disaggregated by pipetting in PBS with calcium and magnesium (Sigma-Aldrich). For one PAA gel, we seeded the number of organoids contained in one Matrigel drop of the 24 well plate. After disaggregation, the organoids were centrifuged at 100xg at RT for 3.5 minutes and the pellet was resuspended in ENR medium. The organoids were seeded in a small volume (50μL) on top of the ECM-coated PAA gels and incubated at 37°C 5% CO2. After 1hour incubation, 550 μL of ENR medium was added on top of the previous 50μL. All experiments were performed 2-4 days after seeding.
Immunostainings
The organoid monolayers were fixed in 4% Paraformaldehyde (Electron Microscopy Sciences) for 10 minutes at RT and washed three times with PBS. The samples were permeabilized with 0,1% Triton X-100 (Sigma-Aldrich) for 10 minutes at RT. After three washes with PBS, the samples were blocked with PBS containing 10% FBS (Gibco) for 1 hour at RT. Primary antibodies diluted in PBS containing 10% FBS were added and incubated overnight at 4°C. After three more washes in PBS, secondary antibodies and phalloidin in PBS containing 10% FBS were added for 1h at RT. Finally, the samples were washed 5 times with PBS (5 minutes each) and imaged.
For immunostainings of tissue slices, adult (3-6 months old) R26mT/mG 54 or myosin IIA-GFP56 mice were sacrificed to isolate the small intestine (jejunum). After gently flushing the gut lumen with PBS, the tissue was hand cut with scalpel into 0.5-1cm long fragments and fixed in 4% paraformaldehyde (Electron Microscopy Sciences) for 1h at RT. The tissue was then rinsed with PBS and either hand cut with a scalpel into ~1mm thick slices or embedded into 4% w/v low-melting point agarose (Ultrapure, Thermo Fisher) and transversally sectioned on a vibratome (Leica VT1000), to obtain ~350μm thick gut slices. The slices were permeabilized with 1% Triton X-100 (Sigma-Aldrich) in PBS for 1h at RT. All antibody solutions and wash steps were performed using 0.2% Triton X-100 in PBS on a shaker, with mild rocking. Incubations with primary antibodies were performed overnight at RT and were followed by three washes for 1h each. Secondary antibodies were added with DAPI and with or without phalloidin, all diluted 1:200 in 0.2% Triton X-100/PBS, and incubated overnight at 4°C. After the washes (as described above), the samples were mounted on slides using mounting agent (Aqua-Poly/Mount, Polysciences), and left to cure overnight in darkness at RT.
Antibodies
The primary antibodies used and their respective dilutions were: rabbit anti Olfm4 1:200 (Cell Signaling Technology Cat# 39141), mouse anti CK20 1:50 (Dako Cat# M7019), mouse anti Ki67 1:100 (BD Biosciences Cat# 550609), rabbit anti Lysozyme 1:2000 (Dako Cat# A0099), rabbit anti ZO-1 1:200 (Thermo Fisher Scientific Cat #40-2200) and mouse anti GFP 1:400 (Abcam Cat# ab1218).
The secondary antibodies used were: goat anti mouse Alexa Fluor 488 (Thermo Fisher Scientific Cat# A-11029), donkey anti rabbit Alexa Fluor 488 (Thermo Fisher Scientific Cat# A-21206), goat anti rabbit Alexa Fluor 555 (Thermo Fisher Scientific Cat# A-21429), and goat anti mouse Alexa Fluor 405 (Abcam Cat# ab175660). All secondary antibodies were used at 1:400 dilution. To label F-actin, Phalloidin Atto 488 (Sigma-Aldrich Cat# 49409) was used at 1:500 and Phalloidin Alexa Fluor-647 (Thermo Fisher Scientific, Cat# A22287) was used at 1:400.
For immunostainings of tissue slices, rat anti-E-Cadherin (ECCD-2; Thermo Fisher Scientific Cat# 13-1900) was used at 1:100, DAPI (Sigma-Aldrich Cat# D9542) was used at 5 μg/mL and Rhodamine-phalloidin (Thermo Fisher Scientific Cat# R415) was used at 1:200.
Image acquisition
All images except laser cuts and in vivo immunostainings were acquired in a Nikon TiE inverted microscope with a spinning disk confocal unit (CSU-WD, Yokogawa) and a Zyla sCMOS camera (Andor). For Supplementary Video 4, a 40× objective (Plan Fluor, NA 0.75, Dry) was used. For Figure 6, (panel a, first row of images) a 2×2 stitching grid was acquired with a 20× objective (Plan Apo, NA 075, Ph2, Dry). For the rest of images, a 60× objective (Plan APO, NA 1.2, water immersion) was used. For live imaging experiments, a temperature box maintaining 37°C in the microscope (Life Imaging Services) and a chamber maintaining CO2 and humidity (Life Imaging services) were used. The open source Micromanager57 was used to carry out multidimensional acquisitions with a custom-made script.
To image the monolayers on 0.7kPa gels (Figs. 3,4), they were mounted upside down to improve image quality. Briefly, the samples were fixed in PFA 4% 10 minutes at RT. They were mounted in PBS and sealed with nail polish before being flipped and imaged from the apical side.
For laser ablation, images were acquired in a laser-scanning confocal microscope (LSM880, Carl Zeiss) at a resolution of 512×512 pixels (pixel size = 0.2595 μm) with a bidirectional scan. A Plan-Apochromat 40x objective (Plan Apochromat, NA 1.3, Oil, DIC M27) was used. The microscope was equipped with temperature control (37°) and CO2 and humidity control. Zeiss ZEN software was used to carry out the acquisitions.
For immunostainings of tissue slices, images were acquired in a laser-scanning confocal microscope (LSM880, Carl Zeiss) at a resolution of 1024×1024 pixels (pixel size = 0.2076 μm) with a bidirectional scan, using Plan-Apochromat 40x objective (Plan Apochromat, NA 1.3, Oil, DIC M27) in Airyscan mode. Imaging and Airyscan processing were performed using Zeiss ZEN software.
Three-dimensional traction microscopy
3D tractions were computed as previously described18. Briefly, confocal stacks of the top layer of the fluorescent beads embedded in the polyacrylamide gels were imaged with a z-step of 0.2μm both in the deformed (by the cells) and relaxed (trypsinized) states. From the stacks, the 3D deformations of the gel were computed with a home-made iterative 3D Particle Image Velocimetry (PIV) software18. A window size of 64x64 pixels and an overlap of 0.75 was used. A Finite Element Method solution was implemented in ABAQUS to compute 3D tractions from the 3D substrate displacements18.
Cell Velocities
To characterize cell kinematics in Fig. 8, velocity of the monolayer was computed by performing 3D PIV analysis on consecutive time-lapse images of organoid monolayers expressing membrane-targeted tdTomato (custom made software, window size 64×64 pixels, overlap of 0.75).
Radial averaging and kymographs
The boundary between the stem cell compartment and the transit amplifying zone was drawn by connecting the points where the normal traction component changed sign from negative to positive. If tractions were not available (as in immunostainings) the boundary was defined by the change in cell morphology (from columnar to elongated). For averaging (traction, velocity or image intensity), every pixel in the image was assigned the value of the distance to the closest point of the contour of the stem cell compartment. Spatiotemporal diagrams (kymographs) of a given variable were obtained by binning the values of that variable as a function of the (signed) distance from the boundary of the stem cell compartment and then computing the mean within each bin. For vectors, the normal to the contour was determined by fitting a parametric parabola to the 9 pixels surrounding each pixel of the contour. To attribute a normal vector to each pixel of the image we followed the approach of Trepat et al45. Briefly, we first assigned to each pixel of the image the normal vector of the closest pixel of the contour of the stem cell compartment. We then smoothed curvature and normal vector components using a moving average filter whose characteristic length increased with the distance from the contour. To build spatiotemporal kymographs, the process of masking and radial averaging was repeated for every single timepoint. Additional crypts in the field of view were excluded from the analysis.
In Fig. 4c, the normal traction of the stem cell compartment was computed as the mean of the normal traction at the crypt center. The normal traction of the transit amplifying zone was computed as the peak in positive normal traction within the first 20 microns outside the stem cell compartment.
Averaging of crypt radial profiles
Crypts are variable in size within a certain range. As a consequence, directly averaging profiles of tractions, velocity or any other parameter of the study generates artifacts arising from the misalignment of compartments between different crypts. To avoid this, individual crypt profiles were linearly resized to the average crypt radius of the experimental group. Resized profiles were then averaged.
Blebbistatin treatment
Organoid monolayers on 5kPa gels (Fig. 4a-c) were imaged for 1 hour 30 minutes in normal ENR medium (baseline). Then, ENR medium containing Blebbistatin (-/-) (Sigma-Aldrich) was added to a final concentration of 15μM and the monolayers were imaged for 3 hours. The medium was then aspirated, the sample was washed with ENR, and the monolayers were imaged for additional 11h in normal ENR.
For blebbistatin dosage experiments (Extended Data Fig. 3a-c), organoid monolayers on 5kPa gels were treated with DMSO or 0.5μM, 1.5μM, 5μM or 15μM of blebbistatin in ENR medium. 3 hours after the treatment, the monolayers were imaged.
Monolayers on 0.7kPa gels (Fig. 4d, e, Fig. 5b) or 15kPa gels (Extended Data Fig. 5) were treated with 15μM of Blebbistatin or DMSO (Sigma-Aldrich) in ENR medium for 3h. They were then fixed in 4% PFA for 10 minutes at room temperature. Finally, they were washed twice with PBS and imaged as indicated before. The monolayers of Extended Data Fig. 5 were imaged without fixation. Crypt indentation (Fig. 4d) was quantified in Fiji by tracing a vertical line from the bottom of the crypt to the bottom of the TA cells in a lateral view of the monolayer.
F-Actin and myosin quantification
Given the height heterogeneity between compartments in the organoid monolayer, we developed the following algorithm to define the cell apical, medial and basal coordinates for every XY position of the substrate. For F-actin stainings (phalloidin), each plane of the imaged Z-stack was first binned (8×8 pixels). Then, for each XY position of the binned image along the substrate, the apical and basal coordinates were defined as the coordinates of the apical-most and basal-most peaks in fluorescence intensity (phallodin). The medial position was defined as the Z coordinate equidistant to the apical and basal coordinate for each XY pixel. We then extracted the fluorescence intensity of the apical, medial and basal positions. A similar approach was used to quantify myosin IIA, but using the Volume Manager plugin (by Robert Haase, MPI-CBG) to segment the monolayer. This last approach was also used for F-actin quantification on 0.7kPa PAA gels (Extended Data Fig. 3e), as the high indentation of the crypts on these soft substrates prevented accurate automatic segmentation of the apical and basal surfaces.
To quantify crypt and villus myosin intensity in tissue immunostainings, small rectangular regions of interest (ROIs) of ~10 pixels width were manually drawn around apical and basal surfaces on the F-actin channel. Myosin IIA intensity was then averaged in the longitudinal axis of each ROI to quantify the intensity of the peak. Two ROIs were quantified and averaged per position. To correct for changes in absolute intensity at different tissue depths, values for each crypt-villus image were normalized by dividing all values by the apical intensity of the crypt bottom. Measures were performed only in crypt-villus regions that fitted in ~3 image planes (1 μm step) to avoid differences in intensity due to light penetration through the tissue.
Quantification of cell tilt in vivo
To quantify cell tilt in vivo, cells were manually segmented in crypt images labelled by m-tdTomato or E-cadherin. An ellipse was fitted to each cell contour and cell orientation was defined as the angle of the ellipse long axis. The contour of the crypt was manually segmented and the normal direction to each pixel of the contour was calculated by fitting a parametric parabola to contour arcs of 9 pixels as described above. Cell tilt was defined as the angle difference between the normal to crypt contour and the cell orientation. Tilt towards the crypt bottom was defined as positive. Tilt profiles obtained from each side of the crypt were averaged to generate one tilt profile per crypt. All crypt profiles were then rescaled to the average crypt contour length (in μm) and averaged.
De novo crypt formation
Organoids were cultured in ENR containing 10μM of CHIR99021 (SelleckChem) and 10mM of Nicotinamide (Sigma-Aldrich). After 2 days, organoids formed hyperproliferative spherical cysts devoid of crypts. For each PAA gel, we seeded the number of cysts contained in three Matrigel drops of a 24 well plate. Cysts were dissociated in TryplE (Gibco) at 37°C for 5 minutes. Dissociation was mechanically assisted by pipetting and finally stopped by dilution in PBS supplemented with calcium and magnesium (Sigma-Aldrich). The cell suspension was then filtered through a 40μm diameter cell strainer, to remove clumps of undissociated cells, and centrifuged at 500xg at RT for 5 minutes. The pellet was resuspended in ENR containing 10μM of CHIR99021, 10mM of Nicotinamide and 10μM of Y-27632 (Merck Millipore) (ENR-CYN). Cells were seeded in a small volume (30μL) on top of the micropatterned area of 5kPa PAA gels. Functionalization and ECM micropatterning of the PAA gels was performed as described above, using micropatterns of 600-900 μm in diameter. After 2 hours incubation at 37°C 5% CO2, unattached cells were washed out with 200μL of ENR-CYN and 600μL of ENR-CYN was added. The next day, the medium was changed to ENR. ENR medium was refreshed on the third day after seeding.
Monolayers were fixed in 4%PFA at different timepoints (1 day, 2 days, 3 days and 4 days after seeding) and immunostained for Olfm4, CK20, and F-actin (phalloidin) as described above. Z-stacks of the whole circular patterns were acquired with a 20× objective by stitching 4 fields of view in a 2×2 grid, with a 20% overlap. For each field of view, a maximum intensity projection of each channel was generated. Maximum intensity projections were then fused in Fiji with the plugin “Grid/collection stitching”. Monolayers and Olfm4 positive foci were manually segmented, and their area and intensity were measured. Olfm4 positive foci density was calculated as the ratio between the number of foci and the monolayer area. CK20 intensity was measured in the segmented monolayer after excluding the Olfm4 positive foci. Background for each channel was estimated at regions outside of the monolayer and subtracted. All analyses were performed in Fiji.
Apical and basal F-actin intensity were automatically extracted from z-stacks acquired with a 60× objective, following the same approach explained above. Apical and basal F-actin intensity were then averaged over a circular ROI of ~16μm in radius located at the center of the Olfm4 positive area or at a random position at the Olfm4 negative area.
For traction measurements, stacks of the cells and the beads were acquired at the 4 timepoints indicated. 3D tractions were measured as explained above. Tractions normal to the substrate were averaged over a circular region of ~16 μm in radius located at the center of the developing crypts.
Quantification of the area of the stem cell niche, number of stem cells and Paneth cells
Organoid monolayers seeded on PAA gels of varying stiffnesses were fixed and stained for F-actin (phalloidin) and Olfm4 as explained above.
The Olfm4 positive area was manually segmented. Cells in the Olfm4 positive area were manually counted in Fiji with the multipoint selection tool. Paneth cells were identified by their granular apical signal in brightfield and distinct apical actin signal. The number of stem cells was calculated by subtracting the number of Paneth cells to the total number of cells in the Olfm4 positive area.
Laser cuts
Laser ablation was performed using a Ti:Sapphire laser (Mai Tai DeepSee, Spectra Physics) set at 800 nm and laser power of 15% (500-750 mW). Circular regions for ablation were selected manually at the boundary between crypt compartments based on basal cell morphology. The cuts were performed in the medial plane of the monolayer.
To compute recoil velocities, PIV was performed using a window size of 16×16 pixels and an overlap of 0.75. Velocity fields were resized to the original image size (512×512) using a bicubic interpolation to compute velocities relative to the ablated region. A peak in tissue velocity occurred within the first 2 seconds after ablation and thus recoil velocity was computed in this timeframe.
The contour of the ablated region was used to compute radial and tangential components of the recoil velocity as explained above. Radial velocities were averaged according to their distances to the ablated region. Crypt indentation before and after ablation was computed from the deformation of fluorescent beads embedded in the substrate as explained in the traction force microscopy section.
Single cell shape analysis
Image pre-processing
Spinning disc images of intestinal organoid monolayers were pre-processed to address low signal-to-noise ratio and image scattering at apical and basal cell surfaces, presumably due to rich apical excretion, brush microvillar border, and scattering in the hydrogel underlying the organoid monolayers. To enable automatic detection of all single cell surfaces, signal intensity values in dim regions of apical and basal surfaces were computationally increased. Using Fiji58, monolayer apical and basal surface was defined in 3D, following the contour of the monolayer by manually adding sparse points in the xz-view and interpolating the surface between them, using the Volume Manager plugin (by Robert Haase, MPI-CBG). Using a custom Matlab script, image pixels lying on the capping surface and having fluorescence signal intensity higher than 1st and lower than 3rd quartile of overall image intensity were set to the 3rd quartile value (4th quartile in case of extremely bright lateral cell surfaces), resulting in segmentable apical and basal membrane signal in cells that displayed only clear lateral surfaces in original images.
Cell segmentation
Pre-processed cell membrane images were used for automatic cell segmentation in MorphographX59. Images were processed with Gaussian blurring (sigma 0.3-0.5) and stack normalization (radius 4-10, blur factor 0.5-0.8). Segmentation was performed in whole image stacks in 3D using the Insight Toolkit watershed algorithm implemented in MorphographX (threshold 800-1500). All segmentations required extensive manual correction for oversegmented, undersegmented and incomplete cells. 3D cell meshes were created (cube size 2, smoothing 1) from pixel label images for further shape analysis.
Shape analysis
Single cell shape analysis was performed in 3D using custom-developed Matlab tools. To account for the complex shape of cells in the organoid monolayers, an apicobasal cell axis was constructed for each cell from centroids of horizontal cell cross-sections in the central 70% of the cell body. The remaining 15% of the axis on each end was extrapolated as a straight line from the more stable central 70%. This 3D axis was used to calculate 3D cell height and obtain new cross-sections normal to the cell axis. These cross-sections were analyzed for their area and various shape parameters, resulting in detailed apicobasal shape profiles for all cells. Cell tilt to crypt center was defined as the angle of the straight, end-to-end cell axis to the substrate normal (component in line with crypt center), and set to be <0 if the axis was pointing away from the crypt center. Transit amplifying cells were defined as cells whose basal centroid lies within 14 μm of the manually outlined stem cell niche border. Paneth cells were identified based on their distinct (granular) apical appearance in corresponding bright field images. All cells within the niche which were not Paneth cells were considered to be stem cells, in line with the Lgr5 and Olfm4 immunostaining results.
Quantification of cell division rate
Maps of the spatial distribution divisions were manually obtained using Fiji multipoint selections. The coordinates of each cell division were imported to Matlab. The mask of the stem cell compartment was used to compute the radial distance to the crypt center of each pixel of the field of view as explained above. The radius of the stem cell compartment was divided in three equal regions and the rest of the monolayer was divided in circular regions of 8,1 μm (75 pixels). For each region, we divided the total number of divisions by the area of the region and the time of observation to calculate the cell division rate.
Statistics and reproducibility
Traction maps, kymographs and laser cuts were plotted in Matlab. The rest of the plots were generated in Graphpad Prism 8. Immunostainings and videos were processed with the open source software Fiji and HandBrake. The data is represented as mean ± error (SEM or SD as indicated in the figure captions). Normality of the data was checked and the statistical test used to compare means was chosen accordingly, as indicated in the figure captions. No statistical method was used to predetermine sample size, a minimum of n=2 experiments with multiple measurements per experiment were performed. No data were excluded from the analyses. The experiments were not randomized and the investigators were not blinded to allocation during experiments or outcome assessment. When possible (cell traction and velocity, laser ablations and segmentation among others) experiments were automatically analysed using home-made software to avoid biases. All the statistical analyses were performed in Graphpad Prism 8.
Extended Data
Extended Data Fig. 1. Organoid monolayers capture key physiological features of the intestinal epithelium.
a, Organoid monolayers expressing Lgr5-eGFP-IRES-CreERT2 stained for GFP and F-actin (phalloidin). Representative image of 2 experiments. b, Organoid monolayers stained for Zonula occludens 1 (ZO-1). Top: Average intensity projections of the 10 most basal (Top left) or apical (Top right) planes of the monolayer. Bottom: lateral view of the monolayer. Representative image of 2 experiments. c, Snapshots of an extrusion event happening at the villus-like region. The extruding cell is indicated with the arrowhead in the orthogonal views (bottom row). The neighbors of the extruding cell are highlighted in colors in the top views of the monolayer (middle row). The lateral views correspond to the midplane indicated with a white dashed line at their corresponding top views (Top row). Representative of 9 extrusions from 3 experiments. d, Snapshots of a cell that exhibits retrograde flow due to division. The contour of the cell of interest is delineated in red. The track of this cell is delineated in yellow. The contour of the second daughter cell that appears after the division event is delineated in green. The first and last snapshots (0min and 160min) correspond to basal planes of the crypt (Z=0 μm and 2 μm, respectively). Because division occurs apically, the second and third snapshots (48min and 52 min), correspond to an apical plane where division is better observed (Z=12 μm). 5 crypts from 3 experiments. e, Spontaneous formation of pressurized domes in the villus-like domain. Top left: medial view of an organoid monolayer expressing Lifeact-eGFP. The dashed orange line defines the regions where the monolayer has delaminated to form a pressurized dome (orange arrowheads in bottom panel). Top right: 3D traction map of the same crypt. Yellow vectors represent components tangential to the substrate and the color map represents the component normal to the substrate. Horizontal cyan line indicates y-axis position of the lateral XZ view (bottom). Bottom: lateral view of the organoid monolayers. Yellow vectors represent tractions. Representative of 3 experiments. Scale vector, 300Pa. All scale bars, 20 μm. Stiffness of all the gels, 5kPa.
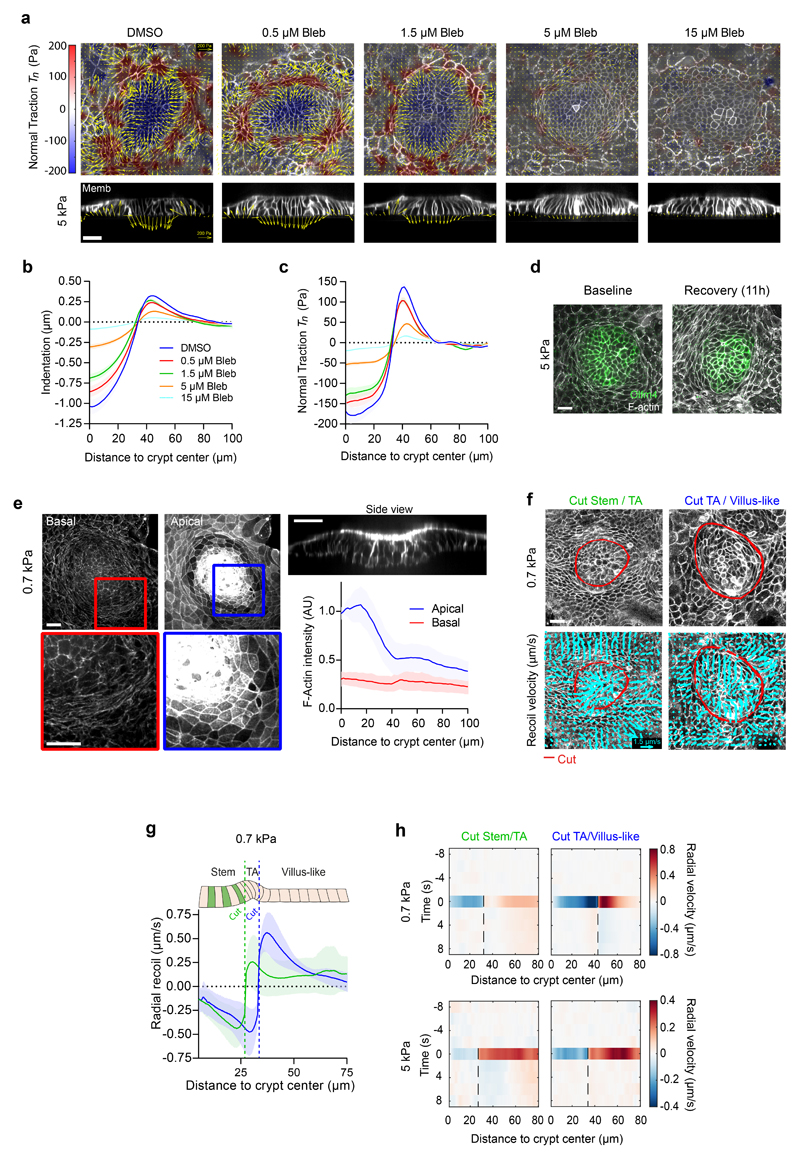
Extended Data Fig. 2. Crypts fold through actomyosin driven apical constriction.
a, Top row: 3D tractions of the crypts treated with the indicated concentration of blebbistatin (Bleb). Yellow vectors represent components tangential to the substrate and the color map represents the component normal to the substrate. Bottom row: lateral views of the organoids along the crypt midline. Representative images from 3 independent experiments. Yellow vectors represent tractions. Scale bar, 20 μm. Scale vector, 200Pa. b-c, Crypt indentation (b), and normal traction (c) as a function of the distance to the crypt center for crypts treated with the indicated concentrations of blebbistatin for 3 hours. Data are represented as mean ± SEM of n=18 (DMSO), 24 (0.5 μM), 19 (1.5 μM) 22 (5 μM) and 20 (15 μM) crypts from 3 independent experiments. d, Olfm4 immunostaining in membrane-tdTomato organoids at baseline conditions and 11 hours after blebbistatin removal. Representative images from 2 independent experiments. Scale bar, 20 μm. e, Radial distribution of the apical (blue) and basal (red) F-actin intensity as a function of the distance to the crypt center on 0.7 kPa substrates. Scale bars, 20 μm. Data are presented as mean ± SD of n=12 crypts from 3 independent experiments. f, Bottom: Recoil velocity maps immediately after ablation of two crypts along the red lines on 0.7 kPa substrates. Left: a cut inside the TA. Right: a cut outside the TA. Scale vector, 1.5 μm/s. Top: the two crypts before ablation. Representative images from 3 independent experiments. Scale bar, 20 μm. g, Radial recoil velocity as a function of distance to crypt center for cuts between stem cell compartment and transit amplifying zone (green) and between transit amplifying zone and villus-like domain (blue) on 0.7 kPa substrates. Data are represented as mean ± SD of n= 14 (cut Stem / TA) and 10 (cut TA / Villus-like) crypts from 3 independent experiments. h, Representative kymographs of circumferentially averaged radial velocity as a function of the distance to the crypt center on 0.7 kPa (Top) and 5 kPa (bottom) substrates. Left: cut inside TA; right: Cut outside TA. The dashed black line indicates the time and position of the cut. Negative velocities point towards crypt center.
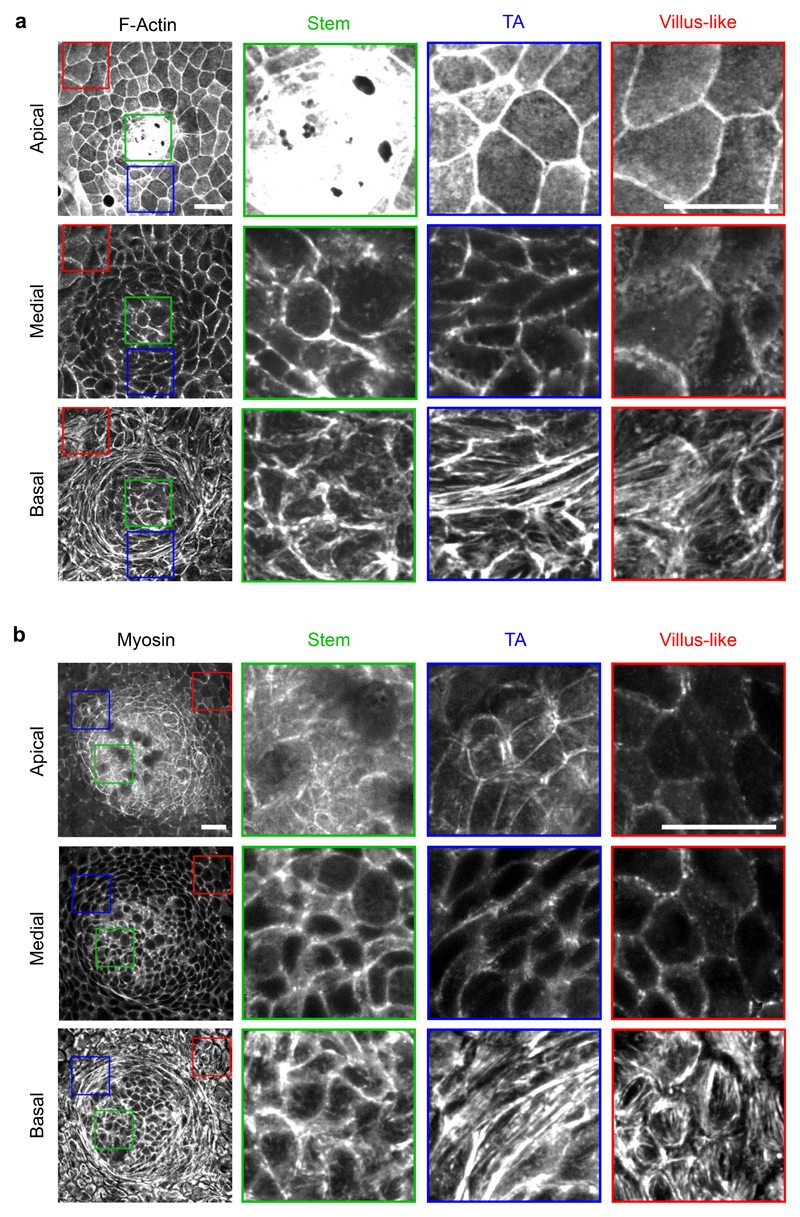
Extended Data Fig. 3. Apicobasal distribution of F-actin and Myosin in organoid monolayers.
a-b, Apical, medial and basal projections of F-Actin (Phalloidin, a) and myosin IIA-eGFP (b). The stem cell compartment (Stem), the Transit amplifying zone (TA) and the villus-like domain (villus-like) are zoomed in the regions of the monolayer indicated with the respective colors. Representative images from 4 (a) and 2 (b) independent experiments. Scale bars, 20 μm. Stiffness of the gel, 5kPa.
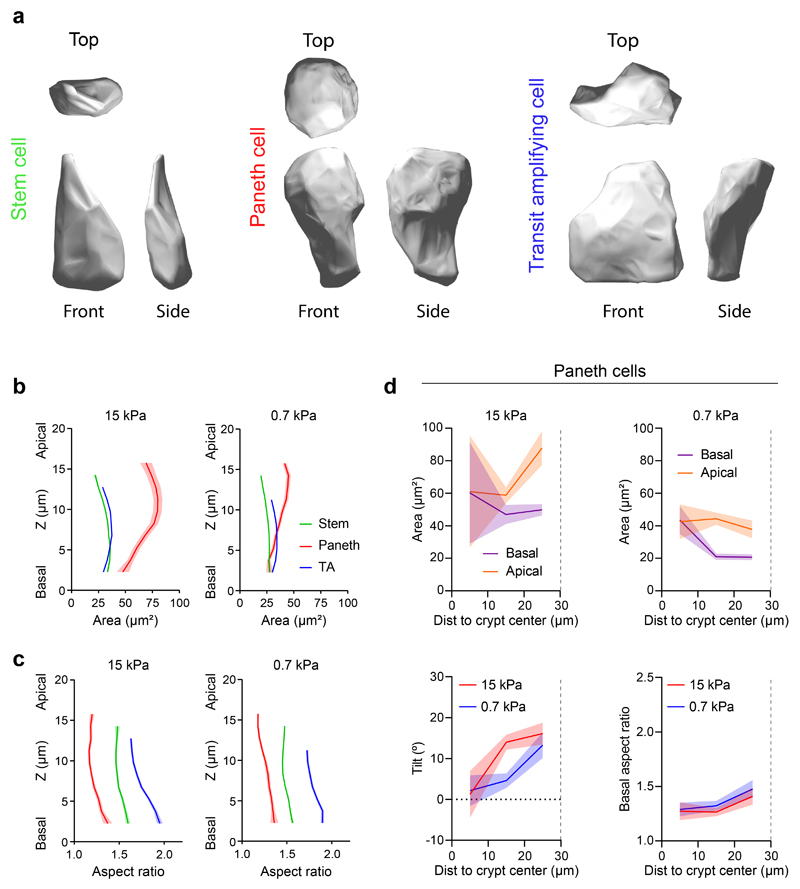
Extended Data Fig. 4. Morphometric analysis of the different cell types in the crypt.
a, Top, front and side 3D renders of a segmented stem cell (left), Paneth cell (center) and transit amplifying cell (right). b-c, Cell area (b) and aspect ratio (c) along the apicobasal axis of stem (green), Paneth (red) and TA (blue) cells on rigid (left, 15 kPa) and soft (right, 0.7 kPa) gels. n = 190 (stem cells), n = 21 (Paneth cells); n = 218 (transit amplifying cells) for 15 kPa gels. n = 596 (stem cells); n = 52 (Paneth cells); n = 301 (transit amplifying cells) for 0.7kPa gels. n = 3 crypts per stiffness from 2 (0.7kPa) and 3 (15kPa) independent experiments. Data are represented as mean ± SEM. d, Top: Apical and basal area of Paneth cells as a function of the distance to the crypt center on stiff (left, 15 kPa) and soft (right, 0.7 kPa) substrates. The boundary between the stem cell compartment and the transit amplifying zone is indicated in all the plots with a dashed vertical line. Bottom: Apicobasal tilt (left) and basal aspect ratio (right) of Paneth cells as a function of the distance to the crypt center on stiff (red, 15 kPa) and soft (blue, 0.7 kPa) substrates. n = 3 crypts per stiffness from 2 (0.7kPa) and 3 (15kPa) independent experiments. From center to edge bins, n = 3, 7 and 10 cells for 15 kPa gels and n = 11, 25 and 15 cells for 0.7 kPa gels. Data are represented as mean ± SEM.
Extended Data Fig. 5. Effect of myosin inhibition in organoid cell shape.
a-b, 3D segmentation of a crypt on 15 kPa gels under baseline conditions (a) and the same crypt after 3h treatment with 15μM of blebbistatin (b). Top: medial view. Bottom: lateral view. Representative images of 2 independent experiments. Scale bar, 20 μm. c-d, Apicobasal tilt (c) and basal aspect ratio (d) as a function of the distance to crypt center on rigid substrates (15 kPa) before and after blebbistatin. Vertical dashed line indicates the boundary between the stem cell compartment and the transit amplifying zone. From center to edge bins, n = 42, 72, 150 and 232 cells for baseline crypt and 39, 82, 131 and 209 for blebbistatin treatment. Data from 2 independent experiments.
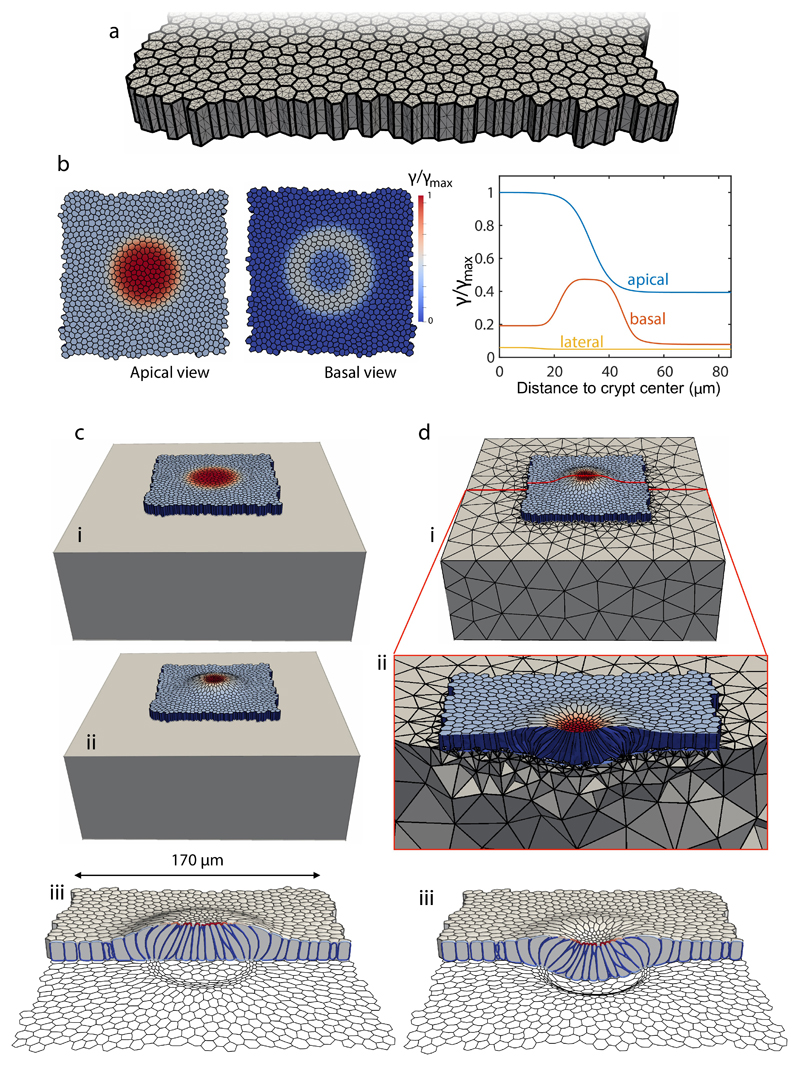
Extended Data Fig. 6. 3D computational vertex model and simulation protocol.
a, Discretization of the tissue: the thick lines denote the intersection between cellular faces and the thin lines the triangulation of the cell surfaces. b, Pattern of apical, basal and lateral surface tensions prescribed in the initial regular cell monolayer. c, Equilibration of the initial regular monolayer with patterned surface tensions on a rigid substrate, where basal nodes are constrained to a plane but can slide horizontally. Initial state (i), equilibrated state (ii), and different view of equilibrated state with basal cell outline (iii). d, Coupling with a deformable substrate, modeled computationally with a tetrahedral mesh discretizing a hyperelastic block (i). The equilibrated crypt on a rigid substrate (c-ii) is further equilibrated on the deformable substrate (d-ii,iii).
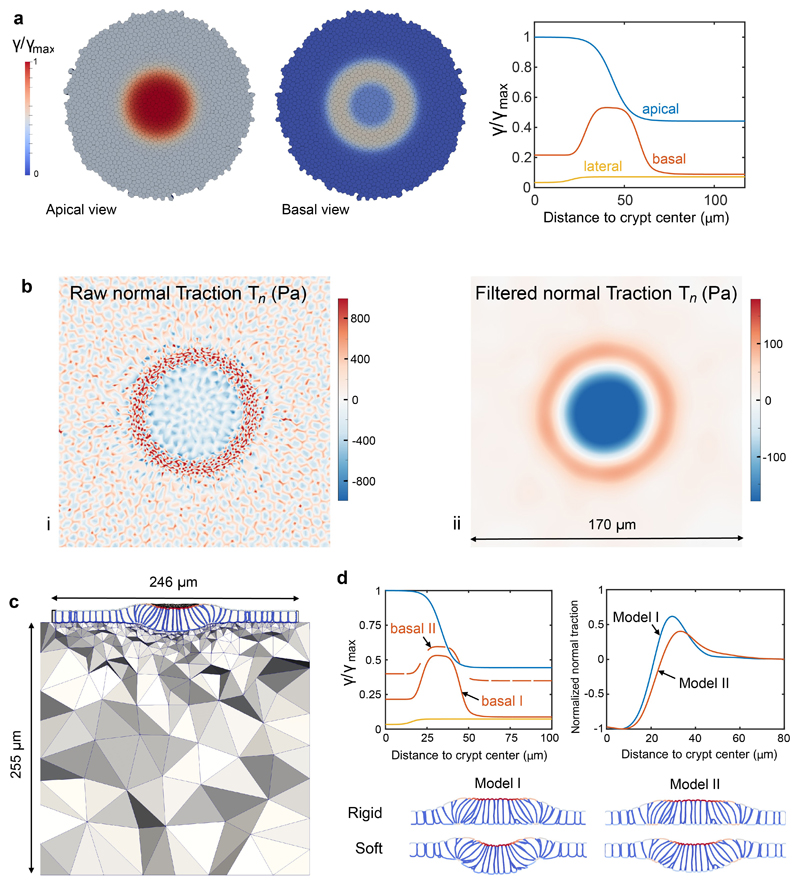
Extended Data Fig. 7. Simulation of crypt normal tractions.
a, Pattern of apical, basal and lateral surface tensions prescribed in the initial regular cell monolayer. b, Maps of basal normal traction. (i) Raw normal tractions at the basal plane featuring sub-cellular fine-scale details. To compare with experimental averages, we filtered these tractions with a Gaussian filter with standard deviation of 6 μm, (ii). c, Computational model of the deformed crypt on a soft hyperelastic substrate. d, Crypt folding for two models with different basal tension profiles on soft and rigid substrates.
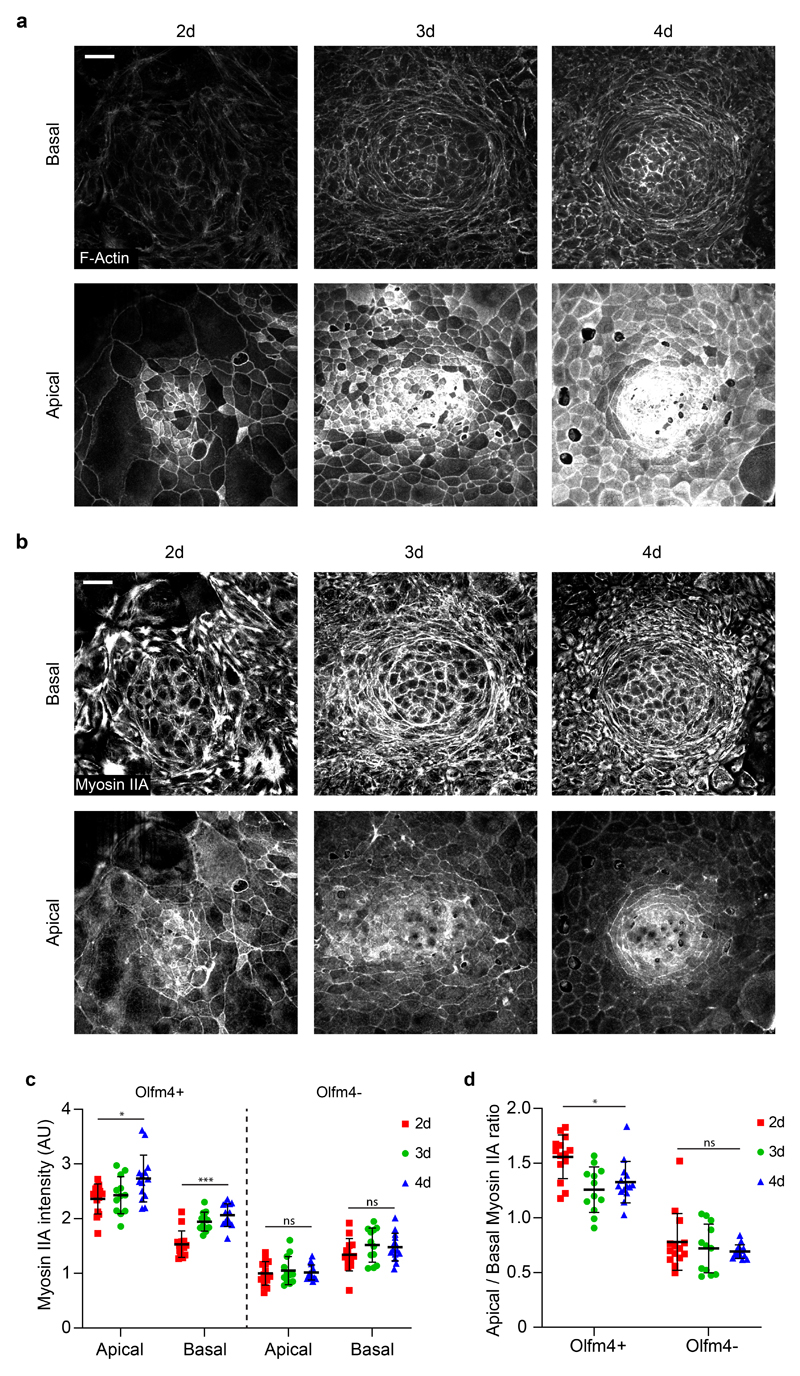
Extended Data Fig. 8. F-Actin and myosin IIA co-evolution during de novo crypt formation.
a-b, Apical and basal projections of F-Actin (Phalloidin, a) and myosin IIA-eGFP (b) of crypts at the indicated timepoints (2 days, 3 days, 4 days). The crypts are the same as in Fig. 6a. Representative images of 2 independent experiments c-d, Quantification of apical and basal myosin IIA intensity (c) and apical/basal myosin IIA ratio (d) at the Olfm4 positive and Olfm4 negative regions for the indicated timepoints. n= 14 (2d), 12 (3d) and 14 (4d) crypts from 2 independent experiments. For all the graphs, data is represented as Mean ± SD. All Scale bars, 20 μm. Stiffness of the gel, 5kPa. * (p<0.05) ***(p<0.001). Statistical significance was defined by a Kruskal-Wallis followed by a Dunn’s multiple comparison test (c: basal Olfm4+ and d) and one-way ANOVA followed by a Tukey multiple comparison test (c: apical Olfm4+, apical Olfm4- and basal Olfm4-). Only the statistical comparison between 2d and 4d is shown.
Supplementary Material
Spreading of intestinal crypts on 5kPa polyacrylamide gels coated with collagen I and laminin 1. Over the course of three days, a 2D monolayer with crypt-like and villus-like domains is established. Membrane is labelled with tdTomato. Total duration: 45 hours.
Time-lapse of a basal (left) and apical (right) plane of the organoid monolayer. Multiple cell divisions can be observed at the crypt (center). Cells migrate collectively out of the crypt. Membrane is labelled with tdTomato. Total duration: 6 hours 32 minutes.
One cell (yellow) starts at the stem cell compartment and enters to the transit amplifying zone, acquiring an elongated shape. Another cell (light blue) at the transit amplifying zone divides and enters in the villus-like domain. Some cells (dark blues, light blue and green) enter the villus-like domain and accelerate, separating from their followers. Membrane is labelled with tdTomato. Total duration: 6 hours 32 minutes.
Time-lapse of a medial (left) and apical (right) plane of an organoid monolayer. A crypt in the center exhibits multiple cell divisions and radial migration into the villus-like domain. Multiple epithelial domes appear at times 1.20 - 2h (top right) and 8.40 h (left). Cells are constantly extruded in the villus-like domain. Membrane is labelled with tdTomato. Total duration: 14 hours.
Time-lapse of a top view (top) and a lateral view (bottom) of the extrusion of a cell in the villus-like region. At t=32 min, the cell begins to be extruded from the monolayer. At t=80 min, the cell is completely expelled. Total duration: 96 minutes.
Time-lapse of a stem cell that moves towards the crypt center upon division. Left: crypt basal plane (Z=2μm). Red area indicates the segmentation of the cell of interest. The yellow line indicates the track of the cell. Note that the cell divides in the apical plane and thus is not always visible in this basal plane. Right: time-lapse of the crypt following the Z plane where the cell is better visualized. At t=200 min, the video pauses transiently and the focus is progressively changed to the apical-most plane of the monolayer to follow cell rounding. After division, the cell reintegrates close to the center of the crypt and is again visible in the basal plane. Membrane is labelled with tdTomato. Total duration: 400 minutes.
Organoid monolayer treated with blebbistatin (t=1h 30 min) and allowed to recover after washing out the drug (t=5h). Addition of blebbistatin triggers a rapid reduction of crypt forces. After washout, the crypt recovers its characteristic traction pattern. At t=10h, an epithelial dome is formed. Membrane is labelled with tdTomato. Total duration: 15 hours. Top: 3D traction map of the crypt. Yellow vectors represent components tangential to the substrate and the color map represents the component normal to the substrate. Bottom: lateral view of the organoid monolayer. Yellow vectors represent tractions.
Membrane labelling (left) and velocity field (right) of organoid monolayers before and after ablation. Red line indicates the ablated region. The ablation (t=10s) induces a radial recoil of the monolayer. Membrane is labelled with tdTomato. Total duration: 20s.
Membrane labelling (left) and velocity field (right) of organoid monolayers before and after ablation (red line). Ablation (t=10s) induces a radial recoil of the monolayer. Membrane is labelled with tdTomato. Total duration: 20s.
Example of a segmented crypt seeded on a 0.7 kPa substrate. At the beginning of the video, all the segmented cells are visible in the 3D rendering. For visualization purposes, a stem cell (green), a Paneth cell (red) and a transit amplifying cell (blue) are highlighted. Note the different morphologies of each cell type. The stem cell is apically constricted. The Paneth cell has a larger volume and exhibits an apical expansion probably reflecting its mucus compartment, and the transit amplifying cell is basally elongated and curved.
Example of five 3D rendered segmented stem cells (top), Paneth cells (center) and transit amplifying cells (bottom). Note that, even if each cell type exhibits characteristic morphometric properties, there is a remarkable shape variability.
Cell velocities (left) and 3D tractions (right) of an organoid monolayer. Cell velocity fluctuates in time and space, but shows a general pattern of radial movement away from the crypt. Traction forces are roughly constant in time. Yellow vectors represent components tangential to the substrate and the color map represents the component normal to the substrate. Membrane is labelled with tdTomato. Total duration: 6 hours 08 minutes.
Cell velocities (left) and 3D tractions (right) of an organoid monolayer. Cell velocity fluctuates in time and space, but shows a general pattern of radial movement away from the crypt. Traction forces are roughly constant in time. Yellow vectors represent components tangential to the substrate and the color map represents the component normal to the substrate. Membrane is labelled with tdTomato. Due to pronounced crypt folding, for visualization purposes, images are projections along the crypt medial plane. Total duration: 6 hours 24 minutes.
Membrane labelling (left) and velocity field (right) of an organoid monolayer before and after ablation (red line). Radial ablation of the monolayer at t=10s induces tissue recoil mainly in the direction parallel to the cut. Parallel velocity changes sign at the boundary between the crypt and the villus-like domain. Membrane is labelled with tdTomato. Red line indicates ablated area. Dashed yellow line indicates crypt contour. Total time: 20s.
Membrane labelling (left) and velocity field (right) of an organoid monolayer before and after ablation (red line). Radial ablation of the monolayer at t=10s induces tissue recoil in the direction both perpendicular and parallel to the cut. Parallel velocity changes sign at the boundary between the crypt and the villus-like domain. Membrane is labelled with tdTomato. Red line indicates ablated area. Dashed yellow line indicates crypt contour. Total time: 20s.
Acknowledgements
We thank J. Barbazán for assistance with laser ablations and discussions; E. Latorre for support with image segmentation and traction software; F. e. Marjou, M. A. Ziane, C. Cortina and X. Hernando for their support and training on organoid culture and in vivo procedures; and A. Marín, N. R. Chahare, T. Golde, J. Abenza, A. Ouzeri and all of the members of the Roca-Cusachs, Vignjevic, Arroyo and Trepat laboratories for their discussions and support. Funding: the authors are funded by the Spanish Ministry for Science, Innovation and Universities MICCINN/FEDER (grant nos PGC2018-099645-B-I00 to X.T. and PID2019-110949GB-I00 to M.A.), the Generalitat de Catalunya (Agaur; grant nos SGR-2017-01602 to X.T., 2017-SGR-1278 to M.A. and 2017-SGR-698 to E.B.; the CERCA Programme and ‘ICREA Academia’ award to M.A. and P.R.-C.), the European Research Council (grant nos Adv-883739 to X.T., CoG-681434 to M.A. and CoG-772487 to D.M.V.), the European Union’s Horizon 2020 research and innovation programme grant agreement no. H2020-FETPROACT-01-2016-731957 and the Marie Skłodowska–Curie grant agreement nos 797621 to M.G.-G. and 792028 to F.G., ‘La Caixa’ Foundation (grant no. LCF/PR/HR20/52400004 to X.T. and P.R.-C., ID 100010434; fellowships LCF/BQ/DR19/11740013 to G.C., LCF/BQ/DE14/10320008 to C.P.-G. and 01/16/FLC to A.A.-V.), the Spanish Ministry of Health (grant no. SAF2017-86782-R to E.B.), Fundació la Marató de TV3 (project 201903-30-31-32 to X.T. and E.B.). IBEC, IRB and CIMNE are recipients of a Severo Ochoa Award of Excellence from the MINECO.
Footnotes
Author contributions
C.P-G. and G.C. performed all experiments except for immuno-stainings, which were also performed by N.C., A.M, and V.R.G. C.P-G., G.C., M.M. and M.G-G. developed analysis software and analyzed data. M.M. performed image segmentation. D.K. and A.G.C contributed in vivo myosin data. F.G., S.K. and M.A implemented the computational model. A.A-V., P.R-C, E.B. contributed technical expertise, materials, and discussion. C.P-G, D.M.V., M.A., and X.T. conceived the project. D.M.V., M.A., and X.T. supervised the project. C.P-G, G.C., M.A., and X.T. wrote the manuscript.
Competing interests: the authors declare no competing financial interests
Code availability
MATLAB analysis procedures and the code implementing the 3D vertex model calculations are available from the corresponding authors on reasonable request.
Data availability
The data that support the findings of this study are available from the corresponding authors on reasonable request.
References
- 1.Chacón-Martínez CA, Koester J, Wickström SA. Signaling in the stem cell niche: regulating cell fate, function and plasticity. Development. 2018;145:dev165399. doi: 10.1242/dev.165399. [DOI] [PubMed] [Google Scholar]
- 2.Barker N, et al. Identification of stem cells in small intestine and colon by marker gene Lgr5. Nature. 2007;449:1003–1007. doi: 10.1038/nature06196. [DOI] [PubMed] [Google Scholar]
- 3.Ritsma L, et al. Intestinal crypt homeostasis revealed at single-stem-cell level by in vivo live imaging. Nature. 2014;507:362–365. doi: 10.1038/nature12972. [DOI] [PMC free article] [PubMed] [Google Scholar]
- 4.Snippert HJ, et al. Intestinal crypt homeostasis results from neutral competition between symmetrically dividing Lgr5 stem cells. Cell. 2010;143:134–144. doi: 10.1016/j.cell.2010.09.016. [DOI] [PubMed] [Google Scholar]
- 5.Shyer AE, et al. Villification: How the gut gets its villi. Science. 2013;342:212–218. doi: 10.1126/science.1238842. [DOI] [PMC free article] [PubMed] [Google Scholar]
- 6.Hughes AJ, et al. Engineered Tissue Folding by Mechanical Compaction of the Mesenchyme. Dev Cell. 2018;44:165–178.:e6. doi: 10.1016/j.devcel.2017.12.004. [DOI] [PMC free article] [PubMed] [Google Scholar]
- 7.Walton KD, et al. Hedgehog-responsive mesenchymal clusters direct patterning and emergence of intestinal villi. Proc Natl Acad Sci U S A. 2012;109:15817–15822. doi: 10.1073/pnas.1205669109. [DOI] [PMC free article] [PubMed] [Google Scholar]
- 8.Hannezo E, Prost J, Joanny JF. Instabilities of monolayered epithelia: shape and structure of villi and crypts. Phys Rev Lett. 2011;107:078104. doi: 10.1103/PhysRevLett.107.078104. [DOI] [PubMed] [Google Scholar]
- 9.Almet AA, Maini PK, Moulton DE, Byrne HM. Modeling perspectives on the intestinal crypt, a canonical system for growth, mechanics, and remodeling. Curr Opin Biomed Eng. 2020;15:32–39. [Google Scholar]
- 10.Tozluoglu M, et al. Planar Differential Growth Rates Initiate Precise Fold Positions in Complex Epithelia. Dev Cell. 2019;51:299–312.:e4. doi: 10.1016/j.devcel.2019.09.009. [DOI] [PMC free article] [PubMed] [Google Scholar]
- 11.Drasdo D. Buckling instabilities of one-layered growing tissues. Phys Rev Lett. 2000;84:4244–4247. doi: 10.1103/PhysRevLett.84.4244. [DOI] [PubMed] [Google Scholar]
- 12.Chung SY, Kim S, Andrew DJ. Uncoupling apical constriction from tissue invagination. eLife. 2017;6:e22235. doi: 10.7554/eLife.22235. [DOI] [PMC free article] [PubMed] [Google Scholar]
- 13.Sanchez-Corrales YE, Blanchard GB, Röper K. Radially patterned cell behaviours during tube budding from an epithelium. eLife. 2018;7:e35717. doi: 10.7554/eLife.35717. [DOI] [PMC free article] [PubMed] [Google Scholar]
- 14.Sumigray KD, Terwilliger M, Lechler T. Morphogenesis and Compartmentalization of the Intestinal Crypt. Dev Cell. 2018;45:183–197.:e5. doi: 10.1016/j.devcel.2018.03.024. [DOI] [PMC free article] [PubMed] [Google Scholar]
- 15.Martin AC, Goldstein B. Apical constriction: Themes and variations on a cellular mechanism driving morphogenesis. Dev. 2014;141:1987–1998. doi: 10.1242/dev.102228. [DOI] [PMC free article] [PubMed] [Google Scholar]
- 16.Sui L, et al. Differential lateral and basal tension drive folding of Drosophila wing discs through two distinct mechanisms. Nat Commun. 2018;9:4620. doi: 10.1038/s41467-018-06497-3. [DOI] [PMC free article] [PubMed] [Google Scholar]
- 17.Nelson CM, et al. Microfluidic chest cavities reveal that transmural pressure controls the rate of lung development. Dev. 2017;144:4328–4335. doi: 10.1242/dev.154823. [DOI] [PMC free article] [PubMed] [Google Scholar]
- 18.Latorre E, et al. Active superelasticity in three-dimensional epithelia of controlled shape. Nature. 2018;563:203–208. doi: 10.1038/s41586-018-0671-4. [DOI] [PMC free article] [PubMed] [Google Scholar]
- 19.Sato T, et al. Single Lgr5 stem cells build crypt-villus structures in vitro without a mesenchymal niche. Nature. 2009;459:262–265. doi: 10.1038/nature07935. [DOI] [PubMed] [Google Scholar]
- 20.Spence JR, et al. Directed differentiation of human pluripotent stem cells into intestinal tissue in vitro. Nature. 2011;470:105–110. doi: 10.1038/nature09691. [DOI] [PMC free article] [PubMed] [Google Scholar]
- 21.Sato T, Clevers H. Growing self-organizing mini-guts from a single intestinal stem cell: Mechanism and applications. Science. 2013;340:1190–1194. doi: 10.1126/science.1234852. [DOI] [PubMed] [Google Scholar]
- 22.Gjorevski N, et al. Designer matrices for intestinal stem cell and organoid culture. Nature. 2016;539:560–564. doi: 10.1038/nature20168. [DOI] [PubMed] [Google Scholar]
- 23.McKinley KL, et al. Cellular aspect ratio and cell division mechanics underlie the patterning of cell progeny in diverse mammalian epithelia. eLife. 2018;7:e36739. doi: 10.7554/eLife.36739. [DOI] [PMC free article] [PubMed] [Google Scholar]
- 24.Broguiere N, et al. Growth of epithelial organoids in a defined hydrogel. Adv Mater. 2018;30:e1801621. doi: 10.1002/adma.201801621. [DOI] [PubMed] [Google Scholar]
- 25.Pérez-González C, et al. Active wetting of epithelial tissues. Nat Phys. 2019;15:79–88. doi: 10.1038/s41567-018-0279-5. [DOI] [PMC free article] [PubMed] [Google Scholar]
- 26.Thorne CA, et al. Enteroid Monolayers Reveal an Autonomous WNT and BMP Circuit Controlling Intestinal Epithelial Growth and Organization. Dev Cell. 2018;44:624–633.:e4. doi: 10.1016/j.devcel.2018.01.024. [DOI] [PMC free article] [PubMed] [Google Scholar]
- 27.Altay G, et al. Self-organized intestinal epithelial monolayers in crypt and villus-like domains show effective barrier function. Sci Rep. 2019;9:10140. doi: 10.1038/s41598-019-46497-x. [DOI] [PMC free article] [PubMed] [Google Scholar]
- 28.Liu Y, Qi Z, Li X, Du Y, Chen YG. Monolayer culture of intestinal epithelium sustains Lgr5+ intestinal stem cells. Cell Disco. 2018;4:32. doi: 10.1038/s41421-018-0036-z. [DOI] [PMC free article] [PubMed] [Google Scholar]
- 29.Kasendra M, et al. Development of a primary human Small Intestine-on-a-Chip using biopsy-derived organoids. Sci Rep. 2018;8:2871. doi: 10.1038/s41598-018-21201-7. [DOI] [PMC free article] [PubMed] [Google Scholar]
- 30.Verhulsel M, et al. Developing an advanced gut on chip model enabling the study of epithelial cell/fibroblast interactions. Lab Chip. 2021;21:365–377. doi: 10.1039/d0lc00672f. [DOI] [PMC free article] [PubMed] [Google Scholar]
- 31.Nikolaev M, et al. Homeostatic mini-intestines through scaffold-guided organoid morphogenesis. Nature. 2020;585:574–578. doi: 10.1038/s41586-020-2724-8. [DOI] [PubMed] [Google Scholar]
- 32.Maskarinec SA, Franck C, Tirrell DA, Ravichandran G. Quantifying cellular traction forces in three dimensions. Proc Natl Acad Sci U S A. 2009;106:22108–22113. doi: 10.1073/pnas.0904565106. [DOI] [PMC free article] [PubMed] [Google Scholar]
- 33.Trushko A, et al. Buckling of an Epithelium Growing under Spherical Confinement. Dev Cell. 2020;54:655–668.:e6. doi: 10.1016/j.devcel.2020.07.019. [DOI] [PMC free article] [PubMed] [Google Scholar]
- 34.Merkel M, Manning ML. A geometrically controlled rigidity transition in a model for confluent 3D tissues. New J Phys. 2018;20:022002 [Google Scholar]
- 35.Alt S, Ganguly P, Salbreux G. Vertex models: from cell mechanics to tissue morphogenesis. Philos Trans R Soc B. 2017;372:20150520. doi: 10.1098/rstb.2015.0520. [DOI] [PMC free article] [PubMed] [Google Scholar]
- 36.Hannezo E, Prost J, Joanny JF. Theory of epithelial sheet morphology in three dimensions. Proc Natl Acad Sci U S A. 2014;111:27–32. doi: 10.1073/pnas.1312076111. [DOI] [PMC free article] [PubMed] [Google Scholar]
- 37.Van Lidth de Jeude JF, Vermeulen JLM, Montenegro-Miranda PS, Van den Brink GR, Heijmans J. A Protocol for Lentiviral Transduction and Downstream Analysis of Intestinal Organoids. J Vis Exp. 2015;98:e52531. doi: 10.3791/52531. [DOI] [PMC free article] [PubMed] [Google Scholar]
- 38.Sato T, et al. Paneth cells constitute the niche for Lgr5 stem cells in intestinal crypts. Nature. 2011;469:415–418. doi: 10.1038/nature09637. [DOI] [PMC free article] [PubMed] [Google Scholar]
- 39.Rodríguez-Colman MJ, et al. Interplay between metabolic identities in the intestinal crypt supports stem cell function. Nature. 2017;543:424–427. doi: 10.1038/nature21673. [DOI] [PubMed] [Google Scholar]
- 40.Rupprecht JF, et al. Geometric constraints alter cell arrangements within curved epithelial tissues. Mol Biol Cell. 2017;28:3582–3594. doi: 10.1091/mbc.E17-01-0060. [DOI] [PMC free article] [PubMed] [Google Scholar]
- 41.Krndija D, et al. Active cell migration is critical for steady-state epithelial turnover in the gut. Science. 2019;365:705–710. doi: 10.1126/science.aau3429. [DOI] [PubMed] [Google Scholar]
- 42.Parker A, et al. Cell proliferation within small intestinal crypts is the principal driving force for cell migration on villi. FASEB J. 2017;31:636–649. doi: 10.1096/fj.201601002. [DOI] [PMC free article] [PubMed] [Google Scholar]
- 43.Clevers H. The intestinal crypt, a prototype stem cell compartment. Cell. 2013;154:274–284. doi: 10.1016/j.cell.2013.07.004. [DOI] [PubMed] [Google Scholar]
- 44.Tambe DT, et al. Collective cell guidance by cooperative intercellular forces. Nat Mater. 2011;10:469–475. doi: 10.1038/nmat3025. [DOI] [PMC free article] [PubMed] [Google Scholar]
- 45.Trepat X, et al. Physical forces during collective cell migration. Nat Phys. 2009;5:426–430. [Google Scholar]
- 46.Du Roure O, et al. Force mapping in epithelial cell migration. Proc Natl Acad Sci U S A. 2005;102:2390–2395. doi: 10.1073/pnas.0408482102. [DOI] [PMC free article] [PubMed] [Google Scholar]
- 47.Theveneau E, et al. Chase-and-run between adjacent cell populations promotes directional collective migration. Nat Cell Biol. 2013;15:763–772. doi: 10.1038/ncb2772. [DOI] [PMC free article] [PubMed] [Google Scholar]
- 48.Engler AJ, Sen S, Sweeney HL, Discher DE. Matrix elasticity directs stem cell lineage specification. Cell. 2006;126:677–89. doi: 10.1016/j.cell.2006.06.044. [DOI] [PubMed] [Google Scholar]
- 49.Chan CJ, et al. Hydraulic control of mammalian embryo size and cell fate. Nature. 2019;571:112–116. doi: 10.1038/s41586-019-1309-x. [DOI] [PubMed] [Google Scholar]
- 50.Nelson CM, VanDuijn MM, Inman JL, Fletcher DA, Bissell MJ. Tissue geometry determines sites of mammary branching morphogenesis in organotypic cultures. Science. 2006;314:298–300. doi: 10.1126/science.1131000. [DOI] [PMC free article] [PubMed] [Google Scholar]
- 51.McBeath R, Pirone DM, Nelson CM, Bhadriraju K, Chen CS. Cell Shape, Cytoskeletal Tension, and RhoA Regulate Stem Cell Lineage Commitment. Dev Cell. 2004;6:483–496. doi: 10.1016/s1534-5807(04)00075-9. [DOI] [PubMed] [Google Scholar]
- 52.Legant WR, et al. Measurement of mechanical tractions exerted by cells in three-dimensional matrices. Nat Methods. 2010;7:969–971. doi: 10.1038/nmeth.1531. [DOI] [PMC free article] [PubMed] [Google Scholar]
- 53.Yang Q, et al. Cell fate coordinates mechano-osmotic forces in intestinal crypt morphogenesis. Nat Cell Biol. 2021 doi: 10.1038/s41556-021-00700-2. In Press. [DOI] [PMC free article] [PubMed] [Google Scholar]
- 54.Muzumdar MD, Tasic B, Miyamichi K, Li L, Luo L. A Global Double-Fluorescent Cre Reporter Mouse. Genesis. 2007;45:593–605. doi: 10.1002/dvg.20335. [DOI] [PubMed] [Google Scholar]
- 55.Riedl J, et al. Lifeact mice for studying F-actin dynamics. Nat Methods. 2010;7:168–169. doi: 10.1038/nmeth0310-168. [DOI] [PubMed] [Google Scholar]
- 56.Zhang Y, et al. Mouse models of MYH9-related disease: Mutations in nonmuscle myosin II-A. Blood. 2012;119:238–250. doi: 10.1182/blood-2011-06-358853. [DOI] [PMC free article] [PubMed] [Google Scholar]
- 57.Edelstein AD, et al. Advanced methods of microscope control using μManager software. J Biol Methods. 2014;1:e10. doi: 10.14440/jbm.2014.36. [DOI] [PMC free article] [PubMed] [Google Scholar]
- 58.Schindelin J, et al. Fiji: An open-source platform for biological-image analysis. Nat Methods. 2012;9:676–682. doi: 10.1038/nmeth.2019. [DOI] [PMC free article] [PubMed] [Google Scholar]
- 59.de Reuille PB, et al. MorphoGraphX: a platform for quantifying morphogenesis in 4D. eLife. 2015;4:05864. doi: 10.7554/eLife.05864. [DOI] [PMC free article] [PubMed] [Google Scholar]
Associated Data
This section collects any data citations, data availability statements, or supplementary materials included in this article.
Supplementary Materials
Spreading of intestinal crypts on 5kPa polyacrylamide gels coated with collagen I and laminin 1. Over the course of three days, a 2D monolayer with crypt-like and villus-like domains is established. Membrane is labelled with tdTomato. Total duration: 45 hours.
Time-lapse of a basal (left) and apical (right) plane of the organoid monolayer. Multiple cell divisions can be observed at the crypt (center). Cells migrate collectively out of the crypt. Membrane is labelled with tdTomato. Total duration: 6 hours 32 minutes.
One cell (yellow) starts at the stem cell compartment and enters to the transit amplifying zone, acquiring an elongated shape. Another cell (light blue) at the transit amplifying zone divides and enters in the villus-like domain. Some cells (dark blues, light blue and green) enter the villus-like domain and accelerate, separating from their followers. Membrane is labelled with tdTomato. Total duration: 6 hours 32 minutes.
Time-lapse of a medial (left) and apical (right) plane of an organoid monolayer. A crypt in the center exhibits multiple cell divisions and radial migration into the villus-like domain. Multiple epithelial domes appear at times 1.20 - 2h (top right) and 8.40 h (left). Cells are constantly extruded in the villus-like domain. Membrane is labelled with tdTomato. Total duration: 14 hours.
Time-lapse of a top view (top) and a lateral view (bottom) of the extrusion of a cell in the villus-like region. At t=32 min, the cell begins to be extruded from the monolayer. At t=80 min, the cell is completely expelled. Total duration: 96 minutes.
Time-lapse of a stem cell that moves towards the crypt center upon division. Left: crypt basal plane (Z=2μm). Red area indicates the segmentation of the cell of interest. The yellow line indicates the track of the cell. Note that the cell divides in the apical plane and thus is not always visible in this basal plane. Right: time-lapse of the crypt following the Z plane where the cell is better visualized. At t=200 min, the video pauses transiently and the focus is progressively changed to the apical-most plane of the monolayer to follow cell rounding. After division, the cell reintegrates close to the center of the crypt and is again visible in the basal plane. Membrane is labelled with tdTomato. Total duration: 400 minutes.
Organoid monolayer treated with blebbistatin (t=1h 30 min) and allowed to recover after washing out the drug (t=5h). Addition of blebbistatin triggers a rapid reduction of crypt forces. After washout, the crypt recovers its characteristic traction pattern. At t=10h, an epithelial dome is formed. Membrane is labelled with tdTomato. Total duration: 15 hours. Top: 3D traction map of the crypt. Yellow vectors represent components tangential to the substrate and the color map represents the component normal to the substrate. Bottom: lateral view of the organoid monolayer. Yellow vectors represent tractions.
Membrane labelling (left) and velocity field (right) of organoid monolayers before and after ablation. Red line indicates the ablated region. The ablation (t=10s) induces a radial recoil of the monolayer. Membrane is labelled with tdTomato. Total duration: 20s.
Membrane labelling (left) and velocity field (right) of organoid monolayers before and after ablation (red line). Ablation (t=10s) induces a radial recoil of the monolayer. Membrane is labelled with tdTomato. Total duration: 20s.
Membrane labelling (left) and velocity field (right) of organoid monolayers before and after ablation. Red line indicates the ablated region. The ablation (t=10s) induces a radial recoil of the monolayer. Membrane is labelled with tdTomato. Total duration: 20s.
Membrane labelling (left) and velocity field (right) of organoid monolayers before and after ablation (red line). Ablation (t=10s) induces a radial recoil of the monolayer. Membrane is labelled with tdTomato. Total duration: 20s.
Example of a segmented crypt seeded on a 0.7 kPa substrate. At the beginning of the video, all the segmented cells are visible in the 3D rendering. For visualization purposes, a stem cell (green), a Paneth cell (red) and a transit amplifying cell (blue) are highlighted. Note the different morphologies of each cell type. The stem cell is apically constricted. The Paneth cell has a larger volume and exhibits an apical expansion probably reflecting its mucus compartment, and the transit amplifying cell is basally elongated and curved.
Example of five 3D rendered segmented stem cells (top), Paneth cells (center) and transit amplifying cells (bottom). Note that, even if each cell type exhibits characteristic morphometric properties, there is a remarkable shape variability.
Cell velocities (left) and 3D tractions (right) of an organoid monolayer. Cell velocity fluctuates in time and space, but shows a general pattern of radial movement away from the crypt. Traction forces are roughly constant in time. Yellow vectors represent components tangential to the substrate and the color map represents the component normal to the substrate. Membrane is labelled with tdTomato. Total duration: 6 hours 08 minutes.
Cell velocities (left) and 3D tractions (right) of an organoid monolayer. Cell velocity fluctuates in time and space, but shows a general pattern of radial movement away from the crypt. Traction forces are roughly constant in time. Yellow vectors represent components tangential to the substrate and the color map represents the component normal to the substrate. Membrane is labelled with tdTomato. Due to pronounced crypt folding, for visualization purposes, images are projections along the crypt medial plane. Total duration: 6 hours 24 minutes.
Membrane labelling (left) and velocity field (right) of an organoid monolayer before and after ablation (red line). Radial ablation of the monolayer at t=10s induces tissue recoil mainly in the direction parallel to the cut. Parallel velocity changes sign at the boundary between the crypt and the villus-like domain. Membrane is labelled with tdTomato. Red line indicates ablated area. Dashed yellow line indicates crypt contour. Total time: 20s.
Membrane labelling (left) and velocity field (right) of an organoid monolayer before and after ablation (red line). Radial ablation of the monolayer at t=10s induces tissue recoil in the direction both perpendicular and parallel to the cut. Parallel velocity changes sign at the boundary between the crypt and the villus-like domain. Membrane is labelled with tdTomato. Red line indicates ablated area. Dashed yellow line indicates crypt contour. Total time: 20s.
Data Availability Statement
MATLAB analysis procedures and the code implementing the 3D vertex model calculations are available from the corresponding authors on reasonable request.
The data that support the findings of this study are available from the corresponding authors on reasonable request.


