Abstract
Innate lymphoid cells (ILCs) participate in tissue homeostasis, inflammation and early immunity against infection. It is unclear how ILCs acquire effector function, and whether these mechanisms differ between organs. Through multiplexed single-cell mRNA-sequencing we identified cKit+CD127hiTCF-1hi early differentiation stages of T-bet+ ILC1. These cells were present across different organs and had the potential to mature towards CD127intTCF-1int and CD127−TCF-1− ILC1. Paralleling a gradual loss of TCF-1, differentiating ILC1 forfeited their expansion potential while increasing expression of effector molecules, reminiscent of T cell differentiation in secondary lymphoid organs. The transcription factor Hobit was induced in TCF-1hi ILC1s and was required for their effector differentiation. These findings reveal sequential mechanisms of ILC1 lineage commitment and effector differentiation that are conserved across tissues. Our analyses suggest that ILC1 emerge as TCF-1hi cells in the periphery and acquire a spectrum of organ-specific effector phenotypes through a uniform Hobit-dependent differentiation pathway driven by local cues.
Introduction
Non-lymphoid organs are populated by innate lymphoid cells (ILCs) that initiate rapid local immune responses, regulate tissue-homeostasis, and contribute to inflammatory diseases. As tissue-resident cells, ILCs adapt to their environment and exhibit a spectrum of organ-specific phenotypes and functions 1, 2, 3. We and others have recently identified tissue-associated ILC progenitors (ILCPs) that exhibit multi-lineage potential, supporting the concept that ILCs can develop and mature within adult tissues 4, 5, 6. ILCPs gain expression of master transcription factors that determine the lineage-choice of developing ILCs and enable the acquisition of prototypic effector functions directing immunity against viruses, bacteria, or parasites 1, 2. The specification of ILC1, ILC2 and ILC3 through lineage-defining transcription factors T-bet, GATA-3, and Rorγt, respectively, parallels the polarization of antigen-experienced T cells. A key feature of T cell immunity is the compartmentalization of polarized cells into memory- and effector-like cells, that represent early versus more terminal differentiation stages, respectively, and that are characterized by distinct capacities for re-expansion and immediate expression of effector molecules. Whether and how ILCs undergo further effector differentiation beyond the stage of lineage commitment is currently unclear 3, 7. Major open questions are how ILC heterogeneity and effector specialization are established, how these processes are transcriptionally regulated, and whether underlying pathways are conserved across organs 3, 7, 8, 9, 10. Understanding the mechanisms regulating the effector function of ILCs is of special importance due to their broad functions in tissue-immunity, -homeostasis and inflammatory diseases.
Here, we addressed these questions for ILC1s, which exhibit pronounced tissue-specific heterogeneity. We report the identification of distinct maturation stages of ILC1s that are developmentally related along a differentiation trajectory, on which cells gradually decreased their proliferative potential in response to homeostatic cytokines, while gaining expression of effector molecules. We identified TCF-1hi early maturation stages of ILC1s that already expressed the lineage-defining transcription factor T-bet, but shared gene expression patterns with ILC progenitors. These CD127hi TCF-1hi “early” ILC1, that were present across different organs, initiated expression of the transcription factor Hobit to drive their stepwise differentiation into downstream CD127int TCF-1int and CD127− TCF-1− effector cells. These findings reveal sequential mechanisms of ILC1 lineage commitment and ILC1 effector maturation and highlight remarkable similarities between the population structure and effector maturation of ILCs and antigen-experienced T cells. Our analyses suggest that effector differentiation of committed ILC1 is established through a uniform Hobit-dependent pathway in ILC1 populations across peripheral tissues.
Results
CD127 identifies “helper-” and “cytotoxic-like” hepatic ILC1
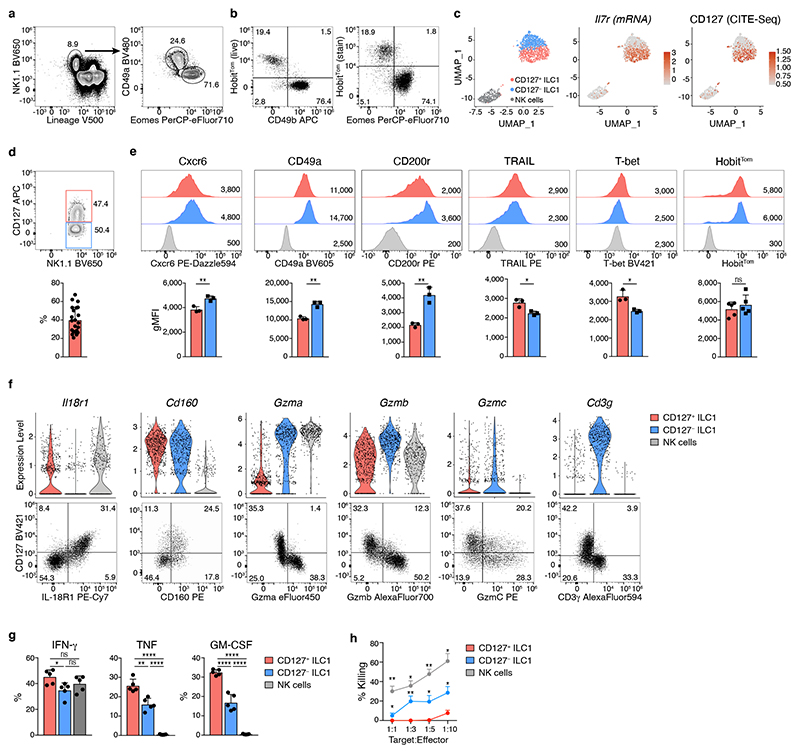
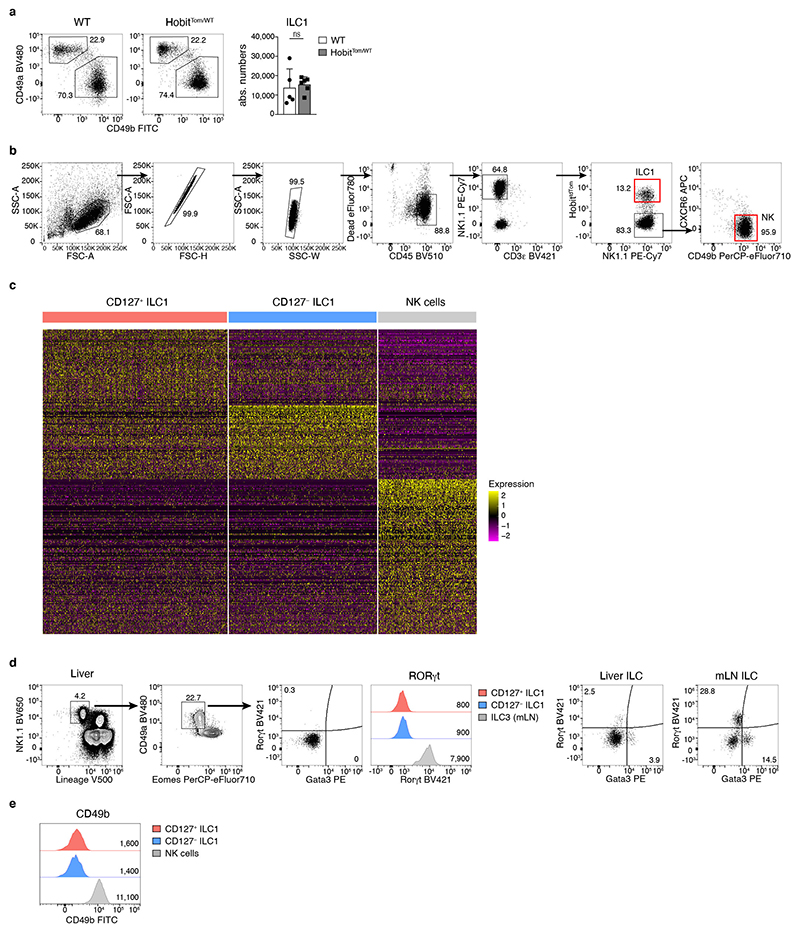
Hepatic ILC1 are Lin− NK1.1+ Eomes− cells characterized by expression of CD49a, CXCR6, TRAIL and CD200R 11, 12, 13, 14, 15. We could identify these cells through a fluorescent reporter of the transcription factor Hobit, which is required for the generation of hepatic ILC1 16, 17 (Fig. 1a, b and Extended Data Fig. 1a). Within the ILC lineages, expression of Hobit was specifically detected in ILC1, as described 16, 18, but not in NK cells (Fig. 1b). To characterize hepatic ILC1 in more depth, we sorted Lin− NK1.1+ cells and enriched CD49b− HobitTom+ ILCs for CITE-seq (Fig. 1c and Extended Data Fig. 1b, c, Supplementary Table 1). Our sequencing analysis, which is accessible as interactive online resource (https://go.uniwue.de/hobit), revealed that hepatic ILC1 comprised two populations that segregated through the expression of Il7r transcript and its corresponding protein CD127 (Fig. 1c, d). CD127+ and CD127− ILC1s expressed comparable levels of the surface molecules Cxcr6, CD49a, CD200r, TRAIL as well as the transcription factors T-bet and Hobit, while lacking expression of CD49b, Eomes and Rorγt, defining them as bona-fide ILC1 (Fig. 1e and Extended Data Fig. 1d, e). CD127+ ILC1 expressed increased levels of IL-18R1 and CD160 while CD127− ILC1 were characterized by preferential expression of the transmembrane protein CD3γ, and granzymes a, b and c (Fig. 1f), consistent with the cytotoxic function of ILCs previously observed in mice and men 9, 14, 19, 20, 21, 22. Indeed, while CD127+ had a modestly increased capacity to produce the cytokines IFN-γ, TNF and GM-CSF, CD127− ILC1 were able to kill YAC target cells more efficiently than their CD127+ counterparts (Fig. 1g, h). These analyses revealed that CD127+ and CD127− hepatic ILC1 represent distinct populations with gene expression patterns reminiscent of “helper-like” and “cytotoxic-like” cells.
Fig. 1. Differential expression of CD127 identifies “helper-like” and “cytotoxic-like” hepatic ILC1.
a, b Representative FACS analysis showing gating strategy to identify liver CD45+Lin−NK1.1+CD49a+Eomes− ILC1 (a) and tdTomato (Tom) Hobit reporter signal in Lin−NK1.1+ cells in HobitTom mice (b). c, f Cellular indexing of transcriptomes and epitopes by sequencing (CITE-seq) of liver ILC1 and NK cells sorted from HobitTom/WT mice. c Uniform Manifold Approximation and Projection (UMAP) visualization of 1545 single cell transcriptomes delineating liver ILC1 and NK cell clusters identified on the basis of their transcriptional signatures (left), and colored according to the expression of Il7r mRNA (middle) and protein (CITE-seq) (right). d Representative FACS analysis of CD127 expression on liver ILC1. Bar graph shows frequency of CD127+ cells within liver Lin− NK1.1+ Eomes− CD49a+ ILC1. Data are pooled from 7 independent experiments with n=2-5 mice (total n=22 mice). e Representative histograms showing expression of indicated markers by CD127+ and CD127− liver ILC1 and NK cells of WT and HobitTom/WT mice. Bar graphs show geometric mean of fluorescence intensity (gMFI) of protein and reporter expression. Data are representative of more than 3 individual experiments with n=3 WT mice, or pooled from 2 individual experiments with n=2 and 3 HobitTom/WT mice. f Violin plots displaying expression levels of indicated genes across clusters (top row) and their associated representative FACS plots showing protein expression within hepatic ILC1 (bottom row). g Frequency of IFN-γ, TNF and GM-CSF-producing cells within CD127+ and CD127− liver ILC1 and NK cells of WT mice 4h after in vitro stimulation with PMA/Ionomycin and Brefeldin A. Data are representative of 2 independent experiments with n=5 mice per experiment. h In vitro killing of YAC target cells by CD127+ and CD127− liver ILC1 and NK cells at indicated target:effector ratios. Data are representative of 3 independent experiments with 2-3 replicates per condition. Bar graphs indicate individual mice (symbols) and mean (bar), error bars display means ± SD. Statistical significance was calculated by unpaired two-tailed t-test; *p < 0.05, **p < 0.01, ***p < 0.001, ****p < 0.0001, ns – not significant.
CD127− cytotoxic-like cells are bona-fide ILC1s
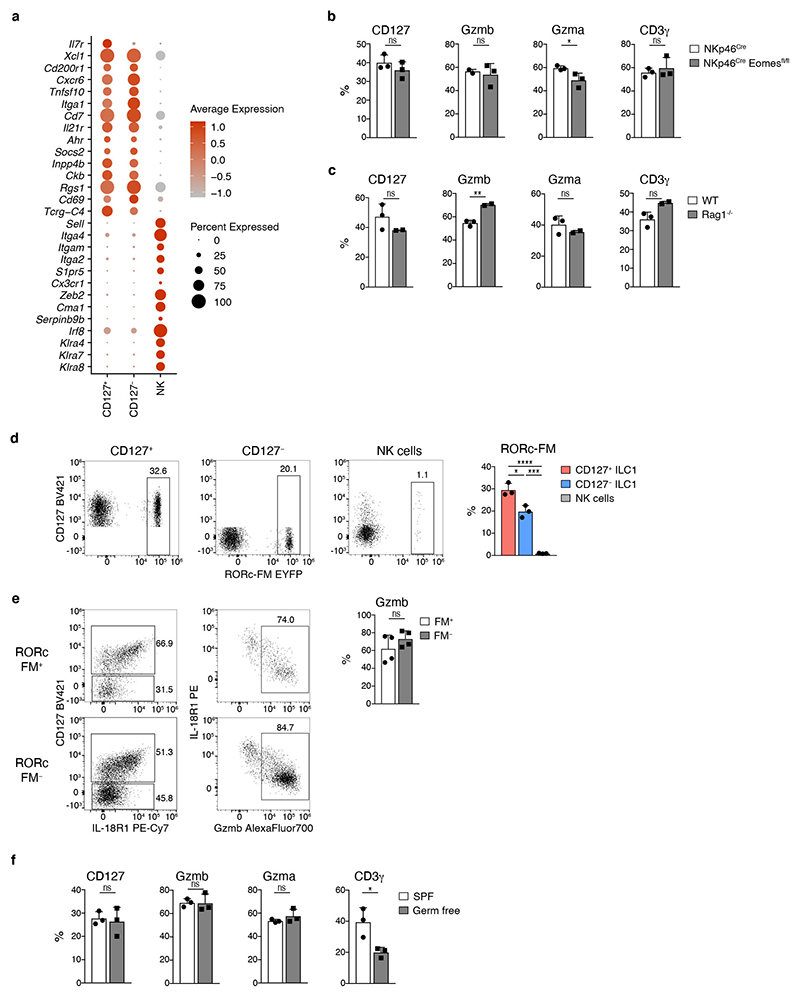
CD127− “cytotoxic-like” cells clustered with canonical CD127+ ILC1, and not with Eomes+ conventional NK (cNK) cells (Fig. 1c), and expressed Cd200r, Cxcr6, Tnfsf10, Itga1, Cd7, Il21r, Ahr, Socs2, Inpp4b, Ckb, Rgs1, CD69, germline-encoded Tcrg transcripts, and the cytokine Xcl1, all of which are part of a core signature distinguishing liver ILC1s from cNK cells 18, while lacking expression of Sell, Itga4, Itgam, Itga2, S1pr5, Cx3cr1, Zeb2, Cma1, Serpinb9b, and Irf8, as well as Ly49 receptors Klra4, Klra7 and Klra8, that are characteristically expressed by cNK cells (Extended Data Fig. 2a). In addition, CD127– ILC1 developed normally in NKp46Cre Eomesfl/fl mice that are devoid of cNK cells (Extended Data Fig. 2b), as well as in T cell deficient Rag1-/- mice (Extended Data Fig. 2c). Both, CD127+ and CD127− ILC1 subsets, but not cNK cells, exhibited a high degree of fate-mapping for Rorc expression, which can identify ILC1s that have differentiated from ILC3s 23, 24, or from subsets of ILCPs marked by stochastic expression of Rorc 4, 25. This fatemapping analysis suggests that CD127+ and CD127− ILC1 subsets have a shared developmental origin, while being separate from cNK cells. Conversely, both FM+ as well as FM− cells showed a similar pattern of CD127, IL-18R1 and granzyme expression (Extended Data Fig. 2d, e). Consistent with the idea that granzyme-expressing ILC1s differentiated as part of a developmental program in the absence of microbial challenges, both helper- and cytotoxic-like ILC1 were readily detected in gnotobiotic (germ-free) mice (Extended Data Fig. 2f). In combination, these phenotypic and developmental similarities suggest that CD127+ and CD127− ILC populations represent distinct subsets in the ILC1 lineage.
CD127+ ILC1s are precursors of CD127− cytotoxic-like ILC1s
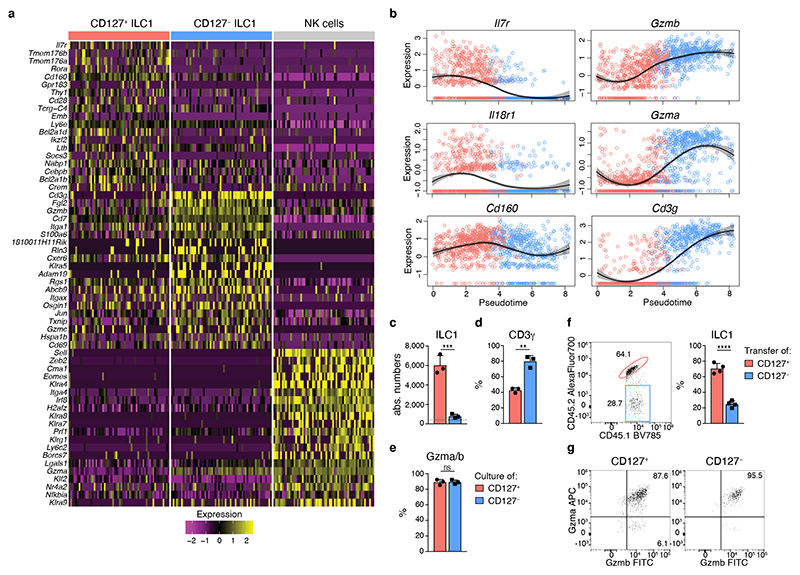
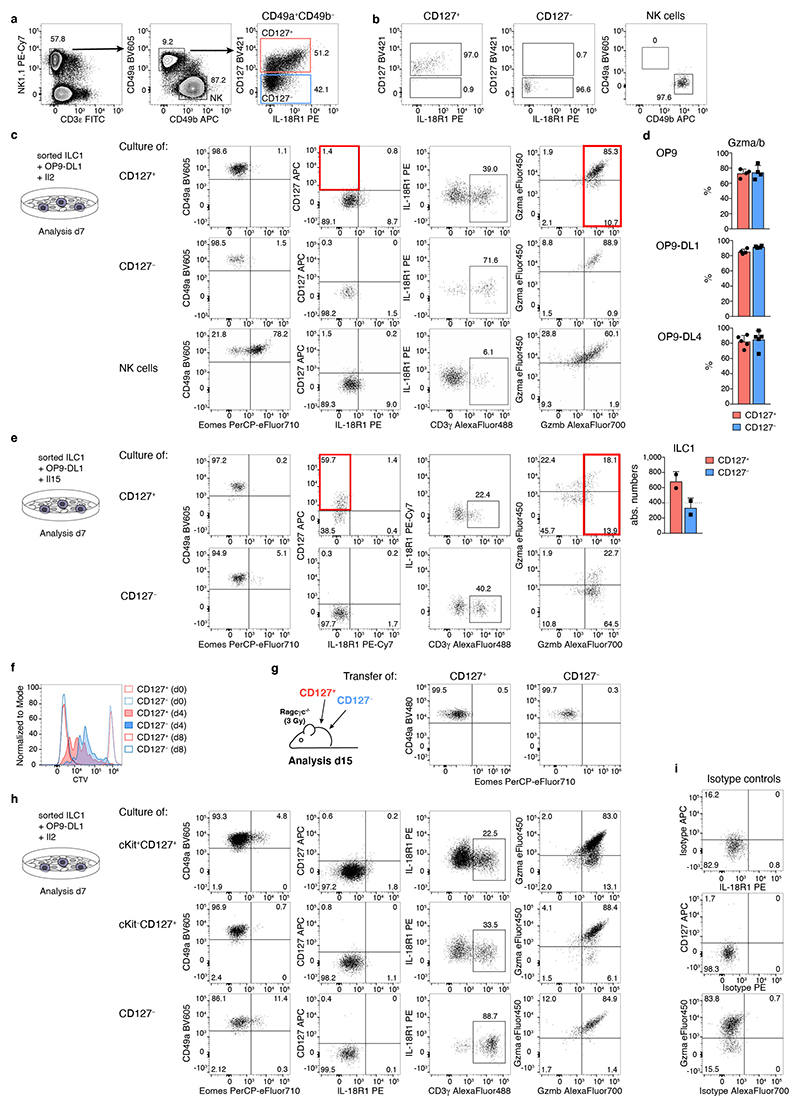
CD127+ and CD127− ILC1s shared a core gene expression program while many genes, including cytokine receptors (e.g. Cd127, Il18r1) and effector molecules (e.g. Fgl2, Ccl5, S100a6, Gzma and Gzmb) were differentially expressed (Fig. 2a). Reminiscent of the potential for cytokine production and cytotoxicity (Fig. 1g, h), expression of these genes was not mutually exclusive among CD127+ and CD127− subsets but instead appeared to be gradually increased in one or the other cluster, raising the possibility that these ILC1 subsets represented extremes of a continuous spectrum of differentiation states. Indeed, pseudo-temporal ordering of single cell transcriptomes suggested that CD127+ ILC1 can differentiate into CD127− ILC1 by gradually downregulating Il7r and Il18r1, while gaining expression of effector molecules Gzma, Gzmb as well as Cd3g (Fig. 2b). In fact, when cultured on OP9-DL1 feeder cells, CD127+ ILC1 showed vigorous expansion, lost expression of CD127 and IL-18R1, while gaining expression of CD3γ, Gzma and Gzmb, and hence acquired a phenotype of CD127− IL-18R1− Eomes− CD49a+ cytotoxic-like ILC1 (Fig. 2c-e and Extended Data Fig. 3a-c). This differentiation occurred independent of stimulation with the notch ligand DL1, as similar results were obtained with OP9 and OP9-DL4 feeder cells (Extended Data Fig. 3d). Because IL-2 may activate ILC1, we tested their differentiation in the presence of IL-15, which is an essential homeostatic cytokine and differentiation factor for ILC1 11, 26. The overall expansion was significantly reduced in the IL-15 versus IL-2 supplemented cultures, yet CD127+ ILC1 still gave rise to Gzma and Gzmb-expressing CD127− cells. Notably, a higher fraction of cells retained their original phenotype (CD127+ Gzma− Gzmb−) in the presence of IL-15, consistent with the idea that IL-15 maintains a proportion of ILC1 in an early differentiation state, and reminiscent of homeostatic conditions in vivo (Extended Data Fig. 3e). In contrast to CD127+ ILC1, CD127− ILC1 showed an impaired expansion in all experimental conditions that we tested, and remained CD127− while further increasing CD3γ, Gzma and Gzmb expression during culture (Fig. 2c-e and Extended Data Fig. 3c-e). CTV labeling showed that the increased expansion potential of CD127+ compared to CD127− ILC1 associated with increased proliferation of this ILC1 subset (Extended Data Fig. 3f). These findings were recapitulated when ILC1 subsets differentiated in vivo after adoptive transfer (Fig. 2f, g and Extended Data Fig. 3g). Of note, CD127+ cells generated significantly more cytotoxic-like ILC1 than their CD127− counterparts in vitro and in vivo, highlighting the differentiation and expansion potential of CD127+ ILC1s.
Fig. 2. CD127+ ILC1s are precursors of CD127− cytotoxic-like ILC1s.
a Heat map of marker gene expression associated with identified clusters of sc-RNA-Seq analysis depicted in Fig. 1c. b Pseudo-temporal ordering of ILC1 single cell transcriptomes with Slingshot. Expression of selected genes along the pseudotime. Colors indicate cluster identity as in 1c. Black curve shows the local polynomal regression of the distribution and gray area the confidence interval. c-e In vitro culture of CD127+ and CD127− liver ILC1 with IL-Figures und Reporting Summary2 and OP9-DL1 cells for 7 days. Absolute numbers (c) and frequency of CD3γ+ (d) and Gzma+Gzmb+ cells (e) on d7 is shown. Dashed line indicates number of cells on d0 (input=400 cells). Data are representative of 3 independent experiments with n=3 replicates per experiment (c-e). f, g In vivo co-transfer of congenically marked CD127+ and CD127− liver ILC1 into sublethally irradiated Rag2-/-γc-/-. Representative FACS analysis and bar graphs show relative frequency (f) and granzyme expression (g) of liver ILC1 derived from indicated transferred ILC1 subsets on d15. Data are representative of 2 independent experiments with n=4 mice (f, g). Bar graphs indicate replicates (c-e) or individual mice (f) (symbols) and mean (bar), error bars display means ± SD. Statistical significance was calculated by unpaired two-tailed t-test; **p < 0.01, ***p < 0.001, ****p < 0.0001, ns – not significant.
TCF-1hi cells are early differentiation stages of ILC1s
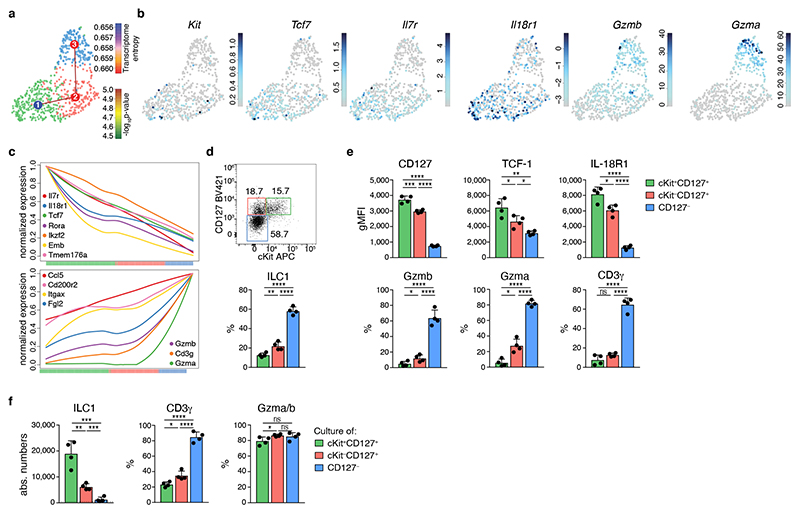
These data established that CD127+ and CD127− hepatic cells represent a continuous spectrum of cellular differentiation states of ILC1 that are related along a developmental path. The observation that CD127+ ILC1s had a pronounced expansion and differentiation potential prompted us to ask whether early “progenitor-like” developmental stages of ILC1s were present in the tissue. To address this question, we analyzed our scRNA-Seq dataset with RaceID3, which has improved performance in the identification of relatively rare cell types, and performed subsequent StemID analysis, to infer putative lineage relationships (Fig. 3a-c). These analyses identified three clusters of ILC1s, one of which was characterized by increased expression of Kit and Tcf7 (the gene encoding TCF-1), and a high relative transcriptome entropy, a criterion used to identify immature or stem-like populations in scRNA-Seq datasets 27. In addition to Kit and Tcf7, these cells expressed high levels of Il7r, Il18r1, Emb, Rora, and Ikzf2, all of which are characteristically expressed in ILC progenitors 4, 6, 25, 28, 29. StemID trajectory analysis suggested a model of ILC1 differentiation, in which Kit+ Tcf7hi cells represent early maturation stages that gradually downregulate Il7r, Il18r1, Tcf7, Kit, Emb, Rora, and Ikzf2, while gaining expression of Itgax, Cd200r2, CD3g and a range of effector molecules, including Fgl2, Ccl5, Gzma, and Gzmb (Fig. 3c). As inferred from the RaceID3 analysis, flow cytometric analysis identified a cKit+ CD127hi IL-18R1hi TCF-1hi subset of ILC1s which represented about 10-15 percent of hepatic ILC1s (Fig. 3d). Furthermore, we could demonstrate, at the protein level, the predicted expression gradients of marker genes IL-7R, IL-18R1, TCF-1, Gzma, Gzmb and CD3γ along the proposed developmental path from cKit+CD127+ towards cKit−CD127int and finally cKit−CD127− ILC1s (Fig. 3e). Confirming their potential for effector maturation along this trajectory, sort-purified cKit+CD127+ ILC1s lost CD127 and IL-18R1 expression and gained high expression of granzymes upon in vitro culture (Fig. 3f and Extended Data Fig. 3h). Of note, cKit+CD127+ ILC1s dramatically outcompeted the cKit− ILC1 subsets in their potential to generate progeny effector ILC1, consistent with the idea that a “progenitor-like” transcriptional program endows these cells with an increased expansion and differentiation potential.
Fig. 3. TCF-1hi early ILC1s give rise to downstream effector ILC1s.
a-c scRNA-seq analysis of hepatic ILC1. a UMAP visualization of single-cell liver ILC1 transcriptomes clustered with RaceID3 and overlaid with lineage inference using StemID2. Node color depicts transcriptome entropy and link color indicates p-value of StemID2 links (p < 0.05, Methods). b UMAP visualization showing log2 normalized expression of selected genes. c Pseudo-temporal gene expression profile of indicated marker genes of Tcf7 hi (left) and Tcf7 lo ILC1 (right) along the inferred differentiation. Color bars indicate cluster identity. d, e Representative FACS analysis of hepatic ILC1 subsets based on CD127 and cKit expression. Histogram indicates the relative abundance within liver ILC1 (d). gMFI of CD127, TCF-1 and IL-18R1 expression within ILC1 subsets (top) and frequency of Gzmb, Gzma and CD3γ-positive cells within indicated ILC1 subsets (bottom) (e). f In vitro culture of sort-purified indicated hepatic ILC1 subsets cultured in the presence of IL-2 and OP9-DL1 cells for 7 days. Absolute numbers and frequency of CD3γ+ and Gzma+Gzmb+ cells on d7 is shown. Dashed line indicates number of cells on d0 (input=400 cells). Data are representative of 3 independent experiments (d-f) with n=3 mice per group (d, e) or n=4 replicates per experiment (f). Bar graphs indicate individual mice (d,e) or replicates (f) (symbols) and mean (bar), error bars display means ± SD. Statistical significance was calculated by unpaired two-tailed t-test; *p < 0.05, **p < 0.01, ***p < 0.001, ****p < 0.0001, ns – not significant.
TCF-1hi early ILC1s are lineage-committed effector cells
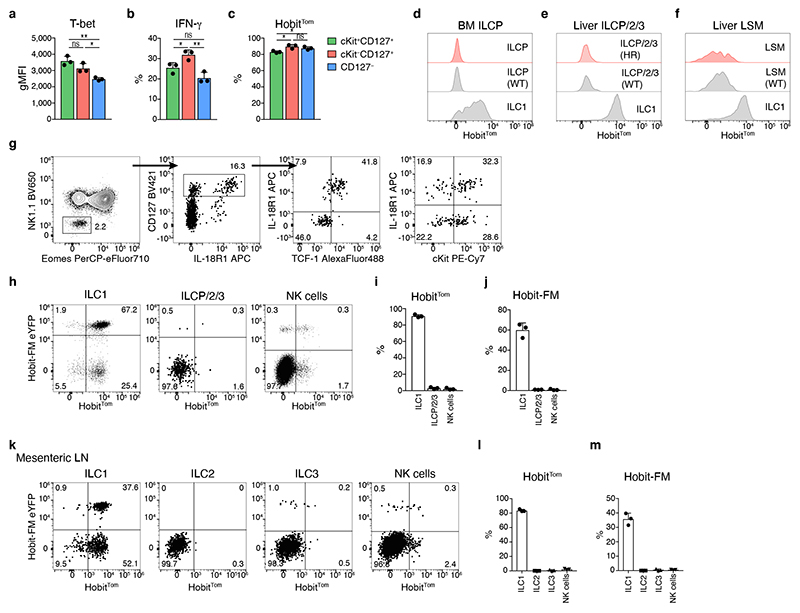
The TCF-1hi early-stage ILC1s identified here expressed several genes that are also expressed in ILCPs and exhibited a marked expansion potential, raising the question whether these cells represent progenitor-like or lineage-committed cells. In contrast to ILCPs, cKit+ TCF-1hi ILC1 expressed NK1.1, NKp46 and T-bet and produced IFN-γ upon stimulation (Fig. 4a, b). Interestingly we found that TCF-1hi ILC1s were Hobit+, suggesting that expression of Hobit was specifically acquired this early differentiation stage of ILC1 (Fig. 4c). Hobit expression was absent in ILCPs in the bone marrow and in Lin-CD127+ NK1.1− liver cells, which contain hepatic ILC2 and ILC3 as well as cells with a cKit+ IL-18R1+ TCF-1hi phenotype characteristic of circulating and tissue-associated ILCPs 4, 5, 6. We also failed to detect Hobit reporter activity in recently discovered liver-resident lineage−Sca1+Mac-1+ (LSM) cells that may contribute to the local differentiation of ILC1 30 (Fig. 4d-g). To test the developmental potential of Hobit-expressing cells, we took advantage of the Hobit-driven Cre recombinase of Hobit reporter mice by crossing these mice onto ROSA26-flox-stop-flox-eYFP (ROSA26-eYFP) mice. The Hobit-driven Cre recombinase will excise the floxed transcriptional stop sequence and enable fate mapping of Hobit expression through constitutive eYFP expression. Previous analysis has shown the efficacy and specificity of these Hobit lineage tracer mice in T cells 17. Both Hobit reporter activity and Hobit fate mapping were largely absent in ILC lineages other than ILC1 in the liver (Fig. 4h-j). As ILC2 and ILC3 are relatively rare cells in the liver, we confirmed these findings in the mesenteric LN (Fig. 4k-m). These data demonstrate, that our analysis identified TCF-1hi early yet lineage-committed differentiation stages of effector ILC1s.
Fig. 4. Hobit marks lineage-committed ILC1s.
a gMFI of T-bet expression within subsets of hepatic ILC1. b Frequency of IFN-γ-producing cells within indicated subsets 4h after in vitro stimulation with IL-12/IL-18 and Brefeldin A. c Frequency of Hobit-positive ILC1 within indicated subsets. d-f Representative histograms showing expression of HobitTom indicated cell types in bone marrow (BM) and livers of WT and HobitTom/WT mice. BM ILCP were gated as Lin−NK1.1−CD127+IL-18R1+ST2− cells. BM ILC1 were gated as Lin−NK1.1+NKp46+CD49a+CD49b− cells. Liver ILCP/2/3 were gated as in (g). Liver LSM were gated as Lin−NK1.1−NKp46−CD11b+Sca1+ cells. g Gating strategy identifying and phenotyping Lin−NK1.1− CD127+ liver ILCP/2/3. h-m Representative FACS analysis of HobitTom and HobiteYFP fatemap (FM) labeling across different ILC lineages in the liver (h-j) and mesenteric LN (k-m). ILC2 were gated as Lin−NK1.1−NKp46−CD127+KLRG1+. ILC3 were gated as Lin− NK1.1−NKp46−CD127+KLRG1−CD90+ cells. Data are representative of 3 (a, c, e, g) or 2 (b, d, f, h-m) independent experiments with n=3 mice per experiment. Bar graphs indicate individual mice (symbols) and mean (bar), error bars display means ± SD. Statistical significance was calculated by unpaired two-tailed t-test; *p < 0.05, **p < 0.01, ns – not significant.
Hobit drives the effector differentiation of committed ILC1
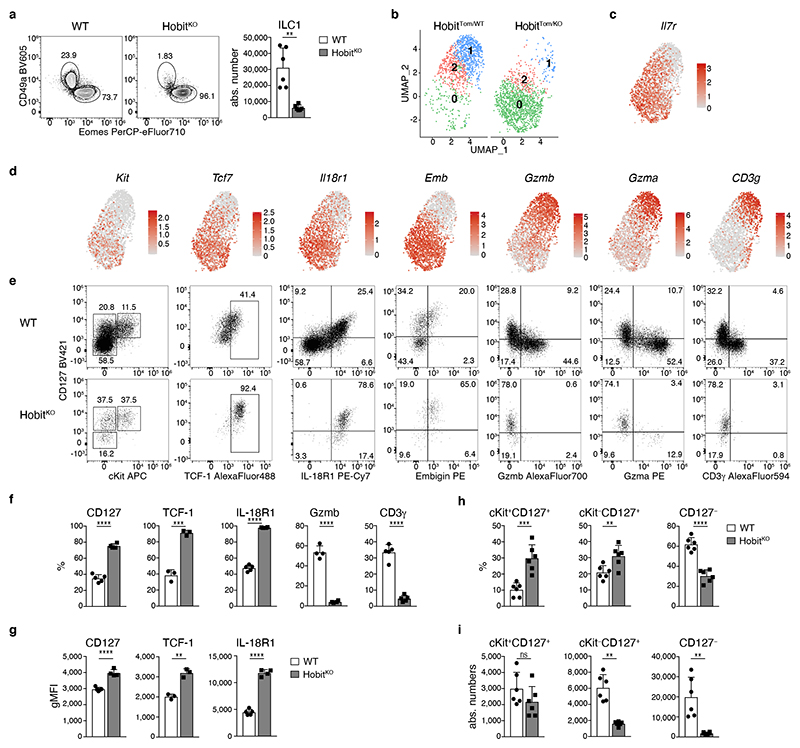
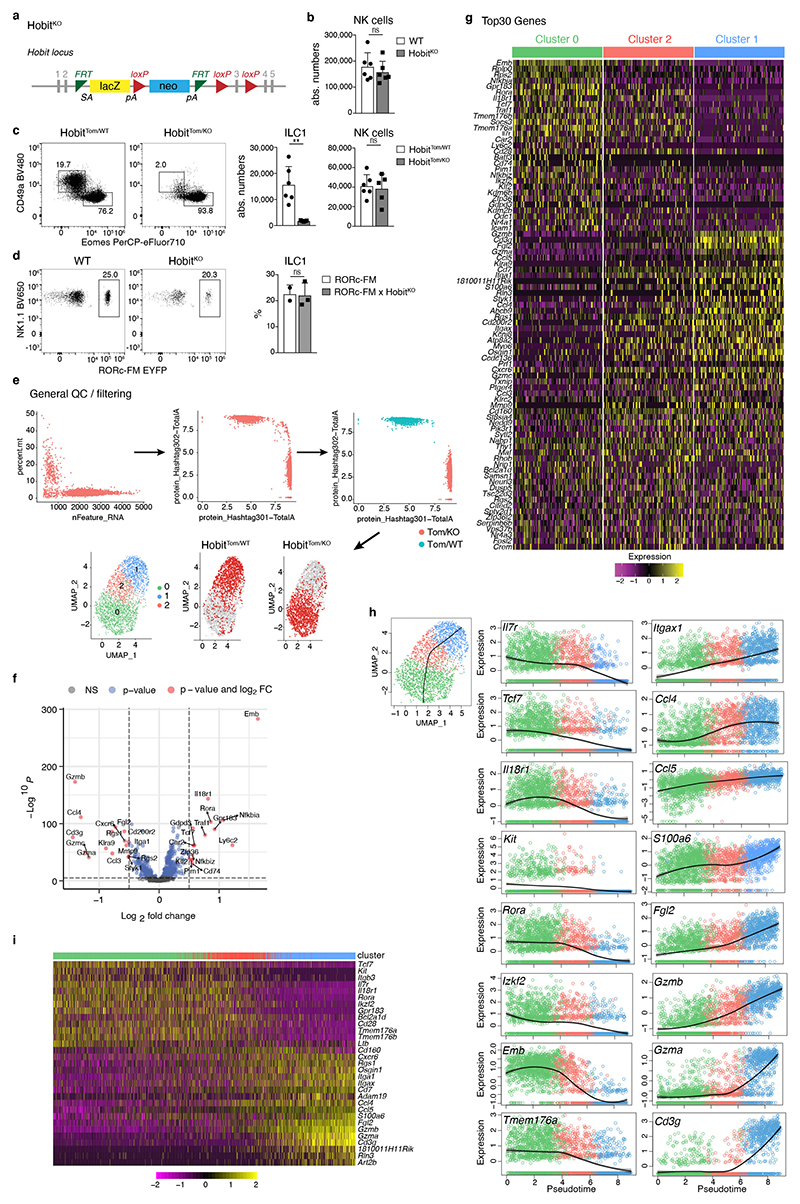
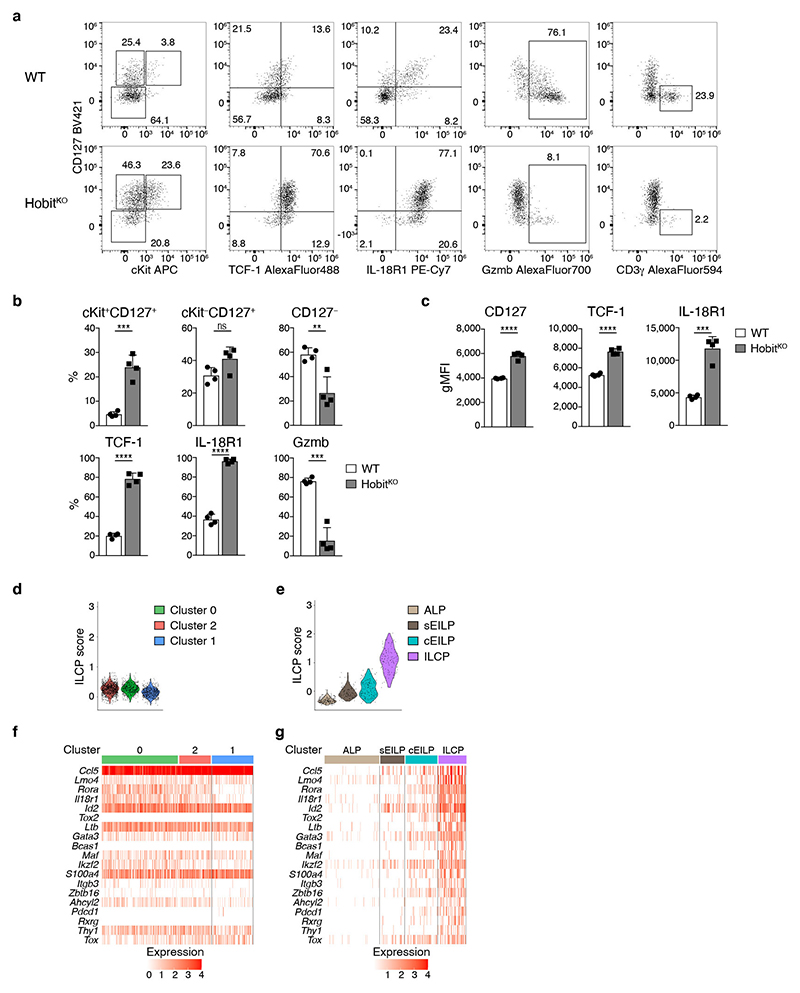
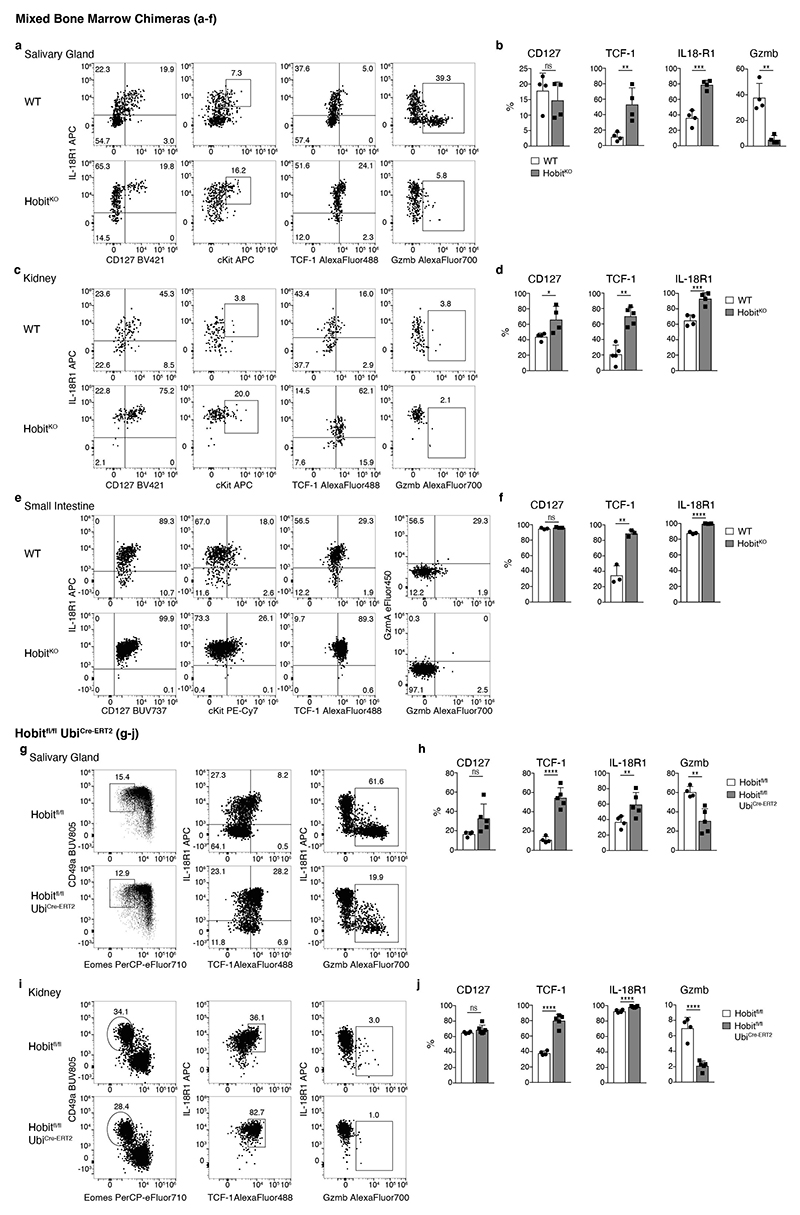
Mice lacking the transcription factor Hobit are characterized by the paucity of hepatic ILC1s, while having normal development of NK cells, which we confirmed using two novel mouse strains (Fig. 5a, and Extended Data Fig. 4a-c). Importantly, the few ILC1 detectable in Hobit-deficient mice were not “ex-ILC3”, as they showed the same level of Rorc-fate-mapping as ILC1s in WT livers (Extended Data Fig. 4d). To investigate, whether Hobit-deficiency globally reduced ILC1 numbers or specifically impacted on ILC1 development along the newly identified differentiation stages, we sorted Hobit+ ILC1s from Hobit-sufficient (HobitTom/WT) versus Hobit-deficient (HobitTom/KO) mice and performed scRNA-seq (Fig. 5b and Extended Data Fig. 4e-g). Our analysis revealed three clusters with gene expression patterns reminiscent of the findings in WT ILC1s. Interestingly, Hobit-deficient ILC1s accumulated as Kit+ Tcf7hi early ILC1s expressing high levels of Il7r, Il18r1, Ikfz2, Rora, and Emb (cluster 0, Fig. 5b-d and Extended Data Fig. 4g), while few Hobit-deficient ILC1s expressed Cd3g, and effector molecules Ccl4, Ccl5, Fgl2, S100a6, Gzma and Gzmb (cluster 1, Fig. 5b, d and Extended Data Fig. 4g). These data suggested a developmental block of ILC1 differentiation in the absence of Hobit. FACS analysis confirmed the inferred phenotypes of Hobit-deficient ILCs, highlighting a close correlation between single cell mRNA and protein expression (Fig. 5e-g). Again, trajectory analysis suggested that cKit+ CD127hi IL-18R1hi TCF-1hi subsets, that accumulated in the absence of Hobit, have the potential to mature towards CD127int TCF-1int and CD127− TCF-1− ILC1s, and to concomitantly expand the expression of effector molecules (Extended Data Fig. 5h, i). Interestingly, cKit+ TCF-1hi CD127hi IL-18R1hi early ILC1s were present at normal numbers in Hobit-deficient mice (Fig. 5h, i). In contrast, cKit− CD127+ and particularly CD127− ILC downstream differentiation stages were severely reduced in the absence of Hobit (Fig. 5h, i). These phenotypes were cell-intrinsic, as the developmental block of ILC1s in HobitKO animals was similarly detected in the Hobit deficient compartment of HobitKO + HobitWT mixed bone marrow chimeric mice (Extended Data Fig. 5a-c). Together, these analyses suggest that cKit+ TCF-1hi CD127hi IL-18R1hi cells represent an early developmental stage of ILC1s that initiate Hobit expression to drive their effector differentiation and diversification.
Fig. 5. Hobit drives the effector differentiation of lineage-committed ILC1.
a Representative FACS analysis displaying Lin−NK1.1+ hepatic ILC1 and NK cells in WT and HobitKO mice. Bar graphs indicate absolute numbers of liver ILC1. b-d scRNA-seq analysis of 2549 hash-tagged liver ILC1 sorted from HobitTom/WT and HobitTom/KO mice. UMAP visualization of liver ILC1 clusters (b), and colored according to the normalized expression of selected genes (c, d). e-g Representative FACS analysis of indicated marker expression of ILC1 from livers of WT and HobitKO mice. f Frequency of ILC1s expressing indicated marker proteins of WT and HobitKO mice. g gMFI of CD127, TCF-1 and IL-18R1 expression within marker-positive ILC1. h, i Frequency (h) and absolute numbers (i) of indicated ILC1 subsets in WT and HobitKO mice. Data in (a), (h) and (i) are pooled from 2 independent experiment with n=3 mice per group. Data in (f) and (g) show one representative of 3 independent experiments with n=3, 4 and 5 mice per group. Bar graphs indicate individual mice (symbols) and mean (bar), error bars display means ± SD. Statistical significance was calculated by unpaired two-tailed t-test; **p < 0.01, ***p < 0.001, ****p < 0.0001, ns – not significant.
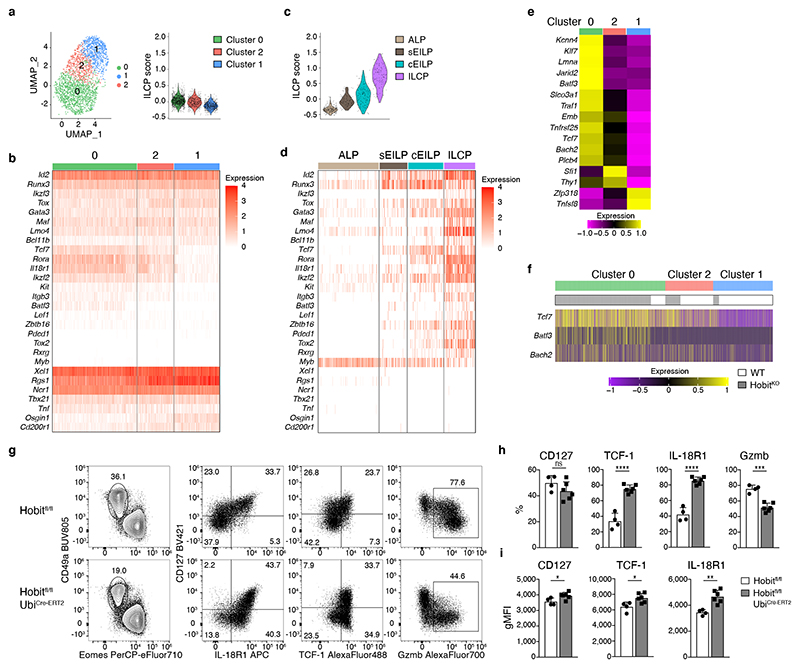
The markedly increased expression of Tcf7, Rora, Il18r1 and Kit, urged us to address whether WT or Hobit-deficient TCF-1hi early ILC1s resembled ILCPs. To this end, we selected a list of ILCP signature genes based on several recent studies 4, 25, 28, 29 and calculated expression scores in the ILC1 clusters identified in our single cell mRNA-Seq analysis. These comparisons yielded a low ILCP score for all hepatic ILC1 subsets but readily identified ILCPs in a dataset recently published by Harly et al 29 (Fig. 6a-d). The unbiased derivation of an ILCP core signature from this dataset yielded similar results (Extended Data Fig. 5d-g). Consistently, while some “ILCP genes” were indeed enriched in TCF-1hi early ILC1s, they largely lacked expression of other genes associated with ILCPs, such as Tox2, Zbtb16, Bcl11b, Pdcd1, Lef1, Myb and Rxrg. Instead, all Hobit-deficient and sufficient ILC1 subsets expressed ILC1 marker genes, that were not detected in ILCPs. As in WT mice, Hobit-deficient TCF-1hi ILCs had a CD200r+ T-bet+ Rorγt− HobitTom+ phenotype and expressed IFN-γ upon stimulation (data not shown). These data demonstrate that Hobit does not contribute to the commitment of ILCP to the ILC1 lineage but specifically acts in lineage committed ILC1 to regulate their effector differentiation.
Fig. 6. Hobit is continuously required to regulate the differentiation of TCF-1hi Gzmlo vs TCF-1lo Gzmhi effector ILC1s.
a-d UMAP visualization of liver ILC1 clusters as in Fig. 5b. Violin plots display ILCP score calculation of selected ILCP genes across identified clusters (a) and in a scRNA-seq dataset of indicated BM progenitors generated by Harly et al 29(c). b, d Heat maps of marker gene expression associated with ILCPs across identified (b) and published (d) clusters. e Heat map of expression of potential Hobit target genes (derived from Mackay et al. 16 ChIP Seq data of T cells) across identified clusters. f Expression of Tcf7, Batf3 and Bach2 within liver ILC1 from WT and HobitKO mice. g-i Representative FACS analysis of liver ILC1 in UbiCre-ERT2 x Hobitfl/fl mice and littermate controls on d35 after Tamoxifen treatment, gated on Lin−NK1.1+ (left) and ILC1 (g). Frequency of indicated marker-positive cells within ILC1 (h) and gMFI of CD127, TCF-7 and IL-18R1 expression within marker-positive liver ILC1 (i). Data show one representative of 3 individual experiments with n=4 or 6 mice per group (g-i). Bar graphs indicate individual mice (symbols) and mean (bar), error bars display means ± SD. Statistical significance was calculated by unpaired two-tailed t-test; *p < 0.05, **p < 0.01, ***p < 0.001, ****p < 0.0001, ns – not significant.
Hobit regulates ILC1 effector states in adult life
To identify putative targets of Hobit in ILCs we matched our gene expression data with Hobit chromatin binding sites established through Hobit ChIP-Seq in T cells (MacKay et al). Hobit has been suggested to directly regulate the expression of genes associated with T cell stemness (i.e. the capacity to expand and generate downstream effector cells), including Tcf7, Bach2 and Batf3 16, 31, 32. Interestingly, we found that expression of these genes was increased in Hobit-deficient ILC1 and was downregulated along the transition of cKit+ TCF-1hi CD127hi to cKit− TCF-1int CD127int ILC1, consistent with the idea that Hobit regulates ILC1 “stemness” versus effector differentiation by modulating these genes (Fig. 6e, f).
ILCs differentiate during the first weeks of life, after which they persist largely as tissue-resident populations that can self-renew, potentially through the maturation from local progenitors 4, 5, 13, 33, 34. To test whether Hobit acted during an early developmental window, or whether continued expression of Hobit was required for the regulation of ILC1 effector states in the adult organism, we generated UbiCre-ERT2 x Hobitfl/fl mice (Fig. 6g-i). Conditional deletion of Hobit increased expression of TCF-1, IL-18R1, CD127 and the frequency of cKit+ TCF-1hi and CD127+ ILC1, while reducing the frequency of CD127− granzyme-expressing cells. Although this analysis cannot formally distinguish between the reversion of CD127− TCF-1lo Gzmhi ILC1 to CD127+ TCF-1hi Gzmlo ILC1 after conditional Hobit ablation versus the accumulation of CD127− TCF-1hi Gzmlo ILC1, caused by a blockade to differentiate into CD127− TCF-1lo Gzmhi ILC1 after Hobit ablation, these data suggest that hepatic ILC1 continuously require Hobit expression to regulate the balanced differentiation between TCF-1hi Gzmlo vs TCF-1lo Gzmhi effector ILC1s.
Hobit drives ILC1 effector differentiation across tissues
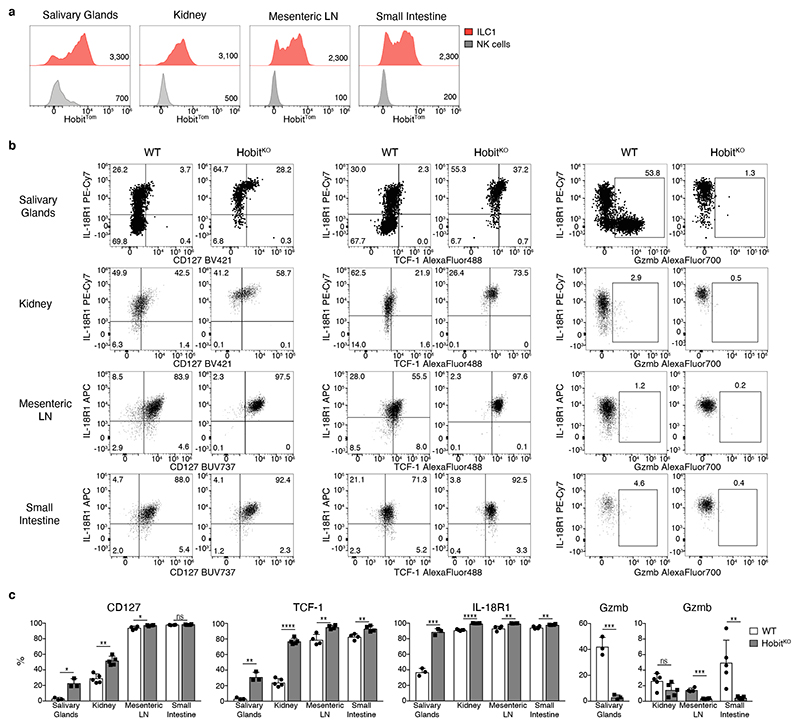
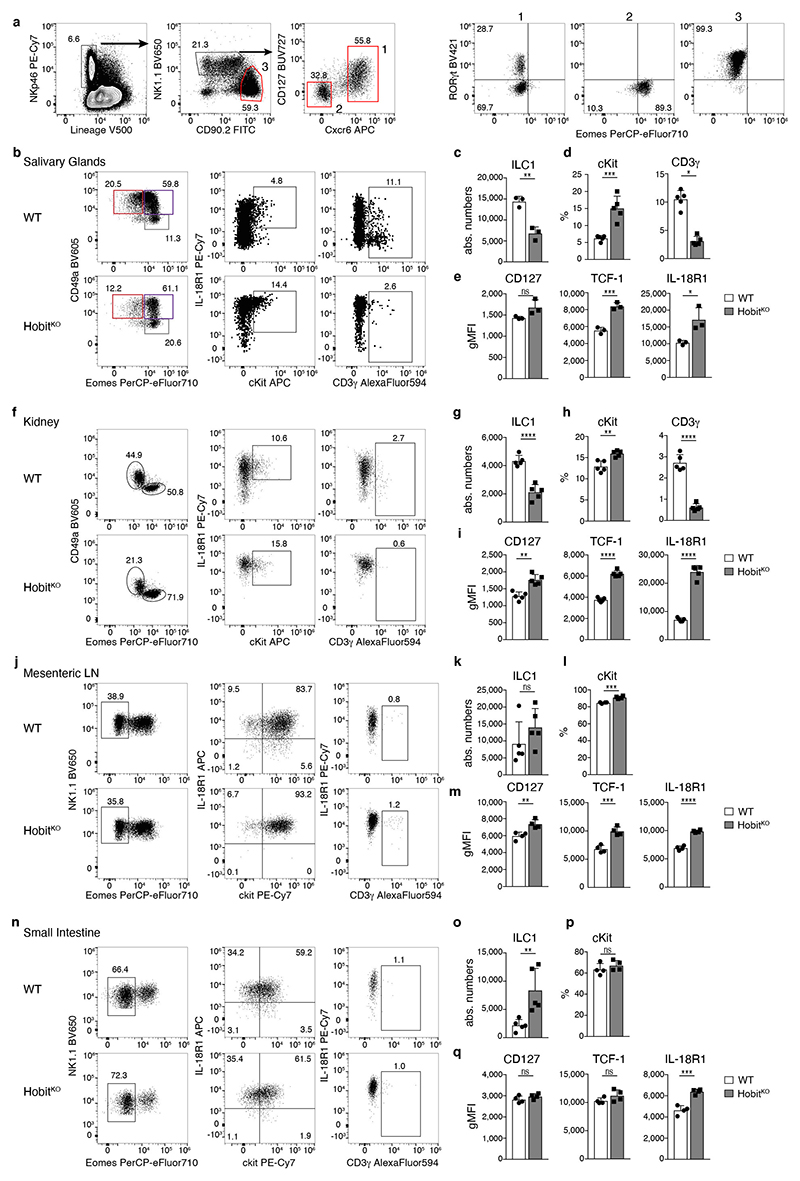
Our data revealed that Hobit drives the differentiation of TCF-1hi early ILC1s into defined stages of effector ILC1s in the liver. To test whether ILC1 in other tissues also expressed Hobit, and similarly segregated into distinct subsets along the identified differentiation trajectory, we analyzed ILC1s in salivary glands (SG), kidneys, mesenteric LNs (mLN) and small intestinal lamina propria (SI). In all of these tissues, NK1.1+ Eomes− CD49a+ ILC1s expressed Hobit (Fig. 7a). The degree of effector maturation, however, dramatically varied across organs. Reminiscent of the liver, ILC1s in the SG comprised IL-18R1+ Gzmb− as well as IL-18R1− Gzmb+ cells (Fig. 7b, c and Extended Data Fig. 6). In contrast, the majority of ILC1s in kidney, mLN and SI lacked expression of Gzmb and were characterized by a CD127+ IL-18R1+ phenotype (Fig. 7b, c and Extended Data Fig. 6). Similar to the liver, IL-18R1− Gzmb or CD3γ expressing ILC subsets were strongly reduced in all analyzed organs of Hobit-deficient mice, while TCF-1 expression and the frequency of CD127hi TCF-1hi IL-18R1hi ILC1s was increased (Fig. 7b, c and Extended Data Fig. 6). Consistent with a cell-intrinsic function of Hobit in these cells, the expression levels of CD127, IL-18R1 and TCF-1 increased in the absence of Hobit in all analyzed organs in mixed bone marrow-chimeric mice (Extended Data Fig. 7a-f). As in the liver, Hobit expression was continuously required to regulate expression of TCF-1 and granzymes (Extended Data Fig. 7g-j). Together, these data identify Hobit as a key transcriptional regulator of ILC1 differentiation across all analyzed organs.
Fig. 7. Effector differentiation of ILC1 is regulated by Hobit across tissues.
a Representative histograms displaying HobitTom signal in ILC1 and NK cells isolated from indicated organs of HobitTom/WT mice. To maintain the reporter signal, ILC1s SG and kidney were gated as Lin− NK1.1− NKp46− CD49a− DX5− cells; in the mesenteric LN and SI ILC1s were gated as Lin− NK1.1+ NKp46+ CD127+ CXCR6+ cells as shown in Extended Figure 6a. Data are representative of 2 individual experiments with n=3-4 mice per group. b, c Representative FACS analysis of indicated marker expression of Lin− NK1.1+ CD49a+ Eomes− RORγt− ILC1 from indicated organs of WT and HobitKO mice (b). Frequency of ILC1s expressing indicated marker proteins of WT and HobitKO mice (c). Data in (b) and (c) show one representative of 3 independent experiments with n=3 (salivary gland), 4 (mesenteric LN, small intestine) and 5 (kidney) mice per group. Bar graphs indicate individual mice (symbols) and mean (bar), error bars display means ± SD. Statistical significance was calculated by unpaired two-tailed t-test; *p < 0.05, **p < 0.01, ***p < 0.001, ****p < 0.0001, ns – not significant.
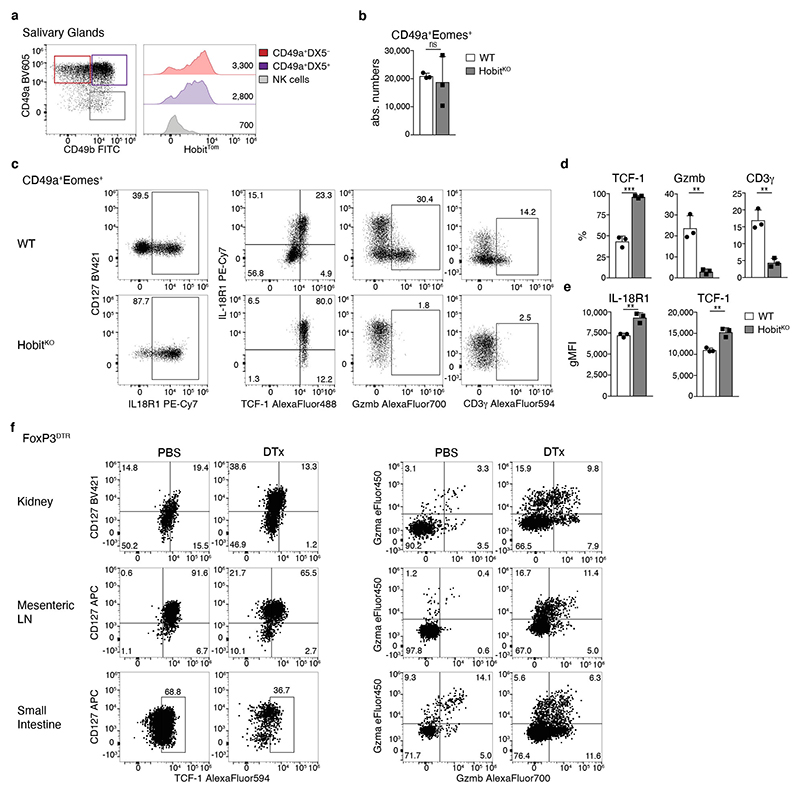
In addition to Eomes− ILC1, the SG is populated by Eomes+ CD49a+ tissue-resident cells that share similarities with NK cells and with ILC1 35. Reminiscent of Eomes− “bona-fide” ILC1s in SG and liver, Eomes+ CD49a+ SG cells expressed Hobit and could be divided into TCF-1hi IL-18R1hi and TCF-1− IL-18R1− CD3γ and/or Gzmb expressing subsets (Extended Data Fig. 8a-e). Again, Hobit was required for the differentiation of CD3γ and Gzmb expressing cells. In the absence of Hobit, differentiation of Eomes+ CD49a+ cells was stalled at the IL-18R1hi TCF-1hi stage. Although Eomes+ CD49a+ SG group1 ILCs lacked expression of CD127, as previously reported 35, 36, these data reveal intriguing parallels of the phenotype, differentiation stages and transcriptional requirements of Eomes+ and Eomes− tissue-resident group 1 ILCs, and demonstrate that Hobit is a critical determinant of effector differentiation of these group 1 ILCs as well.
ILC1 developmental potential is conserved across tissues
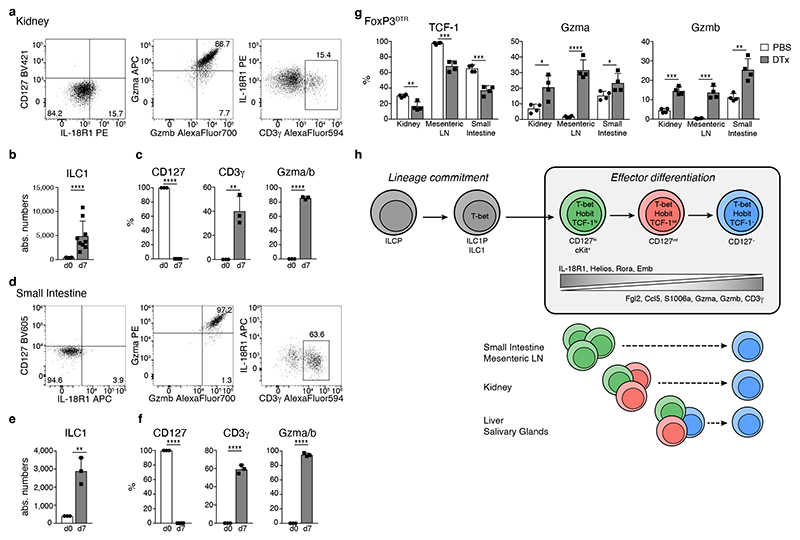
The observation that the ILC1 compartment in kidney, mLN and SI was largely devoid of IL-18R1− Gzmb+ cytotoxic-like populations (Fig. 7b, c) raised the question whether ILC1s in these organs are “halted” in a less mature differentiation state, potentially due to the paucity of local signals that would drive their differentiation into cytotoxic-like cells, or whether these ILC1s intrinsically lack such developmental potential. To distinguish between these possibilities, we sort-purified CD127+ ILC1 from kidney and SI and cultured them on OP9-DL1 feeder cells. Interestingly, CD127+ ILC1s isolated from both organs, but not ILC3, readily expanded and gave rise to CD127− ILC1s that expressed CD3γ and/or granzymes (Fig. 8a-f, Extended Data Fig. 8f and data not shown), similar to CD127+ hepatic ILC1s (Fig. 2c-e). These data suggested that these ILC1s can undergo further effector differentiation but may be “halted” in their differentiation due to the lack of activating signals or the active suppression in their respective tissue-niches. To test whether ILC1s can undergo further effector differentiation in these organs in vivo we performed depletion of regulatory T (Treg) cells, which creates an inflammatory setting to which ILC1 respond locally, as tissue-resident cells 33 Intriguingly, we found that Treg cell depletion promoted the effector differentiation of ILC1s in all analyzed tissues, as evidenced by the downregulation of TCF-1 and the concomitant increase in Gzma and Gzmb expression (Fig. 8g and Extended Data Fig. 8f). Together, these data reveal that the cell-intrinsic differentiation potential of ILC1s is conserved across tissues and suggest that signals perceived from the microenvironment regulate the Hobit-dependent effector differentiation of ILC1 in specific tissue niches.
Fig. 8. The developmental potential of ILC1s is conserved across tissues.
a-fIn vitro culture of CD127+ kidney (a-c) and small intestinal (d-f) ILC1 in the presence of IL-2 and OP9-DL1 feeder cells. a, d Representative FACS plots on d7. b, e Absolute numbers of cells on d0 (input=400 cells) and d7. c, f Frequency of CD127+, CD3γ+ and Gzma+Gzmb+ cells. Data representative of 3 independent experiments with n=3 replicates per experiment. g FACS analysis of ILC1s from indicated organs of Treg depleted or mock treated FoxP3DTR mice on d8 of DT treatment (DTx). Histograms indicate the frequency of ILC1s expressing indicated proteins is depicted. Data are representative of 3 independent experiments with n=4 mice per group. h Schematic summarizing sequential mechanisms of ILC1 lineage commitment and effector differentiation downstream of TCF-1hi “early” ILC1s, which is transcriptionally regulated by Hobit. ILC1s across tissues have a uniform capacity to differentiate towards TCF-1lo Gzmhi cells. Bar graphs indicate replicates (b, c, e, f) or individual mice (g) (symbols) and mean (bar), error bars display means ± SD. Statistical significance was calculated by unpaired two-tailed t-test; *p < 0.05, **p < 0.01, ***p < 0.001, ****p < 0.0001.
Discussion
These findings reveal a uniform pathway of ILC1 effector differentiation conserved across tissues, and sequential mechanisms of ILC1 lineage polarization and effector differentiation. Our analyses define early TCF-1hi committed ILC1 that undergo Hobit-dependent maturation into distinct populations that segregate by proliferative potential and expression of effector molecules. These remarkable parallels to the population structure of antigen-experienced T cells and cNK cells suggest that key principles in the regulation of polarized lymphocyte populations are conserved among innate and adaptive lymphocytes 37, 38, 39.
Our work provides a conceptual complement to the recent identification of tissue-associated multipotent ILC progenitors that can differentiate in situ into ILC1, ILC2 and ILC3 4, 5, 7, 40. While these studies highlight the developmental steps from progenitors towards lineage-committed cells, our work identified a cascade of differentiation events occurring in committed ILC1. The analysis of Hobit fate-mapper mice revealed that Hobit-expressing ILC1 do not significantly contribute to the cNK, ILC2 and ILC3 lineages, at least during development and homeostasis, and underlines that Hobit activity is upregulated post commitment to the ILC1 lineage. Conversely, ILC1 in Hobit deficient mice retained an ILC1 phenotype, suggesting that Hobit acts as a transcriptional regulator of effector differentiation after lineage commitment.
Our analyses establish that heterogeneous subsets of ILC1s that have previously been characterized as organ-specific “helper-like” versus “cytotoxic-like“ ILC1s are distinct developmental stages connected along a Hobit-dependent differentiation path. Importantly, TCF-1hi early ILC1 already have the ability to produce IFN-γ and other pro-inflammatory mediators, suggesting that they represent a mature ILC1 subset that can exert effector functions. Downstream differentiation stages appear to retain the potential to release pro-inflammatory cytokines, but gradually acquire other effector functions such as the production of Fgl2, granzymes and the ability to efficiently kill target cells.
The identification of Hobit dependent differentiation stages may also explain why ILC1s are not generally reduced in Hobit-deficient mice including the liver compartment, where lack of Hobit leads to a dramatic reduction in ILC1s. We observed that remaining ILC1 identified as cKit+ TCF-1hi ILC1s in Hobit-deficient mice that were present in similar numbers between WT versus Hobit KO mice. The finding that this “early” ILC1 phenotype dominates in the intestine, kidney and mLN of SPF mice may explain the relatively minor reduction of ILC1s in these compartments.
Although ILC1s from different tissues preserved the capacity to generate cytotoxic-like cells, our work suggests that the actual differentiation of these effector ILC1s depends on signals from within their tissue environment. Potentially, Hobit has a permissive role and requires independent tissue-specific signals to cooperatively regulate ILC1 effector differentiation. In this regard, it will be interesting to examine whether distinct ILC1 differentiation stages require access to microanatomical niches and interacting cell types that are only present in certain tissues. It will also be important to determine whether differentiation of “cytotoxic-like” ILC1s from TCF-1hi ILC1s is actively restrained in some tissues, as suggested by our analyses of Treg cell depleted mice. e.g. to prevent pathology.
Of note, the acquisition of cytotoxic function has recently been documented in in vitro cultures of human tonsillar CD94+ ILC1 in response to IL-12 21. Given that these cells do not express Hobit, and that this differentiation process included the upregulation of Eomes, it is unclear whether it represents the human correlate of the differentiation of committed Eomes- ILC1 that we have investigated here. Hobit is, however, broadly expressed in human intestinal intraepithelial ILC1s, in NK cells as well as subsets of activated effector T cells 41, 42. Therefore, beyond its reported function in tissue-residency, Hobit may be a critical differentiation factor of these type-1 polarized lymphocytes, consistent with its role in ILC1s that we identified here. It will be important to investigate the transcriptional programs regulating expansion potential versus effector differentiation in human Hobit+ versus Hobit- ILCs and NK cells.
Hobit binds directly into the Tcf7 locus and suppresses expression of TCF-1 in NKT cells 16 and in tissue-resident memory T cells 43. Underlining these findings, we observed that Hobit repressed TCF-1 expression in ILC1. TCF-1 has critical functions in ILCPs, in immature cNKs cells and in stem-like memory T cells to maintain their increased potential for expansion and self-renewal, and to inhibit the expression of cytotoxic molecules 29, 38, 39, 44, 45, 46. Therefore, Hobit-driven repression of TCF-1 may extinguish a program of ILC "stemness" and permit terminal differentiation of ILC1s. The repressive activity of Hobit on other potential regulators of stemness in effector lymphocytes, such as Bach2 and Batf3, may contribute to this terminal regulation of ILC1 differentiation. The instructive signals driving the differentiation of committed ILC1 in vivo remain unclear. Our in vitro cultures suggest that IL-2 and IL-15 can contribute to the transition of helper-like ILC1 into cytotoxic-like ILC1. IL-2 may be more relevant for ILC1 differentiation under inflammatory conditions as occurs upon depletion of regulatory T cells, while IL-15 may dominate under homeostatic conditions, as supported by its essential contribution to ILC1 development11, 26. In preliminary analyses, the phenotype of liver ILC1s was not altered in STAT4-KO and IL-18R1-KO mice, or when we neutralized IL-15 (data not shown). Similarly, hepatic ILC1s had no detectable change in phenotype when lacking Tgfbr2 35. These observations suggest that these cytokines do not directly maintain or induce Hobit and highlight that additional work will be required to address the instructive signals of Hobit expression and the differentiation of lineage-committed ILC1.
The cKit+ CD127hi early differentiation stage of ILC1, that we identified across different organs, had a very striking potential to expand in response to homeostatic cytokines and to generate downstream effector ILC1. These findings suggest that, reminiscent of T cells, ILC1 undergo a differentiation process that compartmentalizes expansion potential and specialized effector functions in order to regulate, at the population level, the homeostatic maintenance as well as the generation of a spectrum of effector states. Considering the central function of TCF-1hi “stem-like” cells in T cell responses to chronic infection, tumors and checkpoint blockade therapy 39, 44, 45, 46, the identification of mechanisms driving ILC1 effector generation from TCF-1hi early ILC1 provides an important framework for future studies of ILC1 mediated tissue immunity, inflammatory diseases, and their potential therapeutic targeting.
Materials and Methods
Animals
B6 mice (C57BL/6), CD45.1 (B6.SJL-Ptprc a Pepc b/BoyJ), Rag1 -/- (B6.129S7-Rag1 tm1Mom/J), Rag2 -/- Il2rγ -/- (C;129S4-Rag2 tm1.1Flv Il2rg tm1.1Flv/J ; herein referred to as Rag2-/-γc-/-), RORc-Cre (B6.FVB-Tg(Rorc-cre)1Litt/J), UbiCre-ERT2 (B6.129-Gt(ROSA)26Sor tm1(cre/ERT2)Tyj/J) and ROSA26-flox-stop-flox-EYFP (B6.129X1-Gt(ROSA)26Sor tm1(EYFP)Cos/J) were originally purchased from The Jackson Laboratory. C57Bl/6NCr were purchased from Charles River. HobitTom/KO mice were generated by crossing B6-Tg(Zfp683-tdTomato-P2A-cre-P2A-DTR), here referred to as HobitTom/WT mice 17, with HobitKO/KO mice 16. NKp46iCre (B6(Cg)-Ncr1 tm1.1(icre)Viv/Orl) mice 47 were generously provided by Eric Vivier and crossed to Eomesfl/fl 48 mice. FoxP3DTR (B6.129(Cg)-Foxp3 tm3(DTR/GFP)Ayr/J) mice were a gift from Alexander Rudensky 49. All mice were bred and housed under specific pathogen-free or germ-free conditions at the animal facility of the University Würzburg (Institute for Immunology and Virology, and Institute of Systems Immunology) and in the animal facility of the Netherlands cancer institute (NKI) in Amsterdam, and were used in accordance with institutional guidelines and as approved by the Lower Franconia government and the government of the Netherlands. Mice were kept in 12h-light-dark cycle, with ambient temperature range within 20-24°C; humidity ranged from 30-70%. For all experiments male and female mice at 8-16 weeks of age were used.
Generation of HobitKO mice
To generate HobitKO mice, Zfp683tm1a(KOMP)Wtsi ES cell clones were obtained from the KOMP repository (www.komp.org) and generated by the Wellcome Trust Sanger Institute (WTSI), see also Extended Data Fig. 3a 50. Mice were generated by Laser assisted (XY-Clone Hamilton Thorne) injection of JM8A3.N cells into 8-cell stage C57Bl/6NCrl embryos. All injections were done with Narishige manipulators in the Transgenic Core Facility (TCF) of the MPI-CBG, Dresden. Chimaeras were crossed to C57Bl/6NCrl mice and their offspring was screened by PCR for germline transmission. Hobitfl/fl mice were generated by breeding HobitKO mice with mice that express the Flp recombinase in the germ line 51. Hobitfl/fl mice were crossed to UbiCre-ERT2 mice 52.
Generation of mixed bone marrow chimeric mice
Rag2-/- γc-/- mice were irradiated (3 Gy) and rested overnight. The next morning, bone marrow from femurs and tibias of CD45.2+ HobitKO and CD45.1+ WT mice was prepared and 5 × 10⁶ cells of each were i.v. injected into recipients.
Inducible deletion of Hobit by tamoxifen
For inducible deletion of Hobit, mice were treated intraperitoneally with 80 mg/kg bodyweight Tamoxifen (Sigma Aldrich) in corn oil (Sigma Aldrich) on d0 and d3. Mice were analyzed after 35-40 days of treatment.
In vivo Treg cell depletion
To deplete Treg cells, FoxP3DTR mice were treated intraperitoneally with 200 μl 50 ng/g diphtheria toxin (DTx, Merck Millipore) in PBS or PBS every other day. Mice were analyzed on d8 after first treatment.
Tissue lymphocyte isolation
Mice were sacrificed and perfused with PBS. For selected analyses, mice were intraperitoneally injected with 50 μg ARTC2.2 blocking nanobody s+16a (Biolegend) 30 min before sacrifice to exclude the possibility that ILC viability was compromised through ARTC2-mediated NAD+-induced cell death, but no difference to control groups was observed (data not shown). Liver, salivary glands and kidneys were harvested, cut into small pieces and digested in DMEM (Gibco) with 10 mM Hepes (pH 7.2-7.5, Gibco), 20 μg/ml DNase I (Sigma Aldrich) and 1 mg/ml Collagenase D (Roche) at 37°C and 100 rpm for 40 min. Suspensions were passed through 100 μm filters and lymphocytes enriched by 40%/80% percoll (Sigma Aldrich) gradient (860 x g, 20 min, 21 °C, no breaks). The interface was washed with PBS (Sigma Aldrich) and used for flow cytometric analysis or sorting. Small intestine was harvested, Peyer’s patches were removed, the intestine cut open longitudinally and washed extensively with PBS to remove feces. After dissociation using HBSS (Sigma Aldrich) supplemented with 5 mM EDTA (Carl Roth) and 10 mM Hepes (pH 7.2-7.5) at 37°C, tissue were cut into small pieces and digested in HBSS with 10 mM Hepes, 20 μg/ml DNase I, 0.5 mg/ml Collagenase D and 50 U/ml Dispase (Corning) at 37°C and 100 rpm for 1h. Suspensions were passed through 100 μm filters and lymphocytes enriched by 40%/80% percoll (Sigma Aldrich) gradient (860 x g, 20 min, 21°C, no breaks). The interface was washed with PBS (Sigma Aldrich) and used for flow cytometric analysis or sorting. Mesenteric lymph node cell suspensions were filtered through 70 μm filters and used for flow cytometric analysis.
Flow Cytometry and Cell Sorting
Dead cells were excluded by fixable viability dye eF780 (Thermo Fisher Scientific) and non-specific binding blocked by anti-CD16/CD32 (BioXcell) blocking antibodies. Fluorochrome-conjugated monoclonal antibodies were purchased from commercial vendors (Supplementary Table 2).
For cell sorting of liver ILC1 and NK cells, single cell suspensions were stained with FITC-labeled antibodies against CD5, CD19, F4/80, TCRβ, TCRγδ, Ter119 and cells negatively enriched using anti-FITC MicroBeads (Miltenyi) according manufacturer’s recommendations. Cells were stained for CD45, NK1.1, CD3ε, CD49b, CD49a, IL-18R1, ckit and biotinylated CD127 subsequently with Streptavidin. For cell sorting of small intestinal lamina propria ILC1, single cell suspensions were stained with CD45, NK1.1, NKp46, CD90.2, CD127, CXCR6 and biotinylated CD3ε, CD5, CD19, F4/80, TCRβ, TCRγδ and Ter119 and subsequently with Streptavidin. When cells were sorted for scRNA-seq, Hashtags and CITE-Seq antibodies were included during this surface staining step. ILC1 were gated as live CD45+Lin− CD3ε−NK1.1+CD49b−CD49a+ cells and subsets sorted based on CD127 and cKit. Sorting strategy for scRNA-seq is depicted in Extended Data Fig. 1. Cell sorting was performed on a BD FACSAria III.
For flow cytometry analysis, cells were stained with antibodies against CD11b, CD45, CD45.1, CD45.2, CD49a, CD49b, CD90.2, biotinylated and directly-conjugated CD127, CD160, CD200r, cKit, Cxcr6, Embigin, IL-18R1, NK1.1, NKp46, Sca-1 and TRAIL. Lineage positive cells were stained with a cocktail of biotin-labeled antibodies against CD3ε, CD5, CD19, F4/80, FcεR1α, Ly6G, TCRβ, TCRγδ and Ter119, followed by staining with Streptavidin. Intracellular staining of CD3γ, CD127, Eomes, Gata3, GM-CSF, Gzma, Gzmb, Gzmc, IFN-γ, TCF-1, TNF, Rorγt and T-bet was performed using FoxP3/Transcription Factor Staining Buffer set (Thermo Fisher Scientific). In some experiments, including all cultures of ILCs, CD127 BV421 or CD127 APC were used for intracellular staining of CD127, in order to detect CD127 when downregulated from the surface. For intracellular cytokine staining, cells were stimulated with 10 ng/ml IL-12 (Peprotech), 10 ng/ml IL-18 (RnD) and 1 μg/ml Brefeldin A (Sigma Aldrich) or with 50 ng/ml PMA (Sigma Aldrich), 500 ng/ml ionomycin (Sigma Aldrich) and 1 μg/ml Brefeldin A (Sigma Aldrich) in RPMI 1640 + GlutaMAX medium (Gibco) with 10% FCS (Sigma Aldrich) and 1x penicillin-streptomycin (Gibco) for 4h. Cells were acquired on a BD Celesta, BD FASSymphony cytometer using FACSDiva v9, or Cytek Aurora cytometer using SpectroFlo v2.2.0.2. Data were analyzed with FlowJo v0 and v10 software (BD). Unless otherwise indicated, ILC1 were gated as live CD45+Lin−NK1.1+Eomes−CD49a+ cells or CD45+Lin−NK1.1+CD49b−CD49a+ cells. NK cells were gated as live CD45+Lin−NK1.1+Eomes+ cells or CD45+Lin−NK1.1+CD49b+ (CD49a−) cells. Small intestinal ILC1 were generally gated as live CD45+Lin−NKp46+NK1.1+Eomes−RORγt− cells or, to preserve the Hobit reporter signal, as live CD45+Lin−NKp46+NK1.1+CD90intCD127+CXCR6+ cells (Extended Data Fig. 6a).
In vivo ILC1 co-transfer
CD127+ and CD127− ILC1 were FACS-sorted from CD45.1 and CD45.1/CD45.2 congenic B6 mice and 5.000 cells of each co-transferred intravenously into sub-lethally irradiated (3 Gy) CD45.2 Rag2-/- γc-/- recipients. ILC1s were analyzed on d15 post transfer.
In vitro killing assay
FACS-sorted liver ILC1 subsets and NK cells were cultured at indicated ratios with 1,000 YAC1 cells. After 4h, absolute numbers of viable YAC1 cells were determined by FACS analysis and % specific killing was calculated compared to YAC1 cells cultured in the abscence of ILCs or NK cells.
Culture of ILC1 and OP9 feeder cells
OP9, OP9-DL1 and OP9-DL4 feeder cells were grown at 5% CO2 in 1x MEM alpha (Gibco) supplemented with 20% FCS and 1x penicillin-streptomycin. At 80-90% confluence cells were treated with 10 μg/ml mitomycin C (Sigma Aldrich) for 1.5h. Cells were washed three times with PBS and detached with trypsin–EDTA (Gibco) at 37 °C for 5 min. 40.000 cells were seeded per well of a 96-well plate. 400 FACS sorted ILC1 were cultured on feeder cells cells at 5% CO2 in RPMI 1640+ GlutaMAX medium supplemented with 10% FCS, 1x penicillin-streptomycin, 50 μM β-Mercaptoethanol (Gibco) and 25 ng/ml murine IL-2 (Peprotech) or 25 ng/ml human IL-15 (Peprotech). After 7 days, cells were analyzed by flow cytometry. For analysis of cell proliferation, 2000 FACS sorted cells were labelled with Cell-Trace Violet (c34557; Invitrogen). Cells were stained in a 1.25 nM working solution in 1x PBS + 0.1 % (v/v) FCS and incubated in the dark for 20 min. Cells were washed three times with PBS and cultured on feeder cells at 5% CO2 in RPMI 1640+ GlutaMAX medium supplemented with 10% FCS, 1x penicillin-streptomycin, 50 μM β-Mercaptoethanol (Gibco) and 25 ng/ml murine IL-2 (Peprotech). After 4-8 days, cells were analyzed by flow cytometry.
scRNA-seq, Cell Hashing and CITE-seq
ILC1 and NK cells were sorted (as detailed above and in Fig. S1) from HobitTom/WT and HobitTom/KO mice for scRNA-seq as four individual, hashtagged populations before pooling into one reaction (TotalSeq™-A0301 and -A0302, Biolegend). Hobit-deficient and sufficient ILC1s were pooled at similar ratios and enriched over NK cells to improve resolution of ICL1 subsets. Before sorting, cells were labelled with oligo-tagged antibodies targeting selected surface markers (CD11b, CD27, CD69, CD90.2, CD127, CD200R, NKp46; TotalSeq™-A, Biolegend) for cellular indexing of transcriptomes and epitopes by sequencing (CITE-Seq, 53. Immediately after sorting, the cells were encapsulated into droplets using 10x Genomics GemCode Technology (Single Cell 3’ Reagent kit v3) and processed following manufacturer’s specifications for scRNA-seq library preparation. Three distinct libraries were generated: a CITE-Seq library, a Hashtag library, and the cDNA library fraction (corresponding to the cell transcriptome). Libraries were quantified by Qubit™ 3.0 Fluometer (Thermo Fisher), quality was checked using 2100 Bioanalyzer with High Sensitivity DNA kit (Agilent) and sequencing was performed using a NovaSeq 6000 platform (Illumina) in 50bp paired-end mode to reach approximately 150,000 reads per single cell. For adequate read coverage, we sequenced the CITE-Seq library at 10%, the Hashtag library at 5%, and the cDNA library fraction at 85% of a lane according to the manufacturer’s recommendations (Biolegend). Data for the cDNA library fraction were demultiplexed using Cell Ranger software v3.0.2 (10x Genomics) and aligned to mouse mm10 reference genome.
Sample demultiplexing and doublet identification
To demultiplex hashing tags for each cell HTODemux function in Seurat package was used as described 54. Cross-sample doublet cell detection was performed based on hashtag signal. Only cells that were classified as ‘singlet’ were retained and used for downstream analysis.
Clustering with Seurat
The datasets were analyzed using Seurat v3 standard workflow 55. After log transformation with the command LogNormalize and scaling with ScaleData, basic QC has been performed. Viable cells have been selected by filtering for cells with UMI count superior at 1000 and a percentage of UMI mapped to mitonchondrial genes inferior to 8. Cells were then assigned to appropriate samples by demultiplexing the Hashtags antibodies. Variable genes were identified by the function VariableFeatures with a n valued of 2000. Dimensions of the data were reduced first using a principal component analysis (PCA) on variable genes after removing genes that were identified as potential digestion-related stress signature, and then a uniform manifold approximation and projection (UMAP) on the 15 first PC dimensions. Cells were also assigned to clusters with the functions FindNeighbors on the same 15 PC dimensions and then FindClusters with a resolution of 0.7. Cluster specific gene signatures have been analyzed with the function FindAllMarkers from Seurat with arguments: only.pos = TRUE, min.pct = 0.25, logfc.threshold = 0.25. These markers were sorted by logFc and clusters to identify the top 30 cluster specific genes. Exhaustive list of marker defining cluster of interest have been generated with the Findmarkers function, with arguments: only.pos = TRUE, ident.1 = cluster of interest, ident.2 =NULL, logfc.threshold = 0.25, test.use = “wilcox”, min.pct = 0.1. Complete heatmap signature of ILC1 and NK has been generating by merging the outcome of Findmarkers function from the 3 different clusters and visualized with the DoHeatmap command from Seurat. In addition, ILC1 subsets were averaged with the Seurat function AverageExpression, and averaged object was plot as heatmap for described Hobit target genes.
Score calculation with Seurat
Scores were calculated for the current or for published dataset using the Seurat function AddModuleScore with default settings. An unbiased ILCP signature was derived by analysis of the Harly et al. dataset 29 following Seurat clustering analysis workflow and using the command FindAllMarkers on the dataset with default settings. Filtering the markers for adjusted p.value < 0.01, Log2 Fold change > 1.5 and detection of transcript in at least 30% of cells in the cluster revealed the genes: Ccl5, Lmo4, Rora, Il18r1, Id2, Tox2, Ltb, Gata3, Bcas1, Maf, Ikzf2, S100a4, Itgb3, Zbtb16, Ahcyl2, Pdcd1, Rxrg, Thy1 and Tox markers of ILCP cluster. For the curated ILCP signature we selected genes based on different datasets and prior knowledge of ILCPs: Runx3, Tox, Tox2, Tcf7, Lef1, Zbtb16, Gata3, Id2, Ikzf2, Rora, Lmo4, Rxrg, Maf, Bcl11b, Ikzf3, Batf3, Myb, Pdcd1, Kit, Il18r1 and Itgb3.
Trajectory analysis with Slingshot
Trajectories were predicted using Slingshot 1.4.0 56 package. After subsetting the ILC1 population with the subset function, trajectory has been inferred using the function slingshot with a threshold of 0.05, a stretch of 2 and starting cluster 0. Variable genes have been visualized along pseudotime with the function plotGenePseudotime and as heatmap with the Pheatmap 1.0.12 R package.
Clustering with RaceID3 and StemID2 analysis
The initial clustering was performed using VarID 57. The following genes were removed and correlating gene groups in the filtering step (CGenes parameter): mitochondrial genes (mt*), ribosomal genes (Rpl*, Rps*), and predicted genes with Gm-identifiers (Gm*). Only cells with at least 1,000 transcripts were retained. VarID was run with no_cores=1, alpha=1 and default parameters otherwise. Prior to filtering and normalization, cells expressing > 2% of Kcnq1ot1 transcripts, identified as a marker of low-quality cells 27, were removed from the analysis. Differential gene expression analysis identified clusters with high expression of stress-response-related genes such as: heat-shock proteins (Hspa1a, Hspa1b) immediate early genes (IEGs) like Jun and Fos, Fosb (foldchange values > 2). These clusters were removed from further analysis. Overall, 668 ILC1 WT (Cxcr6+) cells passed the quality control thresholds with a median of 6, 578 transcripts and 2,245 different genes per cell. These cells were further analyzed using RaceID3 58. RaceID3 was run with the following parameters: mintotal = 1000, cln = 3, and default parameters otherwise. CGenes parameter was initialized for the same genes as described above for VarID.
For derivation of differentiation trajectories the StemID2 algorithm was used 27, 58. StemID2 was run on the clusters obtained from RaceID3 with the following parameters: cthr=5, pthr=0.05, nmode=TRUE, um=TRUE. Self-organizing maps (SOMs) were used to infer models of pseudo-temporal expression profiles using the following parameters: nb = 200, alpha = 0.8, corthr = 0.85, minsom = 3.
Statistical Analysis
All experiments were performed using randomly assigned mice. No statistical methods were used to pre-determine sample sizes. Sample sizes were chosen based on our previous experiences with similar analyses. Data distribution was assumed to be normal but this was not formally tested. Statistical significance was calculated by unpaired two-tailed t-test; *p < 0.05, **p < 0.01, ***p < 0.001, ****p < 0.0001, ns – not significant. All statistical analysis were performed with Prism 7 (GraphPad Software). Bar graphs indicate individual mice (symbols) and mean (bar), error bars display means ± SD.
Extended Data
Extended Data Fig. 1. Characterization of hepatic group 1 ILCs and gating strategy.
a Representative FACS plots display Lin−NK1.1+ cells of WT and HobitTom/WT mice. Bar graphs indicate absolute numbers of liver ILC1. Data are pooled from 2 independent experiments with n=2 and 3 mice per group. b Full sorting strategy for liver ILC1 and NK cells from negatively enriched liver lymphocytes of HobitTom/WT mice. c Heat map overview of significantly differentially expressed genes of ILC1 and NK cell clusters from Fig. 1c using Seurat. d, e Gating strategy to identify Lin− NK1.1+ Eomes− CD49a+ liver ILC1 and histograms showing Gata3, RORγt (d) and CD49b (e) protein expression within liver ILC1. Mesenteric lymph node are gated on Lin− CD127+ cells to display Gata3 and RORyt expression. Data are representative of 2 individual experiments with n=3 mice. Bar graphs indicate individual mice (symbols) and mean (bar), error bars display means ± SD. Statistical significance was calculated by unpaired two-tailed t-test; ns – not significant.
Extended Data Fig. 2. CD127− cytotoxic-like cells are bona-fide ILC1s.
a Dot plot representation of selected ILC1 and NK cell marker gene expression associated with the clusters identified in Fig. 1c. Color indicates z-score of mean expression across clusters and dot size represents fraction of cells in the cluster expressing the respective gene. b, c, f Frequency of liver ILC1s expressing indicated proteins in NKp46Cre versus NKp46Cre Eomesfl/fl mice (b), WT versus Rag1-/- mice (c) and SPF versus germ free mice (f). Data are representative of 2 independent experiments with n=2 and 3 mice per group (b, c, f). d, e Representative FACS analysis of liver ILC1 of RORc-eYFP fate mapper (FM) mice. (d) FACS analysis and bar graph shows frequency of RORc fate mappositive cells within CD127+ and CD127− liver ILC1 and NK cells. Data are representative of 2 independent experiments with n=3 mice per group. (e) FACS plots show marker protein expression of RORc fate mapper-positive (top) and negative (bottom) liver ILC1. Bar graphs show frequency of Gzmb-positive cells within FM-positive and FM-negative ILC1. Data are pooled from 2 independent experiments with n=2 mice per group. Bar graphs indicate individual mice (symbols) and mean (bar), error bars display means ± SD. Statistical significance was calculated by unpaired two-tailed t-test; *p < 0.05, **p < 0.01, ***p < 0.001, ****p < 0.0001, ns – not significant.
Extended Data Fig. 3. CD127+ ILC1s give rise to CD127− cytotoxic-like ILC1s in vitro and in vivo.
a, b Sorting strategy for CD127+ and CD127− liver ILC1 and NK cells from WT mice, gated on live CD45+ cells. b Sorting purity. c-f, h, i In vitro cultures of indicated liver ILC1 subsets with IL-2 (c, d, f, h, i) or IL-15 (e) and OP9-DL1 cells (c, e, h, i) or the indicated stromal cell line (d) for 7 days. Representative FACS analysis showing phenotype of NK1.1+ cells. Red quadrants on FACS plots highlight phenotypic differences of CD127+ ILC1 cultured in the presence of IL-2 versus IL-15. d Frequency of Gzma+Gzmb+ cells on day 7. e Absolute numbers on d7. Dashed line indicates number of cells on d0 (input=400 cells). f In vitro proliferation of ILC1 subsets assessed by cell tracer violet dilution analyzed on the indicated days. Data are representative of 2 independent experiments with n=4 and 5 (d), n=2 (e), n=4 (f) replicates per experiment. g In vivo co-transfer of congenically marked CD127+ and CD127− liver ILC1 into sublethally irradiated Rag2-/-γc-/- mice. Representative FACS analysis of liver ILC1 derived from indicated transferred ILC1 subsets on d15. i Isotype control stainings of ILC1 cultured in vitro as in h. Bar graphs indicate replicates (symbols) and mean (bar), error bars display means ± SD.
Extended Data Fig. 4. scRNA-seq analysis of hepatic ILC1 from WT and HobitKO mice.
a Schematic representation of the Hobit locus of HobitKO mice. b Absolute numbers of liver NK cells of WT and HobitKO mice. c Representative FACS analysis displaying Lin−NK1.1+ hepatic ILC1 and NK cells in HobitTom/WT and HobitTom/KO mice. Bar graphs indicate absolute numbers of liver ILC1. Data in (b) and (c) are pooled from 2 independent experiments with n=3 (b) and n=2 and 3 (c) mice per group. d Representative FACS analysis of liver ILC1 of HobitKO x RORc-eYFP fate mapper (FM) mice. Bar graph shows frequency of RORc fate map-positive cells within CD127+ and CD127− liver ILC1. Data are representative of 2 independent experiments with n=2-3 mice per group. e-g scRNA-seq of hash-tagged liver ILC1 sorted from HobitTom/WT and HobitTom/KO mice. e General QC, low quality cells (feature counts > 1000 and percentage of genes mapped to mitochondrial genome < 8) and cell doublets filtering and demultiplexing of Hashtag (HT) antibodies allows to separate HobitKO/Tom (KO) and HobitTom/WT (WT). Single cell transcriptome visualization using a UMAP color-coded by clusters and the sample WT or KO as indicated by the binary detection of the HT Abs. f Volcano plot displaying significantly differentially expressed genes between WT and HobitKO ILC1, using Wilcoxon test. Thresholds are displayed at Log2 FC equal 0.5 and Adjusted P value of 0.05. Genes on the right are overexpressed in KO, genes on the left are overexpressed in WT. g Heat map of marker gene expression differentially expressed across liver ILC1s. Cluster number refers to panel (e). h, i Pseudo-temporal ordering of ILC1 single cell transcriptomes with Slingshot. Expression of candidate genes across pseudotime within hash-tagged liver ILC1s sorted from HobitTom/WT and HobitTom/KO mice. Color barcode in (h) indicates cluster identity (as identified in e). Heatmap of expression of selected genes in ILC1 populations along pseudotime (i). Bar graphs indicate individual mice (symbols) and mean (bar), error bars display means ± SD. Statistical significance was calculated by unpaired two-tailed t-test; **p < 0.01, ns – not significant.
Extended Data Fig. 5. Hobit drives the development and effector maturation of hepatic ILC1 and is expressed in committed ILC1.
a-c Representative FACS analysis of liver ILC1 in mixed bone marrow chimeric mice containing a congenically marked WT and HobitKO compartment (a). Frequency of liver ILC1 expressing indicated marker (b) and gMFI of CD127, TCF-1 and IL-18R1 expression within the respective marker-positive cells (c). Data are representative of 3 individual experiments with n=4 mice per group (ac). d-g Analysis of an unbiased ILCP core signature derived from a scRNA-seq dataset of M progenitors generated by Harly et al 29. Violin plots display ILCP score calculation and heat maps display individual gene expression across identified clusters (d, f) and in the dataset generated by Harly et al 29 (e, g). Bar graphs indicate individual mice (symbols) and mean (bar), error bars display means ± SD. Statistical significance was calculated by unpaired two-tailed t-test; **p < 0.01, ***p < 0.001, ****p < 0.0001, ns – not significant.
Extended Data Fig. 6. Effector differentiation of ILC1 is regulated by Hobit across tissues.
a Gating strategy identifying ILC1 among live CD45+ cells in the small intestine lamina propria for data depicted in Fig. 7a. To preserve the HobitTom signal, cells were gated without transcription factor staining. ILC1 (1) were enriched as Lin− NKp46+ NK1.1hiCD90int CXCR6+ CD127+ cells, NK cells (2) were gated as Lin−NKp46+ NK1.1hi CD90int CXCR6− CD127− cells, NKp46+ ILC3 were gated as Lin− NKp46+ CD90hi cells. Purity of gating strategy is displayed by analysis of RORγt and Eomes (right). b-q Analysis of ILC1 in salivary glands (b-e), kidneys (f-i), mesenteric lymph nodes (LN) (j-m) and small intestine lamina propria (n-q). b, f, j, n Representative FACS analysis of Lin−NK1.1+ cells (left row of FACS plots) and Eomes− CD49a+ ILC1s (middle and right row) of WT and HobitKO mice. b Representative FACS plot identifying ILC1 (Eomes− CD49a+), Eomes+CD49a+NK1.1+ cells (Eomes+CD49a+) and cNK cells (Eomes+CD49a−) within Lin− NK1.1+ cells (left panel). c, g, k, o Bar graphs indicate absolute numbers of ILC1. d, h, l, p Frequency of ILC1s expressing indicated marker proteins. e, i, m, q gMFI of CD127, TCF-1 and IL-18R1 expression within ILC1 that are gated as positive for the respective marker. Data are representative of 3 independent experiments with n=3 (c, e), n=4 (j, l, m, p, q) and n=5 (b, d, f-i, k, o) mice per group. Bar graphs indicate individual mice (symbols) and mean (bar), error bars display means ± SD. Statistical significance was calculated by unpaired two-tailed t-test; *p < 0.05, **p < 0.01, ***p < 0.001, ****p < 0.0001, ns - not significant.
Extended Data Fig. 7. Analysis of ILC1 in mixed bone marrow chimeric mice and upon inducible deletion of Hobit.
Representative FACS analysis of ILC1 in salivary glands (a, b, g, h), kidneys (c, d, i, j) and small intestine lamina propria (e, f) of mixed bone marrow chimeric mice (a-f) or UbiCre-ERT2 Hobitfl/fl mice and littermate controls on d35 after Tamoxifen treatment (g-j). Bar graphs indicate frequency of ILC1s expressing indicated proteins. Data are representative of 2 (e, f) or 3 (a-d, g-j) individual experiments with n=3 (f), n=4 (a-d, g-j) and n=5 (d, h, j) mice per group. Bar graphs indicate individual mice (symbols) and mean (bar), error bars display means ± SD. Statistical significance was calculated by unpaired two-tailed t-test; *p < 0.05, **p < 0.01, ***p < 0.001, ****p < 0.0001, ns - not significant.
Extended Data Fig. 8. Hobit regulates the effector differentiation of Eomes+CD49a+ group 1 ILCs, and phenotype of ILC1 in Treg-cell depleted mice.
a-e FACS analysis of Eomes+CD49a+ tissue-resident NK1.1+ cells in salivary glands of WT and HobitKO mice. a Representative FACS analysis of HobitTom expression within ILC1 (CD49b− CD49a+), Eomes+CD49a+NK1.1+ cells (identified by gating as CD49b+CD49a+, to avoid permeabilization for the analysis of the HobitTom reporter signal) and cNK cells (CD49b+CD49a−) within Lin NK1.1’ cells. b Absolute numbers of Eomes+CD49a+NK1.1+ cells. c Representative FACS analysis showing indicated marker expression. d Frequency of marker-positive cells. e gMFI of TCF-1 and IL-18R1 expression within marker-positive cells. Data are representative of 3 independent experiments with n=3 mice per group. f Representative FACS plots show expression of indicated proteins of ILC1s in kidneys, mesenteric lymph nodes and small intestine lamina propria of FoxP3DTR mice on d8 of Treg cell depletion (DTx). Data are representative of 2-3 independent experiments with n=4 mice per group. Bar graphs indicate individual mice (symbols) and mean (bar), error bars display means ± SD. Statistical significance was calculated by unpaired two-tailed t-test; **p < 0.01, ***p < 0.001, ns – not significant.
Supplementary Material
Acknowledgments
We thank C. Romagnani for critically reading the manuscript, and Silvana Klingler, Mi Lian, Sofie Riedmann, Loreto Parga-Vidal and the IZKF FACS sorting facility Würzburg for expert technical assistance. We thank Eric Vivier (Aix Marseille Univ., CNRS, INSERM, CIML, Marseille, France) and Alexander Rudensky (Howard Hughes Medical Institute, Immunology Program, and Ludwig Center, Memorial Sloan Kettering Cancer Center, New York, USA) for providing mice. We thank Ronald Naumann (MPI-CBG, Dresden) for providing Flp deleter mice and for microinjections of HobitKO ES cells. This work was supported by grants through the German Research Foundation (DFG) priority program SPP1937 – Innate lymphoid cells: (GA2129/2-2 to G.Gasteiger and GR4980/1-2 to D.G.), through the European Research Council (759176-TissueLymphoContexts to G.Gasteiger, 818846-ImmuNiche to D.G. and 819329-STEP2 to W.K.). G.Gasteiger and D.G. are supported by the Max Planck Society. P.A. acknowledges financial support from Interdisciplinary Center for Clinical Research-IZKF (project Z-6). A.-E.S. is supported by the EMBO Young Investigator program. K.v.G. was funded by a LSBR fellowship from Landsteiner Foundation of Blood Transfusion Research (1629).
Footnotes
Author Contributions
G.Gasteiger and K.v.G. conceptualized the study, provided funding and coordinated the project. G.Gasteiger, K.v.G. and C.F. wrote the manuscript with input from all authors. C.F., R.T., R.M., N.K. planned and performed experiments and analyzed the data. P.A. and A.-E.S. performed scRNA-seq. R.D.L. and G. Golda analyzed scRNA-seq experiments. M.G. and K.K. provided critical reagents. W.K. and D.G. provided intellectual input and conceptual advice.
Competing interests
The authors declare no competing interests. K.K. is an employee of Morphosys AG and former employee of the Roche Innovation Center Munich.
Data Availability
The sequencing data that were generated for this report have been deposited in Gene Expression Omnibus under the accession number GSE163452. An interactive online resource of single cell sequencing analyses is available on https://go.uniwue.de/hobit. Sequencing data for ILCP analysis was recently published by Harly et al 29.
Source data are provided with this paper in the Supplementary File.
References
- 1.Colonna M. Innate Lymphoid Cells: Diversity, Plasticity, and Unique Functions in Immunity. Immunity. 2018;48:1104–1117. doi: 10.1016/j.immuni.2018.05.013. [DOI] [PMC free article] [PubMed] [Google Scholar]
- 2.Vivier E, et al. Innate Lymphoid Cells: 10 Years On. Cell. 2018;174:1054–1066. doi: 10.1016/j.cell.2018.07.017. [DOI] [PubMed] [Google Scholar]
- 3.Riggan L, Freud AG, O’Sullivan TE. True Detective: Unraveling Group 1 Innate Lymphocyte Heterogeneity. Trends Immunol. 2019;40:909–921. doi: 10.1016/j.it.2019.08.005. [DOI] [PMC free article] [PubMed] [Google Scholar]
- 4.Zeis P, et al. In Situ Maturation and Tissue Adaptation of Type 2 Innate Lymphoid Cell Progenitors. Immunity. 2020;53:775–792.:e779. doi: 10.1016/j.immuni.2020.09.002. [DOI] [PMC free article] [PubMed] [Google Scholar]
- 5.Ghaedi M, et al. Single-cell analysis of RORa tracer mouse lung reveals ILC progenitors and effector ILC2 subsets. J Exp Med. 2020;217:1–19.:e20182293. doi: 10.1084/jem.20182293. [DOI] [PMC free article] [PubMed] [Google Scholar]
- 6.Lim AI, et al. Systemic Human ILC Precursors Provide a Substrate for Tissue ILC Differentiation. Cell. 2017;168:1086–1100.:e1010. doi: 10.1016/j.cell.2017.02.021. [DOI] [PubMed] [Google Scholar]
- 7.Lim AI, Di Santo JP. ILC-poiesis: Ensuring tissue ILC differentiation at the right place and time. European journal of immunology. 2019;49:11–18. doi: 10.1002/eji.201747294. [DOI] [PubMed] [Google Scholar]
- 8.Stokic-Trtica V, Diefenbach A, Klose CSN. NK Cell Development in Times of Innate Lymphoid Cell Diversity. Front Immunol. 2020;11:813. doi: 10.3389/fimmu.2020.00813. [DOI] [PMC free article] [PubMed] [Google Scholar]
- 9.Krabbendam L, Bernink JH, Spits H. Innate lymphoid cells: from helper to killer. Curr Opin Immunol. 2020;68:28–33. doi: 10.1016/j.coi.2020.08.007. [DOI] [PubMed] [Google Scholar]
- 10.McFarland AP, et al. Multi-tissue single-cell analysis deconstructs the complex programs of mouse natural killer and type 1 innate lymphoid cells in tissues and circulation. Immunity. 2021;54:1320–1337.:e1324. doi: 10.1016/j.immuni.2021.03.024. [DOI] [PMC free article] [PubMed] [Google Scholar]
- 11.Daussy C, et al. T-bet and Eomes instruct the development of two distinct natural killer cell lineages in the liver and in the bone marrow. J Exp Med. 2014;211:563–577. doi: 10.1084/jem.20131560. [DOI] [PMC free article] [PubMed] [Google Scholar]
- 12.Weizman OE, et al. ILC1 Confer Early Host Protection at Initial Sites of Viral Infection. Cell. 2017;171:795–808.:e712. doi: 10.1016/j.cell.2017.09.052. [DOI] [PMC free article] [PubMed] [Google Scholar]
- 13.Sojka DK, et al. Tissue-resident natural killer (NK) cells are cell lineages distinct from thymic and conventional splenic NK cells. Elife. 2014;3:e01659. doi: 10.7554/eLife.01659. [DOI] [PMC free article] [PubMed] [Google Scholar]
- 14.Takeda K, et al. TRAIL identifies immature natural killer cells in newborn mice and adult mouse liver. Blood. 2005;105:2082–2089. doi: 10.1182/blood-2004-08-3262. [DOI] [PubMed] [Google Scholar]
- 15.Peng H, et al. Liver-resident NK cells confer adaptive immunity in skin-contact inflammation. J Clin Invest. 2013;123:1444–1456. doi: 10.1172/JCI66381. [DOI] [PMC free article] [PubMed] [Google Scholar]
- 16.Mackay LK, et al. Hobit and Blimp1 instruct a universal transcriptional program of tissue residency in lymphocytes. Science. 2016;352:459–463. doi: 10.1126/science.aad2035. [DOI] [PubMed] [Google Scholar]
- 17.Behr FM, et al. Tissue-resident memory CD8(+) T cells shape local and systemic secondary T cell responses. Nat Immunol. 2020;21:1070–1081. doi: 10.1038/s41590-020-0723-4. [DOI] [PubMed] [Google Scholar]
- 18.Robinette ML, et al. Transcriptional programs define molecular characteristics of innate lymphoid cell classes and subsets. Nat Immunol. 2015;16:306–317. doi: 10.1038/ni.3094. [DOI] [PMC free article] [PubMed] [Google Scholar]
- 19.Ducimetiere L, et al. Conventional NK cells and tissue-resident ILC1s join forces to control liver metastasis. Proc Natl Acad Sci U S A. 2021;118:e2026271118. doi: 10.1073/pnas.2026271118. [DOI] [PMC free article] [PubMed] [Google Scholar]
- 20.Dadi S, et al. Cancer Immunosurveillance by Tissue-Resident Innate Lymphoid Cells and Innate-like T Cells. Cell. 2016;164:365–377. doi: 10.1016/j.cell.2016.01.002. [DOI] [PMC free article] [PubMed] [Google Scholar]
- 21.Krabbendam L, Heesters BA, Kradolfer CMA, Spits H, Bernink JH. Identification of human cytotoxic ILC3s. Eur J Immunol. 2020;51:811–823. doi: 10.1002/eji.202048696. [DOI] [PMC free article] [PubMed] [Google Scholar]
- 22.Fuchs A, et al. Intraepithelial type 1 innate lymphoid cells are a unique subset of IL-12- and IL-15-responsive IFN-γ-producing cells. Immunity. 2013;38:769–781. doi: 10.1016/j.immuni.2013.02.010. [DOI] [PMC free article] [PubMed] [Google Scholar]
- 23.Bernink JH, et al. Human type 1 innate lymphoid cells accumulate in inflamed mucosal tissues. Nat Immunol. 2013;14:221–229. doi: 10.1038/ni.2534. [DOI] [PubMed] [Google Scholar]
- 24.Vonarbourg C, et al. Regulated expression of nuclear receptor RORγt confers distinct functional fates to NK cell receptor-expressing RORγyt(+) innate lymphocytes. Immunity. 2010;33:736–751. doi: 10.1016/j.immuni.2010.10.017. [DOI] [PMC free article] [PubMed] [Google Scholar]
- 25.Walker JA, et al. Polychromic Reporter Mice Reveal Unappreciated Innate Lymphoid Cell Progenitor Heterogeneity and Elusive ILC3 Progenitors in Bone Marrow. Immunity. 2019;51:104–118.:e107. doi: 10.1016/j.immuni.2019.05.002. [DOI] [PMC free article] [PubMed] [Google Scholar]
- 26.Klose CSN, et al. Differentiation of type 1 ILCs from a common progenitor to all helper-like innate lymphoid cell lineages. Cell. 2014;157:340–356. doi: 10.1016/j.cell.2014.03.030. [DOI] [PubMed] [Google Scholar]
- 27.Grün D, et al. De Novo Prediction of Stem Cell Identity using Single-Cell Transcriptome Data. Cell Stem Cell. 2016;19:266–277. doi: 10.1016/j.stem.2016.05.010. [DOI] [PMC free article] [PubMed] [Google Scholar]
- 28.Xu W, et al. An Id2(RFP)-Reporter Mouse Redefines Innate Lymphoid Cell Precursor Potentials. Immunity. 2019;50:1054–1068.:e1053. doi: 10.1016/j.immuni.2019.02.022. [DOI] [PMC free article] [PubMed] [Google Scholar]
- 29.Harly C, et al. The transcription factor TCF-1 enforces commitment to the innate lymphoid cell lineage. Nat Immunol. 2019;20:1150–1160. doi: 10.1038/s41590-019-0445-7. [DOI] [PMC free article] [PubMed] [Google Scholar]
- 30.Bai L, et al. Liver type 1 innate lymphoid cells develop locally via an interferon-γ-dependent loop. Science (New York, N.Y.) 2021;371 doi: 10.1126/science.aba4177. [DOI] [PubMed] [Google Scholar]
- 31.Yao C, et al. BACH2 enforces the transcriptional and epigenetic programs of stem-like CD8(+) T cells. Nature immunology. 2021;22:370–380. doi: 10.1038/s41590-021-00868-7. [DOI] [PMC free article] [PubMed] [Google Scholar]
- 32.Ataide MA, et al. BATF3 programs CD8(+) T cell memory. Nat Immunol. 2020;21:1397–1407. doi: 10.1038/s41590-020-0786-2. [DOI] [PubMed] [Google Scholar]
- 33.Gasteiger G, Fan X, Dikiy S, Lee SY, Rudensky AY. Tissue residency of innate lymphoid cells in lymphoid and nonlymphoid organs. Science. 2015;350:981–985. doi: 10.1126/science.aac9593. [DOI] [PMC free article] [PubMed] [Google Scholar]
- 34.Huang Y, et al. S1P-dependent interorgan trafficking of group 2 innate lymphoid cells supports host defense. Science (New York, N.Y.) 2018;359:114–119. doi: 10.1126/science.aam5809. [DOI] [PMC free article] [PubMed] [Google Scholar]
- 35.Cortez VS, et al. Transforming Growth Factor-β Signaling Guides the Differentiation of Innate Lymphoid Cells in Salivary Glands. Immunity. 2016;44:1127–1139. doi: 10.1016/j.immuni.2016.03.007. [DOI] [PMC free article] [PubMed] [Google Scholar]
- 36.Tessmer MS, Reilly EC, Brossay L. Salivary gland NK cells are phenotypically and functionally unique. PLoS Pathog. 2011;7:e1001254. doi: 10.1371/journal.ppat.1001254. [DOI] [PMC free article] [PubMed] [Google Scholar]
- 37.Chiossone L, et al. Maturation of mouse NK cells is a 4-stage developmental program. Blood. 2009;113:5488–5496. doi: 10.1182/blood-2008-10-187179. [DOI] [PubMed] [Google Scholar]
- 38.Jeevan-Raj B, et al. The Transcription Factor Tcf1 Contributes to Normal NK Cell Development and Function by Limiting the Expression of Granzymes. Cell Rep. 2017;20:613–626. doi: 10.1016/j.celrep.2017.06.071. [DOI] [PubMed] [Google Scholar]
- 39.Escobar G, Mangani D, Anderson AC. T cell factor 1: A master regulator of the T cell response in disease. Sci Immunol. 2020;5:eabb9726. doi: 10.1126/sciimmunol.abb9726. [DOI] [PMC free article] [PubMed] [Google Scholar]
- 40.Oherle K, et al. Insulin-like Growth Factor 1 Supports a Pulmonary Niche that Promotes Type 3 Innate Lymphoid Cell Development in Newborn Lungs. Immunity. 2020;52:275–294.:e279. doi: 10.1016/j.immuni.2020.01.005. [DOI] [PMC free article] [PubMed] [Google Scholar]
- 41.Collins PL, et al. Gene Regulatory Programs Conferring Phenotypic Identities to Human NK Cells. Cell. 2019;176:348–360.:e312. doi: 10.1016/j.cell.2018.11.045. [DOI] [PMC free article] [PubMed] [Google Scholar]
- 42.Vieira Braga FA, et al. Blimp-1 homolog Hobit identifies effector-type lymphocytes in humans. Eur J Immunol. 2015;45:2945–2958. doi: 10.1002/eji.201545650. [DOI] [PubMed] [Google Scholar]
- 43.Behr FM, et al. Blimp-1 Rather Than Hobit Drives the Formation of Tissue-Resident Memory CD8(+) T Cells in the Lungs. Front Immunol. 2019;10:400. doi: 10.3389/fimmu.2019.00400. [DOI] [PMC free article] [PubMed] [Google Scholar]
- 44.Jansen CS, et al. An intra-tumoral niche maintains and differentiates stem-like CD8 T cells. Nature. 2019;576:465–470. doi: 10.1038/s41586-019-1836-5. [DOI] [PMC free article] [PubMed] [Google Scholar]
- 45.Krishna S, et al. Stem-like CD8 T cells mediate response of adoptive cell immunotherapy against human cancer. Science. 2020;370:1328–1334. doi: 10.1126/science.abb9847. [DOI] [PMC free article] [PubMed] [Google Scholar]
- 46.Siddiqui I, et al. Intratumoral Tcf1(+)PD-1(+)CD8(+) T Cells with Stem-like Properties Promote Tumor Control in Response to Vaccination and Checkpoint Blockade Immunotherapy. Immunity. 2019;50:195–211.:e110. doi: 10.1016/j.immuni.2018.12.021. [DOI] [PubMed] [Google Scholar]
- 47.Narni-Mancinelli E, et al. Fate mapping analysis of lymphoid cells expressing the NKp46 cell surface receptor. Proc Natl Acad Sci U S A. 2011;108:18324–18329. doi: 10.1073/pnas.1112064108. [DOI] [PMC free article] [PubMed] [Google Scholar]
- 48.Zhu Y, et al. T-bet and eomesodermin are required for T cell-mediated antitumor immune responses. J Immunol. 2010;185:3174–3183. doi: 10.4049/jimmunol.1000749. [DOI] [PubMed] [Google Scholar]
- 49.Kim JM, Rasmussen JP, Rudensky AY. Regulatory T cells prevent catastrophic autoimmunity throughout the lifespan of mice. Nature immunology. 2007;8:191–197. doi: 10.1038/ni1428. [DOI] [PubMed] [Google Scholar]
- 50.Skarnes WC, et al. A conditional knockout resource for the genome-wide study of mouse gene function. Nature. 2011;474:337–342. doi: 10.1038/nature10163. [DOI] [PMC free article] [PubMed] [Google Scholar]
- 51.Kranz A, et al. An improved Flp deleter mouse in C57Bl/6 based on Flpo recombinase. Genesis. 2010;48:512–520. doi: 10.1002/dvg.20641. [DOI] [PubMed] [Google Scholar]
- 52.Ventura A, et al. Restoration of p53 function leads to tumour regression in vivo. Nature. 2007;445:661–665. doi: 10.1038/nature05541. [DOI] [PubMed] [Google Scholar]
- 53.Stoeckius M, et al. Simultaneous epitope and transcriptome measurement in single cells. Nat Methods. 2017;14:865–868. doi: 10.1038/nmeth.4380. [DOI] [PMC free article] [PubMed] [Google Scholar]
- 54.Stoeckius M, et al. Cell Hashing with barcoded antibodies enables multiplexing and doublet detection for single cell genomics. Genome Biol. 2018;19:224. doi: 10.1186/s13059-018-1603-1. [DOI] [PMC free article] [PubMed] [Google Scholar]
- 55.Stuart T, et al. Comprehensive Integration of Single-Cell Data. Cell. 2019;177:1888–1902.:e1821. doi: 10.1016/j.cell.2019.05.031. [DOI] [PMC free article] [PubMed] [Google Scholar]
- 56.Street K, et al. Slingshot: cell lineage and pseudotime inference for single-cell transcriptomics. BMC Genomics. 2018;19:477. doi: 10.1186/s12864-018-4772-0. [DOI] [PMC free article] [PubMed] [Google Scholar]
- 57.Grün D. Revealing dynamics of gene expression variability in cell state space. Nat Methods. 2020;17:45–49. doi: 10.1038/s41592-019-0632-3. [DOI] [PMC free article] [PubMed] [Google Scholar]
- 58.Herman JS, Sagar, Grün D. FateID infers cell fate bias in multipotent progenitors from single-cell RNA-seq data. Nat Methods. 2018;15:379–386. doi: 10.1038/nmeth.4662. [DOI] [PubMed] [Google Scholar]
Associated Data
This section collects any data citations, data availability statements, or supplementary materials included in this article.
Supplementary Materials
Data Availability Statement
The sequencing data that were generated for this report have been deposited in Gene Expression Omnibus under the accession number GSE163452. An interactive online resource of single cell sequencing analyses is available on https://go.uniwue.de/hobit. Sequencing data for ILCP analysis was recently published by Harly et al 29.
Source data are provided with this paper in the Supplementary File.


