Abstract
While the acquisition of cellular plasticity in adult stem cells is essential for rapid regeneration after tissue injury, little is known about the underlying mechanisms governing this process. Our data reveal the coordination of airway progenitor differentiation plasticity by inflammatory signals during alveolar regeneration. Upon damage, IL-1β signalling-dependent modulation of Jag1/2 expression in ciliated cells results in the inhibition of Notch signalling in secretory cells, which drives reprogramming and acquisition of differentiation plasticity. We identify a transcription factor Fosl2/Fra2 for secretory cell fate conversion to alveolar type 2 (AT2) cells retaining the distinct genetic and epigenetic signatures of secretory lineages. We furthermore reveal that KDR/FLK-1+ human secretory cells display a conserved capacity to generate AT2 cells via Notch inhibition. Our results demonstrate the functional role of a IL-1β-Notch-Fosl2 axis for the fate decision of secretory cells during injury repair, proposing a potential therapeutic target for human lung alveolar regeneration.
Tissue homeostasis is maintained by stem and progenitor cells that acquire a remarkable potential for multi-lineage differentiation after tissue insults to allow for rapid regeneration of damaged tissue1,2. These capacities depend on the nature and/or extent of injury, the repair ability of resident stem/progenitor cells, and their local microenvironments. Dysregulation of cellular plasticity, however, leads to lineage infidelity, and is implicated in various diseases2. Thus, to understand the process of tissue repair and regeneration in homeostasis and pathology, it is important to elucidate how stem and progenitor cells sense damage signals and control transient plasticity for fate conversion.
Lung tissue is maintained by several stem and progenitor cell types that reside in anatomically distinct regions alongside the pulmonary axis3,4. In the distal lungs two main stem cell types, secretory cells and alveolar type 2 (AT2) cells, separately maintain the airway and alveolar epithelium compartments, respectively. In alveolar homeostasis and injury conditions, AT2 cells have been identified as the resident stem cells capable of self-renewal and differentiation into alveolar type 1 (AT1) cells5–7. However, when alveolar integrity is severely disrupted following lung injury, such as bleomycin or influenza infection, stem/progenitor cells localised in the distal airway can contribute to alveolar regeneration by differentiating into AT2 cells5,6,8–12. In particular, several lines of evidence reveal the capacity of Scgb1a1+ airway secretory cells, which exhibit restricted capacity to generate airway cells in homeostasis, to produce new AT2 cells following severe lung injury5,6. However, little is known about the cellular events and molecular cues which dictate how secretory cells lose their identity in response to alveolar damage and subsequently acquire AT2 cell fate. Significantly, the chronic loss of alveolar integrity is strongly associated with various human lung diseases. Thus, it is imperative to understand whether there is a functionally conserved secretory cell population that readily mediates human alveolar regeneration, and whether regulatory mechanisms are conserved between human and mouse lungs.
Here, we establish chemically defined feeder-free in vitro organoid cultures wherein secretory cells and AT2 cells are capable of expansion with a restricted differentiation capacity. This platform enables us to perform robust interrogation of the molecular and cellular behaviour of secretory and AT2 cells in vitro. By comparing the gene expression patterns in these organoids, we identify the Notch signalling pathway as a pivotal regulator for the differentiation plasticity of secretory cells into AT2 cells. We demonstrate the role of IL-1β-mediated inflammation in ciliated cells in regulating this differentiation plasticity in vivo. The AP-1 transcription factor Fosl2/Fra2 is defined as an essential transcription factor for AT2 cell conversion from secretory cells in response to Notch signalling. Further, the distinct genetic and epigenetic signatures of secretory-derived AT2 cells confer their functional difference compared to resident AT2 cells. Lastly, we demonstrate that the role of Notch signalling in the transition of secretory cells to AT2 cells is conserved in human airway organoids derived from KDR/FLK-1+ secretory cells. Our study illustrates the precise molecular and cellular coordination required for secretory cell-mediated alveolar regeneration, providing insights into both the potential regenerative roles of these cells and regulatory networks in repairing alveolar destruction in lung disease.
Results
Establishment of feeder-free organoids for distal stem cells
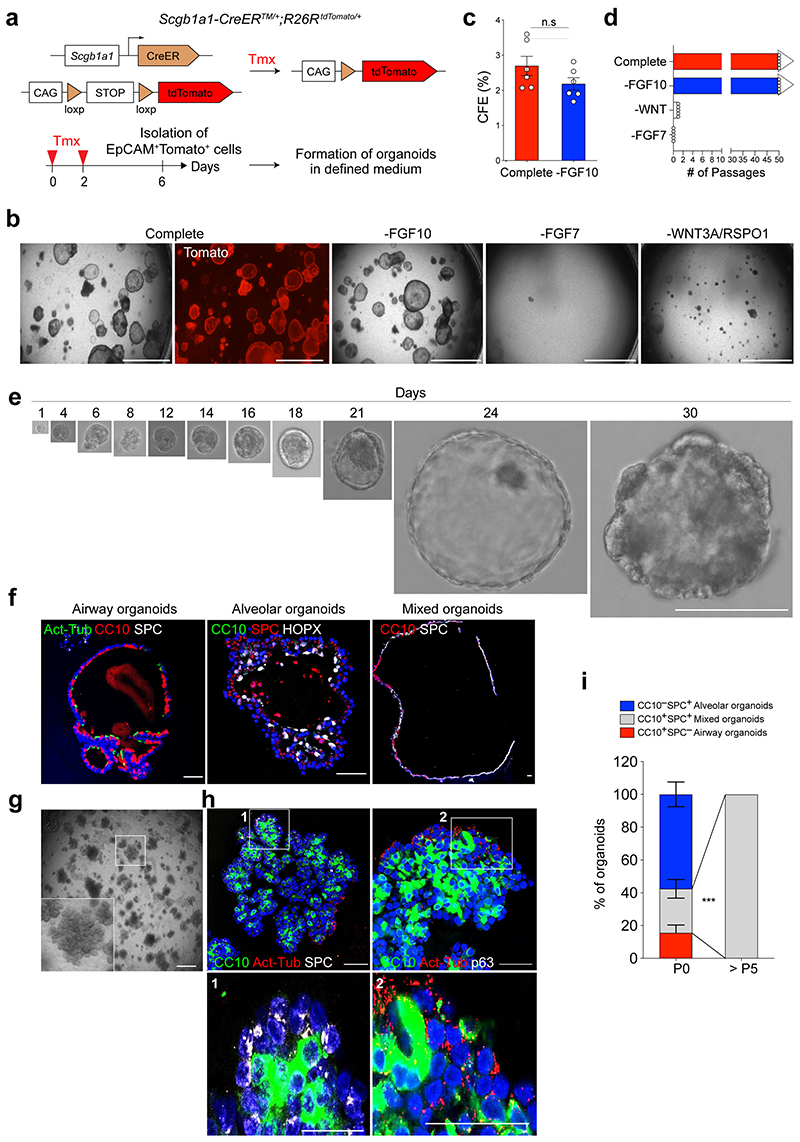
We established a feeder-free organoid culture with defined factors which support the molecular and functional identity of stem cells over long-term culture. Airway secretory cells expressing Scgb1a1 (Secretoglobin 1a1, also known as CC10 or CCSP) were isolated from the distal lung tissues of secretory cell reporter mice (Scgb1a1-CreERTM/+;R26RtdTomato/+) after tamoxifen treatment13 (Fig. 1a). Lineage-labelled secretory cells were embedded in Matrigel supplemented with WNT3A, RSPO1 (R-spondin 1), EGF, FGF7, FGF10, and NOG (Noggin), factors that are known to support the growth of human embryonic lung tip cells and progenitors derived from foregut lineages14–18 (Fig. 1b). Under this condition, secretory cells formed cyst-like organoids that were capable of long-term expansion (>2 years) (Fig. 1b-d). We also successfully generated organoids after limiting dilution with drops containing single cells (Fig. 1e), which serves as evidence of the clonogenicity and stem cell property of secretory cells maintained in this condition. FGF10 was dispensable for organoid growth (Fig. 1b-d). Without FGF7, however, secretory cells failed to form organoids (Fig. 1b,d). Furthermore, the absence of factors supporting WNT activity resulted in deterioration of organoid expansion over passages (Fig. 1b,d), indicating that both FGF7 and WNT signalling are essential for the self-renewal of distal secretory cells. The initial organoids retained heterogeneous phenotypes, including airway retaining secretory and ciliated cells, alveolar retaining AT2 and AT1 cells, and mixed organoids retaining both airway and alveolar lineages, similar to previous findings from the co-culture system19 (Fig. 1f). Organoids expanded to form mainly mixed organoids with budding-like morphology over multiple passages (Fig. 1g-i).
Figure 1. Establishment of feeder-free organoids derived from distal secretory cells.
a, Experimental design for isolation of Scgb1a1 lineage-labelled cells. Scgb1a1 lineage-labelled cells were isolated at day 4 after final tamoxifen treatment. b, Representative bright-field or fluorescent images of organoids derived from lineage-labelled Tomato+Scgb1a1+ cells in indicated conditions; complete medium (See Methods) with WNT3A, RSPO1 (R-spondin 1), EGF, FGF7, FGF10, and NOG (Noggin), withdrawal of indicated factors (–FGF10, –FGF7, or –WNT3A/RSPO1). Scale bar, 2,000μm. c, d, Statistical quantification of colony forming efficiency (n=6) (c) and passaging numbers (n=5) (d) of organoids. Each individual dot represents one biological replicate and data are presented as mean and s.e.m. n.s; not significant. e, Representative serial bright-field images of a lung organoid growing originated from single Tomato+Scgb1a1+ cells at the indicated time points. Magnifications: X20 (day 0 and 4), X10 (day4-21), and X4 (day 24 and 30). Scale bars, 200μm. f, Representative immunofluorescence (IF) images of three distinctive types of organoids derived from Tomato+Scgb1a1+ cells at the establishment under feeder-free condition with complete culture medium; Airway organoids retaining CC10+ secretory and Act-Tub+ ciliated cells (left), Alveolar organoids retaining SPC+ AT2 and HOPX+ AT1 cells (middle), and Mixed organoids retaining both CC10+ secretory and SPC+ AT2 cells (right). CC10 (for secretory cells, red or green), Acetylated-Tubulin (Act-Tub, for ciliated cells, green), SPC (for AT2 cells, white), HOPX (for AT1 cells, white), and DAPI (blue). Scale bars, 50μm. g, Representative bright-field images of organoids under feeder-free condition with complete culture medium at passage 5. Insets show high-power view. Scale bars, 2,000μm. h, Representative IF images of mixed organoids cultured in complete medium at passage 5. CC10 (green), Act-Tub (red), SPC (white, left), p63 (for basal cells, white, right), and DAPI (blue). Insets (1, 2) show high-power view. Scale bars, 50μm. i, Quantification of each organoid types in complete medium at passage 0 and over passage 5; Airway organoids (CC10+SPC−; red), Alveolar organoids (CC10−SPC+; blue), and Mixed organoids (CC10+SPC+; grey). Data are presented as mean and s.e.m. (n=3 independent experiment). Statistical analysis was performed using two-tailed unpaired Student’s t test; ***p=0.002.
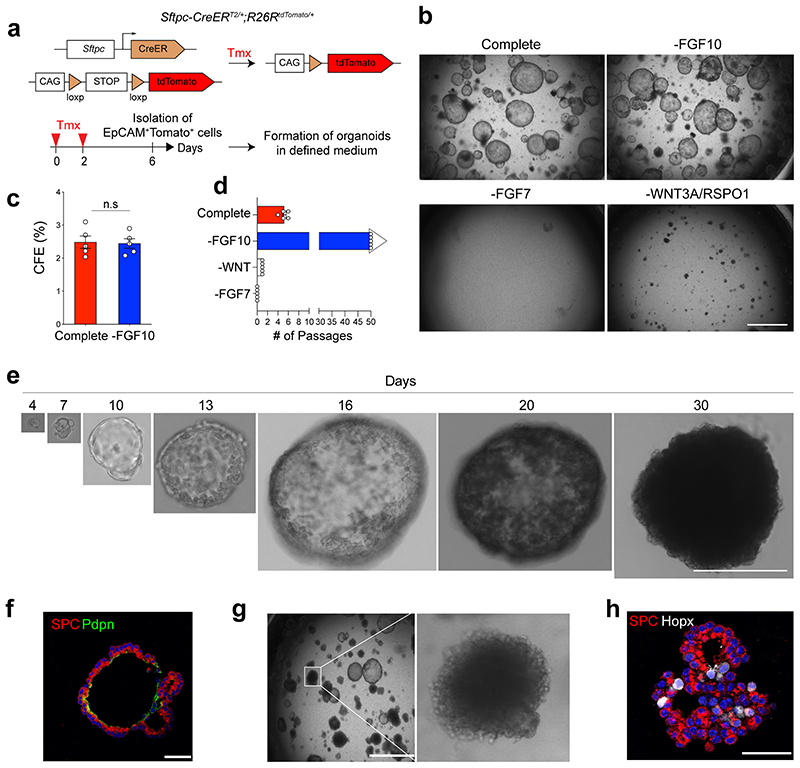
Like secretory cell-derived organoids (referred to here as SCOs), AT2 cells isolated from Sftpc-CreERT2/+;R26RtdTomato/+ reporter mice formed cyst-like organoids (Extended Data Fig. 1a,b). Consistent with previous studies20–23, FGF7 and WNT activity were essential for forming and maintaining AT2 cell-derived organoids (referred to hereafter as ACOs), which contained both AT2 and AT1 cells (Extended Data Fig. 1b-f). ACOs were better maintained in the absence of FGF10 (Extended Data Fig. 1d). We also confirmed the clonogenic ability of AT2 cells by organoid culture with single cells (Extended Data Fig. 1e). These organoids expanded to form alveolar-like structures that were mainly composed of AT2 cells with little AT1 cell differentiation over multiple passages (Extended Data Fig. 1g,h). Taken together, we developed a feeder-free organoid culture system with chemically defined medium, wherein distal airway secretory cells and AT2 cells were maintained with stem cell activity in long-term cultures.
Differentiation of secretory cells by Notch signalling
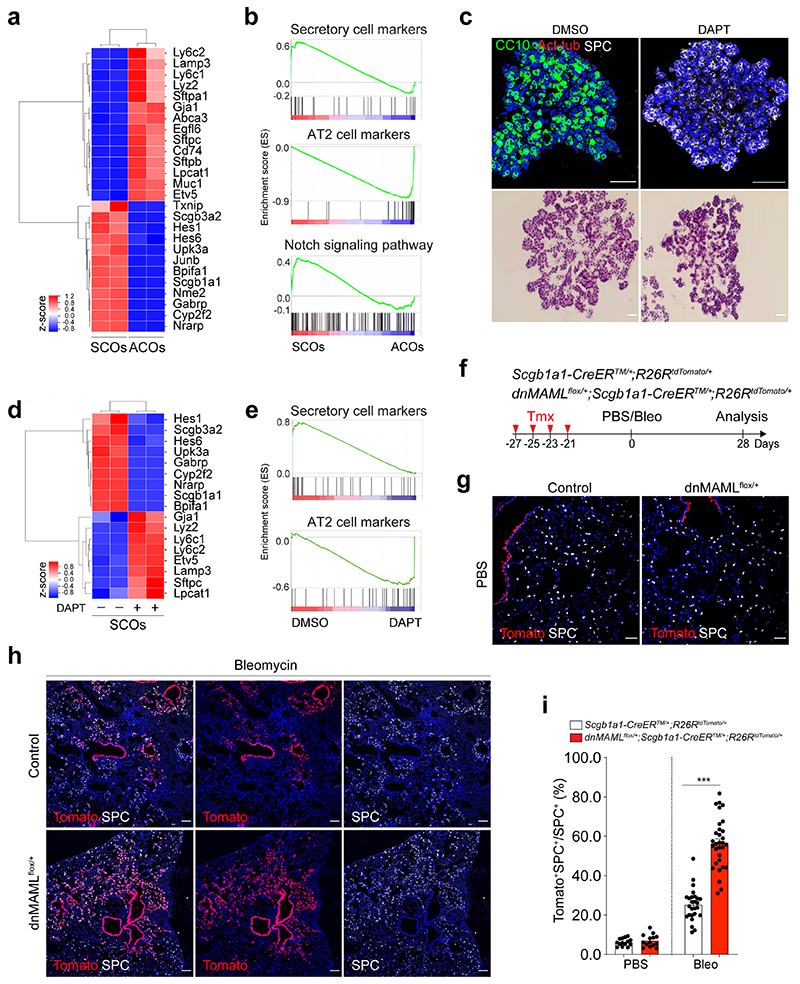
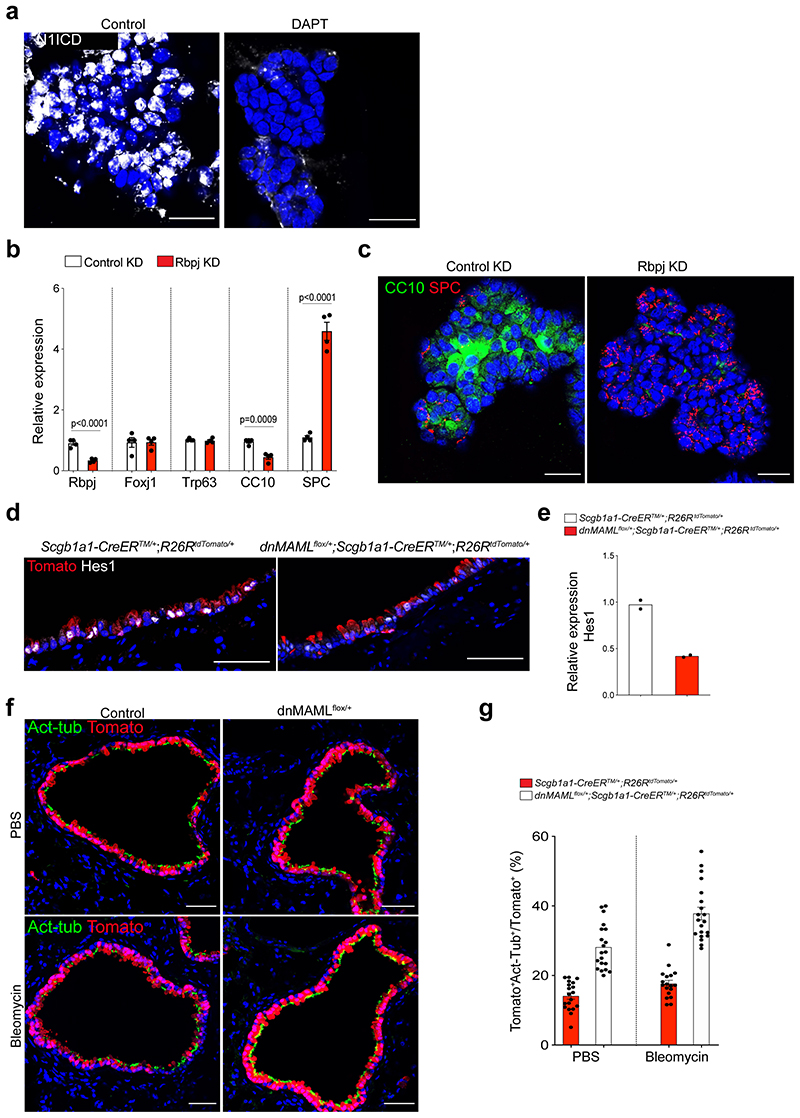
To investigate the characteristics of SCOs and ACOs, we first performed bulk RNA-seq analysis. SCOs exhibited a distinct expression pattern enriched in secretory cell markers such as Scgb1a1 and Cyp2f2, while AT2 cell markers including Sftpc and Etv5 were highly expressed in ACOs (Fig. 2a,b). Notably, expression of genes related with Notch signalling, such as Hes1 and Nrarp, was upregulated in SCOs compared to ACOs (Fig. 2a,b). Additional immunofluorescent (IF) staining also confirmed the expression of intracellular domain of Notch1 (N1ICD) in SCOs (Extended Data Fig. 2a). This observation prompted us to examine whether Notch signalling is involved in the identity and fate behaviour of secretory cells. Remarkably, AT2 cells were dramatically increased at the expense of secretory cells when we treated DAPT, a γ-secretase inhibitor, in SCOs compared to DMSO control (Fig. 2c). Further RNA-seq analysis also confirmed that DAPT-treated organoids displayed a strong upregulation of AT2 cell markers and a substantial reduction of secretory cell markers (Fig. 2d,e). Knockdown (KD) of Rbpj in SCOs promoted the differentiation of secretory cells into AT2 cells without DAPT treatment (Extended Data Fig. 2b,c), suggesting that inhibition of Notch signalling triggers the conversion of secretory cells into AT2 lineage.
Figure 2. Enhanced differentiation of secretory cells into AT2 cells by inhibition of Notch activity upon lung injury.
a, A heatmap showing normalised expression data for secretory and AT2 cell markers that were differentially expressed in secretory cell-derived organoids (SCOs) or AT2 cell-derived organoids (ACOs) cultured with defined media at passage 10. Values are z-scores. b, Gene set enrichment analysis (GSEA) showing the gene activity of the three gene sets for secretory cells (top), AT2 cells (middle), and Notch signalling pathway-related in SCOs or ACOs c, Representative IF (top) and H&E (bottom) images of organoids in treatment with DMSO (control) and DAPT at day 14. DAPT (20μM) were treated every other day during organoid culture. CC10 (green), Acetylated-Tubulin (Act-Tub, red), and SPC (white), and DAPI (blue). Scale bar, 50μm. d, A heatmap showing normalised expression data for Notch signalling related, secretory and AT2 cell marker genes that were differentially expressed in SCOs with or without DAPT treatment for 14 days. Values are z-scores. e, GSEA with two gene sets representing markers for secretory (left) and AT2 cells (right) in SCOs with or without DAPT treatment. f, Experimental design of lineage-tracing analysis for contribution of secretory cells into alveolar lineages by inhibition of Notch signalling using Scgb1a1-CreERTM/+;R26RtdTomato/+ and dnMAMLflox/+;Scgb1a1-CreERTM/+;R26RtdTomato/+ mice after bleomycin (Bleo) injury. Specific time points for tamoxifen injection and tissue analysis are indicated. g, h, Representative IF images showing the derivation of Scgb1a1 lineage-labelled AT2 cells in PBS-treated control (g) or bleomycin-treated (h) mice at day 28. Tomato (for Scgb1a1 lineage, red), SPC (white), and DAPI (blue). Scale bar, 100μm. i, Statistical quantification of Scgb1a1+ lineage-labelled AT2 cells (n=14 sections (PBS), n=14 sections (Bleo), pooled from 2 mice for Scgb1a1-CreERTM/+;R26RtdTomato/+ ; n=26 sections (PBS) and n=31 sections (Bleo), pooled from 4 mice for dnMAMLflox/+;Scgb1a1-CreERTM/+;R26RtdTomato/+). Data are presented as mean ± s.e.m. Statistical analysis was performed using two-way ANOVA; ***p<0.0001.
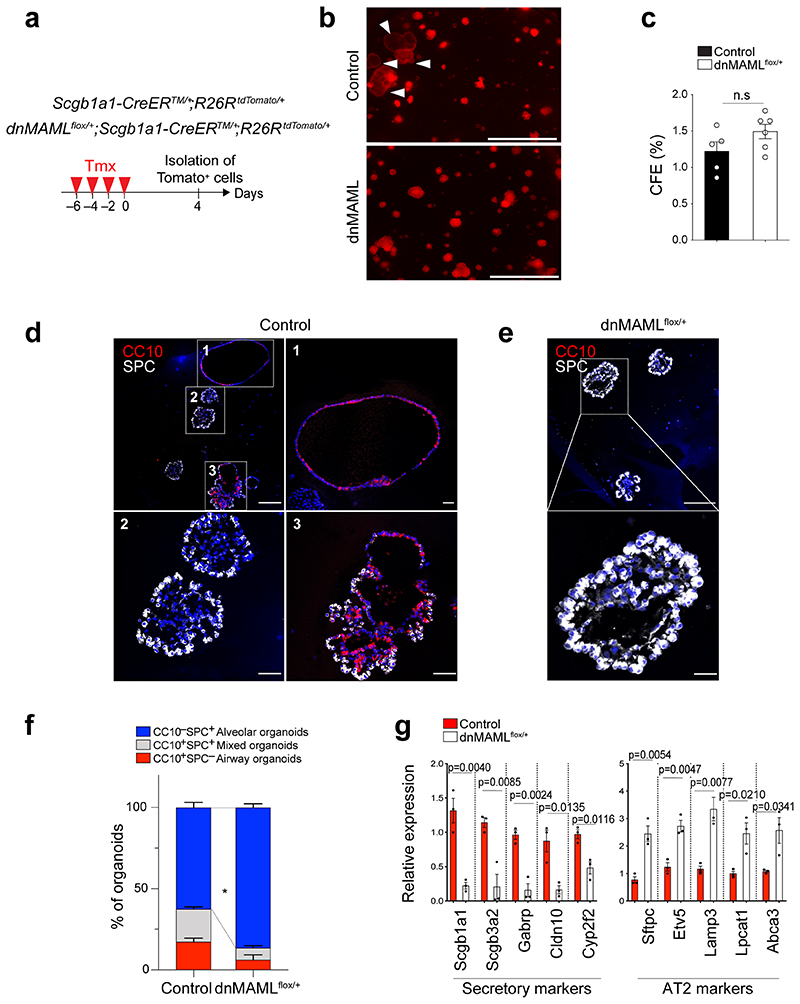
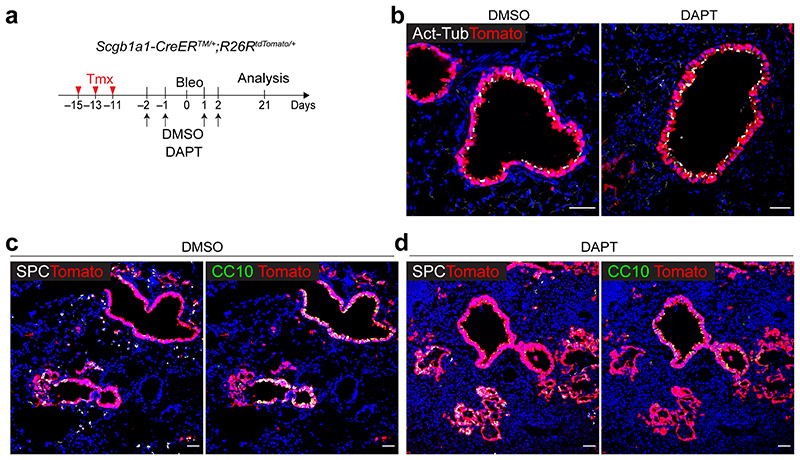
To address this finding in vivo, we used mice carrying a conditional dominant-negative mutant of mastermind-like 1 (dnMAMLflox/flox)24, which inhibits NICD-induced Notch signalling, crossed with Scgb1a1-CreERTM/+;R26RtdTomato/+. Control (Scgb1a1-CreERTM/+;R26RtdTomato/+) or dnMAMLflox/+ (dnMAMLflox/+;Scgb1a1-CreERTM/+;R26RtdTomato/+) mice were exposed to PBS or bleomycin after tamoxifen treatment to induce alveolar injury (Fig. 2f). Inhibition of Notch activity by dnMAML expression was confirmed by assessing Hes1 expression (Extended Data Fig. 2d,e). Consistent with previous studies25–27, the proportion of lineage-labelled ciliated cells was increased by Notch inhibition (Extended Data Fig. 2f,g). Frequency of lineage-labelled AT2 cells (6.97±13.12%) in dnMAMLflox/+ lungs was comparable to that seen in control lungs (6.23±1.09%) (Fig. 2g). However, we observed a substantial increase in lineage-labelled AT2 cells (56.39±12.91%) post injury in dnMAMLflox/+ lungs compared to control (25.24±8.08%) (Fig. 2h,i), suggesting that persistent inhibition of Notch signalling in secretory cells enhances their differentiation towards AT2 cells during injury repair. Further, organoids derived from dnMAML-expressing secretory cells enhanced the frequency of alveolar organoid formation and reduced occurrence of airway organoids (Extended Data Fig. 3). Pharmacological inhibition of Notch activity by DAPT treatment in vivo also showed a significant increase of AT2 cells derived from secretory cells (Extended Data Fig. 4).
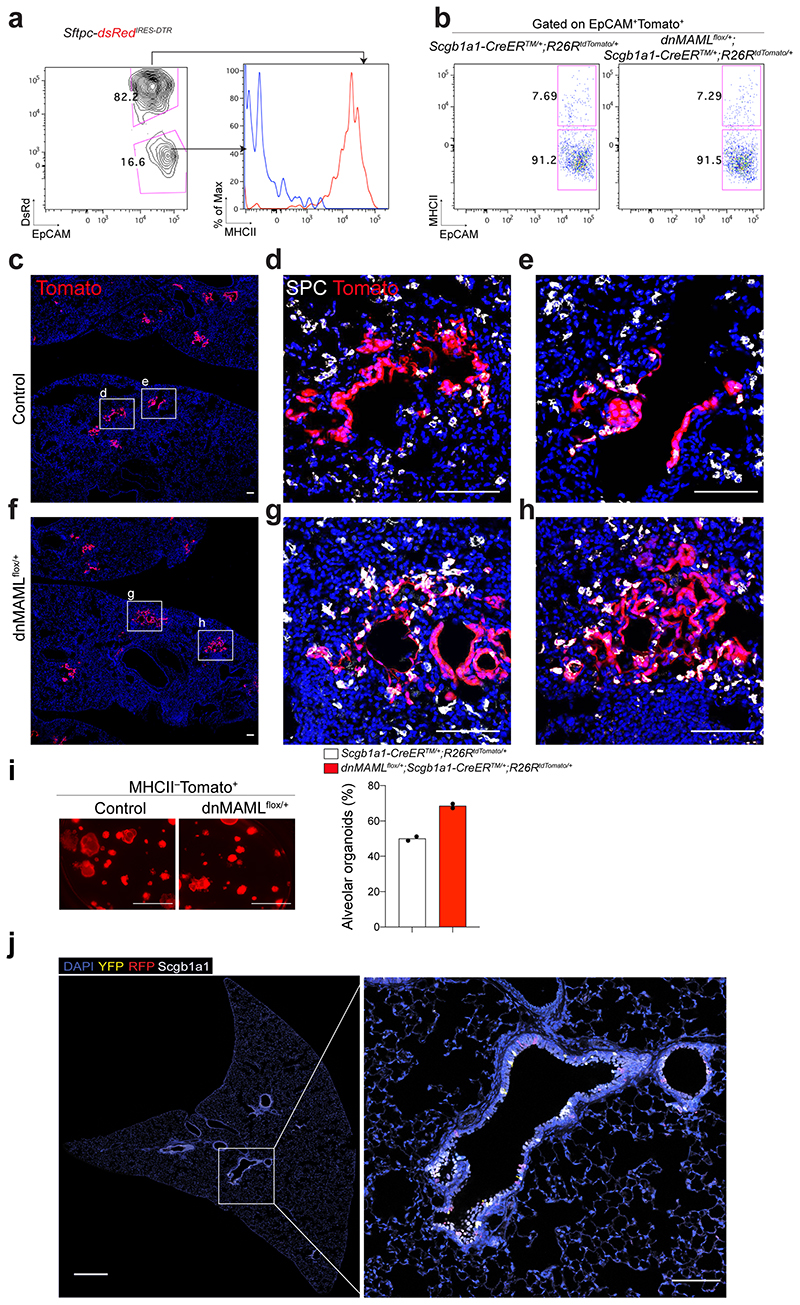
Given that Scgb1a1+ lineage-labelled cells contained heterogeneous populations, including CC10+SPC+ cells, we further evaluated the differentiation capacity of Scgb1a1+ lineage-labelled cells after excluding lineage-labelled AT2 cells. Isolated lineage-labelled secretory cells (EpCAM+Tomato+MHCII−) from control and dnMAMLflox/+ lungs were transplanted into the lungs after bleomycin injury (Extended Data Fig. 5a,b). Secretory cells isolated from dnMAMLflox/+ lungs showed enhanced ability to generate AT2 cells compared to control secretory cells (Extended Data Fig. 5c-h). Further, dnMAML-expressing secretory cells revealed the greater frequency of alveolar organoid formation compared to control secretory cells (Extended Data Fig. 5i). Together, our data strongly suggest that persistent inhibition of Notch signalling enhances the differentiation of secretory cells into AT2 cells post injury.
Impaired alveolar regeneration by sustained Notch activation
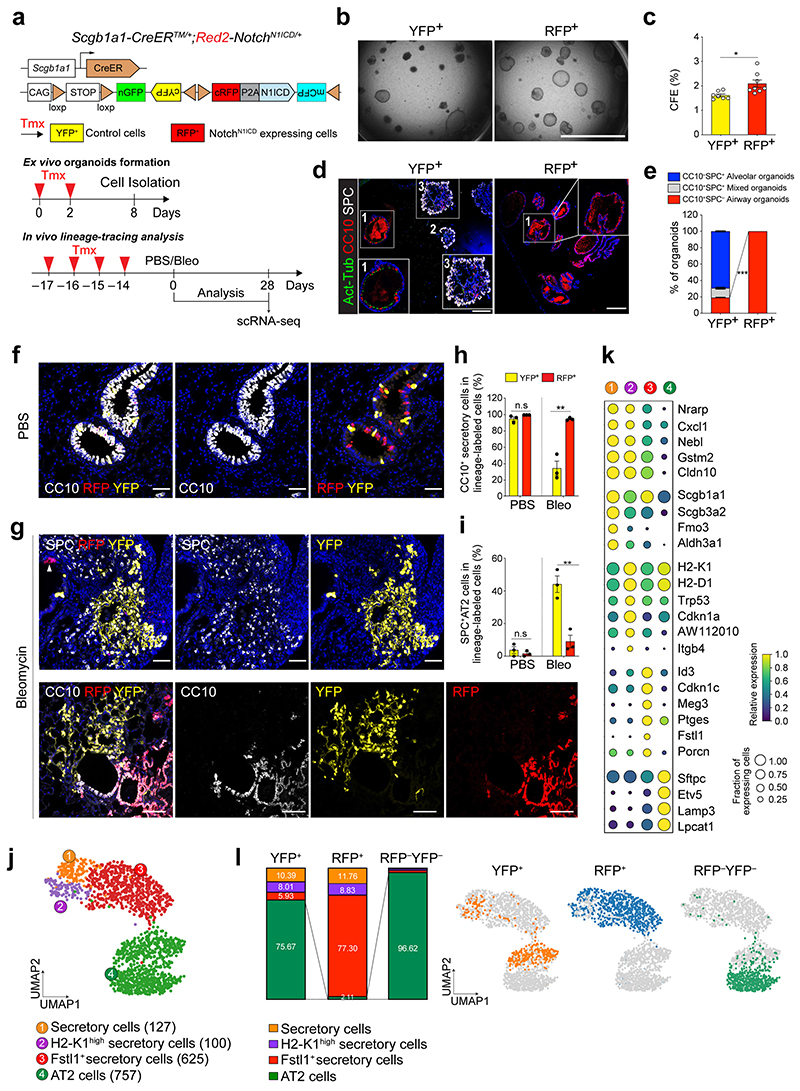
To further ask whether the constitutive Notch activation affects the cell fate of secretory cells upon injury, we used Red2-NotchN1ICD mice, where constitutive N1ICD is specifically co-expressed in tdimer2 red fluorescent protein (RFP)+ cells in the original confetti mouse line28 (Fig. 3a). The other three lineage outcomes, namely YFP, GFP and CFP, all represent wild-type events. Isolated RFP+ cells formed organoids retaining only airway cells whereas YFP+ control cells generated three types of organoids in co-cultures (Fig. 3b-e). To further investigate the cellular behaviour of secretory cells with constitutive Notch activity in vivo, Scgb1a1-CreERTM/+;Red2-NotchN1ICD/+ mice were administered PBS or bleomycin injury (Fig. 3a). In uninjured lungs, YFP+ and RFP+ cells were localised in airways with CC10 expression, and no lineage-labelled cells were observed in the alveolar region (Fig. 3f and Extended Data Fig. 5j). After bleomycin injury, we observed an increased frequency of YFP+ lineage-labelled AT2 cells (Fig. 3g-i). However, an increase of RFP+ lineage-labelled AT2 cells was significantly compromised after injury (Fig. 3g-i). Although RFP+ cells also expanded post injury, they still maintained identity of secretory cells retaining CC10 expression (Fig. 3g-i).
Figure 3. Impaired contribution of secretory cells into AT2 cell regeneration by sustained Notch activity.
a, Experimental design of ex vivo organoid co-culture with stromal cells, lineage-tracing analysis, and scRNA-seq analysis using Scgb1a1-CreERTM/+; Red2-NotchN1ICD/+ mice after bleomycin injury. Specific time points for tamoxifen injection and analysis for tissue and scRNA-seq are indicated. b, c, Representative bright-field images (b) and colony forming efficiency (CFE) of organoids derived from control YFP+ (left) and N1ICD-expresing RFP+ (right) cells. Scale bar, 2,000μm. Data are presented as mean and s.e.m. Statistical analysis (n=7 biological replicates for YFP, n=8 biological replicates for RFP) was performed using two-tailed unpaired Student’s t test; *p=0.0141. d, Representative IF images of three distinctive types of organoids in (b); Airway organoids (CC10+SPC−, 1), Alveolar organoids (CC10−SPC+, 2), and Mixed organoids (CC10+SPC+, 3). CC10 (secretory cells, red), Act-Tub (ciliated cells, green), SPC (AT2 cells, white), and DAPI (blue). Insets (1 and 3) show high-power view. Scale bars, 50μm. e, Quantification of each organoid types in (d), Data are presented as mean and s.e.m (n=3 biological replicates). ***p<0.0001 (Student’s t test). f, Representative IF images showing the derivation of YFP+ or RFP+ cells in control mice at day 28 post PBS treatment. YFP (yellow), RFP (red), CC10 (white), and DAPI (blue). Scale bar, 50μm. g, Representative IF images showing the derivation of YFP+ or RFP+ cells at day 28 post bleomycin treatment. YFP (yellow), RFP (red), SPC (top, white), CC10 (bottom, white), and DAPI (blue). Arrowhead points to RFP+ cells. Scale bar, 50μm. h, i, Statistical quantification of CC10+ secretory (h) and SPC+ AT2 (i) cells derived from YFP+ or RFP+ cells at day 28 post PBS or bleomycin treatment. Data (n=3 biological replicates) are presented as mean ± s.e.m. **p=0.025 (h), p=0.0052 (i) from Student’s t test. j, Secretory and AT2 cell population were further analysed from scRNA-seq results (Extended Data Fig. 7b). Number of cells in the individual cluster is depicted in the figure. k, Gene expression of key markers in each distinctive cluster. l, Quantification (left) and UMAP (right) of distribution of each cluster across indicated lineage-labelled cells after injury.
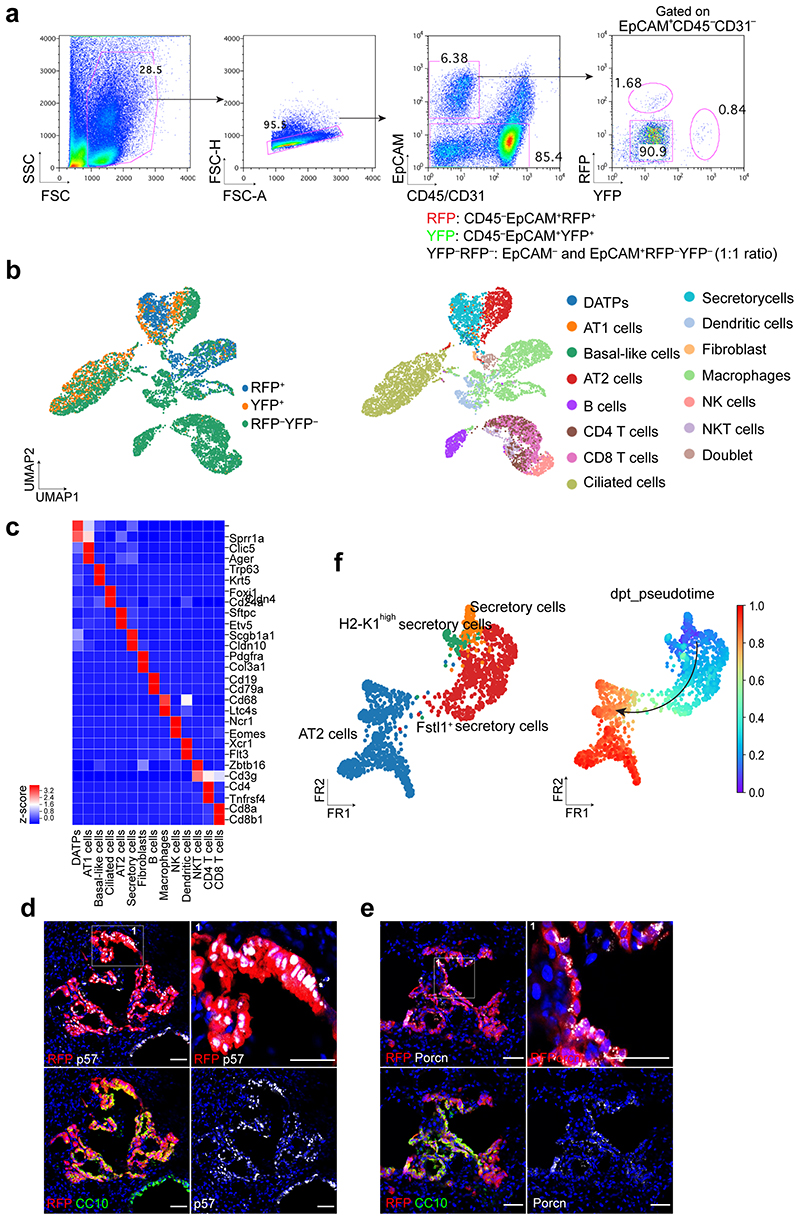
We next sought to define the molecular identity and characteristics of YFP+ or RFP+ cells during alveolar regeneration. To this end, we carried out single-cell RNA-sequencing (scRNA-seq) analysis by isolating lineage-labelled (YFP+ or RFP+) and non-lineage-labelled (YFP–RFP–) populations at day 28 post bleomycin injury (Extended Data Fig. 6a-c). To gain insight into the impact of Notch activity on lineage differentiation of secretory cells into AT2 cells, we further analysed the secretory and AT2 cell populations (Fig. 3j). This analysis uncovered four distinctive clusters, including three different types of secretory cells and an AT2 cell cluster (Fig. 3j,k). In addition to the known secretory cell populations, including Scgb3a2high canonical secretory cells (cluster 1) and H2-K1high cells (cluster 2)8 sharing common secretory markers (e.g. Cldn10), we identified an uncharacterized population which we termed Fstl1+ secretory cells (cluster 3; Fig. 3j,k). While cells in this cluster still retained the identity of secretory cells based on Scgb1a1 expression, they showed lower expression levels of some secretory cell markers such as Scgb3a2 and Cldn10 (Fig. 3k). Moreover, this cluster was marked by specific gene expression such as Id3 and Porcn (Fig. 3k). Interestingly, this population had elevated expression of Cdkn1c/p57, involved in cell cycle inhibition, which could indicate the quiescent characteristics of this cluster in vivo (Fig. 3k and Extended Data Fig. 6d,e). Consistent with lineage-tracing analysis, control YFP+ cells contributed to alveolar regeneration by giving rise to AT2 cells post injury (Fig. 3l). However, RFP+ cells were arrested at the stage of the Fstl1 + population, causing impaired differentiation into AT2 cells (Fig. 3l). Pseudotime analysis revealed that the transition from secretory cells to AT2 cells is mediated via this cluster 3, suggesting that this population may function as a transitional intermediate in the lineage transition between secretory cells and AT2 cells, and inactivation of Notch activity is required for the transition of this intermediate state into AT2 cell fate (Extended Data Fig. 6f). Overall, our results indicate that sustained Notch activation causes defects in alveolar regeneration by blocking the fate conversion from secretory to AT2 cells.
Notch ligand expression in ciliated cells by IL-1β signals
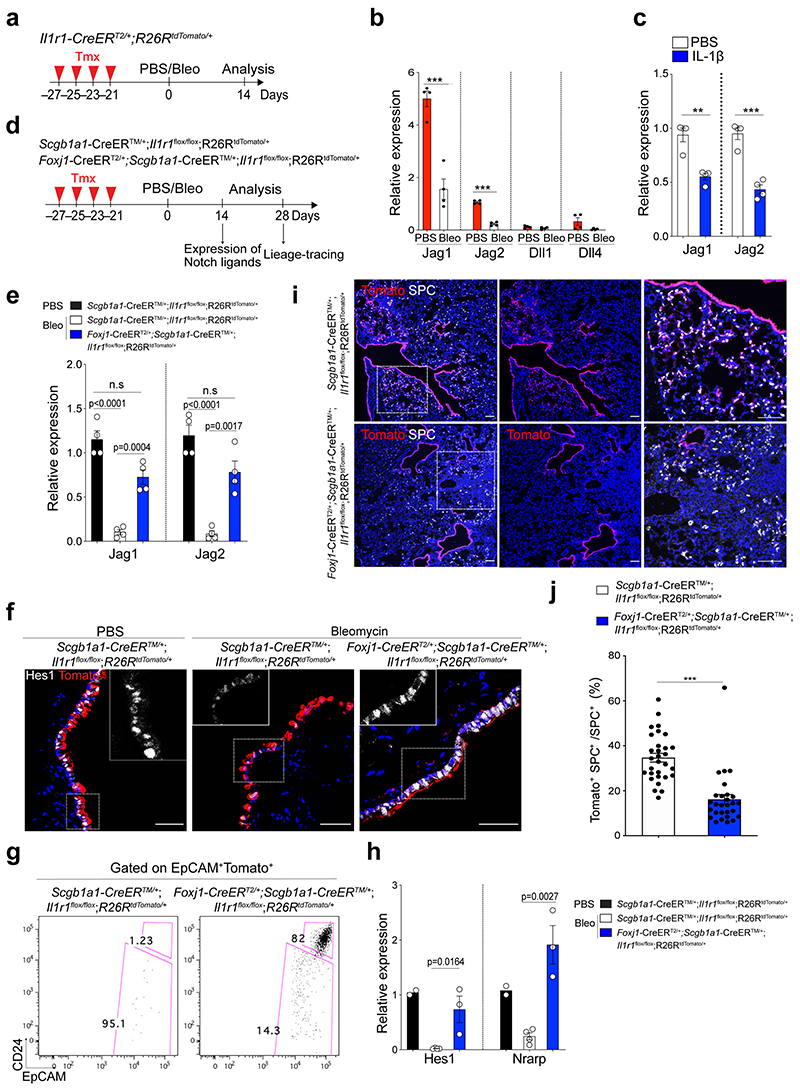
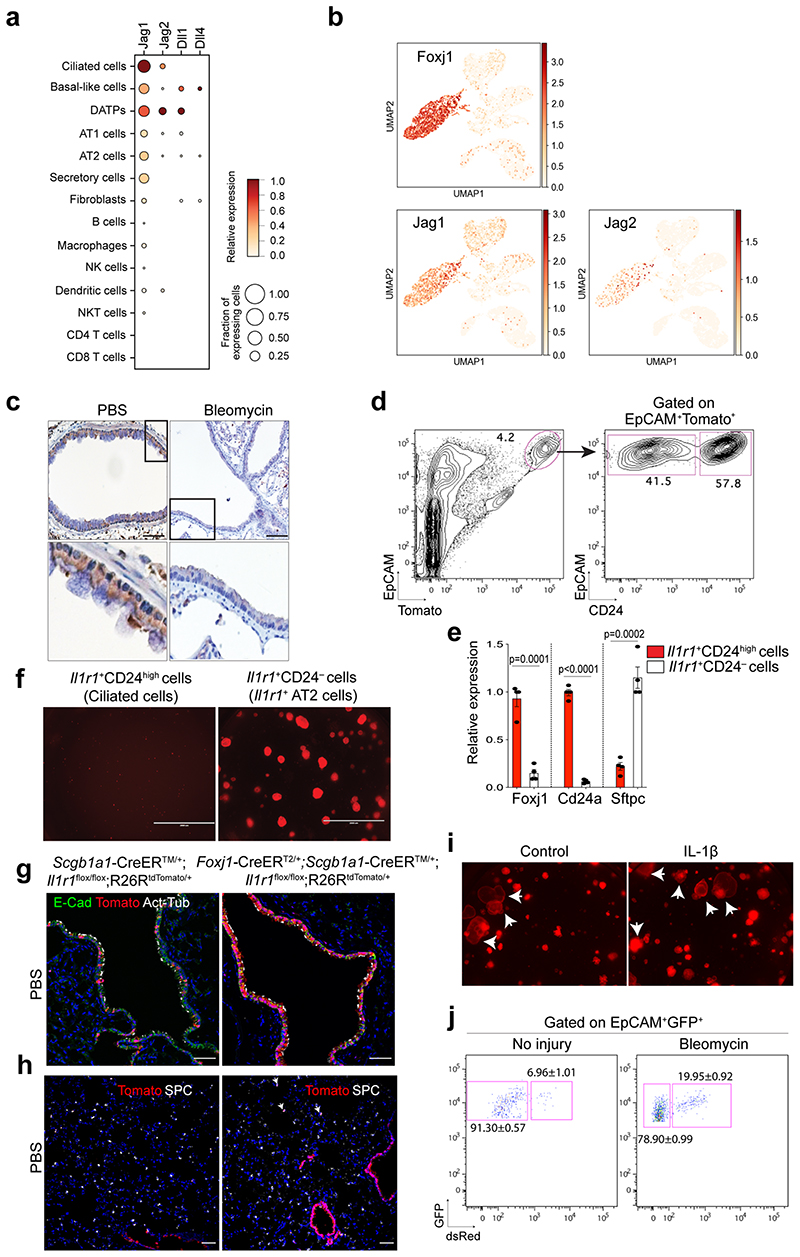
Given that Notch signalling involves short-range cellular communication through direct contact by receptor-ligand interaction, we examined which cells highly express the Notch ligands in the airway. Our scRNA-seq analysis revealed that Jag1 and Jag2 are highly expressed in ciliated cells, which reside adjacent to secretory cells, consistent with previous studies27,29,30 (Extended Data Fig. 7a,b). Immunohistochemistry (IHC) staining also confirmed the high expression of Jag1 in ciliated cells (Extended Data Fig. 7c). Notably, Jag1 expression was downregulated after bleomycin treatment, suggesting dynamic modulation of Notch signalling by ciliated cells during injury repair (Extended Data Fig. 7c). Previously we showed dynamic expression of IL-1β during alveolar regeneration31. Notably, Il1r1, a functional receptor for IL-1β, is specifically expressed in ciliated cells, in addition to subsets of AT2 cells (Extended Data Fig. 7d,e)31. The expression of Jag1 and Jag2 was significantly reduced in Il1r1+ ciliated cells (EpCAM+ Il1r1 +CD24high) after bleomycin injury compared to PBS control (Fig. 4a,b). Furthermore, isolated ciliated cells treated with IL-1β for 24 hours in vitro also showed a significant reduction in the expression of Jag1 and Jag2 compared to PBS control, suggesting that IL-1β signalling directly modulates the expression of Notch ligands in ciliated cells after injury (Fig. 4c).
Figure 4. Regulation of Notch ligand expression in ciliated cells by IL-1β signalling.
a, Experimental design for isolation of Il1r1-expressing ciliated cells. b, qPCR analysis showing the expression of Notch ligands in ciliated cells (EpCAM+ Il1r1+CD24high). Data are presented as mean ± s.e.m. (n= 4 biological replicates). ***p=0.0004 (Jag1), ***p<0.0001 (Jag2) using Student’s t test. c, qPCR analysis showing the expression of Jag1 (n=3 biological replicates) and Jag2 (n=4 biological replicates) in cultured ciliated cells treated with PBS or IL-1β. Data are presented as mean ± s.e.m. **p=0.0016, ***p<0.0003 using Student’s t test. d, Experimental design for lineage-tracing analysis of secretory cells after PBS or bleomycin treatment using Scgb1a1-CreERTM/+;Il1r1flox/flox;R26RtdTomato/+ or Foxj1-CreERT2;Scgb1a1-CreERTM/+;Il1r1flox/flox; R26RtdTomato/+ mice. e, qPCR analysis showing the expression of Jag1 and Jag2 in isolated ciliated cells (Tom+EpCAM+CD24high) after treatment of PBS or bleomycin. P-values using Student’s t test are indicated in the figure, n=4 biological replicates, n.s; not significant. f, Representative IF images showing Hes1 expression: Tomato (for Scgb1a1 lineage, red), Hes1 (white), and DAPI (blue). Insets show high-power view of Hes1 expression. Scale bars, 50μm. g, Flow cytometry sorting strategy for lineage-labelled secretory cells after PBS or bleomycin injury. EpCAM+CD24− cells gated from EpCAM+Tomato+ were used for isolation of lineage-labelled secretory cells and qPCR analysis. h, qPCR analysis of Hes1 and Nrarp from isolated lineage-labelled secretory cells in (g). n=2, 4, and 3 individual experimental mice. Data are presented as mean ± s.e.m. P-values using Student’s t test are indicated in the figure. i, Representative IF images showing the derivation of Scgb1a1+ lineage-labelled AT2 cells in PBS-treated control or bleomycin-treated mice at day 28. Tomato (for Scgb1a1 lineage, red), SPC (white), and DAPI (blue). White boxed insets show high-power view (right panel). Scale bar, 100μm. j, Statistical quantification of Tomato+SPC+ AT2 cells at day 28 post bleomycin treatment in (f). n=30 sections, pooled from 4 mice (Scgb1a1-CreERTM/+;Il1r1flox/flox;R26RtdTomato/+) and n=27 sections, pooled from 3 mice (Foxj1-CreERT2;Scgb1a1-CreERTM/+;Il1r1flox/flox;R26RtdTomato/+). Data are presented as mean ± s.e.m. Statistical analysis was performed using two-way ANOVA; ***p<0.0001.
We next asked whether depletion of IL-1β signalling on ciliated cells impacts the fate behaviour of secretory cells after injury in vivo. To delete Il1r1 in ciliated cells and lineage-trace secretory cells simultaneously, we established Il1r1flox/flox;Foxj1-CreERTM mice crossed with Scgb1a1-CreERTM;R26RtdTomato mice (Fig. 4d). Of note, in the distal airway, Il1r1 only marks ciliated cells, not secretory cells31. Moreover, ciliated cells are known to lack hallmark features of progenitors including generation of other lineages such as secretory and AT2 cells, which was also supported by our organoid assay (Extended Data Fig. 7f)31–33. Given these pieces of evidence, we examined the expression of Notch ligands (Jag1, Jag2, Dll1, Dll4) in ciliated cells of Il1r1flox/flox;Scgb1a1-CreERT2/+;R26RtdTomato/+ lungs after PBS or bleomycin treatment. qPCR analysis revealed significant downregulation of Jag1/2 expression in ciliated cells after injury, indicating a transient reduction in Notch activity as an initial step in secretory cell-mediated regeneration after injury (Fig. 4e). However, ciliated cells of Foxj1-CreERTM;Il1r1flox/flox;Scgb1a1-CreERT2/+;R26RtdTomato/+ lungs failed to downregulate the expression of these ligands after bleomycin treatment, suggesting that IL-1β signalling via Il1r1 mediates the reduction of Jag1/2 expression in ciliated cells after injury (Fig. 4e). Significantly, after injury, Notch activity was reduced in secretory cells, which was impaired by Il1r1 deletion in ciliated cells (Fig. 4f-h). We observed no discernible alteration in lineage-labelled cells by Il1r1 deletion in ciliated cells in PBS control lungs (Extended Data Fig.7g-i). However, we found a significant reduction in the frequency of lineage-labelled AT2 cells in the lungs of Foxj1-CreERTM;Il1r1flox/flox;Scgb1a1-CreERT2/+;R26RtdTomato/+ mice compared to the lungs of Il1r1flox/flox;Scgb1a1-CreERT2/+;R26RtdTomato/+ mice after injury (Fig. 4i,j). Together, these data indicate that IL-1β signals build niche environments governing the expression of Notch ligands in ciliated cells, which is essential for the fate transition of secretory cells toward AT2 cells during alveolar regeneration.
Fate conversion of secretory cells into AT2 cell by Fosl2
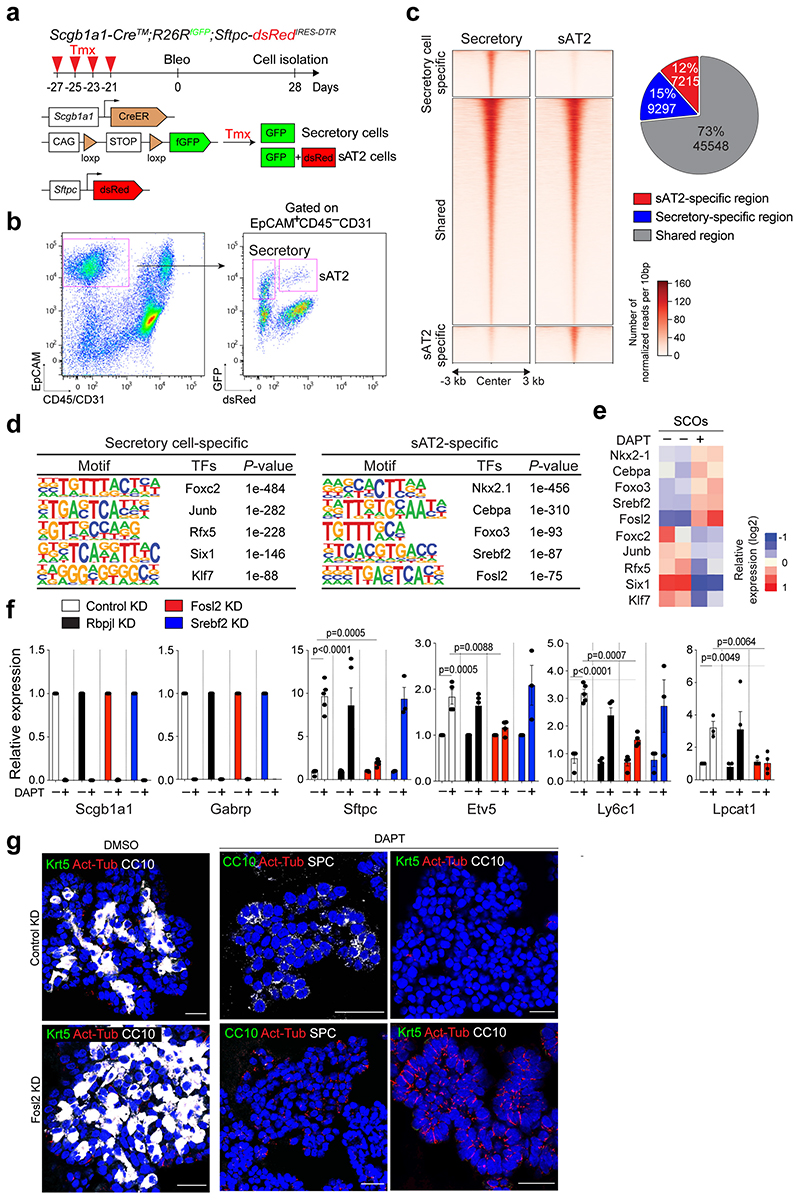
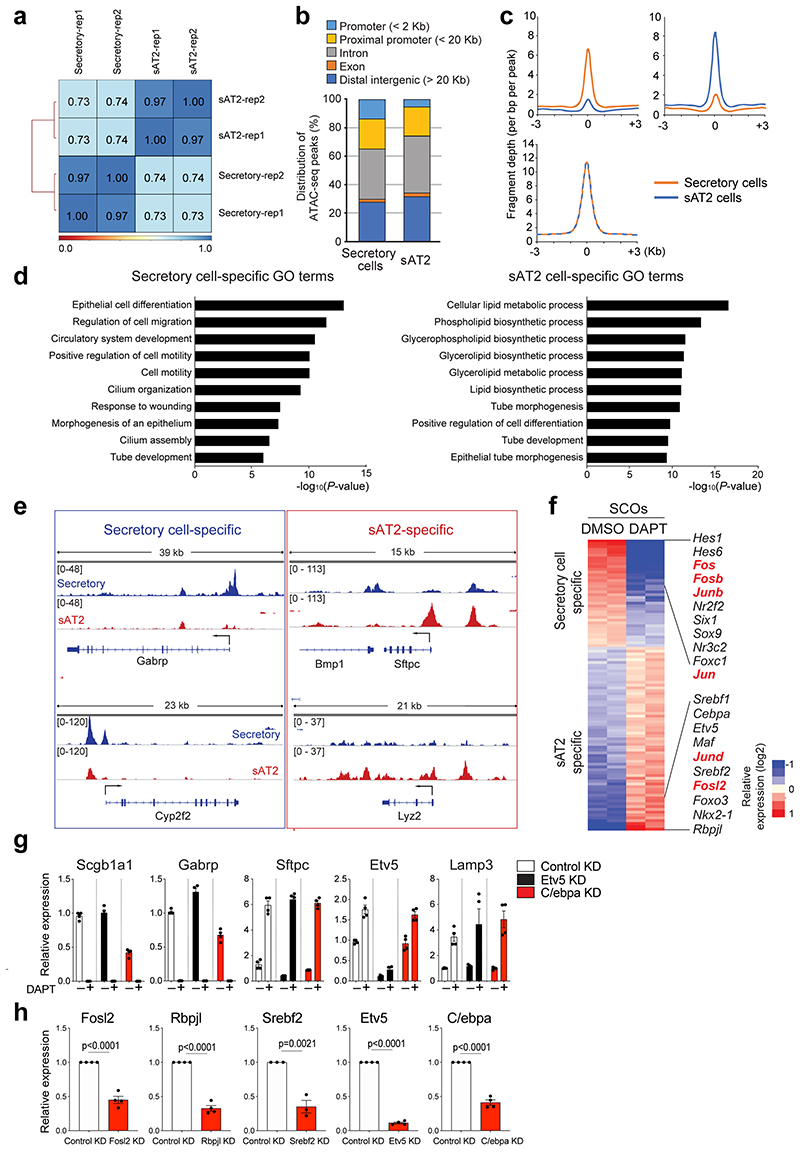
To investigate the epigenetic regulation that mediates the differentiation of secretory cells into AT2 cells, we performed ATAC-seq (Assay for Transposase-Accessible Chromatin with high-throughput sequencing) with secretory and secretory-derived AT2 cells (referred to as sAT2 from here). We generated Sftpc-dsRedIRES-DTR AT2 reporter mice to monitor SPC-expressing AT2 cells and crossed them with the Scgb1a1-CreERTM;R26RfGFP mice to trace cells derived from secretory cells after injury (Fig. 5a). For ATAC-seq analysis, we isolated lineage-labelled secretory (GFP+dsRed–) and sAT2 (GFP+dsRed+) cells at day 28 post injury (Fig. 5a,b and Extended Data Fig. 7j). While approximately 45,548 peaks were common, 9297 and 7316 peaks were mapped as cell-type specific to secretory and sAT2 cells, respectively (Fig. 5c and Extended Data Fig. 8a-c). Analysis of Gene Ontology (GO) terms with the genes associated with cell-type specific ATAC-seq peaks revealed the distinct characteristics of secretory or AT2 cells (Extended Data Fig. 8d). Indeed, known-secretory cell markers, such as Gabrp, were associated with secretory cell specific-differential peaks, whereas AT2 cell markers, such as Etv5, were associated with sAT2 cell-specific peaks (Extended Data Fig. 8e). Motif analysis of DNA binding-site showed that sAT2-enriched chromatin contains motifs for key transcriptional factors (TFs) associated with lung development, including Nkx2-1 and Fosl234,35 (Fig. 5d). We compared the expression of TFs obtained from motif analysis with RNA-seq data of control and DAPT-treated SCOs (Fig. 2d). TFs in sAT2-enriched open chromatin were also highly expressed in DAPT-treated organoids, whereas the expression levels of TFs identified in secretory cell-restricted motif were higher in control organoids (Fig. 5e and Extended Data Fig. 8f). To interrogate the key TFs that are required for AT2 cell differentiation, we established feeder-free SCOs with KD of five TFs (Srebf2, Fosl2, Rbpjl, Cebpa, Etv5) selected from motif analysis or a list of differentially expressed genes in RNA-seq analysis. Notably, KD of Fosl2/Fra2 significantly blocked the increase of AT2 cell markers, including Sftpc and Etv5, by DAPT treatment whereas the downregulation of secretory cell markers such as Scgb1a1 was not altered (Fig. 5f and Extended Data Fig. 8g,h). Further IF analysis also confirmed impaired induction of AT2 cells in Fosl2-deficient secretory organoids treated with DAPT (Fig. 5g). Interestingly, we found that Fosl2 KD markedly increased Act-Tub+ ciliated cells in DAPT-treated organoids (Fig. 5g). These data suggest that Fosl2 is a critical mediator regulating the fate conversion of secretory cells to AT2 lineage upon Notch inhibition.
Figure 5. Fosl2/Fra2-mediated AP-1 activity is required for the fate conversion of secretory cells into AT2 cells.
a, Experimental design for isolation of secretory (GFP+dsRed−) and secretory-derived AT2 (sAT2, GFP+dsRed+) cells using Scgb1a1-CreERTM/+;R26RfGFP/+;Sftpc-dsRedIRES-DTR/+ mouse post bleomycin injury. Specific time points for tamoxifen injection and isolation of cells are indicated. b, Representative flow cytometry analysis for isolation of secretory (GFP+dsRed−) and sAT2 (GFP+dsRed+) cells. c, A heatmap showing ATAC-seq peaks representing open chromatin regions in secretory cells (left) and sAT2 cells (right). Secretory-specific, shared, and sAT2-specific peaks are shown. Regions of a pie chart presenting the proportion of secretory-specific (blue), sAT2-specific (red), and shared regions (grey). d, Top five motif matrices and transcription factors predicted by the HOMER de novo motif analysis using secretory-specific and sAT2-specific open regions. e, A heatmap showing the expression levels of transcription factors predicted by the motif analysis (Fig. 5d) in secretory cell-derived organoids (SCOs) with or without DAPT treatment (20μM). f, qPCR analysis of the markers for secretory (Scgb1a1 and Gabrp) and AT2 cells (Sftpc, Etv5, Ly6c1, and Lpcat1) in SCOs with or without DAPT treatment after knockdown of control (white), Rbpjl (black), Fosl2 (red), and Srebf2 (blue). n=5 biological replicates (for SPC expression), n=4 (for other markers) except Srebf2 KD samples. Data are presented as mean ± s.e.m. Statistical analysis was performed using two-tailed unpaired Student’s t test; P-values are indicated in the figure. g, Representative IF images of secretory cell-derived control KD or Fosl2 KD organoids treated with DMSO or DAPT (20μM). Single cells dissociated from SCOs at passage 10-12 were cultured in feeder-free condition for 7 days and further maintained with DMSO or DAPT for another 7 days. CC10 (white, left and right panels; green, middle panel), SPC (white, middle panels), Krt5 (green, left and right panels), Act-Tub (red), and DAPI (blue). Scale bars, 50μm.
Distinct character of airway-derived AT2 cells
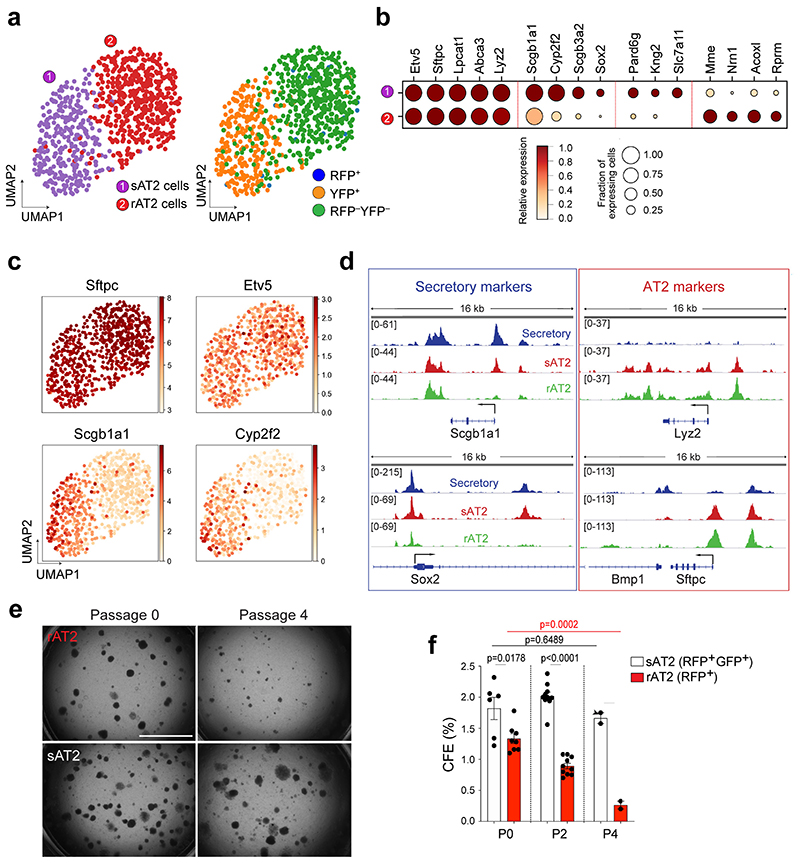
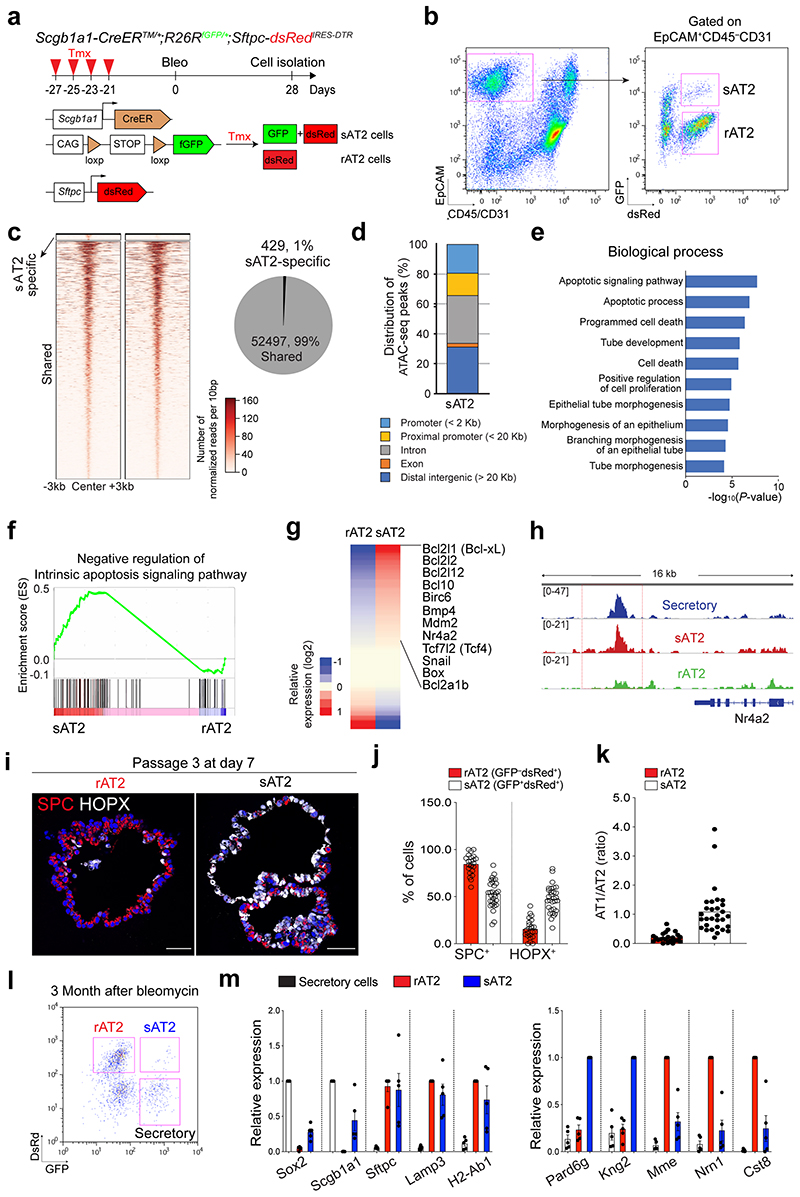
While AT2 cells serve as stem cells to maintain the alveolar epithelium during both homeostasis and regeneration, secretory cells are the major source of replenishing alveolar lineages after severe alveolar damage5,6. However, it remains unexplored whether sAT2 cells generated after injury-repair are genetically or functionally identical to resident AT2 cells (hereafter referred to as rAT2 cells) in alveoli. To address this question, we further analysed the AT2 cell population in our scRNA-seq (Fig. 3j) of Scgb1a1-CreERTM/+;Red2-NotchN1ICD/+ mice challenged by bleomycin injury and found that secretory lineage-labelled AT2 (sAT2, YFP+) and non-lineage-labelled AT2 (rAT2, RFP–YFP–) cells were indeed segregated (Fig. 6a). Notably, sAT2 cells still retained higher expression of many secretory cell markers such as Scgb1a1 and Sox2 while the expression of AT2 markers such as Sftpc and Etv5 was comparable to that seen in rAT2 cells (Fig. 6b,c). We then examined the epigenetic signatures of sAT2 and rAT2 cells via ATAC-seq on isolated GFP+dsRed+ (sAT2) and GFP– dsRed+(rAT2) cells from Scgb1a1-CreERTM/+;R26RfGFP/+;Sftpc-dsRedIRES-DTR/+ mice treated with bleomycin injury at day 28 (Extended Data Fig. 9a,b). We identified 52,497 shared open regions from sAT2 and rAT2 cells and 429 differential open regions of sAT2 cells (Extended Data Fig. 9c). Most sAT2-specific open regions were located far away from the transcription start sites (TSS), suggesting that the differential peaks co-localised with contained distal enhancer regions (Extended Data Fig. 9d). Consistent with genetic signatures, the regulatory regions surrounding secretory cell marker loci, including Scgb1a1 and Sox2, showed accessible chromatin signatures in sAT2 cells, much like in secretory cells (Fig. 6d). Importantly, we found the distinctive feature of an apoptosis-related signature in sAT2 cells (Extended Data Fig. 9e). Genes involved in the negative regulation of apoptotic processes (GO:0043066) were also more highly expressed in sAT2 than rAT2 cells in our scRNA-seq analysis (Extended Data Fig. 9f,g). We confirmed that the Nr4a2 locus, one of the most critical anti-apoptotic regulators in the lung, is open in sAT2 cells, but not in rAT2 cells36,37 (Extended Data Fig. 9h). Furthermore, sAT2 cells showed higher expression of Slc7a11, which is a master regulator for redox homeostasis and essential for survival in response to cellular stress such as cystine deficiency, which can lead to cell death, referred to as ferroptosis38,39 (Fig. 6b).
Figure 6. Distinctive features of secretory-derived AT2 cells.
a, UMAP visualisation of two distinctive AT2 cell clusters sAT2 (secretory cell-derived AT2, YFP+SPC+ cluster); rAT2 (resident AT2, YFP−RFP− non-lineage labelled SPC+ cluster) from scRNA-seq analysis of Scgb1a1-CreERTM/+;Red2-NotchN1ICD/+ mice in Fig. 3j. b, Gene expression of key markers in sAT2 and rAT2 cell clusters. c, UMAP visualisation of the log-transformed (log10(TPM+1)), normalised expression of selected marker genes (Sftpc and Etv5 for AT2 cells. Scgb1a1 and Cyp2f2 for secretory cells) in distinctive clusters shown in (a). d, Signal track images showing open regions of markers for secretory (Scgb1a1 and Sox2) and AT2 cells (Lyz2 and Sftpc) mapped in secretory (blue), sAT2 (red), and rAT2 cells (green) from the result of Fig. 5c. e, Representative bright-field images of organoids derived from rAT2 (top) or sAT2 (bottom) cells: Experiment scheme for labelling with tamoxifen is same as Fig. 5a. Scgb1a1-CreERTM/+;R26RfGFP/+;Sftpc-dsRedIRES-DTR/+ mice was given four doses of tamoxifen followed by bleomycin injury. Isolated GFP+dsRed+ (sAT2) and GFP–dsRed+ (rAT2) cells at 2 months post bleomycin injury were co-cultured with stromal cells with 1:5 ratio. Images show the organoids at passage 0 and 4. Scale bar, 2,000μm. f, Statistical quantification of colony forming efficiency (CFE) of indicated organoids. Each individual dot represents individual biological replicate (n=6 and 8 for Passage 0, n=10 for passage 2, and n=2 for passage 4) and data are presented as mean ± s.e.m. Statistical analysis was performed using two-tailed unpaired Student’s t test; P-values are indicated in the figure.
To further interrogate the functional differences between sAT2 and rAT2 cells, we established organoid co-cultures of GFP+dsRed+ (sAT2) and GFP–dsRed+ (rAT2) cells isolated from Scgb1a1-CreERTM/+;R26RfGFP/+;Sftpc-dsRedIRES-DTR/+ mice at 2 months post bleomycin injury. Consistent with previous research40, rAT2 cells lost colony forming efficiency (CFE) after serial passaging (Fig. 6e,f). However, sAT2 cells formed stable organoids without loss of CFE over multiple passages (Fig. 6e,f). Moreover, sAT2-derived organoids revealed a greater ratio of AT1 versus AT2 cells compared to that of rAT2-derived organoids, suggesting enhanced differentiation capacity into AT1 lineages (Extended Data Fig. 9i-k). We were also able to detect sAT2 cells in the lungs of Scgb1a1-CreERTM/+;R26RfGFP/+;Sftpc-dsRed mice for least at 3 months post bleomycin injury (Extended Data Fig. 9l,m). Together, these data indicate that AT2 cells derived from secretory cells during alveolar regeneration remain functionally and epigenetically distinct compared to alveolar resident AT2 cells.
Conserved differentiation potential of human secretory cells
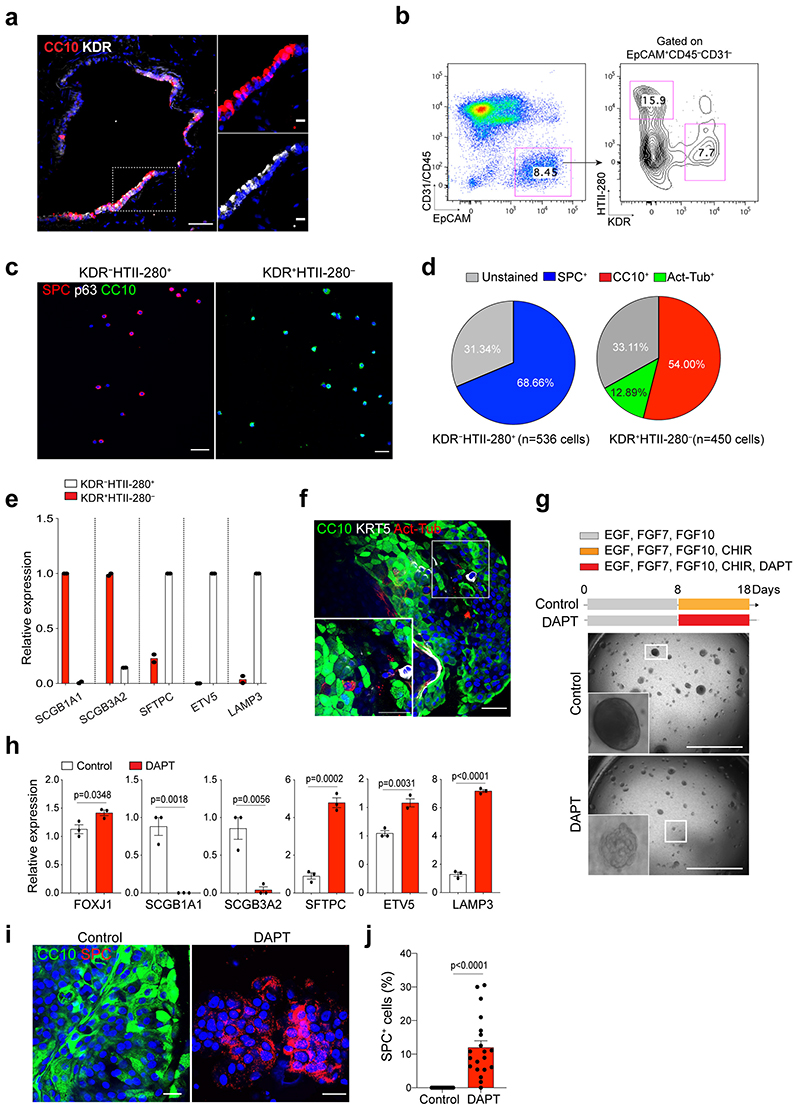
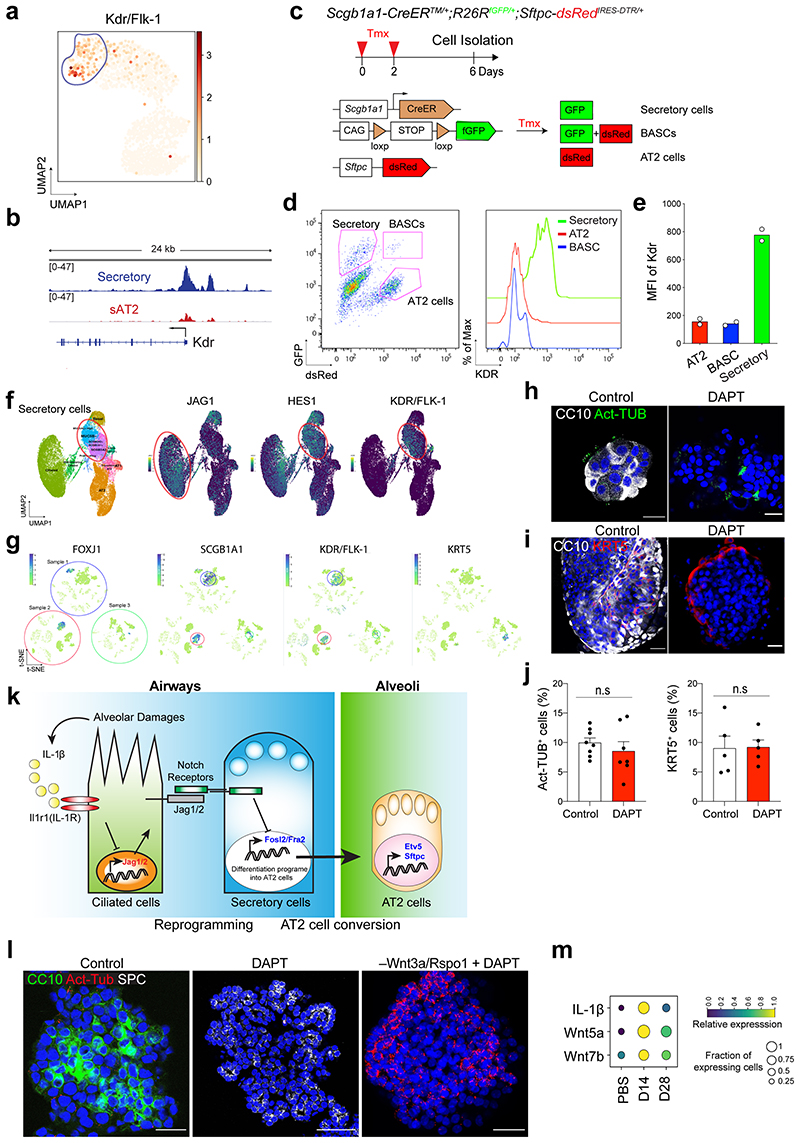
We asked whether secretory cells in the human distal lungs have the potential to convert into AT2 cells. By combining analysis of our scRNA-seq and ATAC-seq analysis, we identified a surface marker Kdr/Flk-1 that is specifically expressed in mouse secretory cells (Extended Data Fig.10a,b), which is also supported by previous studies41,42. Flow cytometry analysis confirmed that Kdr expression specifically marks secretory cells in the mouse lung (Extended Data Fig.10c-e). We further confirmed the expression of KDR in secretory cells of human distal lung tissue, which is also supported by recent scRNA-seq data43,44 (Fig. 7a and Extended Data Fig. 10f,g). In combination with a human AT2 cell-specific surface marker HTII-280, we were able to sort KDR+HTII-280– cells by flow cytometry analysis (Fig. 7b). Further analysis of cytospin and qPCR analysis on freshly isolated KDR–HTII-280+ and KDR+HTII-280– populations revealed that CC10+ secretory cells were specifically enriched in the KDR+ population (Fig. 7c-e). KDR+HTII-280– population could form organoids consisting of secretory cells and ciliated cells, with a few basal cells in our culture conditions (Fig. 7f, See Method).
Figure 7. Differentiation plasticity of secretory cells into AT2 cells by inhibition of Notch signalling in human lungs.
a, IF images showing the expression of KDR in secretory cells in the lung from normal donors. CC10 (red), KDR (white), and DAPI (blue). White boxed insets show high-power view. Scale bar, 50μm and 10μm (inset). b, Representative flow cytometry analysis for isolation of KDR+HTII-280− or KDR−HTII-280+ cells. c, Representative IF images of cytospin staining from freshly sorted KDR−HTII-280+ or KDR+HTII-280− population. SPC (for AT2 cells, red), p63 (for basal cells, white), CC10 (for secretory cells, green) and DAPI (blue). Scale bars, 100μm. d, Quantification of SPC+, CC10+, and Act-Tub+ cells revealed in cytospin staining from KDR−HTII-280+ or KDR+HTII-280− cells in Fig. 7c. e, qPCR analysis of the markers for secretory (SCGB1A1 and SCGB3A2) and AT2 (SFTPC, ETV5, and LAMP3) cells in freshly isolated KDR+HTII-280− (red bars) or KDR−HTII-280+ (white bars) cells. Individual dots represent individual experiments (n=2 biological replicates). f, Representative IF images of KDR+ cell-derived organoids at first passage. CC10 (green), Act-Tub (red), KRT5 (white), and DAPI (blue). Scale bar, 50μm. g, Representative bright-field images of organoids derived from KDR+HTII-280− cells with or without DAPT treatment (20μM) at passage 1. Scale bar, 2,000μm. h, qPCR analysis of the markers for secretory cells (SCGB1A1 and SCGB3A2) and AT2 cells (SFTPC, ETV5, and LAMP3) in organoids derived KDR+HTII-280− cells without (white bars) or with DAPT treatment (red bars). Each individual dot represents individual biological replicate (n=3) and data are presented as mean ± s.e.m. Statistical analysis was performed using two-tailed unpaired Student’s t test; P-values are indicated in the figure. i, Representative IF images of KDR+ cell-derived organoids treated with DMSO or DAPT (20μM). CC10 (green), SPC (red), and DAPI (blue). Scale bar, 50μm. j, Quantification of the frequency of SPC+ cells in the control or DAPT treated organoids. Each individual dot represents one organoid and data are presented as mean ± s.e.m (n=20 organoids, pooled from 3 mice). Statistical analysis was performed using two-tailed unpaired Student’s t test; p<0.0001.
Given that human secretory cells also showed higher Notch activity (e.g. HES1 expression) similar to mouse tissue (Extended Data Fig. 10f), we inhibited Notch activity by treating organoids derived from KDR+HTII-280– cells with DAPT to investigate the differentiation potential of human secretory cells into AT2 cells. Notably, Notch inhibition promoted the generation of AT2 cells at the expense of secretory cells in DAPT-treated organoids (Fig. 7g-j). We barely observed any significant alterations in other lineages such as ciliated cells and basal cells (Extended Data Fig. 10h-j). Overall, our data suggest that KDR+ secretory cells share a conserved key molecular component of Notch signalling in governing alveolar regeneration of human and mouse lungs.
Discussion
Spatiotemporal dynamics of stem and progenitor cells ensure the rapid and efficient process of tissue repair for the reconstruction of epithelial integrity and function. In response to severe lung injury, secretory cells localised in the distal airway mobilise and differentiate into AT2 cells to compensate for the loss of alveolar epithelium and restore alveolar function. However, the cellular events and regulatory networks directing the differentiation plasticity of secretory cells, and the identity of the functional niches during this process, have been largely elusive. Particularly, how secretory cells are activated and acquire differentiation plasticity is unknown. Here, our data reveal two sequential stages of secretory cell fate conversion into AT2 cells during alveolar regeneration. Loss of Notch activity mediated by IL-1β signalling in ciliated cells reprograms the secretory cells to lose their identity upon injury. Fosl2/Fra2-mediated AP-1 transcription factor then drives the fate conversion of secretory cells into AT2 cells. Furthermore, using scRNA-seq and ATAC-seq analysis, we identified that secretory-derived AT2 cells retain the airway lineage identity in both a genetic and epigenetic manner, and have greater functional capacity of long-term maintenance in vitro compared to resident AT2 cells. By identifying a surface marker KDR/FLK-1 of human secretory cells, we propose that functionally equivalent human secretory cells are capable of contributing to alveolar lineages post injury via Notch signalling.
In this study, we uncovered the role of Notch signalling as a key regulator in reprogramming secretory cells to acquire differentiation plasticity post alveolar injury. Constitutive activation of Notch signalling substantially blocked AT2 cell differentiation from secretory cells post injury, by arresting cells at the intermediate state expressing high levels of Cdkn1c/p57 expression. Notably, the intermediate population is specifically marked by the expression of Fstl1 that has been known to antagonize BMP signalling45. Given the functional role of BMP signalling in facilitating proximal epithelium with a concurrent reduction in the distal epithelium during lung development45,46, impaired alveolar regeneration in constitutive Notch activity could be connected to compromised proximal-distal patterning. It would be interesting to further define the presence of Fstl1-like populations in lung development, and whether alveolar regeneration reflects the developmental stages.
We identified Fra2/Fosl2, which together comprise the heterodimeric AP-1 transcription factor, as an essential driver for the fate conversion of secretory cells into AT2 lineages. Further, previous study also showed that Fosl2 is a functional target of Rbpj, a key mediator of Notch signalling, and several regulatory regions of AT2 markers, including Sftpc, are directly occupied by Fosl2 47. Importantly, Fosl2-deficient secretory cells failed to acquire AT2 cell differentiation in the presence of DAPT, however decreased secretory cells were not recovered. Further, Fosl2 KD didn’t influence the cell fate of secretory cells without Notch inhibition. These data suggest that Notch inhibition coordinates the cell fate decisions of secretory cells into AT2 lineages in two stages: 1) loss of secretory cell identity and 2) acquisition of transcriptional programmes for AT2 cell differentiation (Extended Data Fig. 10k). Our data revealed that Fosl2 is required for AT2 cell conversion, but dispensable for the loss of secretory cell identity. Other candidates, such as Foxc2 and Six1, that occupy the regulatory region of secretory cell-specific genes and are substantially downregulated by Notch inhibition (Fig.5d), could be tested for potential roles in regulating the maintenance of secretory cell identity.
Notch inhibition has been reported to promote the differentiation of secretory cells into ciliated cells in lung development and homeostatic adult lungs, although there are some differences in the incidence of ciliated cell differentiation, potentially due to different contexts or model systems25–27. In this study, we demonstrated that, during alveolar regeneration after injury, Notch inhibition facilitated the fate conversion of secretory cells into AT2 cells via IL-1β-Notch-Fosl2 axis. How does Fosl2 regulate this process? Interestingly, withdrawals of WNT signalling-inducing factors, including Wnt3a and R-spondin-1, in our organoid cultures, showed a dramatic increase in ciliated cells at the expense of secretory cells in DAPT-treated organoids (Extended Data Fig.10l). AT2 cells were barely observed in these organoids (Extended Data Fig.10l). This result suggests that Notch and WNT signalling likely function cooperatively in secretory cells differentiating to AT2 cells. Indeed, previous studies showed increased expression of Wnt ligands in mesenchymal cells during alveolar regeneration after injury19,48. Further analysis of scRNAseq from our previous study31 revealed that Wnt ligands, such as Wnt5a and Wnt7b, were highly upregulated at day 14 and returned back to homeostatic levels at day 28 post bleomycin injury (Extended Data Fig.10m). Notably, however, Fosl2-KD secretory cells failed to generate AT2 cells even in the presence of Wnt activity (Fig. 5g). Given these results, it is likely that increased Wnt ligands from mesenchymal cells, in parallel with Notch-mediated Fosl2 activity, may cooperatively confer differentiation potential of secretory cells into AT2 lineages, via independent regulatory axes, during alveolar injury repair. While Fosl2 was identified as a key factor in the axis of Notch signalling, further identification of interacting partners regulated by Wnt signalling will uncover the molecular networks governing the fate decision of secretory cells into ciliated or AT2 cells in homeostasis and regeneration.
We found that secretory cell-derived AT2 (sAT2) cells display distinct features compared to resident AT2 (rAT2) cells. sAT2 cells still retained some airway lineage identity based on the higher expression of secretory cell markers such as Sox2, whereas most genetic and epigenetic signatures of genes, including canonical AT2 cell markers such as Sftpc, are shared with rAT2 cells. Notably, sAT2 cells are capable of long-term self-renewal compared to rAT2 cells in in vitro organoids, which may be attributed to the enriched signatures of anti-apoptotic functions such as Slc7a11 and Nr4a2 in sAT2 cells compared to rAT2 cells. sAT2 cells may have a higher tolerance for severe alveolar insults than rAT2 cells, enabling them to replenish damaged alveolar epithelium more efficiently. Notably, in chronic lung diseases such as pulmonary fibrosis and lung cancer, the destruction of alveolar structure with bronchiolization is a common feature49,50. Moreover, AT2 cells expressing airway-restricted genes such as Sox2 were also seen in fibrosis patients51. Given our findings, it would be interesting to explore further whether the genetic and epigenetic memory of sAT2 cells contributes to this pathologic phenotype after injury resolution.
The loss of alveolar integrity is a life-threatening and key pathologic feature of various chronic lung diseases. Recent studies suggested the regenerative potential of human AT2 cells using an in vitro organoid model, yet their capacity to generate new alveolar epithelium seems limited22,23. In particular, the functional capacity of human airway secretory cells to contribute to alveolar lineages has never been explored, largely due to the lack of information for isolation and culture of secretory cells in vitro. Here we provide the potential progenitor capacity of secretory cells in self-renewal and generation of AT2 cells, by establishing a feeder-free organoid culture of human secretory cells. We furthermore demonstrated that KDR+ secretory cells in human lungs have the differentiation plasticity to give rise to AT2 cells, which is also regulated by Notch signalling, as we demonstrated in mouse lungs. Our findings provide a solid foundation for further studies of the potential role of these cells in chronic lung diseases.
In summary, our results identify the molecular and cellular mechanisms of the cross-compartment contribution of airway secretory cells to the regeneration of the alveolar epithelium after lung injury. The presence of conserved markers and ease of cultivation of both mouse and human secretory cells provide a unique opportunity for mechanistic studies to shed light on human lung progenitor cell biology and assist in developing treatments for acute and chronic lung diseases. Our study also provides clues for the potential therapeutic targets of Notch signalling in lung diseases caused by defective and dysregulated alveolar regeneration.
Methods
This study complies with all relevant ethical regulations for which approval of the institutional review board and the ethics committee of the University of Cambridge and Cambridge Stem Cell Institute.
Animals
Scgb1a1-CreERTM 13, Sftpc-CreERT2 8, Foxj1-CreERT2 32, Red2-NotchN1ICD 28, Rosa26R-CAG-fGFP 13, Rosa26R-lox-stop-lox-tdTomato 52, and Il1r1flox/flox 53 mice have been described and are available from Jackson Laboratory. Il1r1-P2A-eGFP-IRES-CreERT2 (Il1r1-CreERT2)31. To monitor SPC-expressing AT2 cells, we generated Sftpc-IRES-DTR-P2AdsRed (Sftpc-dsRedIRES-DTR) reporter mouse where IRES-DTR-P2A-dsRed construct is inserted into 3’-UTR region of endogenous Sftpc gene. Mice for the lineage tracing and injury experiments were on a C57BL/6 background and 6-10 week old mice were used for most of the experiments described in this study. Mice were bred and maintained under specific-pathogen-free conditions at Gurdon Institute of University of Cambridge under the guidance of UK Home Office project license PC7F8AE82.
Cell lines
HEK129T cells were purchased from ATCC (CRL-3216) and maintained in Dulbecco’s Modified Eagle medium (DMEM) with 10% FBS (Gibco) and antibiotics (penicillin and streptomycin).
Tamoxifen
Tamoxifen (Sigma) was dissolved in Mazola corn oil (Sigma) in a 20 mg/ml stock solution. 0.2 mg/g body weight tamoxifen was given via intraperitoneal (IP) injection. The numbers and date of treatment are indicated in the individual figures of each experimental scheme.
Bleomycin administration
6-10 week-old mice were anesthetised via inhalation of isoflurane for approximately 3 mins. The mice were positioned on the intratracheal intubation stand, and bleomycin (1.25 U/kg) or PBS were delivered intratracheally by a catheter (22G). During the procedure anaesthesia was maintained by isoflurane and oxygen delivery.
Mouse lung tissue dissociation and flow cytometry
Lung tissues were dissociated with a collagenase/dispase solution as previously described31. Briefly, after lungs were cleared by perfusion with cold PBS, 2 ml of dispase (BD Biosciences, 50Uml) was instilled into the lungs through the trachea until the lungs inflated. Each lobe was dissected and minced into small pieces in a conical tube containing 3 ml of PBS, 60 μl of collagenase/dispase (Roche), and 7.5 μl of 1% DNase I (Sigma) followed by rotating incubation for 45 min at 37°C. The cells were then filtered sequentially through 100- and 40-μm strainers and centrifuged at 1500 rpm for 5 min at 4°C. The cell pellet was resuspended in 1ml of RBC lysis buffer (ACK buffer, 0.15M NH4Cl, 10mM KHCO3, 0.1mM EDTA) and lysed for 2 min at room temperature. 8 ml basic F12 media (GIBCO) was added and 500μl of FBS (Hyclone) was slowly added in the bottom of tube. Cells were centrifuged at 1500 rpm for 5 min at 4°C. The cell pellet was resuspended in PF10 buffer (PBS with 10% FBS) for further staining. The antibodies used were as follows: CD45 (30-F11)-APC or -APC-Cy7 (BD Biosciences), CD31 (MEC13.3)-APC (BD Biosciences), EpCAM (G8.8)-PE-Cy7 or FITC (BioLegend), and CD24 (M1/69)-APC (eBioscience), MHC-II (I-A/I-E, M5)-FITC or -APC-Cy7 (eBioscience), and CD309/Kdr/Flk-1 (7D4-6)-APC (BioLegend). 4’, 6-diamidino-2-phenylindole (DAPI) (Sigma) was used to eliminate dead cells. Data were acquired on LSRII analyser (BD Bioscience) and then analysed with FlowJo software (Tree Star).
Human lung tissue dissociation and flow cytometry
Human lung tissues were cleared by perfusion with cold PBS and cut into small pieces. Tissue was transferred to 10 ml of digestion buffers (2 ml of dispase II (Sigma), 100 μl of collagenase/dispase (Roche), 100 μl of 1% DNase I (Sigma), and 7.8 ml of PBS), followed by rotating incubation for 1hr at 37°C. The cells were then filtered through 40 μm strainers and centrifuged at 1500 rpm for 5min at 4°C. The cell pellet was resuspended in 1ml of RBC lysis buffer and lysed for 5 min at room temperature. 10ml basic F12 media (GIBCO) was added and 500μl of FBS (Hyclone) was slowly added in the bottom of tube. Cells were centrifuged at 1500rpm for 5 min at 4°C. The cell pellet was resuspended in PF10 buffer for further staining. The antibodies used were as follows: CD45 (2D1)-APC (BioLegend), CD31 (VM59)-APC (BioLegend), EpCAM (9C4)-FITC (BioLegend), HTII-280-mouse IgM (Terrace Biotech), Purified CD309/KDR (A16085H), anti-mouse IgG1 (RMG1-1)-APC-Cy7 (BioLegend), and anti-mouse IgM (Il/41)-PE (eBioscience). 4’, 6-diamidino-2-phenylindole (DAPI) (Sigma) was used to eliminate dead cells. Flexible BD InfluxTM cell sorter were used for the sorting at Cambridge NIHR BRC Cell Phenotyping Hub and data were analysed with FlowJo software (Tree Star).
Human Tissues
For the establishment of human lung organoids and histological analysis, human lung tissues from deidentified lungs not required for transplantation were obtained from adult donors with no pathologies from Papworth Hospital Research Tissue Bank (T02233). Human lung tissues were also obtained from patients undergoing lobectomy surgery at University College London with written informed consent from approval of the ethical committee (UCL:06/Q0505/12). Appropriate Human Tissue Act (HTA) guidance was followed.
In vitro feeder-free organoid culture and passages
Freshly sorted lineage-labelled cells from Scgb1a1-CreERTM/+;R26RtdTomato/+ or Sftpc-CreERT2;R26RtdTomato/+ mice were resuspended in basic medium (AdDMEM/F12 (Invitrogen) supplemented with B27 (Invitrogen), 1mM N-Acetylcysteine (Sigma), 10 mM Nicotinamide (Sigma)). Cells were mixed with growth factor-reduced (GFR)-Matrigel (BD Biosciences) at a ratio of 1:1. A 100 μl mixture was placed in a 24-well Transwell insert with a 0.4 μm pore (Corning). Approximately 10×103 epithelial cells were seeded in each insert. After GFR-Matrigel formed a gel, 500 μl of culture medium (basic medium supplemented with the growth factors: 50 ng/ml murine EGF (Life Technology), 100 ng/ml human FGF7/KGF (Peprotech), 100 ng/ml human FGF10 (Peprotech), 50% WNT3A-conditioned media (provided by Tissue Core Facility of Cambridge Stem Cell Institute), 10% RSPO1-conditioned media (provided by Tissue Core Facility of Cambridge Stem Cell Institute), 100 ng/ml Noggin (Peprotech)) was placed in the lower chamber. Medium was changed every other day and ROCK inhibitor Y27632 (10 μM, Sigma) was added in the medium for the first 2 days of culture. Passage was performed once per 2 weeks. For passages, organoids were removed from the Matrigel by incubation with dispase (1 mg/ml) for 40 mins at 37 °C, followed by dissociation into single cells using trypLE (Gibco) treatment for 5min at 37°C. 5~10×103 cells were transferred to fresh GFR-Matrigel in 24-well Transwell insert. For organoid culture from a single cell with limiting dilution, FACS-sorted cells were plated into 48-well plates (Corning) with one cell per well. Every dilution was replicated in 48-well plates (Corning) for two independent experiments. Single cells imbedded in Matrigel were monitored at microscope with RFP channels to check the expression of Tomato expression.
For human KDR+ cell culture in organoids, approximately 10×103 epithelial cells were resuspended in a 20 μl of 100% GFR-Matrigel and seeded in 48 well plates, followed by 30 min incubation at 37 °C for solidification. Then, 250μl of airway cell culture medium (basic medium supplemented with the growth factors: murine EGF (50 ng/ml, Life Technology), human FGF7/KGF (100 ng/ml, Peprotech), human FGF10 (100 ng/ml, Peprotech), Noggin (100 ng/ml, Peprotech), A83-01 (1μM, Tocris), SB202190 (1μM, Tocris) was added to each well. To avoid the growth of fungal and bacterial infection, 250 ng/mL Amphotericin B and 50 μg/mL gentamicin were added to culture medium. For culture with DAPT treatment in Fig.7g, organoids cultured for 8 days with airway cell culture medium were followed by inclusion of CHIR99021 (2μM, Tocris) for additional 10 days with or without DAPT (20μM). Medium was changed every 3-4 days and ROCK inhibitor Y27632 (10μM, Sigma) was added in the medium for the first 4 days of culture. Passage was performed once per 3 weeks.
Knockdown construct and retroviral infection to organoids
For sequence-specific knockdown of candidate genes, target sequences were cloned into MSCV-LTRmiR30-PIG (LMP, Open Biosystems) retroviral vectors or pLKO.1-puro lentiviral vector. To generate retroviruses for infection into cells, the HEK293T cells were transfected using a standard calcium phosphate protocol with vectors expressing GFP alone (Control-RV), GFP plus short-hairpin against target genes. Viral supernatants were harvested 2 days later. Secretory-derived organoids of passages between 15 and 20 were prepared after recovery from GFR-Matrigel (BD Biosciences) by treatment of dispase (1 mg/ml) for 40 min at 37°C, followed by dissociation into single cells using trypLE (Gibco) treatment for 5 min at 37°C. Single cells dissociated from established organoids were infected with the viral supernatants in the presence of polybrene (Sigma, 8μg/ml) by spin infection for 90 min at 2400 rpm at 32°C. This procedure was repeated twice every day. Short-hairpin sequences for target genes are listed in Supplementary Table 1.
In vitro lung organoid co-culture with established stromal cells
Freshly sorted lineage-labelled cells were resuspended in culture medium (3D basic medium (DMEM/F12, Gibco) supplemented with 10% FBS. (Gibco) and ITS (Insulin-Transferrin-Selenium, Corning)), and mixed with cultured lung stromal cells negatively isolated by microbeads of CD326/EpCAM, CD45, and CD31 via MACS (Miltenyi Biotech), followed by resuspension in GFR-Matrigel (BD Biosciences) at a ratio of 1:5. A 100 μl mixture was placed in a 24-well Transwell insert with a 0.4 μm pore (Corning). Approximately 5×10³ epithelial cells were seeded in each insert. 500 μl of culture medium was placed in the lower chamber, and medium was changed every other day. ROCK inhibitor Y27632 (10μM, Sigma) was added in the medium for the first 2 days of culture. Analysis of colony forming efficiency and size of organoids was performed at 14 days after plating if there is no specific description.
In vitro culture of ciliated cells for IL-1β treatment
CD24highTomato+ ciliated cells were isolated from Il1r1-CreERT2 mice at day 4 after four doses of tamoxifen treatment. Purified 20,000 cells were embedded in GFR-Matrigel with PBS or IL-1β (10ng/ml) for 24 hrs. RNA was isolated to analyse the expression of Jag1 or Jag2.
Transplantation of Scgb1a1 + lineage-labelled cells
Freshly sorted 20,000 cells of CD45−EpCAM+Tomato+MHCII− cells from Scgb1a1-CreERTM/+;R26RtdTomato/+ or dnMAMLflox/+;Scgb1a1-CreERTM/+;R26RtdTomato/+ mice were mixed with lung stromal cells isolated from WT mice (20,000 cells) to support epithelial cell survival during engraftment, and were transplanted into WT C57BL/6 mice at day 7 after bleomycin injury (1.25 U/kg). Lungs were analysed at day 14 post injury to determine the differentiation of engrafted cells.
Quantitative RT-PCR
Total RNA was isolated using a Qiagen RNeasy Mini-plus Kit according the manufacturer’s instructions. Equivalent quantities of total RNA were reverse-transcribed with SuperScript IV cDNA synthesis kit (Life Technology). Diluted cDNA was analysed by real-time PCR (StepOnePlus; Applied Biosystem). Pre-designed probe sets (Thermo Fisher Scientific) were used as follows: human SCGB1A1 (Hs00171092_m1), human SFTPC (Hs00951326_g1), and Human FOXJ1 (Hs00230964_m1). ACTB expression (Hs01060665_g1) was used to normalise samples using the ΔCt method. Sybr green assays were also used for human or mouse gene expression with SYBR Green Master Mix (2x, Thermo Fisher Scientific). Primer sequences are listed in Supplementary Table 2:
Cytospin, Immunofluorescence, and immunohistochemistry
Mouse lung tissues were perfused, inflated, and fixed with 4% PFA for 2 hrs at 4°C. Cryosections (8-12 μm) and paraffin sections (7 μm) were used for histology and Immunofluorescence (IF) analysis. Cultured colonies from organoids were fixed with 4% PFA for 2 hrs at room temperature followed by immobilisation with Histogel (Thermo Scientific) for paraffin embedding. For cytospin staining, isolated 2,000 cells were resuspended in 250 μl of PBS supplemented with 10% FBS, followed by spinning in pre-wet cytospin funnels at 600 rpm for 5min. Sectioned lung tissues or colonies were stained with hematoxylin and eosin (H&E) or immunostained: after antigen retrieval with citric acid (0.01M, pH 6.0), blocking was performed with 5% normal donkey serum in 0.2% Triton-X/PBS at room temperature for 1hr. Primary antibodies were incubated overnight at 4°C at the indicated dilutions: Goat anti-CCSP/CC10 (T-18) (1:200, Santa Cruz Biotechnology Inc., sc-9772), Mouse anti-CCSP/CC10 (E11) (1:200, Santa Cruz Biotechnology Inc., sc-365992), Goat anti-SP-C (1:200, Santa Cruz Biotechnology Inc., sc-7706), Rabbit anti-pro-SP-C (1:300, Millipore, AB3786), Mouse anti-Acetylated Tubulin (6-11B-1) (1:300, Sigma-Aldrich, T7451), Hamster anti-PDPN (1:300, DSHB, 8.1.1), Rabbit anti-KRT5 (1:300, BioLegend, 905501), Mouse anti-P63 (1:200, Abcam, ab735), Rabbit anti-PORCN (1:100, Abcam, ab201793), Rabbit anti-P57/KIP2 (1:100, Abcam, ab75974), Rabbit anti-RFP (1:250, Rockland, 600–401379), Rabbit anti-HOPX (1:100, Santa Cruz Biotechnology Inc., sc-30216), Rabbit anti-HES1 (1:200, D6P2U, #11988, Cell Signaling), Rabbit anti-NOTCH1 (1:50, Abcam, ab52627), Mouse IgM anti-HT2-280 (1:300, Terrace Biotech, TB-27AHT2-280), Rat anti-human SCGB1A1/CC10 (1:200, R&D system, MAB4218), Rabbit anti-KDR/VEGFR2 (1:100, Cell Signaling, 2479). Alexa Fluor-coupled secondary antibodies (1:500, Invitrogen) were incubated at room temperature for 60 min. After antibody staining, nuclei were stained with DAPI (1:1000, Sigma) and sections were embedded in RapiClear® (SUNJin Lab). Fluorescence images were acquired using a confocal microscope (Leica TCS SP5). All the images were further processed with Fiji software. For immunohistochemical staining of Jag1, Anti-human JAG1 antibody was used (1:100, Santa Cruz Biotechnology Inc., sc-390177). Slides were developed by using mouse IgG VECTASTAIN Elite ABC kit (Vector Laboratories). Slides were counterstained with haematoxylin.
Cell counting and image analysis
Sections included in cell scoring analysis for lung tissue were acquired using Leica TCS SP5 confocal microscope. At least six different sections under 10X magnification including at least 8 different alveolar regions from individual mice indicated in the figures per group were used. Cell counts were performed on ImageJ using the ‘Cell Counter’ plug-in and the performer was blinded to the specimen genotype and condition. At least two step sections (30μm apart) per individual well were used for quantification of organoids.
RNA-sequencing analysis
RNA-seq were performed for global gene expression profiles in ACOs, and SCOs with or without DAPT treatment. Total RNAs were extracted using the RNeasy Plus Mini Kit following the manufacturer’s instructions. 100 ng of total RNA was used to generate RNA-seq library using NEBNext Ultra RNA Library prep kit (NEB, E7530L) according to the vendor’s protocol. Briefly, mRNAs were purified from total RNAs with Magnetic mRNA Isolation Kit (oligo(dT) beads) and fragmented. First and second strand cDNAs were synthesized subsequently. The double strand cDNAs were purified, and then the ends of cDNAs were repaired and ligated with sample-specific barcodes. RNA-seq libraries were sequenced using an Illumina NextSeq 500 machine. Single-ends reads from RNA-seq were aligned to the reference mouse genome (mm10) using STAR (v2.5.2b). The python package HTSeq (https://htseq.readthedocs.io/en/master/) was used to generate read counts for each gene. The read counts were analysed by the R package DESeq2 (v1.28.0)54 and regularized log transformed using the rlog function. Adjusted p-values (p.adj) for DEG were determined by Benjamini and Hochberg correction. The p.adj < 0.01 required to consider differentially expressed genes. Heat maps were generated using Java Treeview (v1.1.6r4).
ATAC-sequencing analysis
The ATAC-seq assay was performed in two biological replicates for each sample of 50,000 FACS-purified cells. The quality of data from ATAC-seq was tested using FASTQC. The adapter sequences were contained in raw data. Therefore, NGmerge55 was used for adapter trimming. 150 bp paired-ends adapter trimmed reads were aligned against the mouse genome assembly (mm10) using bowtie2 (v2.3.4.1). We performed peak calling using MACS2 (v2.1.2) with default parameters for paired ends. Statistically significant differential open chromatin regions were determined using MAnorm (v1.1.4)56, which normalises read density levels and calculates p-values by MA plot methods. The heat maps and the Spearman correlation map of ATAC-seq signals were generated using deepTool257. Genome browser images were generated using the Integrative Genomics Viewer (IGV) 2.7.258 with bedGraph files processed from MACS2. The ATAC-seq peaks were mapped to the region surrounding 20 Kb up- and 2 Kb down-stream of the TSS of all genes from refFlat file (mm10, UCSC). All assigned genomic features from one open region were used. To describe the distribution of genes, a promoter was defined as a region within 2 Kb from the TSS, a proximal promoter region was defined as a region between 2 Kb and 20 Kb upstream from the TSS. Mapping sites other than promoter, proximal promoter, exon, or intron were considered as intergenic target loci. To identify the cell-type specific enriched motifs in the differential open chromatin regions from ATAC-seq data, we performed motif enrichment analysis using the findMotifsGenome.pl program in the HOMER software (v4.11)59. The regions were adjusted to the same size with 200 bp centred on each differential peak.
Gene ontology (GO) analysis
The gene ontology (GO) term enrichment analysis was performed using GREAT (v4.0.4)60 with mouse genome assembly (mm10), and whole genomes for background regions in default setting from ATAC-seq data. Gene Ontology tool61,62 was used for a set of gene target of the differential open regions.
Gene set enrichment analysis (GSEA)
GSEA was carried out by using the Gene Ontology term gene sets provided by the Mouse Genome Informatics website (http://www.informatics.jax.org)63. Entire detectable genes derived from RNA-seq were used for GSEA. We followed the standard GSEA user guide (http://www.broadinstitute.org/gsea/doc/GSEAUserGuideFrame.html).
scRNA-seq library preparation and sequencing
For lineage-labelled cells from Red2-NotchN1ICD mice, YFP+CD45–CD31–EpCAM+ or RFP+CD45–CD31–EpCAM+ cells were sorted at day 28 post bleomycin injury (4 mice were pooled for each experiment). For non-lineage-labelled cells isolated from Red2-NotchN1ICD mice in parallel with experiment of lineage-labelled cells, we combined the cells of EpCAM+RFP–YFP– and EpCAM– population with a ratio of 1:1, respectively. The resulting cell suspension were submitted as separate samples to be barcoded for the droplet-encapsulation single-cell RNA-seq experiments using the Chromium Controller (10X Genomics). Single cell cDNA synthesis, amplification, and sequencing libraries preparation were performed using the Single Cell 3’ Reagent Kit as per the 10x Genomics protocol.
Alignment, quantification and quality control of scRNA-seq data
Droplet-based sequencing data were aligned using the Cell Ranger Single-Cell Software Suite (version 2.0.2, 10x Genomics Inc) with the Mus musculus genome (GRCm38) (official Cell Ranger reference, version 1.2.0), as previously described31. Cells were filtered by custom cutoff (more than 500 and less than 7000 detected genes, more than 2000 UMI count) to remove potential empty droplets and doublets. Downstream analysis included data normalisation, highly variable gene detection, log transformation, principal component analysis, neighbourhood graph generation and Louvain graph-based clustering, which was done by python package scanpy (version 1.5.1)64 using default parameters.
Statistics and reproducibility
Statistical analyses were performed with Prism software package version 7.0 (GraphPad). Statistical significance was calculated using two-tailed unpaired Student’s t test or Two-way ANOVA. Specific test methods and P-values are indicated in figure and legends. Sample size for animal experiments was determined based upon pilot experiments. Mice cohort size was designed to be sufficient to enable accurate determination of statistical significance. No animals were excluded from the statistical analysis. Mice were randomly assigned to treatment or control groups, while ensuring inclusion criteria based on gender and age. Animal studies were not performed in a blinded fashion. The number of animals shown in each figure is indicated in the legends as n = x mice per group. Data shown are representative from at least duplicates or more than three independent experiments, or combined from three or more independent experiments as noted and analysed as mean ± s.e.m.
Extended Data
Extended Data Fig. 1. Establishment of feeder-free organoids derived from AT2 cells.
a, Schematics of experimental design for isolation of Sftpc lineage-labelled AT2 cells at indicated time points after tamoxifen treatment. b, Representative bright-field images of organoids derived from lineage-labelled Tomato+Sftpc+ cells in indicated conditions; complete medium with WNT3A, RSPO1 (R-spondin 1), EGF, FGF7, FGF10, and NOG (Noggin), withdrawal of indicated factors (–FGF10, –FGF7, or –WNT3A/RSPO1). Scale bar, 2,000μm. c, d, Statistical quantification of colony forming efficiency (c, n=5) and passaging numbers (d, n=5) of organoids. Each individual dot represents individual biological replicate and data are presented as mean and s.e.m. Statistical analysis was performed using two-tailed unpaired Student’s t test; n.s; not significant. e, Representative serial bright-field images of a lung organoid growing originated from single Tomato+Sftpc+ cells at the indicated time points. Magnifications: X20 (day 4 and 7), X10 (day10 and 13), and X4 (day 16, 20, and 30). Scale bars, 400μm. f, A representative immunofluorescence (IF) image of organoids derived from Tomato+Sftpc+ cells at the first passage under feeder-free condition with complete culture medium. SPC (for AT2 cells, red), Pdpn (for AT1 cells, green), and DAPI (blue). Scale bars, 50μm. g, Representative bright-field images of organoids under feeder-free condition with complete culture medium at passage 5. Insets (left) show high-power view (right). Scale bars, 2,000μm. h, Representative IF images of mixed organoids cultured in complete medium at passage >5. SPC (red), Hopx (white), and DAPI (blue). Scale bars, 50μm.
Extended Data Fig. 2. Interference of Notch activity in secretory cell-derived organoids (SCOs) enhances the differentiation into AT2 lineages.
a, Representative IF images showing nuclear localisation of intracellular domain of Notch 1 (N1ICD) in SCOs at passage 5 with or without DAPT (20μM). CC10 (red), N1ICD (white), and DAPI (blue). Scale bars, 50μm. b, qPCR analysis of gene expression in control (control KD) or Rbpj knock-downed (Rbpj KD) organoids. Each individual dot represents one individual experiment (n=4 biological replicates) and data are presented as mean ± s.e.m. Statistical analysis was performed using two-tailed unpaired Student’s t test; P-values are indicated in the figure. c, Representative IF images of control KD or Rbpj KD organoids: CC10 (green), SPC (red), and DAPI (blue). Scale bars, 50μm. d, Representative IF images showing Hes1 expression in lineage-labelled secretory cells after tamoxifen treatment in the indicated genotype: Tomato (for Scgb1a1 lineage, red), Hes1 (white), and DAPI (blue). Scale bars, 50μm. e, qPCR analysis of Hes1 expression in isolated EpCAM+Tomato+. Each individual dot represents one individual experiment (n=2 individual biological replicate). f, Representative IF images showing the derivation of lineage-labelled Act-Tub+ ciliated cells in PBS- or bleomycin-treated lungs of Scgb1a1-CreERTM/+;R26RtdTomato/+ or dnMAMLflox+;Scgb1a1-CreERTM/+;R26RtdTomato/+ mice. Tomato (for Scgb1a1 lineage, red), Acetylated-Tubulin (Act-Tub, green), and DAPI (blue). Scale bar, 50μm. g, Statistical quantification of lineage-labelled ciliated cells: n=19 sections (PBS), n=20 sections (Bleo), pooled from 2 mice for Scgb1a1-CreERTM/+;R26RtdTomato/+ ; n=20 sections (PBS) and n=20 sections (Bleo), pooled from 2 mice for dnMAMLflox/+;Scgb1a1-CreERTM/+;R26RtdTomato/+’).
Extended Data Fig. 3. Organoid co-culture shows enhanced differentiation of secretory cells into AT2 cells by downregulation of Notch activity.
a, Experimental design for isolation of lineage-labelled secretory cells from Scgb1a1-CreERTM/+;R26RtdTomato/+ and dnMAMLfloX+;Scgb1a1-CreERTM/+; R26RtdTomato/+ mice at indicated time points after tamoxifen treatment. b, Representative fluorescent images of organoids derived from control or dnMAML-expressing lineage-labelled secretory cells. 5,000 cells of lineage-labelled secretory cells (Tomato+EpCAM+CD45-CD31-) isolated from Scgb1a1-CreERTM/+;R26RtdTomato/+ or dnMAMLflox/+;Scgb1a1-CreERTM/+;R^26RtdTomato/+ mouse lungs were co-cultured with stromal cells with 1:5 ratio for 14 days. Arrowheads point to cystic airway-like organoids. Scale bar, 2,000μm. c, Statistical quantification of colony forming efficiency of organoids. Each individual dot represents one biological replicate (n=5 for control, n=6 for dnMAMLflox/+) and data are presented as mean and s.e.m. Statistical analysis was performed using two-tailed unpaired Student’s t test; n.s; not significant. CFE; Colony forming efficiency units. d, Representative IF images of three distinctive types of organoids derived from control secretory cells; Airway organoids (CC10+SPC-; denoted as 1), Alveolar organoids (CC10-SPC+; denoted as 2), and Mixed organoids (CC10+SPC+; denoted as 3). CC10 (for secretory cells, red), SPC (for AT2 cells, white), and DAPI (blue). Insets (1, 2 and 3) show high-power view. Scale bars, 50μm and 10μm (in high-power view). e, Representative IF images of alveolar organoids derived from dnMAML-expressing secretory cells. CC10 (for secretory cells, red), SPC (for AT2 cells, white), and DAPI (blue). Insets show high-power view. Scale bars, 50μm (10μm in high-power view). f, Quantification of each organoid types derived from Scgb1a1-CreERTM/+;R26RtdTomato/+ or dnMAMLfloX+;Scgb1a1-CreERTM/+;R26RtdTomato/+ mice in (d and e); Airway organoids (CC10+SPC-; red), Alveolar organoids (CC10-SPC+; blue), and Mixed organoids (CC10+SPC+; grey). Data are presented as mean and s.e.m (n=3 biological replicates). Statistical analysis was performed using two-tailed unpaired Student’s t test; *p=0.0358. g, qPCR analysis of markers for secretory (Scgb1a1, Scgb3a2, Gabrp, Cldn10, and Cyp2f2) and AT2 (Sftpc, Etv5, Lamp3, Lpcat1, and Abca3) cells in organoids isolated from Scgb1a1-CreERTM/+;R26RtdTomato/+ (black bars) and dnMAMLflox/+;Scgb1a1-CreERTM/+; R26RtdTomato/+ mice (white bars). Data are presented as mean ± s.e.m (n=3 biological replicates). Statistical analysis was performed using two-tailed unpaired Student’s t test; P-values are indicated in the figure.
Extended Data Fig. 4. Pharmacological inhibition of Notch activity by DAPT treatment enhances the differentiation of secretory cells into AT2 cells during injury repair.
a, Experimental design of lineage-tracing analysis of Scgb1a1-CreERTM/+;R26RtdTomato/+ mice after bleomycin injury. DMSO or DAPT (50mg/kg body weight) was administrated via intraperitoneally as indicated time points. b, Representative IF images showing the increased Scgb1a1+ lineage-labelled Act-Tub+ ciliated cells in DAPT-treated mouse lungs at day 21 post bleomycin injury compared to DMSO control mice. Tomato (for Scgb1a1 lineage, red), Acetylated Tubulin (Act-Tub, white), and DAPI (blue). Scale bar, 50μm. c,d, Representative IF images showing the derivation of Scgb1a1+ lineage-labelled SPC+ AT2 (left) or CC10+ secretory cells (right) in DMSO control (c) or DAPT-treated (d) mice at day 21 post bleomycin injury. Tomato (for Scgb1a1 lineage, red), SPC (white), CC10 (green), and DAPI (blue). Scale bar, 100μm.
Extended Data Fig. 5. Transplantation of secretory cells, after excluding lineage-labelled AT2 cells, reveals enhanced the differentiation of secretory cells into AT2 cells via Notch inhibition.
a, MHCII expression marks AT2 cells. Representative flow cytometry analysis of MHCII expression in SPC+ AT2 (EpCAM+dsRed+) or non-AT2 (EpCAM+dsRed-) cells from Sftpc-dsRedIRES-DTR reporter mice. Sftpc-IRES-DTR-P2A-dsRed (Sftpc-dsRedIRES-DTR) reporter mouse was used to monitor SPC-expressing AT2 cells based on the expression of dsRed (See Methods). Numbers adjacent to the outlined area indicate the percentage of populations. b, Flow cytometry analysis to exclude lineage-labelled AT2 cells, including CC10+SPC+ dual-positive cells, from dnMAMLflox/+;Scgb1a1-CreER TM/+;R26R tdTomato/+ or Scgb1a1-CreER TM/+;R26R tdTomato/+ mouse lungs. c-h, Representative IF image of engrafted lineage-labelled secretory cells (EpCA+Tomato+MHCII) isolated from Scgb1a1-CreERTM/+;R26R tdTomato/+ (c-e) or dnMAMLflox/+;Scgb1a1-CreER TM/+;R26R tdTomato/+ (f-h) mouse lungs at day 14 post transplantation. 20,000 cells of EpCAM+Tomato+MHCII- were engrafted into injured lung at day 7 after bleomycin injury. Tomato (for Scgb1a1 lineage, red), SPC (white), and DAPI (blue). Scale bars, 100μm. i, Representative fluorescent images of organoids (left) and statistical quantification of colony forming efficiency of alveolar organoids (right) derived from lineage-labelled AT2 cells isolated from control (Scgb1a1-CreER TM/+;R26R tdTomato/+) or dnMAMLflox/+;Scgb1a1-CreERTM,;R26RtdTomato/+ mouse lungs. 5,000 cells of lineage-labelled secretory cells (EpCAM+Tomato+MHCII-) isolated from Scgb1a1-CreERTM/+;R26RtdTomato/+ or dnMAMLflox/+;Scgb1a1-CreERTM/+ ;R26RtdTomato/+ mice were co-cultured with stromal cells with 1:5 ratio for 14 days. Each individual dot represents one individual experiment (n=2 biological replicates). Scale bar, 2,000μm. j, Representative IF images showing Scgb1a1+ lineage-labelled cells in a whole lobe of Scgb1a1-CreERTM/+ ;Red2-NotchNIICD/+ mice post tamoxifen treatment: YFP (yellow), RFP (red), pro-SPC (white, left), Scgb1a1 (white, right) and DAPI (blue). Scale bar, 500μm (left), and 100μm (right). Of note, only airway secretory cells were labelled by tamoxifen induction.
Extended Data Fig. 6. scRNA-seq analysis of lung cells from Scgblal-CreERTM/+;Red2-NotchN1ICD/+ mice at day 28 post bleomycin injury.
a, Sorting strategy for Scgb1a1 lineage-labelled RFP+ and YFP+ or unlabelled (YFP-RFP-) cells by flow cytometry after bleomycin injury. For unlabelled population (YFP-RFP-), EpCAM-RFP-YFP- (non-epithelial population) and EpCAM+RFP-YFP- (epithelial population) cells were mixed at 1:1 ratio. b, Clusters of cell population after bleomycin injury from 10x Genomics 3’ scRNA-seq analysis visualised by UMAP, assigned by specific colours. c, A heatmap showing gene expression patterns of key markers in each distinctive cell cluster. d, e, Representative IF images showing the expansion of Porcn+ or p57+ cells derivation from RFP+ cells at day 28 post bleomycin injury. RFP (red), CC10 (green), p57 (white, e), Porcn (white, f), and DAPI (blue). Insets (1) show high-power view. Scale bar, 50μm. f, Diffusion map according to diffusion pseudotime (DPT, right) order coloured by samples (left).
Extended Data Fig. 7. Expression of Notch ligands in ciliated cells post alveolar injury.
a, Expression of Notch ligand in each distinctive cluster revealed in Extended Data Fig. 6. The size of the circle represents the fraction of cells expressing the gene and the colour represents the relative expression of each gene. b, UMAP visualisation of the log-transformed (log10(TPM+1)), normalised expression of selected marker genes (Jag1 and Jag2 for Notch ligand expression; Foxj1 for ciliated cells) in distinctive clusters. c, Representative IHC images stained with anti-Jag1 in the distal airway of lungs from Scgb1a1-CreERTM/+;R26RtdTomato/+ mice at day 14 post PBS or bleomycin treatment. Insets (top) show high-power view (bottom). Scale bars, 50μm. d, Sorting strategy for Il1r1+ lineage-labelled ciliated (EpCAM+Tomato+CD24high) and AT2 (EpCAM+Tomato+CD24-) cells from Il1r1-CreERT2/+; R26RtdTomato/+ mouse lungs at day 4 post tamoxifen injection. e, qPCR analysis of Foxj1, Cd24, and Sftpc expression in isolated cells in (d). Each individual dot represents one individual experiment (n=4) and data are presented as mean ± s.e.m. P-values using Student’s t-test are indicated in the figure. f, Representative fluorescent images of organoids derived from Il1r1 lineage-labelled ciliated (Il1r1 +CD24high) or AT2 (Il1r1 +CD24-) cells. Ciliated cells are unable to form organoids. Scale bars, 2,000μm. g, Representative IF images showing intact ciliated cells in the lungs of Il1r1flox/flox; Foxjl-CreERT2/+; Scgb1a1-CreERTM/+;R26RtdTomato/+ mice compared to those in the lungs of control Illrlflox/flox; Scgb1a1-CreERTM/+;R26RtdTomato/+ mice: Tomato (for Scgb1a1 or Foxj1 lineage, red), Acetylated Tubulin (Act-Tub, white), E-Cadherin (E-Cad, green), and DAPI (blue). Scale bars, 50μm. h, Representative IF images showing a small number of Scgb1a1 lineage-labelled AT2 cells at day 28 post PBS treatment in Scgb1a1-CreERTM/+;Il1r1flox/flox;R26RtdTomato/+ or Foxj1-CreERT2/+;Scgb1a1-CreERTM/+;Il1rflox/flox;R26RtdTomato/+ mice. Tomato (for Scgb1a1 lineage, red), SPC (white), and DAPI (blue). Arrowheads point to lineage-labelled SPC+ AT2 cells. Scale bar, 100μm. i, Representative fluorescent images of organoids derived from lineage-labelled secretory cells of Scgb1a1-CreERTM/+ ;R26RtdTomato/+ lungs. Organoids were cultured with PBS or IL-1β for 14 days. Arrows point to cystic airway-like organoids. Scale bar, 2,000μm. j, Flow cytometry analysis of secretory cell-derived AT2 cells isolated from Scgb1a1-CreERTM/+R26RfGFP/+;Sftpc-dsRedIRES-DTR/+ mouse lungs after PBS (left) or bleomycin (right) treatment.
Extended Data Fig. 8. Differential genetic and epigenetic characteristics between secretory cells and secretory-derived AT2 (sAT2) cells.
a, A spearman correlation map plotted by using ATAC-seq replicates obtained from secretory and sAT2 cells. b, A bar graph showing the chromosomal distribution of secretory-specific and sAT2-specific cis-regulatory elements, mapped by ATAC-seq in secretory and sAT2 cells across the mouse genome. c, The distribution of ATAC-seq peak signals in secretory and sAT2 cells near the centre of secretory-specific, shared, and sAT2-specific open regions. d, Bar graphs showing enriched GO terms of the genes nearby secretory and sAT2-specific ATAC-seq peaks, respectively. e, Signal track images showing open chromatin regions nearby markers for secretory (Gabrp and Cyp2f2) and AT2 cells (Sftpc and Lyz2) in secretory (blue) and sAT2 cells (red). f, A heatmap showing differentially expressed transcription factors (TFs) in secretory-derived organoids with or without DAPT treatment. g, qPCR analysis of the markers for secretory (Scgb1a1 and Gabrp) and AT2 cells (Sftpc, Etv5, and Lamp3) in secretory cell-derived organoids (SCOs) with or without DAPT treatment after knockdown of control (white), Etv5 (black), or Cebpa (red). Each individual dot represents one individual experiment (n=4) and data are presented as mean ± s.e.m. h, qPCR analysis to confirm the knockdown efficiency of the genes that are used for indicated constructs in SCOs. Each individual dot represents one individual biological experiment (n=4 for knockdown of Fosl2, Rpbjl, Etv5, and C/ebpa, n=3 for knockdown of Srebf2) and data are presented as mean ± s.e.m. Statistical analysis was performed using two-tailed unpaired Student’s t test; P-values are indicated in the figure.
Extended Data Fig. 9. Genetic and epigenetic differences of sAT2 cells compared to rAT2 cells.
a, Experimental design for isolation of secretory-derived (sAT2, GFP+dsRed+) and resident AT2 cells (non-lineage-labelled AT2, rAT2, GFP-dsRed+) using Scgb1a1-CreERTM/+; R26RfGFP/+;Sftpc-dsRedIRES-DTR/+ mice. Specific time points for tamoxifen injection and isolation are indicated. b, Representative flow cytometry analysis for isolation of sAT2 (GFP+dsRed+) and rAT2 (GFP-dsRed+) cells. c, Heatmaps showing open chromatin regions specific in sAT2 cells and shared open chromatin regions between sAT2 cells and rAT2 cells (left). A pie chart presenting the proportion of sAT2-specific (blue) and shared regions (grey) (right). d, A bar graph showing the chromosomal distribution of sAT2-specific ATAC-seq peaks mapped in (c). e, A bar graph showing enriched GO terms of the genes nearby sAT2-specific peaks. f, GSEA with gene sets representing the negative regulation of intrinsic apoptosis signalling pathway in scRNA-seq data of sAT2 and rAT2 shown in Fig. 6a. g, A heatmap showing the expression patterns of the genes belonging to the negative regulation of apoptosis signalling pathway in sAT2 and rAT2 cells monitored by scRNA-seq (Fig. 6a). h, Signal track image showing open regions for Nr4a2, anti-apoptotic pathway marker, in secretory (blue), sAT2 (red), and rAT2 cells (green). i, Representative IF images of organoids derived from rAT2 or sAT2 cells. SPC (for AT2 cells, red), HOPX (for AT1 cells, white), and DAPI (blue). Scale bars, 50μm. j, k, Quantification of the frequency of AT2 (SPC+) or AT1 (HOPX+) cells (b) and the ratio of AT1/AT2 cells (c) in rAT2- or sAT2-derived organoids. (n=23 organoids, pooled from 2 mice for rAT2; n=30 organoids, pooled from 2 mice for sAT2). l, Flow cytometry analysis of Scgb1a1+ lineage-labelled AT2 cells isolated from Scgb1a1-CreERTM/+;R26RfGFP/+;Sftpc-dsRedIRES-DTR/+ mouse lungs at 3 months after bleomycin injury. m, qPCR analysis of the genes in isolated secretory, rAT2, or sAT2 cells. Data are presented as mean ± s.e.m (n=5 biological replicates for all experimental groups).
Extended Data Fig. 10. Identification of KDR/Flk-1 as a surface marker of secretory cells in both mouse and human lungs.
a, UMAP visualisation of normalised expression of Kdr/Flk-1. b, A signal track image showing open regions nearby Kdr mapped in secretory (blue) and sAT2 cells (red). c, Experimental design for isolation of CC10+SPC- secretory cells, CC10+SPC+ dual-positive cells including Bronchioalveolar stem cells (BASCs), and CC10-SPC+ AT2 cells from Scgb1a1-CreERTM/+;R26RfGFP/+;Sftpc-dsRedIRES-DTR/+ mice. d, Representative flow cytometry analysis (left) for secretory (GFP+dsRed-), BASCs (GFP+dsRed+), and AT2 (GFP-dsRed+) cells. e, A bar graph showing MFI (mean fluorescence of intensity) of KDR expression. Experiment performed twice. f,g, UMAP (f) or t-SNE (g) visualisation of the normalised expression of JAG1, HES1, and KDR from the dataset of Habermann et al.,45(f) or Travaglini et al.,46(g). h,i, Representative IF images of secretory cell-derived organoids treated with DMSO or DAPT (20μM). CC10 (white), Acetylated Tubulin (Act-Tub, green, h), KRT5 (red, i), and DAPI (blue). Scale bar, 50μm. j, Quantification of the frequency of Act-Tub+ ciliated cells or KRT5+ basal cells. Data are presented as mean ± s.e.m. (n=8 (Control) and n=7 (DAPT) organoids, pooled from 3 mice for Act-TUB+ cells; n=5 (Control) and n=8 (DAPT) organoids, pooled from 3 mice for KRT5+ cells). Statistical analysis was performed using two-tailed unpaired Student’s t test; n.s.=not significance. k, Notch inhibition coordinates the cell fate decision of secretory cells into AT2 cells in two stages: 1) Reprogramming; loss of secretory cell identity by Notch inhibition in response to IL-1β signaling and 2) AT2 cell conversion; acquisition of transcriptional programmes for AT2 cell differentiation vis the transcription regulator Fosl2. l, Representative IF images of secretory organoids treated with DMSO (control) or DAPT (20μM) in the presence (middle) or withdrawals of Wnt-inducing factors (right). Organoids were cultured in the medium supplemented with Wnt3a/Rspo1 for 7 days and then DAPT was treated for further 7 days with or without Wnt3a/Rspo1. CC10 (for secretory cells, green), Acetylated Tubulin (for ciliated cells, Act-Tub, red), SPC (for AT2 cells, white), and DAPI (blue). Scale bars, 50μm. m, The expression of IL-1β, Wnt5a, and Wnt7b at indicated time points after bleomycin injury. Data were from our previous study31.
Supplementary Material
Acknowledgement
We would like to thank Emma Rawlins (Gurdon Institute, University of Cambridge, UK) for sharing Scgb1a1-CreERTM, Foxj1-CreERT2, and Rosa26R-CAG-fGFP mouse line; Irina Pshenichnaya (Histology), Maike Paramor (NGS library), Peter Humphreys (Imaging), Andy Riddell (Flow cytometry), Simon McCallum (Flow cytometry, Cambridge NIHR BRC Cell Phenotyping Hub), Katarzyna Kania (single cell sequencing at Cancer Research UK), William Mansfield (Transgenic mice) and Cambridge Stem Cell Institute core facilities for technical assistance; Jong-Eun Park (Welcome Sanger Institute, UK) and Seungmin Han (Gurdon institute, UK) for helpful discussion on the scRNA-seq analysis; Yujin Ahn (DGIST, Korea) for technical assistance for shRNA experiment. All Lee Lab members for helpful discussion. This work was supported by Wellcome and the Royal Society (107633/Z/15/Z) and European Research Council Starting Grant (679411). J.K. is supported by R01GM112722 from the National Institute of General Medical Sciences and Preterm Birth Research Grant from the Burroughs Wellcome Fund. S.M.J is funded by the Medical Research Council UKRMP2, and the Cancer Research UK Programme grant and Lung Cancer Centre of Excellence. B.D.S acknowledges funding from the Royal Society E.P. Abraham Research Professorship (RP/R1/180165) and Wellcome Trust (098357/Z/12/Z).
Footnotes
Author contributions Statement: J.C. Y.J.J, J.K., and J.-H.L. designed the experiments, interpreted the data, and wrote the manuscript; J.C. performed most experiments and data analysis; Y.J.J. performed and analysed bulk RNA-seq and ATAC-seq data; C.D. designed and performed lineage-tracing analysis of Red2-NotchN1ICD mice, provided valuable comments on the manuscript; E. I. generated the Sftpc-IRES-DTR-P2A-dsRed targeting vector; K.V.E. performed the isolation of human lung tissue; J.-H.L. generated Sftpc-IRES-DTR-P2A-dsRed mouse line; B.-K.K. helped with the generation of the Sftpc-IRES-DTRP2A-dsRed targeting vector and shared the Red2-NotchN1ICD mice line; B.D.S helped with the study of Red2-NotchN1ICD lineage-tracing analysis; H.H. and S.M.J provided human lung tissue samples.
Competing Interests Statement: The authors declare that they have no competing interests.
Data Availability
ATAC-seq, RNA-seq and scRNA-seq data that support the findings of this study have been deposited in the Gene Expression Omnibus (GEO) under accession codes GSE153677 (RNA-seq and ATACC-seq for organoids) and GSE154218 (scRNA-seq). Previous published sequencing data that were re-analysed here are available under accession code GAS0000100434444, GSE13589343, and GSE14455331. All other data supporting the findings of this study are available from the corresponding author on reasonable request.
References
- 1.Fuchs E, Tumbar T, Guasch G. Socializing with the neighbors: stem cells and their niche. Cell. 2004;116:769–778. doi: 10.1016/s0092-8674(04)00255-7. [DOI] [PubMed] [Google Scholar]
- 2.Blanpain C, Fuchs E. Stem cell plasticity. Plasticity of epithelial stem cells in tissue regeneration. Science. 2014;344:1242281. doi: 10.1126/science.1242281. [DOI] [PMC free article] [PubMed] [Google Scholar]
- 3.Butler JP, et al. Evidence for adult lung growth in humans. N Engl J Med. 2012;367:244–247. doi: 10.1056/NEJMoa1203983. [DOI] [PMC free article] [PubMed] [Google Scholar]
- 4.Hogan BL, et al. Repair and regeneration of the respiratory system: complexity, plasticity, and mechanisms of lung stem cell function. Cell Stem Cell. 2014;15:123–138. doi: 10.1016/j.stem.2014.07.012. [DOI] [PMC free article] [PubMed] [Google Scholar]
- 5.Barkauskas CE, et al. Type 2 alveolar cells are stem cells in adult lung. J Clin Invest. 2013;123:3025–3036. doi: 10.1172/JCI68782. [DOI] [PMC free article] [PubMed] [Google Scholar]
- 6.Rock JR, et al. Multiple stromal populations contribute to pulmonary fibrosis without evidence for epithelial to mesenchymal transition. Proc Natl Acad Sci U S A. 2011;108:E1475–1483. doi: 10.1073/pnas.1117988108. [DOI] [PMC free article] [PubMed] [Google Scholar]
- 7.Adamson IY, Bowden DH. The type 2 cell as progenitor of alveolar epithelial regeneration. A cytodynamic study in mice after exposure to oxygen. Lab Invest. 1974;30:35–42. [PubMed] [Google Scholar]
- 8.Kathiriya JJ, Brumwell AN, Jackson JR, Tang X, Chapman HA. Distinct Airway Epithelial Stem Cells Hide among Club Cells but Mobilize to Promote Alveolar Regeneration. Cell Stem Cell. 2020;26:346–358.:e344. doi: 10.1016/j.stem.2019.12.014. [DOI] [PMC free article] [PubMed] [Google Scholar]
- 9.Vaughan AE, et al. Lineage-negative progenitors mobilize to regenerate lung epithelium after major injury. Nature. 2015;517:621–625. doi: 10.1038/nature14112. [DOI] [PMC free article] [PubMed] [Google Scholar]
- 10.Salwig I, et al. Bronchioalveolar stem cells are a main source for regeneration of distal lung epithelia in vivo. EMBO J. 2019;38 doi: 10.15252/embj.2019102099. [DOI] [PMC free article] [PubMed] [Google Scholar]
- 11.Liu Q, et al. Lung regeneration by multipotent stem cells residing at the bronchioalveolar-duct junction. Nat Genet. 2019;51:728–738. doi: 10.1038/s41588-019-0346-6. [DOI] [PubMed] [Google Scholar]
- 12.Guha A, Deshpande A, Jain A, Sebastiani P, Cardoso WV. Uroplakin 3a(+) Cells Are a Distinctive Population of Epithelial Progenitors that Contribute to Airway Maintenance and Post-injury Repair. Cell Rep. 2017;19:246–254. doi: 10.1016/j.celrep.2017.03.051. [DOI] [PubMed] [Google Scholar]
- 13.Rawlins EL, et al. The role of Scgb1a1+ Clara cells in the long-term maintenance and repair of lung airway, but not alveolar, epithelium. Cell Stem Cell. 2009;4:525–534. doi: 10.1016/j.stem.2009.04.002. [DOI] [PMC free article] [PubMed] [Google Scholar]
- 14.Miller AJ, et al. Generation of lung organoids from human pluripotent stem cells in vitro. Nat Protoc. 2019;14:518–540. doi: 10.1038/s41596-018-0104-8. [DOI] [PMC free article] [PubMed] [Google Scholar]
- 15.Huch M, et al. Unlimited in vitro expansion of adult bi-potent pancreas progenitors through the Lgr5/R-spondin axis. EMBO J. 2013;32:2708–2721. doi: 10.1038/emboj.2013.204. [DOI] [PMC free article] [PubMed] [Google Scholar]
- 16.Huch M, et al. In vitro expansion of single Lgr5+ liver stem cells induced by Wnt-driven regeneration. Nature. 2013;494:247–250. doi: 10.1038/nature11826. [DOI] [PMC free article] [PubMed] [Google Scholar]
- 17.Nikolic MZ, et al. Human embryonic lung epithelial tips are multipotent progenitors that can be expanded in vitro as long-term self-renewing organoids. Elife. 2017;6 doi: 10.7554/eLife.26575. [DOI] [PMC free article] [PubMed] [Google Scholar]
- 18.Sachs N, et al. Long-term expanding human airway organoids for disease modeling. EMBO J. 2019;38 doi: 10.15252/embj.2018100300. [DOI] [PMC free article] [PubMed] [Google Scholar]
- 19.Lee JH, et al. Anatomically and Functionally Distinct Lung Mesenchymal Populations Marked by Lgr5 and Lgr6. Cell. 2017;170:1149–1163.:e1112. doi: 10.1016/j.cell.2017.07.028. [DOI] [PMC free article] [PubMed] [Google Scholar]
- 20.Shiraishi K, et al. In vitro expansion of endogenous human alveolar epithelial type II cells in fibroblast-free spheroid culture. Biochem Biophys Res Commun. 2019;515:579–585. doi: 10.1016/j.bbrc.2019.05.187. [DOI] [PubMed] [Google Scholar]
- 21.Weiner AI, et al. Mesenchyme-free expansion and transplantation of adult alveolar progenitor cells: steps toward cell-based regenerative therapies. NPJ Regen Med. 2019;4:17. doi: 10.1038/s41536-019-0080-9. [DOI] [PMC free article] [PubMed] [Google Scholar]
- 22.Katsura H, et al. Human Lung Stem Cell-Based Alveolospheres Provide Insights into SARS-CoV-2-Mediated Interferon Responses and Pneumocyte Dysfunction. Cell Stem Cell. 2020;27:890–904.:e898. doi: 10.1016/j.stem.2020.10.005. [DOI] [PMC free article] [PubMed] [Google Scholar]
- 23.Youk J, et al. Three-Dimensional Human Alveolar Stem Cell Culture Models Reveal Infection Response to SARS-CoV-2. Cell Stem Cell. 2020;27:905–919.:e910. doi: 10.1016/j.stem.2020.10.004. [DOI] [PMC free article] [PubMed] [Google Scholar]
- 24.Maillard I, et al. The requirement for Notch signaling at the beta-selection checkpoint in vivo is absolute and independent of the pre-T cell receptor. J Exp Med. 2006;203:2239–2245. doi: 10.1084/jem.20061020. [DOI] [PMC free article] [PubMed] [Google Scholar]
- 25.Pardo-Saganta A, et al. Parent stem cells can serve as niches for their daughter cells. Nature. 2015;523:597–601. doi: 10.1038/nature14553. [DOI] [PMC free article] [PubMed] [Google Scholar]
- 26.Lafkas D, et al. Therapeutic antibodies reveal Notch control of transdifferentiation in the adult lung. Nature. 2015;528:127–131. doi: 10.1038/nature15715. [DOI] [PubMed] [Google Scholar]
- 27.Morimoto M, et al. Canonical Notch signaling in the developing lung is required for determination of arterial smooth muscle cells and selection of Clara versus ciliated cell fate. J Cell Sci. 2010;123:213–224. doi: 10.1242/jcs.058669. [DOI] [PMC free article] [PubMed] [Google Scholar]
- 28.Yum MK, et al. Tracing oncogene-driven remodelling of the intestinal stem cell niche. Nature. 2021;594:442–447. doi: 10.1038/s41586-021-03605-0. [DOI] [PMC free article] [PubMed] [Google Scholar]
- 29.You P, et al. Jagged-1-HES-1 signaling inhibits the differentiation of TH17 cells via ROR gammat. J Biol Regul Homeost Agents. 2013;27:79–93. [PubMed] [Google Scholar]
- 30.Tsao PN, et al. Notch signaling controls the balance of ciliated and secretory cell fates in developing airways. Development. 2009;136:2297–2307. doi: 10.1242/dev.034884. [DOI] [PMC free article] [PubMed] [Google Scholar]
- 31.Choi J, et al. Inflammatory Signals Induce AT2 Cell-Derived Damage-Associated Transient Progenitors that Mediate Alveolar Regeneration. Cell Stem Cell. 2020;27:366–382.:e367. doi: 10.1016/j.stem.2020.06.020. [DOI] [PMC free article] [PubMed] [Google Scholar]
- 32.Rawlins EL, Ostrowski LE, Randell SH, Hogan BL. Lung development and repair: contribution of the ciliated lineage. Proc Natl Acad Sci U S A. 2007;104:410–417. doi: 10.1073/pnas.0610770104. [DOI] [PMC free article] [PubMed] [Google Scholar]
- 33.Kotton DN, Morrisey EE. Lung regeneration: mechanisms, applications and emerging stem cell populations. Nat Med. 2014;20:822–832. doi: 10.1038/nm.3642. [DOI] [PMC free article] [PubMed] [Google Scholar]
- 34.Kimura S, et al. The T/ebp null mouse: thyroid-specific enhancer-binding protein is essential for the organogenesis of the thyroid, lung, ventral forebrain, and pituitary. Genes Dev. 1996;10:60–69. doi: 10.1101/gad.10.1.60. [DOI] [PubMed] [Google Scholar]
- 35.Martis PC, et al. C/EBPalpha is required for lung maturation at birth. Development. 2006;133:1155–1164. doi: 10.1242/dev.02273. [DOI] [PubMed] [Google Scholar]
- 36.Holla VR, Mann JR, Shi Q, DuBois RN. Prostaglandin E2 regulates the nuclear receptor NR4A2 in colorectal cancer. J Biol Chem. 2006;281:2676–2682. doi: 10.1074/jbc.M507752200. [DOI] [PubMed] [Google Scholar]
- 37.Ke N, et al. Nuclear hormone receptor NR4A2 is involved in cell transformation and apoptosis. Cancer Res. 2004;64:8208–8212. doi: 10.1158/0008-5472.CAN-04-2134. [DOI] [PubMed] [Google Scholar]
- 38.Koppula P, Zhang Y, Zhuang L, Gan B. Amino acid transporter SLC7A11/xCT at the crossroads of regulating redox homeostasis and nutrient dependency of cancer. Cancer Commun (Lond) 2018;38:12. doi: 10.1186/s40880-018-0288-x. [DOI] [PMC free article] [PubMed] [Google Scholar]
- 39.Dixon SJ, et al. Ferroptosis: an iron-dependent form of nonapoptotic cell death. Cell. 2012;149:1060–1072. doi: 10.1016/j.cell.2012.03.042. [DOI] [PMC free article] [PubMed] [Google Scholar]
- 40.Lee JH, et al. Lung stem cell differentiation in mice directed by endothelial cells via a BMP4-NFATc1-thrombospondin-1 axis. Cell. 2014;156:440–455. doi: 10.1016/j.cell.2013.12.039. [DOI] [PMC free article] [PubMed] [Google Scholar]
- 41.Chen H, et al. Airway epithelial progenitors are region specific and show differential responses to bleomycin-induced lung injury. Stem Cells. 2012;30:1948–1960. doi: 10.1002/stem.1150. [DOI] [PMC free article] [PubMed] [Google Scholar]
- 42.Chernaya O, Shinin V, Liu Y, Minshall RD. Behavioral heterogeneity of adult mouse lung epithelial progenitor cells. Stem Cells Dev. 2014;23:2744–2757. doi: 10.1089/scd.2013.0631. [DOI] [PMC free article] [PubMed] [Google Scholar]
- 43.Habermann AC, et al. Single-cell RNA sequencing reveals profibrotic roles of distinct epithelial and mesenchymal lineages in pulmonary fibrosis. Sci Adv. 2020;6:eaba1972. doi: 10.1126/sciadv.aba1972. [DOI] [PMC free article] [PubMed] [Google Scholar]
- 44.Travaglini KJ, et al. A molecular cell atlas of the human lung from single-cell RNA sequencing. Nature. 2020;587:619–625. doi: 10.1038/s41586-020-2922-4. [DOI] [PMC free article] [PubMed] [Google Scholar]
- 45.Geng Y, et al. Follistatin-like 1 (Fstl1) is a bone morphogenetic protein (BMP) 4 signaling antagonist in controlling mouse lung development. Proc Natl Acad Sci U S A. 2011;108:7058–7063. doi: 10.1073/pnas.1007293108. [DOI] [PMC free article] [PubMed] [Google Scholar]
- 46.Weaver M, Yingling JM, Dunn NR, Bellusci S, Hogan BL. Bmp signaling regulates proximal-distal differentiation of endoderm in mouse lung development. Development. 1999;126:4005–4015. doi: 10.1242/dev.126.18.4005. [DOI] [PubMed] [Google Scholar]
- 47.Rouillard AD, et al. The harmonizome: a collection of processed datasets gathered to serve and mine knowledge about genes and proteins. Database (Oxford) 2016 doi: 10.1093/database/baw100. 2016. [DOI] [PMC free article] [PubMed] [Google Scholar]
- 48.Zepp JA, et al. Distinct Mesenchymal Lineages and Niches Promote Epithelial Self-Renewal and Myofibrogenesis in the Lung. Cell. 2017;170:1134–1148.:e1110. doi: 10.1016/j.cell.2017.07.034. [DOI] [PMC free article] [PubMed] [Google Scholar]
- 49.Chilosi M, et al. Aberrant Wnt/beta-catenin pathway activation in idiopathic pulmonary fibrosis. Am J Pathol. 2003;162:1495–1502. doi: 10.1016/s0002-9440(10)64282-4. [DOI] [PMC free article] [PubMed] [Google Scholar]
- 50.Jensen-Taubman SM, Steinberg SM, Linnoila RI. Bronchiolization of the alveoli in lung cancer: pathology, patterns of differentiation and oncogene expression. Int J Cancer. 1998;75:489–496. doi: 10.1002/(sici)1097-0215(19980209)75:4<489::aid-ijc1>3.0.co;2-p. [DOI] [PubMed] [Google Scholar]
- 51.Xu Y, et al. Single-cell RNA sequencing identifies diverse roles of epithelial cells in idiopathic pulmonary fibrosis. JCI Insight. 2016;1:e90558. doi: 10.1172/jci.insight.90558. [DOI] [PMC free article] [PubMed] [Google Scholar]
- 52.Madisen L, et al. A robust and high-throughput Cre reporting and characterization system for the whole mouse brain. Nat Neurosci. 2010;13:133–140. doi: 10.1038/nn.2467. [DOI] [PMC free article] [PubMed] [Google Scholar]
- 53.Robson MJ, et al. Generation and Characterization of Mice Expressing a Conditional Allele of the Interleukin-1 Receptor Type 1. PLoS One. 2016;11:e0150068. doi: 10.1371/journal.pone.0150068. [DOI] [PMC free article] [PubMed] [Google Scholar]
- 54.Love MI, Huber W, Anders S. Moderated estimation of fold change and dispersion for RNA-seq data with DESeq2. Genome Biol. 2014;15:550. doi: 10.1186/s13059-014-0550-8. [DOI] [PMC free article] [PubMed] [Google Scholar]
- 55.Gaspar JM. NGmerge: merging paired-end reads via novel empirically-derived models of sequencing errors. BMC bioinformatics. 2018;19:1–9. doi: 10.1186/s12859-018-2579-2. [DOI] [PMC free article] [PubMed] [Google Scholar]
- 56.Shao Z, Zhang Y, Yuan GC, Orkin SH, Waxman DJ. MAnorm: a robust model for quantitative comparison of ChIP-Seq data sets. Genome Biol. 2012;13:R16. doi: 10.1186/gb-2012-13-3-r16. [DOI] [PMC free article] [PubMed] [Google Scholar]
- 57.Ramirez F, et al. deepTools2: a next generation web server for deep-sequencing data analysis. Nucleic Acids Res. 2016;44:W160–165. doi: 10.1093/nar/gkw257. [DOI] [PMC free article] [PubMed] [Google Scholar]
- 58.Thorvaldsdóttir H, Robinson JT, Mesirov JP. Integrative Genomics Viewer (IGV): high-performance genomics data visualization and exploration. Briefings in bioinformatics. 2013;14:178–192. doi: 10.1093/bib/bbs017. [DOI] [PMC free article] [PubMed] [Google Scholar]
- 59.Heinz S, et al. Simple combinations of lineage-determining transcription factors prime cis-regulatory elements required for macrophage and B cell identities. Molecular cell. 2010;38:576–589. doi: 10.1016/j.molcel.2010.05.004. [DOI] [PMC free article] [PubMed] [Google Scholar]
- 60.McLean CY, et al. GREAT improves functional interpretation of cis-regulatory regions. Nature biotechnology. 2010;28:495. doi: 10.1038/nbt.1630. [DOI] [PMC free article] [PubMed] [Google Scholar]
- 61.Ashburner M, et al. Gene ontology: tool for the unification of biology. Nature genetics. 2000;25:25–29. doi: 10.1038/75556. [DOI] [PMC free article] [PubMed] [Google Scholar]
- 62.Consortium, G. O. The gene ontology resource: 20 years and still GOing strong. Nucleic acids research. 2019;47:D330–D338. doi: 10.1093/nar/gky1055. [DOI] [PMC free article] [PubMed] [Google Scholar]
- 63.Bult CJ, et al. Mouse Genome Database (MGD) 2019. Nucleic Acids Res. 2019;47:D801–D806. doi: 10.1093/nar/gky1056. [DOI] [PMC free article] [PubMed] [Google Scholar]
- 64.Wolf FA, Angerer P, Theis FJ. SCANPY: large-scale single-cell gene expression data analysis. Genome Biol. 2018;19:15. doi: 10.1186/s13059-017-1382-0. [DOI] [PMC free article] [PubMed] [Google Scholar]
Associated Data
This section collects any data citations, data availability statements, or supplementary materials included in this article.
Supplementary Materials
Data Availability Statement
ATAC-seq, RNA-seq and scRNA-seq data that support the findings of this study have been deposited in the Gene Expression Omnibus (GEO) under accession codes GSE153677 (RNA-seq and ATACC-seq for organoids) and GSE154218 (scRNA-seq). Previous published sequencing data that were re-analysed here are available under accession code GAS0000100434444, GSE13589343, and GSE14455331. All other data supporting the findings of this study are available from the corresponding author on reasonable request.


