Abstract
Bivalent PROTACs work drive protein degradation by simultaneously binding a target protein and an E3 ligase and forming a productive ternary complex. We hypothesized that increasing binding valency within a PROTAC could enhanced degradation. Here, we designed trivalent PROTACs consisting of a bivalent BET inhibitor and an E3 ligand, tethered via a branched linker. We identified VHL-based SIM1 as a low picomolar BET degrader, with preference for BRD2. Compared to bivalent PROTACs, SIM1 showed more sustained and higher degradation efficacy, which led to more potent anti-cancer activity. Mechanistically, SIM1 simultaneously engages with high avidity both BET bromodomains in a cis intramolecular fashion and forms a 1:1:1 ternary complex with VHL exhibiting positive cooperativity and high cellular stability with prolonged residence time. Collectively, our data along with favorable in vivo pharmacokinetics demonstrate that augmenting the binding valency of proximity-induced modalities can be an enabling strategy for advancing functional outcomes.
Introduction
Bispecific molecular agents that induce proximity between two proteins are an emerging paradigm of pharmaceutical intervention into biology and medicine 1. Targeted degradation compounds, classified as PROTACs or molecular glues, have shown great promise as a new class of chemical probes to study biology and therapeutics for treatment of disease 2–4. PROTACs are traditionally conceived as bifunctional, i.e. composed of two ligands joined by a linker, forming a ternary complex consisting of Target Protein:PROTAC:E3 ligase, resulting in ubiquitination and subsequent degradation of the target protein via the proteasome 5–7. PROTACs have successfully been applied to degrade a wide spectrum of protein targets including nuclear 8–12, cytoplasmic 6,13,14, membrane-bound 15, and multi-pass transmembrane proteins 16, most commonly by recruiting either the von Hippel-Lindau (VHL) or cereblon (CRBN) E3 ligases.
PROTACs have shown unexpected advantages compared to the inhibitors of which they are composed. PROTACs can discriminate amongst highly homologous targets 17–20, and can exhibit much greater potencies than expected, due to a catalytic mechanism of action, which can compensate for low binary binding affinities or poor cellular permeability, and allow for use of weak, non-functional ligands 12,18,21,22. Unlike inhibitors, degraders must function beyond simple binary engagement. Instead they must work throughout a cascade of events, not only inducing proximity between two proteins which do not natively interact, but also yielding a productive ternary complex which structurally positions the target protein for efficient ubiquitination by the E3 ligase 23–25. Recent X-ray crystallographic structures and allied biophysical studies of PROTAC ternary complexes have demonstrated that some PROTAC-mediated ternary complexes are, like molecular glues, capable of cooperative binding, most notably shown for BRD4BD2-MZ1-VHL 17. This and subsequent studies have shown how in order to drive productive target ubiquitination and profound degradation at catalytic low concentrations, degraders need to form complexes of sufficient stability and residence time, which can be enhanced by cooperativity (defined as the ratio between the dissociation constant of a binary complex and that of the corresponding binding step in the ternary complex) and favourable intra-complex interactions 12,17,18,23,25. Such optimal “glueing” within the ternary complex can be challenging to realize with conventional PROTAC degraders that are by definition monovalent at the target of interest. Indeed, unfavourable PROTAC ternary complexes are often observed, which even if permissive to downstream protein ubiquitination and degradation, can lead to pronounced hook effect at higher concentration and/or result in slow and incomplete target degradation 13,26. We hypothesized that the molecular recognition process could be aided by multivalency and avidity, i.e. the accumulated strength of multiple affinities of individual binding interactions 27,28.
Here, we present the design, synthesis, and mechanistic characterization of trivalent PROTACs as a strategy to enhance targeted protein degradation. We elected the Bromo and Extra Terminal (BET) domain family member proteins BRD2, BRD3 and BRD4 as ideal model systems for this study because of their therapeutic relevance in many diseases including cancer 29,30. Several bivalent BET inhibitors and PROTACs, including the afore-mentioned MZ1, have been developed from parent monovalent inhibitors 5,31,32. Altogether, these compounds provided suitable benchmark reference for our study, where we set out to synergize the effects of a bivalent target ligand with E3 ligase recruitment to produce a trivalent PROTAC with enhanced target degradation. Our trivalent PROTACs were further characterized in a series of biochemical, biophysical and cellular assays to understand potency, kinetics, and specificity of degradation as compared to bivalent molecules, as well as for functional outcomes and underlying mechanism of action.
Results
Structure-guided design and synthesis of trivalent PROTACs
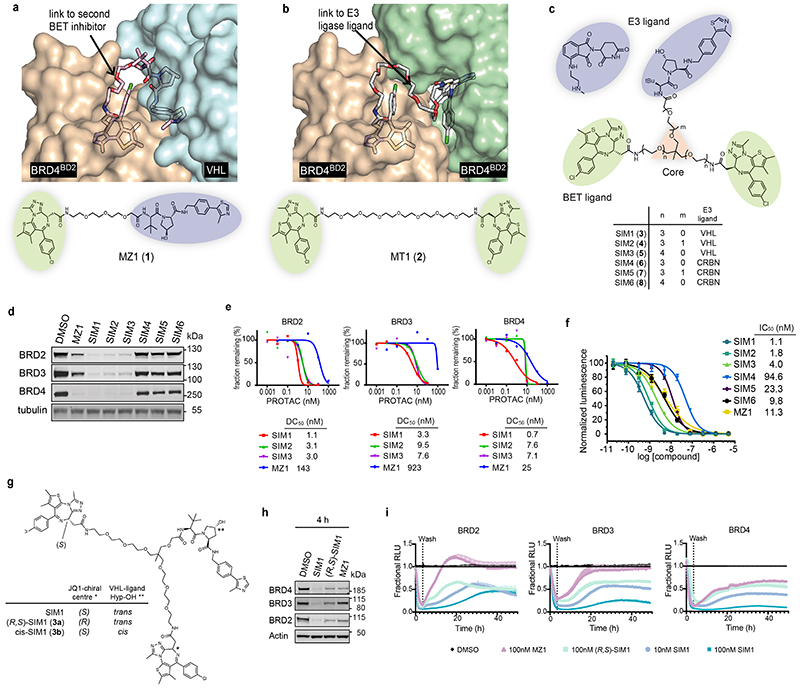
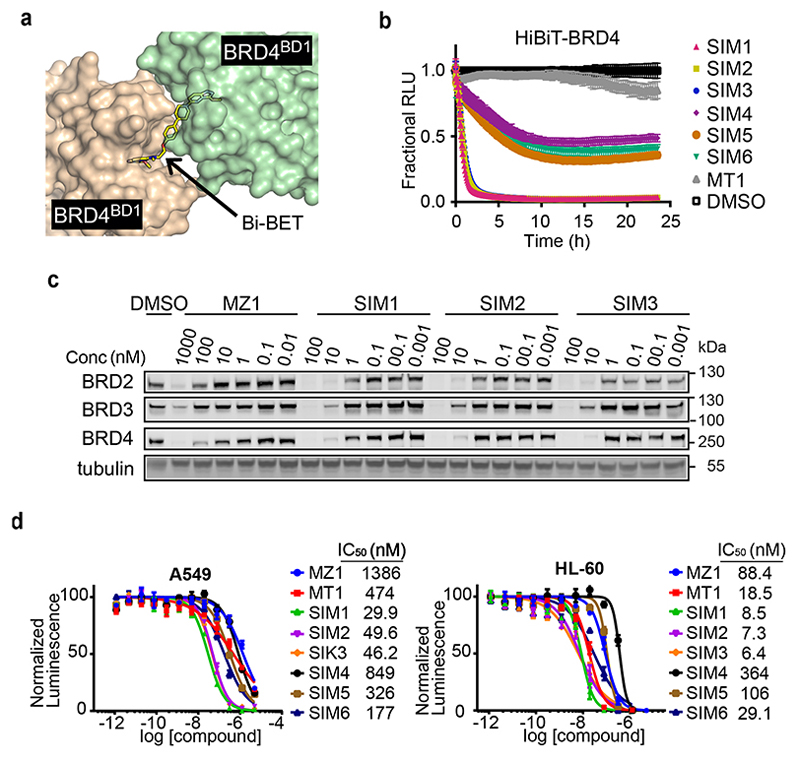
Insights to design a trivalent PROTAC came from analysis of the crystal structure of BRD4BD2-MZ1 (1)-VHL ternary complex 17, which revealed a central portion of the PEG3 linker as solvent exposed, suggesting it as a branching point to link to a second BET ligand (Fig. 1a). Similarly, a site for E3 ligase ligand attachment came from the co-crystal structure of the bivalent BET inhibitor MT1 (2) bound to two monomers of BRD4BD2 33 (Fig. 1b). In contrast, the bivalent inhibitor Bi-BET is fully buried in its co-crystal structure 34 (Extended Data Fig. 1a), therefore we elected MZ1 (1) and MT1 (2) as the progenitor bifunctional molecules in our design strategy.
Figure 1. Structure-inspired design of trivalent PROTACs identifies VHL-based SIM1 as the most potent BET degrader.
a,b) Inspection of ternary complex crystal structures of VHL:MZ1:BRD4BD2 (a, PDB:5T35) and BRD4BD2:MT1:BRD4BD2 (b, PDB 5JWM) guided the identification of solvent-exposed region for chemical branching of linkers in trivalent PROTAC design. Chemical structures of parent bivalent molecules MZ1 and MT1 are shown. c) Chemical structures of designed trivalent PROTACs SIM1-6 based on VHL and CRBN E3 ligase ligands. d) Immunoblot analysis of BRD2, BRD3, BRD4 after treatment of HEK293 cells with 1μM PROTACs or DMSO for 4h, performed as n=1. Full blots are supplied as Source Data Fig. 1. e) Protein levels of BRD2, BRD3, BRD4 in HEK293 cells treated with serially diluted PROTACs SIM1-SIM3 for 4h. Quantification of BET protein levels was done relative to DMSO control and shown plots used to measure the tabulated DC50 values. Corresponding blots are in Extended Data Fig. 1c, and full blots are supplied as Source Data Fig. 1. f) Cell viability of MV4;11 AML cell line following treatment with PROTACs or DMSO for 48h in three replicates for each concentration point. g) Chemical structures of SIM1 and its designed negative controls, (R,S)-SIM1 and cis-SIM1. Reversed stereocenters are indicated by asterisks. h) Immunoblot of degradation of BET proteins in HEK293 cells after treatment with indicated compounds at 1μM or DMSO for 4h. Full blots are supplied as Source Data Fig. 1. i) CRISPR HiBiT-BRD2, BRD3, and BRD4 HEK293 cells were treated with 100nM of DMSO, MZ1, (R,S)-SIM1, and both 10nM and 100nM of SIM1 in replicate plates for washout experiments. Media containing the 10nM and/or 100nM compounds was removed at 3.5h, indicated on the graphs, and replaced with media lacking compounds for the remainder of the experiment. Luminescence (RLU) was continuously monitored over a 50h time period and is plotted normalized to the DMSO control as Fractional RLU.
We next envisaged that a trifunctional PROTAC could be assembled around a ‘core scaffold’ connected to each of its three ligands via variable linkers (Fig. 1c). We reasoned that 1,1,1-tris(hydroxymethyl)ethane, also known as trimethylolethane (TME), could provide fit-for-purpose scaffold because it features three primary alcohol groups in a neopentyl core structure, thus acting as branched, close bioisosteric replacements of PEG units. The achirality of the central quaternary carbon of the TME core could be readily achieved by keeping the chemical linkers to each BET ligand moiety identical. To allow flexibility in exploring the relative constraints between the different monomeric ligands, while at the same time keeping the overall chemical structure as close as possible to those of MZ1 and MT1, we designed three branched PROTACs (SIM1 (3), SIM2 (4) and SIM3 (5)) bearing PEG3 or PEG4 at each linker to the BET ligand (n=3,4), and PEG0 or PEG1 towards the VHL ligand VH032-amine 35 (m=0,1) (Fig. 1c). We also designed analogous compounds SIM4 (6), SIM5 (7) and SIM6 (8) composed of the CRBN ligand pomalidomide 4’-alkylC2-amine 11 in place of VHL ligand (Fig. 1c). We synthesized trivalent PROTACs in nine overall steps from TME, with installation of either VHL or CRBN ligand followed in the final step by the 2:1 coupling of the BET ligand (see Supplementary Information).
To evaluate the ability of SIM1-6 trivalent compounds to induce intracellular degradation of BET proteins, we first treated human HEK293 cells for 4h at 1μM and assessed protein levels by western blot. Profound degradation across BET proteins was observed with VHL-based SIM1-SIM3, while minimal to partial degradation was observed with CRBN-based SIM4-SIM6 (Fig. 1d). To confirm the results we next used live cell continual luminescent monitoring of CRISPR/Cas9 endogenously tagged HiBiT-BRD4 in HEK293 cells over 24h 23. Faster rates of BRD4 degradation accompanied by greater maximal degradation levels were seen with SIM1-SIM3 as compared to the slower and partial loss observed with SIM4-6 (Extended Data Fig. 1b).
Trivalent PROTAC SIM1 is a highly potent BET degrader
To identify the best degrader, concentration-dependent profiling at 4h treatments using immunoblots evidenced much lower DC50 values of 0.7 – 9.5nM for SIM1-SIM3 compared to MZ1 (DC50 values of 25 – 920nM) across all the BET proteins (Fig. 1e and Extended Data Fig. 1c). To confirm greater potency of VHL-based degraders, we evaluated growth inhibition profiles of BET-sensitive cancer cell lines MV4;11 (Fig. 1f), A549, and HL-60 (Extended Data Fig. 1d) with SIM1-6 treatments. SIM1-SIM3 consistently showed more potent activity relative to SIM4-SIM6 and bivalent molecules MZ1 and MT1 (Fig. 1f and Extended Data Fig. 1d). In both these experiments, SIM1 emerged as the most potent of the three VHL-based degraders.
To determine whether the increase in target binding valency of SIM1 improved the degradation activity, we synthesized two diastereomeric analogues of SIM1 as negative controls: (R,S)-SIM1 (3a), which has inverted stereochemistry at one of the two BET ligands making it inactive at binding one of the two BET bromodomains (Fig. 1g) 36, and the non-degrading negative control isomer cis-SIM1 (3b) (Fig. 1g and Supplementary Information) 5,7. While the synthesis of cis-SIM1 was straightforward as with its trans diastereomer, initial attempts to synthesize (R,S)-SIM1 compound by using half equivalent of BET ligand at the final coupling step failed to produce the desired 1:1 coupling with an acceptable yield. Therefore, we revised the synthetic route to allow subsequent, independent coupling steps with (+)-JQ1 (9) 36 first, followed by (-)-JQ1 (9a) 36 (Supplementary Information). Upon successful synthesis, (R,S)-SIM1 was tested for degradation activity and found to behave similarly to MZ1 and less potently than SIM1 for degradation of all BET family members (Fig. 1h).
To assess whether the trivalent PROTAC induced also a more sustained degradation of BET proteins in cells compared to MZ1 or (R,S)-SIM1, degradation washout experiments were performed. CRISPR HiBiT-BET HEK293 cells were treated with equivalent concentration (100nM) of SIM1, (R,S)-SIM1 and MZ1 compounds for 3.5h, then media was removed and replaced with media lacking compounds. We also tested SIM1 at 10x lower concentration (10nM) to account for its higher potency of degradation across BET proteins. The HiBiT-BET protein levels were continuously monitored from the initial addition of the compounds and immediately after the wash for a total time of 50h. At the 100nM treatment, degradation of all BET family members by SIM1 remained at constant low levels after washout over the time course, while at the 10nM SIM1 treatment partial recovery was observed for BRD2, BRD3, and BRD4 after washout (Fig. 1i). Recovery of all BET family members following washout for cells treated with 100nM (R,S)-SIM1 or 100nM MZ1 was greater and occurred faster than those observed with SIM1 (Fig. 1i).
SIM1 is a preferential BRD2 degrader
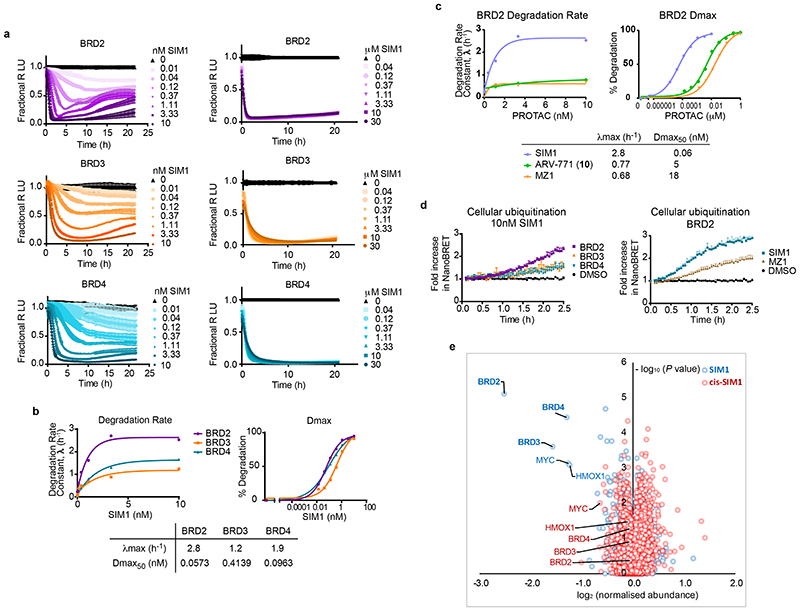
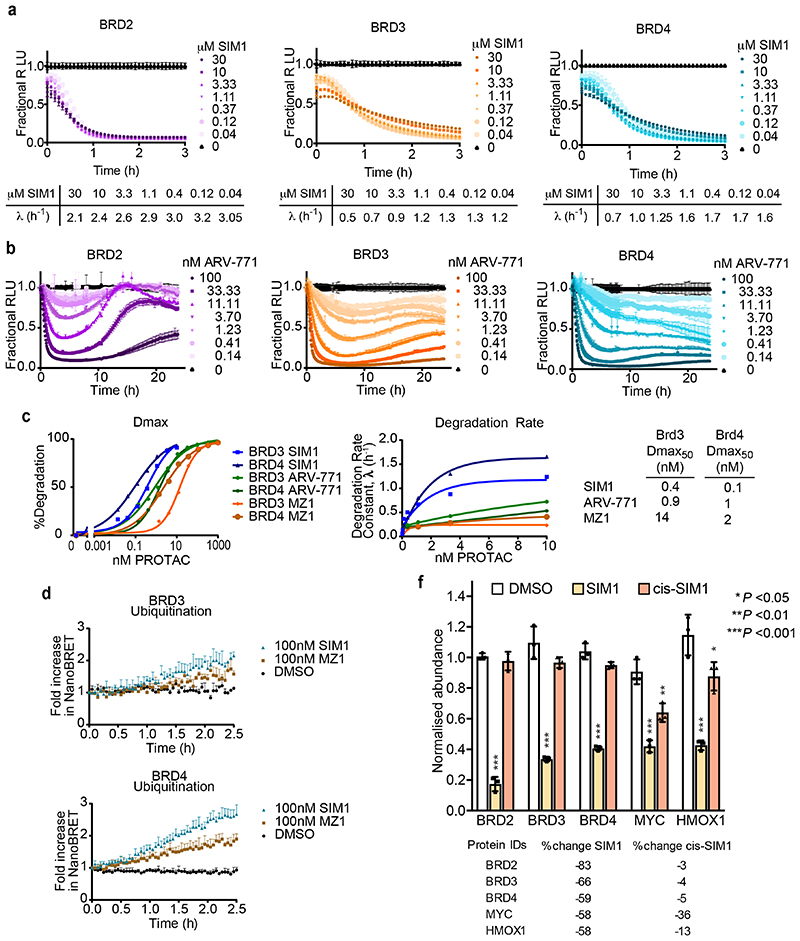
To further characterize degrader activity, we performed quantitative analysis of live-cell kinetic degradation of the CRISPR HiBiT-BET family members treated with SIM1 titrations over more than 6-log-order concentration range (10pM-30μM) (Fig. 2a and Extended Data Fig. 2a). All BET family members showed complete degradation across a 4 log concentration range (3nM-30μM). A slight slowing of the initial rate of degradation (due to the hook effect) was manifested only at the highest concentrations (3-30μM) with BRD3 and BRD4, and to a much lesser extent BRD2 (Extended Data Fig. 2a). From the kinetic analyses, degradation rates and Dmax values were calculated and plotted versus concentration to obtain λmax and Dmax50 (Fig. 2b). SIM1 exhibited Dmax50 values of 60-400pM and BET family degradation preference of BRD2>BRD4>BRD3 on both λmax and Dmax50 (Fig. 2b). This differs from MZ1 which has preference for BRD4 (Fig. 1d and 1e) 5,17,23,25.
Figure 2. Quantitative degradation, ubiquitination and mass spectrometry analyses reveals SIM1 has preference for BRD2.
a) Quantitative live-cell degradation kinetics of CRISPR HiBiT-BRD2, BRD3, and BRD4 HEK293 cells following treatment with DMSO and a 3-fold serial dilution of SIM1 over concentration range of 10pM-10nM (left) or 40nM-30μM (right). Luminescence (RLU) was continuously monitored over a 22h time period and is plotted normalized to the DMSO control as Fractional RLU. Data are presented as mean values with error bars representing the SD of technical quadruplicates. b) Plots of degradation rate and % Degradation or degradation maximum (Dmax) versus concentration of SIM1 from BRD2, BRD3, and BRD4 kinetic profiles shown in (a, left) and resulting degradation rate plateau, λmax, and Dmax50 values from each graph are shown below. Plots of initial degradation rate versus concentration of SIM1 (40nM-30μM) for BRD2, BRD3, and BRD4 are in Extended Data Fig. 2a. c) Comparison plots of BRD2 degradation rate and degradation maximum (Dmax) versus concentration calculated from kinetic graphs of SIM1 (Fig. 2a, left) ARV-771, (Extended Data Fig. 2b), and the previously determined MZ123. Resulting degradation rate plateau, λmax, and Dmax50 values from each graph are shown below. d) NanoBRET live cell ubiquitination kinetics of HiBiT-BET HEK293 cells expressing LgBiT and HaloTag-Ubiquitin following 10nM SIM1 treatment (BRD2,3,4, left) or 100nM SIM1 or MZ1 (BRD2, right). Kinetic ubiquitination profiles for 100nM SIM1 and MZ1 treatment of BRD3 and 4 are shown in Extended Data Fig. 2d. Values are expressed as fold increase over DMSO control, and error bars reflect a mean ± s.d. from quadruplicates. e) Effects of SIM1 (blue) and cis-SIM1 (red) on the proteome of MV4;11 cells treated with compound at 10nM for 4 h. Data plotted log2 of the normalized fold change in abundance against –log10 of the P value per protein from three independent experiments. All t-tests performed were two-tailed assuming equal variances. Quantification of representative proteins can be found in Extended Data Fig. 2e. Further details are in the associated Supplementary Data Set 1.
We next sought to further understand the SIM1 degradation preference for BRD2 compared to other PROTACs. Live-cell kinetic degradation dose response profiles were performed with the bivalent BET degrader ARV-771 (10) 31 using the CRISPR HiBiT-BET cell lines (Extended Data Fig. 2b) and degradation parameters were quantitated and compared with those previously determined for MZ1 23 and SIM1 (Fig. 2b). Shown in Fig. 2c are the comparisons for BRD2 and in Extended Data Fig 2c are those for BRD3 and BRD4. SIM1 showed a marked increase in degradation rate and λmax with BRD2, which directly correlated with an 80X and 300X increased degradation potency for BRD2 as compared to ARV-771 and MZ1, respectively (Fig. 2c). As enhanced degradation rates tend to correlate with enhanced ubiquitination, cellular studies were performed to monitor the kinetics of ubiquitination of BET proteins using bioluminescence resonance energy transfer (NanoBRET) assays consisting of the HiBiT-BET CRISPR cell lines expressing fluorescently labelled HaloTag-Ubiquitin 23. Shown in Fig 2d, kinetic increases in cellular ubiquitination were greater for BRD2 as compared to BRD3 and BRD4 after a 10nM SIM1 treatment. These same trends were observed at 100nM SIM1 concentration and comparison to MZ1 (Fig. 2d), revealing that SIM1 led to higher levels of ubiquitination of all BET family members (Extended Data Fig. 2d), with the greatest difference observed for BRD2.
To assess the cellular selectivity of SIM1 for BET proteins in a BET-relevant cellular background and also determine if BRD2 preference was observed in this context, multiplexed tandem mass tag (TMT) labeling mass spectrometry proteomic experiments were performed to monitor protein levels in a quantitative and unbiased fashion. Acute myeloid leukemia (AML) MV4;11 cells were treated in triplicate with DMSO, 10nM SIM1, or 10nM cis-SIM1 for 4h. Among the 5,232 proteins quantified, BRD2 was found as most significantly degraded by SIM1, followed by BRD3 and BRD4 (Fig. 2e and Extended Data Fig. 2f). No significant changes in BET protein abundance were observed in cells treated with cis-SIM1 (Extended Data Fig. 2f). Together, the data support SIM1 as a degrader with unusual preference for BRD2.
SIM1 is more efficacious than bivalent PROTACs or inhibitors
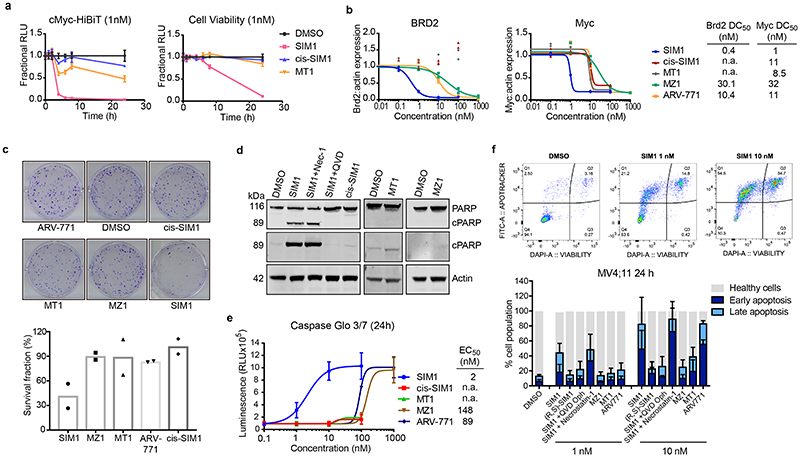
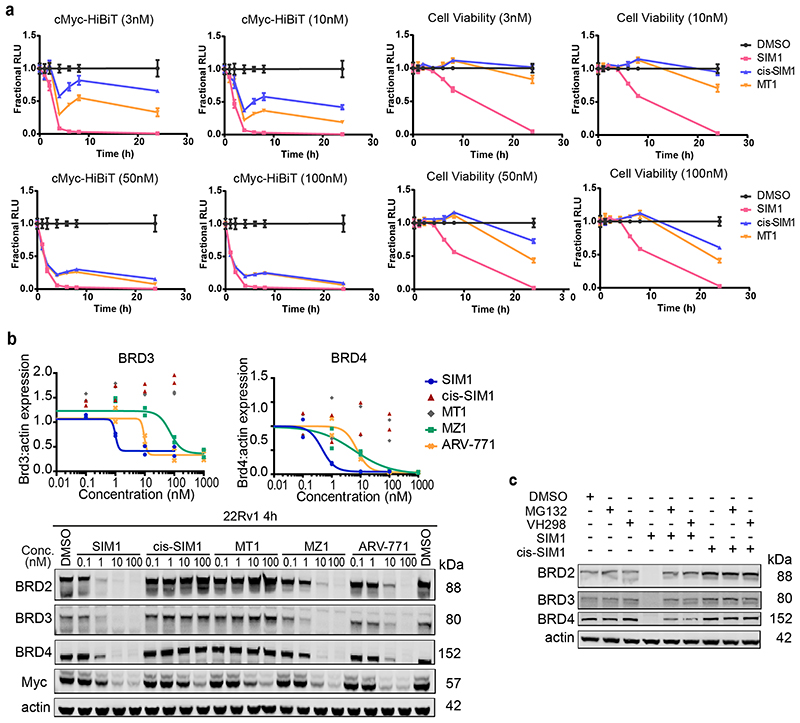
To quantitate time-dependent loss of cMyc, a known downstream effect of BET-induced degradation, cMyc was endogenously tagged with HiBiT in MV4;11 and protein levels were monitored in cell lysates at varying times with different concentrations of SIM1, cis-SIM1, and MT1 (Fig. 3a, left and Extended Data Fig. 3a). Rapid and complete loss of cMyc was observed with 1nM SIM1 concentration (Fig. 3a, left) whereas similar levels of cMyc loss with MT1 or cis-SIM1 were not achieved until 50-100nM treatments (Extended Data Fig. 3a). Cell viability assays revealed that, at 1nM treatment, only SIM1 (but not cis-SIM1 or MT1) resulted in measurable cellular death after 6h (Fig. 3a, right). Similarly, at higher concentrations SIM1 was found to be significantly more cytotoxic than control compounds (Extended Data Fig. 3a)
Figure 3. Potent SIM1 results in more efficacious apoptosis-induced cytotoxicity in BET-sensitive cancer cell lines.
a) Loss in CRISPR cMyc-HiBiT protein levels and correlative cell viability in MV4;11 cells treated with 1nM concentration of the indicated compounds. Luminescence and cell viability by CellTiter-Glo were measured at various time points over 24h. Data are presented as mean values with error bars representing the SD of technical quadruplicates. b) Quantified expression levels of endogenous BRD2 and Myc in 22Rv1 prostate cancer cell line treated with compounds for 4h. Curves are a best fit of means from two biologically independent experiments. Corresponding blots are in Extended Data Fig. 3b, and full blots are supplied as Source Extended Data Fig. 3. c) Survival of 22Rv1 cells in clonogenic assay. Cells were treated with 10nM compounds for 24h. Five hundred cells were re-plated and allowed to grow at 37°C for 20 days before scanning. Survival fraction was determined by dividing plating efficiency of treated cells by plating efficiency of untreated cells. d) Immunoblot of PARP-cleavage in 22Rv1 cells with indicated compounds at 10nM for 24h with or without the addition of caspase inhibitor (QVD-OPh, 20μM) or necroptosis inhibitor (Necrostatin-1, 20μM). Blots for 48h treatments and 1μM MZ1 and MT1 treatments are in Extended Data Fig. 4a-b. Full blots are supplied as Source Data Fig. 3. e) Caspase-Glo 3/7 assays treated with compounds or DMSO for 24h in 22Rv1 cells. Curves are a best fit of means from three biologically independent experiments, ±s.e.m. f) Percentage of early (FITC: Apotracker Green) and late (FITC: Apotracker Green and DAPI) apoptotic and healthy MV4;11 cells after treatment with test compounds at the indicated concentrations for 24h, as analysed by Apotracker Green and DAPI staining for viability and surface presence of phosphatidyl serine, respectively, and flow cytometry analysis. Data are plotted as stacked bars so single dots are not shown. Error bars reflect a mean ± s.d. of three biological replicates. Representative data for DMSO, SIM1 1nM and 10nM are shown (top), displayed as raw dot-plot analysed by FlowJo. Raw plots for all representative treatments are in Extended Data Fig. 5.
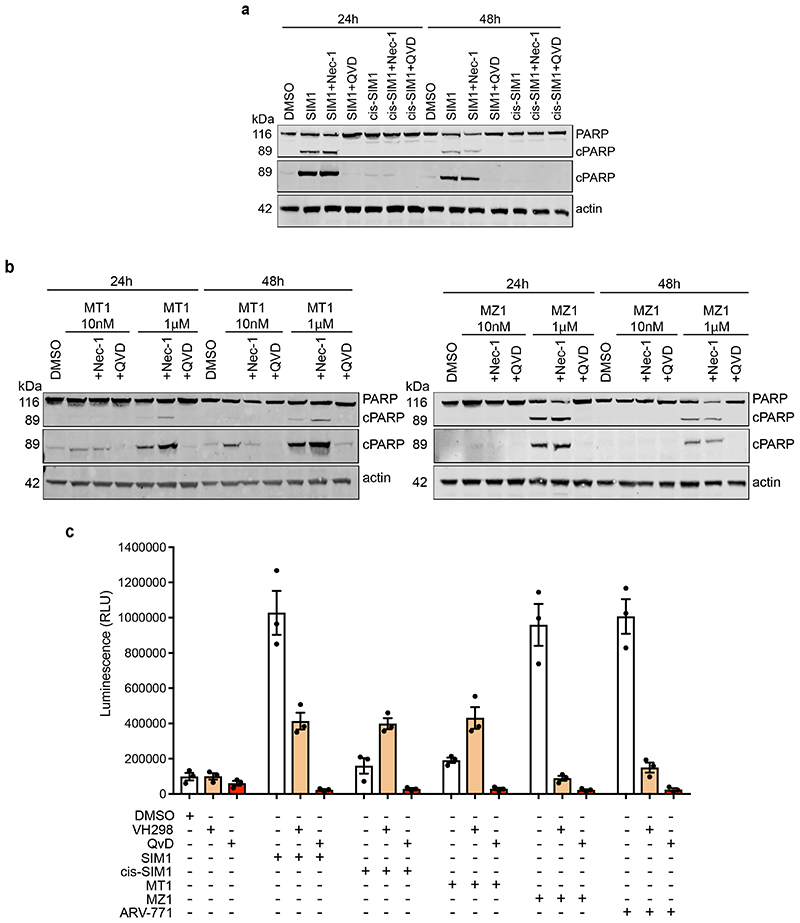
We next moved to study compounds in a BET-sensitive cell line, the prostate cancer line 22Rv1. Treatment of 22Rv1 cells with varying concentrations of compounds at 4h confirmed the enhancement in BET degradation potency and cMyc level suppression activity of SIM1 compared to MZ1 and ARV-771, as well as non-degrading controls MT1 and cis-SIM1 (Fig. 3b and Extended Data Fig. 3b). The expected mechanistic dependency of SIM1-induced degradation on functional E3 ligase and proteasomal activity was confirmed with co-treatment with VHL inhibitor VH298 (11) 37 and proteasome inhibitor MG132 (Extended Data Fig. 3c). The superior activity of SIM1 on the viability of 22Rv1 cells was evidenced in a colony-formation assay, where only SIM1-treated cells showed significant cytotoxicity as compared to vehicle control or cells treated with bivalent counterparts at the same concentration of 10nM (Fig. 3c). Substantial cell death was observed after 24h treatment with 10nM SIM1, as shown by PARP cleavage assays (Fig. 3d and Extended Data Fig. 4a). In contrast, 10nM MT1 or MZ1 did not cause observable PARP cleavage even up to 48h, and 1μM concentration was needed to induce levels of PARP cleavage similar to 10nM SIM1 (Extended Data Fig. 4b). Cells died of apoptosis as indicated by prevented cleavage of PARP upon co-treatment with QVD-OPh, a pan-caspase inhibitor, and not of necroptosis, as shown by co-treatment with Necrostatin-1 (Fig. 3d and Extended Data Fig. 4b). Caspase-Glo assays confirmed the more potent activity of SIM1 (EC50 2nM) compared to MZ1 or ARV-771 (EC50 150 and 90nM, respectively), with much greater maximal signal than non-degraders cis-SIM1 and MT1 (Fig. 3e), and apoptosis was blocked by co-treatment with the VH298 and QVD-OPh (Extended Data Fig. 4c).
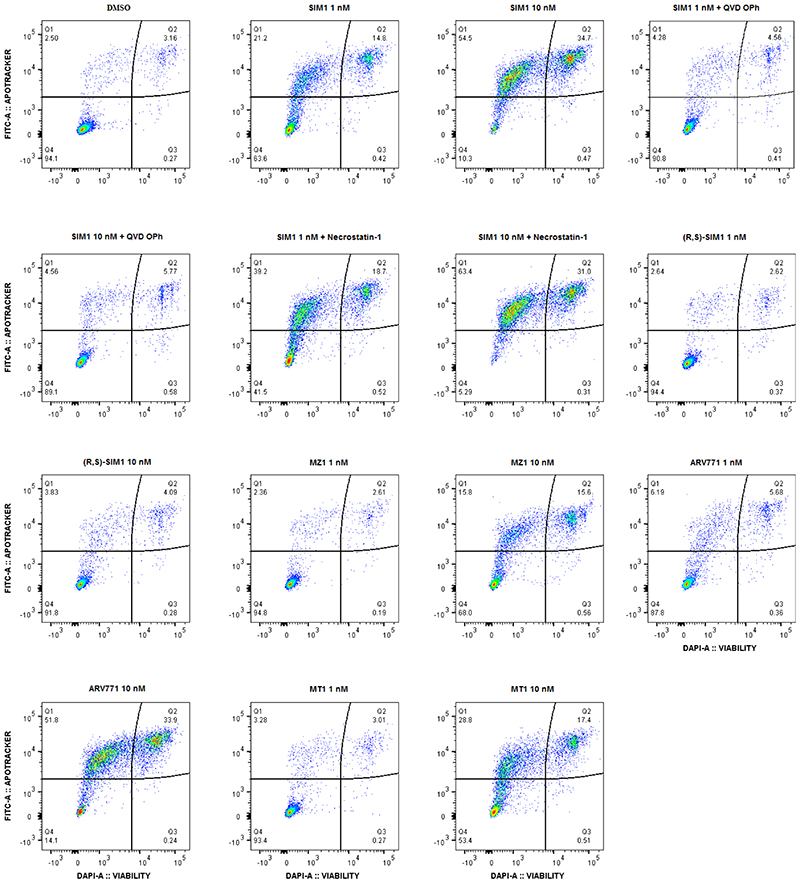
Our proteomics analysis (Fig. 2e) showed SIM1 induced decrease in protein levels of HMOX1 (heme oxygenase 1) suggesting early initiation of apoptosis 38. Early and late apoptotic induction between compound treatment was compared and notably, SIM1 induced a much greater degree of both early and late apoptosis at 1nM compared to all bivalent counterparts tested, even when compared to tenfold higher concentration of (R,S)-SIM1, MZ1, or MT1 (Fig. 3f and Extended Data Fig. 5). Together, the biological data supports more potent degradation and more substantial downstream functional activity of the trivalent degrader SIM1 compared to parent bivalent degraders or inhibitors.
SIM1 forms a 1:1:1 complex with VHL and BET BD1 and BD2
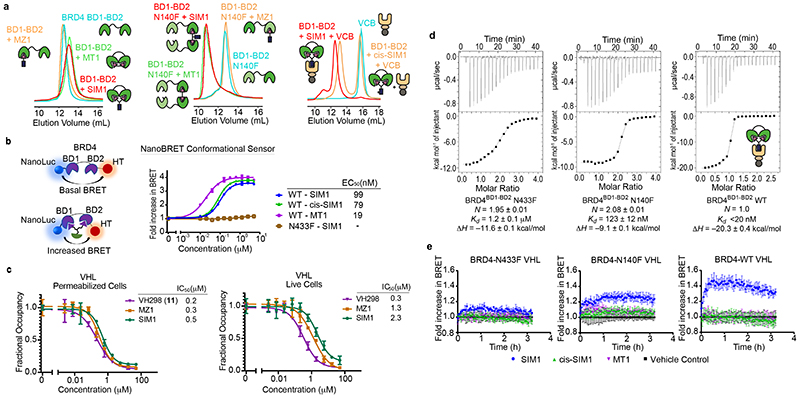
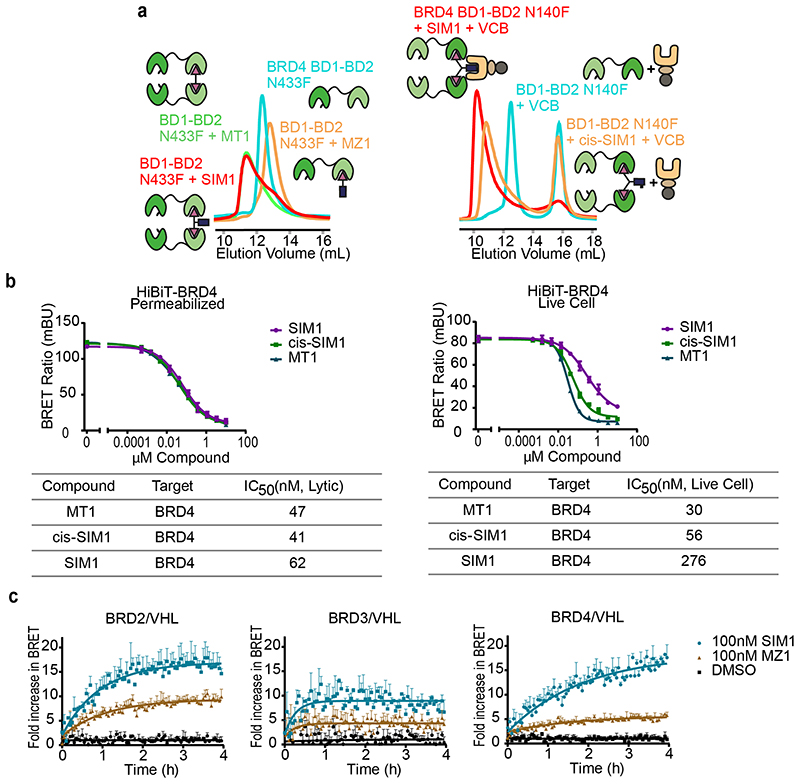
As bivalent BET inhibitors simultaneously engage BD1 and BD2 bromodomains 33,34, we hypothesized that trivalent SIM1 would also display a cis intramolecular engagement of a BET protein. To explore this, we first employed biophysical binding assays with recombinant proteins using size-exclusion chromatography (SEC) 39 with varying tandem BD1-BD2 constructs from BRD4. These included wild-type (WT), capable of cis intramolecular binding, or point mutations in either BD1 or BD2 at a conserved asparagine residue in the ligand-binding pocket (N140F in BRD4BD1, or N433F in BRD4BD2), to abrogate cis binding 34. SIM1 and MT1 both shifted the SEC profile of BRD4 WT BD1-BD2 tandem construct to a higher elution volume, compared to free or MZ-1-bound BRD4, consistent with the formation of a more compact intramolecular 1:1 complex (Fig. 4a). In contrast, when either N140F or N433F mutant tandems were used, we observed a significant shift to lower elution volumes with both SIM1 and MT1, consistent with the formation of higher-molecular weight 2:1 species in solution (Fig. 4a and Extended Data Fig. 6a). Having established that SIM1 engages BD1 and BD2 in a cis fashion, we next asked whether SIM1 could form a 1:1:1 complex between the BD1-BD2 tandem domain and VHL. Indeed, a sample containing 1:1:1 equivalents of SIM1, BD1-BD2, and VHL-Elongin B-Elongin C complex (VCB) ran at lower elution volumes compared to either of the two peaks observed from a sample containing the same equivalent ratio of cis-SIM1, BD1-BD2 tandem and VCB, where only the 1:1 cis-SIM1:BD1-BD2 complex and unbound VCB are formed (Fig. 4a).
Figure 4. SIM1 induces a conformation change in BRD4 intramolecularly engaging its BD1 and BD2 to form a 1:1:1 ternary complex with VHL.
a) Size exclusion chromatography of complex formation after incubation of SIM1 (red), MZ1 or cis-SIM1 (orange), MT1 (green) or DMSO (cyan) with BD1-BD2 tandem domain from BRD4 (left panel: wild type, middle panel: N140F mutant, right panel: wild type with VCB protein). Intensity of peaks is absorbance at 280 nm. b) NanoBRET conformational biosensor assay consisting of either the BD1-BD2 tandem domain of BRD4 wild-type (WT) or containing the BD2 N433F mutation flanked by NanoLuc donor and HaloTag acceptor fusion tags. HEK293 cells were transiently transfected with either the WT or N433F mutant biosensor and treated with a serial dilution of SIM1, cis-SIM1, or MT1 compounds. NanoBRET was measured to determine a change in tag proximity indicative of a conformational change. Data are presented as mean values with error bars representing the SD of technical quadruplicates. For treatments which showed a conformational change, EC50 values were calculated and are shown. c) NanoBRET target engagement assays of HEK293 cells transiently transfected with the VHL-NanoLuc fusion in permeabilized and live cell formats. Cells were treated with a fluorescent VHL tracer then incubated with the indicated compounds across the indicated concentration range to measure competitive displacement. Fractional occupancy is plotted against concentration and from these graphs, IC50 values for each compound are shown for both permeabilized and live cells. Data are presented as mean values with error bars representing the SD of technical triplicates. d) ITC titrations of BRD4 BD1-BD2 tandem proteins (loaded in the syringe, N-to-F mutants at 300μM, WT 200μM) into a 1:1 mixture of SIM1 (16μM) and VCB (32μM) pre-incubated into the sample cell. Binding parameters from data fit are shown for each titration. The high binding affinity to WT was not resolvable due to competing equilibria during the titration. e) NanoBRET kinetic ternary complex formation in HEK293 cells transiently expressing HaloTag-VHL paired with either full-length BRD4 WT, N140F or N433F mutants treated with SIM1, cis-SIM1, MT1 or DMSO control. NanoBRET was continuously monitored for 2h after compound addition and showed differential levels of ternary complex formation for each BRD4 variant. Data are presented as mean values with error bars representing the SD of technical quadruplicates.
To determine if SIM1 could induce a conformational change of BRD4, known to occur with bivalent BET inhibitors 34, we utilized a NanoBRET biosensor containing the BD1-BD2 tandem domains of WT BRD4 or mutant N433F, flanked respectively by a NanoLuc donor and HaloTag acceptor (Fig. 4b). With the BD1-BD2 tandem WT biosensor, compounds SIM1, cis-SIM1 and MT1 all showed a change in BRD4 conformation, manifested by an increase in NanoBRET signal which reached and maintained a plateau, as expected for an intramolecular engagement (Fig. 4b). As control, the BD1-BD2 N433F mutant sensor showed no response indicating that simultaneous binding of BD1 and BD2 is required for the conformation change (Fig 4b). Interestingly cis-SIM1 and SIM1 showed higher EC50 values for BRD4 binding than MT1 (Fig. 4b). To determine if this is due to a reduced binding affinity of BRD4 and/or reduced permeability, NanoBRET target engagement assays were performed measuring displacement of a fluorescent BET tracer molecule bound to HiBiT-BRD4 34. In permeabilized cells, we observed binding of SIM1, cis-SIM1, and MT1 to endogenous HiBiT-BRD4 with near-identical binding affinities and IC50 values (Extended Data Fig. 6b). However, in live cells, SIM1 showed reduced binding affinity to BRD4 compared to MT1 (Extended Data Fig. 6b), suggesting the EC50 shift observed in the conformational sensor assay reflects reduced permeability of the trivalent PROTAC relative to MT1. Reduced permeability was also observed relative to VH298, using NanoBRET target engagement with NanoLuc-VHL, however cellular permeability of SIM1 was within 2-fold lower than MZ1 (Fig. 4c) 23,40.
To further characterize ternary complex binding thermodynamics, we next used isothermal titration calorimetry (ITC) by performing reverse titrations 17. First, in titrations of BRD4 N433F or N140F tandems (competent for BD1 or BD2 binding alone, respectively) into preformed SIM1:VCB complex we observed 2:1 stoichiometry, molar binding enthalpy of ΔH = –11.6 and –9.1 kcal/mol, and K d = 1.2 and 0.12 μM, respectively (Fig. 4d). In contrast, titration of BRD4 WT BD1-BD2 under identical conditions displayed stoichiometry of 1:1, and a large negative binding enthalpy (ΔH = –20 kcal/mol) corresponding to the sum of BD1 and BD2 binding (Fig. 4d). To study ternary complex formation in a cellular context, we interrogated VHL binding to full-length BRD4 WT, N140F, or N433F mutations using kinetic NanoBRET assays 23. In these experiments, the ternary complex was rapidly formed with SIM1, but not with cis-SIM1 or MT1 (Fig. 4e, right). Ternary complex formation however was markedly reduced with BRD4 N140F (Fig. 4e, middle) and almost abolished with N433F (Fig. 4e, left). These results confirm SIM1 utilizes both BD1 and BD2 for cellular ternary complex formation and suggest preferential binding to BD2 over BD1, consistent with the ITC results and what was found previously with MZ1 17,25. Additional experiments showed a more robust and sustained ternary complex for BRD2 and BRD4 with VHL induced by SIM1 as compared to MZ1, while that with BRD3 did not appear to be as prolonged or stable (Extended Data Fig. 6c). Together, these data evidence SIM1 intramolecularly engages BD2 and BD1 to form a 1:1:1 ternary complex with VHL and BRD4.
BRD2:SIM1:VHL ternary complex shows avidity, cooperativity, and enhanced residence time
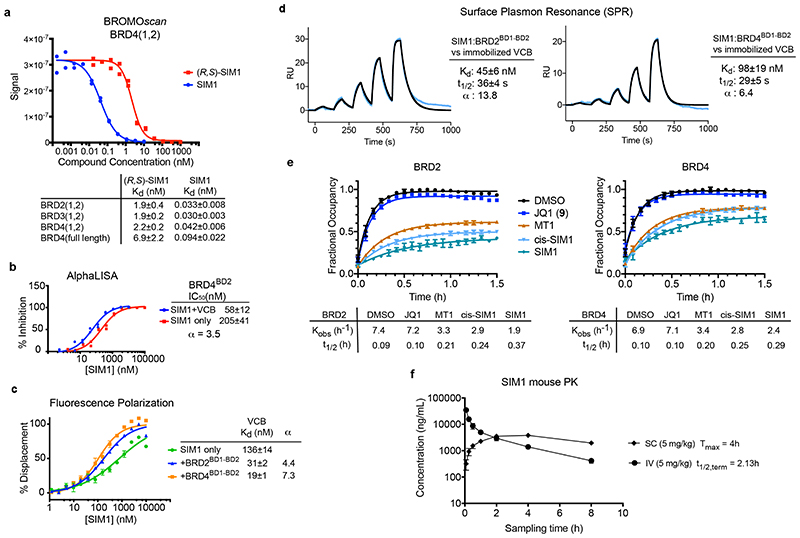
We next asked to what extent SIM1 might exhibit both avidity, i.e. enhanced binding affinity for BET proteins due to intramolecular BD1 and BD2 binding, and cooperativity within the ternary complex, i.e. enhanced affinity of forming ternary complex relative to the corresponding binary complex. We used established phage-based bromodomain displacement assays to quantitatively measure compound binding with tandem bromodomain constructs (Supplementary Information). Bidentate SIM1 showed picomolar affinity to tandem bromodomain constructs BRD2(1,2), BRD3(1,2), BRD4(1,2) and full-length BRD4, with 50-90X increase in affinity compared to monodentate (R,S)-SIM1 evidencing its avidity (Fig 5a and Supplementary Information). In forming ternary complexes with VHL and BET proteins, SIM1 exhibited a positive cooperativity α value of 3.5 as shown in competitive AlphaLISA assays (Fig. 5b), measuring binding of SIM1 alone (IC50 = 205nM) or SIM1:VCB binary complex (IC50 = 58nM) via the displacement of biotin-JQ1 41 from BRD4. As a cross- validation, we evaluated cooperativity in a competitive FP assay measuring binding at the VHL end of the PROTAC molecule via the displacement of a fluorescent HIF-1α peptide probe 37. In this experiment too SIM1 exhibited positive cooperativity from enhanced affinity of its competitive displacement once pre-engaged with BRD2 or BRD4 tandem (α = 4.4 or 7.3, respectively) compared to SIM1 alone (Fig. 5c).
Figure 5. SIM1 forms cooperative stable ternary complexes with enhanced cellular residence time and shows favourable pharmacokinetic profile in mice.
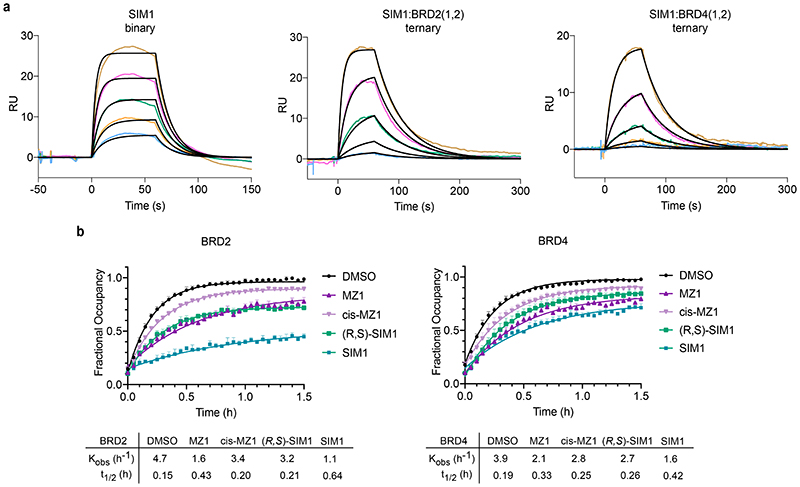
BROMOscan displacement titrations by SIM1 and (R,S)-SIM1 from BRD4(1,2). The amount of bromodomain protein measured by qPCR (Signal; y-axis) is plotted against the corresponding compound concentration in log10 scale (nM, x-axis). Dissociation constants Kd from curve fitting are tabulated. Error values are generated by the GraphPad Prism program and reflect the quality of the fit between the nonlinear least-squares curve and the experimental data. b) AlphaLISA titrations of SIM1 in duplicates against biotin-JQ1:BRD4BD2 in the absence (red) or presence (blue) of VCB protein. IC50 values from curve fitting are tabulated, together with the resulting cooperativity α. Error values are generated by the GraphPad Prism program and reflect the quality of the fit between the nonlinear least-squares curve and the experimental data. c) Fitted curves from FP competition assays measuring displacement of a FAM-labelled HIF-1α peptide from VCB by SIM1 titrated in triplicates, in the presence or absence of tandem BD1-BD2 proteins from BRD2 or BRD4. Kd values from curve fitting are tabulated, together with the resulting cooperativity α. d) SPR sensograms to monitor in real-time the interaction of binary complexes SIM1:BRD2(1,2) and SIM1:BRD4(1,2) with immobilized biotin-VCB protein. Sensorgrams shown are for a ternary single-cycle kinetic (SCK) experiments as representative to at least three independent experiments. Values shown are mean ± s.d. from the data fitting of each replicate. Cooperativity α is calculated using dissociation constant K d of SIM1 binary binding to VCB (Extended Data Fig. 7a). Multiple-cycle kinetic (MCK) ternary data are also shown in Extended Data Fig. 7a. e) Live cell kinetic residence time experiments with BRD2 and BRD4 as measured by NanoBRET target engagement. CRISPR HiBiT-BRD2 or HiBiT-BRD4 cells were incubated with each of the indicated compounds at their pre-determined EC80 values (listed in Methods) followed by addition of a competitive fluorescently-labeled BET tracer. NanoBRET was measured and is plotted as fractional occupancy over time. From these graphs, residence time rates (Kobs (h-1) and half-life (t½ (h)) were determined. Data are presented as mean values with error bars representing the SD of technical triplicates. f) SIM1 exhibits excellent availability and pharmacokinetics exposure in vivo. Mean plasma concentration-time profiles of SIM1 after single intravenous (IV) or subcutaneous (SC) administration (5 mg/kg) to male C57BL/6 mice (n =3) are shown. Further details are in the associated Supplementary Table 2 and Supplementary Data Set 2.
To assess dissociation kinetics of ternary complexes of SIM1, we used an SPR binding assay 25. We immobilized biotinylated VCB onto the surface chip and measured binding parameters for SIM1 alone (binary) or SIM1 pre-incubated in excess of BRD2 or BRD4 tandem BD1-BD2 proteins (ternary) in single and multicycle kinetic modes (Fig. 5d and Extended Data Fig. 7a), which gave comparable results (Supplementary Table 1). SIM1:BET-tandems bound to VCB with 1:1 stoichiometry, as the %Rmax value for the expected 1:1 binding model (47-77%) was comparable to that observed from reference titration of SIM1 alone (52%) (Supplementary Table 1). SIM1 formed high-affinity, stable and long-lived complexes with VCB and BET tandem proteins (for BRD2(1,2): t½ = 36s, K d = 45nM, α = 13.8; for BRD4(1,2): t½ = 29s, K d = 100nM, α = 6.4) (Fig. 5d and Supplementary Table 1). In comparison to the binary complex formation, the VHL:SIM1:BRD2/4(1,2) ternary complexes showed faster association rate and slower dissociation kinetics, resulting in the lower dissociation constants and positive cooperativity (Supplementary Table 1).
Having established avidity, cooperativity and stability of biophysical ternary complex recognition with recombinant proteins, we moved to interrogate complexes kinetics in live cells. To monitor residence time, termed the complex half-life t 1/2, the HiBiT-BRD2 and BRD4 CRISPR cells were first incubated with saturating concentrations of SIM1, cis-SIM1 or parent compounds, followed by a competitive BET fluorescent tracer. The NanoBRET signal produced from this displacement can be monitored kinetically, the rate and intensity of which directly correlates to the residence time of the initial compound-bound complex. As controls, JQ1 had a short residence time similar to the monovalent tracer alone, while MT1 showed a longer residence time, both in terms of calculated rate, Kobs (h-1) and complex half-life, t½ (h) (Fig. 5e). SIM1 showed significantly slower rates and longer half-lives, indicting prolonged residence time, particularly for BRD2, and to a lesser extent also for BRD4 (Fig. 5e). These trends matched well to ubiquitination and degradation potency for each compounds and BET protein. Interestingly cis-SIM1 tracked nearly identically with MT1 in both BRD2 and BRD4 traces (Fig. 5e) indicating that cooperative engagement of VHL improves residence time of SIM1 vs cis-SIM1. Further experiments which were performed with (R,S)-SIM1, MZ1, and cis-MZ1 revealed enhanced residence times of MZ1 and (R,S)-SIM1, though neither as significant as for SIM1 (Extended Data Fig. 7b). The increase observed from cis-MZ1 to MZ1 (Extended Data Fig. 7b) again supports that cooperative ternary complexes 17 can increase residence time, yet not to as great of extent as SIM1 as it is lacking the added avidity. Together, the results indicate that SIM1 favorability for BRD2 is facilitated by intramolecular binding that results in both a structural change as well as extended ternary complex half-life.
Finally, we evaluated the pharmacokinetics (PK) of SIM1 following intravenous and subcutaneous administration in mice (Fig. 5f). SIM1 exhibited highly favourable bioavailability and stability, including high AUCs, low clearance and long half-lives, comparing positively to those of the more canonical small-molecule components i.e. monovalent JQ1 36 and bivalent MZ1 (data available on OpnMe.com) (Fig. 5f and Supplementary Table 2). Such favourable PK profile is remarkable given its large size (molecular weight 1,619 Da) and qualifies SIM1 as chemical probe appropriate for in vivo use.
Discussion
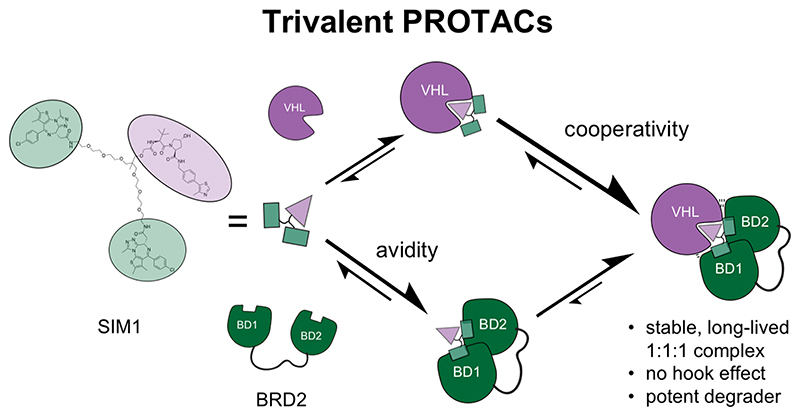
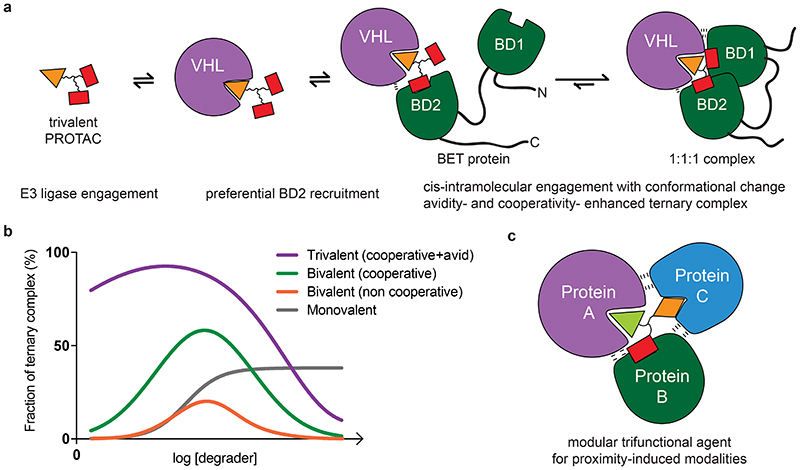
The study presented here finds inspiration from an often-used strategy for improvement of compound efficacy, i.e. increasing binding valency, and has leveraged this for improved PROTAC-mediated protein degradation. Our work qualifies the novel trivalent PROTAC SIM1 as a profoundly potent and fast degrader of BET proteins. Our biological and mechanistic investigation with SIM1 provides proof-of-concept for augmenting the valency of degraders as an advantageous strategy to enhance their mode of action by positively impacting the ternary complex. SIM1 bound intramolecularly the BET protein in a cis-fashion to both BD1 and BD2, inducing a conformational change, to then form a 1:1:1 complex (Fig. 6a). Further investigation with BD1 or BD2 mutants suggested there is preferred BD2 binding of SIM1 with BRD4 (Fig. 6a). Interestingly BRD2 was found in a series of orthogonal assays to show the most favorable ternary complex formation and prolonged residence time, the most robust level of ubiquitination, and correspondingly the fastest and highest level of degradation amongst the family members with SIM1. This is unprecedented preference amongst known BET PROTAC degraders. We cannot exclude the possibility that the structural change induced by SIM1 better positions BRD2 in a more favourable state for more productive ubiquitination, as compared to BRD3 or BRD4.
Figure 6. Models of trivalent ternary complex formations and advantages over monovalent and bivalent compounds.
a) Proposed mechanism for the formation of a 1:1:1 ternary complex between trivalent PROTAC, VHL and BET protein. Preferential initial binding of the PROTAC to BD2 of BRD4 is followed by conformational change and bidentate binding to BD1. Avidity and cooperativity contribute to formation of a highly stable ternary complex with enhanced residence time at extraordinarily low concentrations of SIM1. b) Shown are different types of degrader-induced ternary complexes, depicted at their varying extents as a function of degrader concentration. A trivalent complex combining avidity with cooperativity shows the highest and most sustained levels of ternary complex formation, with a minimized hook effect. A cooperative bivalent PROTAC complex is next, followed by a non-cooperative bivalent complex. Lastly, the ternary complex induced by molecular glue compounds is shown, which reaches a plateau and unlike PROTACs are not predicted to experience the competitive hook effect at higher concentrations. c) A general model for trifunctional compound-induced ternary complex utilizing a compound with three different warheads (or ligands) to recruit together three distinct protein.
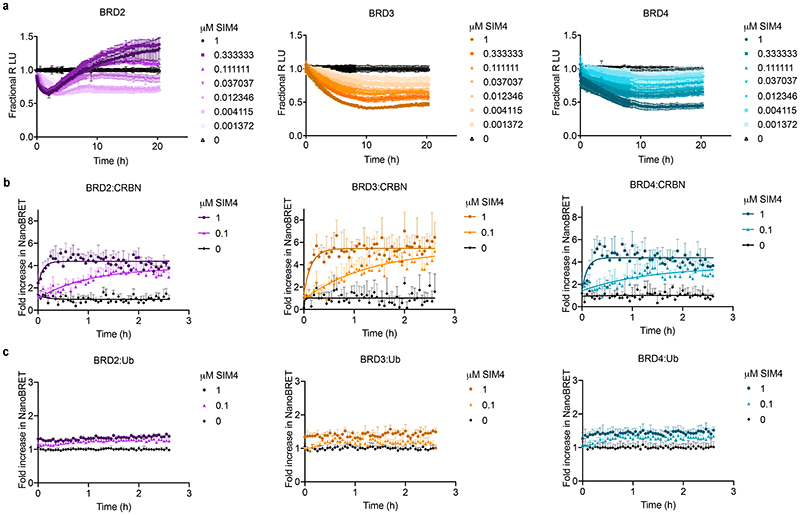
Structural, thermodynamic and kinetic favorability of ternary complex formation are critical for efficient PROTAC mode of action 17,26,42. These factors are determined by neo-interactions within the ternary complex, including between E3 ligase and target, similar to the mechanism of monovalent molecular glues. This results in stable, cooperative, and long-lived complexes which drive efficient catalytic ubiquitination 17,23,25,43. Such ternary complex -dependent outcomes can be optimized through rational design 12,44. For compounds which do not have this, their window of degradation efficacy will be limited by the hook effect as non-productive binary complexes with either the target or E3 ligase will more readily compete the ternary complex at higher PROTAC concentration (Fig. 6b) 13,45. In our studies with the trivalent PROTAC, we find that optimization of structural, energetic, and kinetic ternary complex parameters occurred from combined binding avidity and cooperativity in the process, resulting in stable biophysical recognition and prolonged cellular residence times (Fig. 6b). Our data suggests that it is this combination which increased most significantly the degradation activity, as the trivalent CRBN-based PROTACs, which we predict would also have avidity, were much less active. Indeed, more in-depth mechanistic experiments with representative CRBN-based trivalent PROTAC SIM4 showed that this compound, despite its ability to efficiently form ternary complexes, showed very low levels of BET family ubiquitination, and as a result induced only partial protein degradation (Extended Data Fig. 8). For the VHL-based SIM1, an improvement in all the parameters with the trivalent PROTAC resulted in a vast expansion of the degradation window, from rapid rates of BET family loss at very low concentration to maximal degradation with minimal hook effect observed at concentration up to 30μM, which is 500,000-fold above the Dmax50. Some of these characteristics have been observed previously with bivalent PROTACs such as cooperative complexes with MZ1 5,17 and potent degradation with dBET-6 32 and ARV-771 31, but the combination of these to achieve maximal favorability in the ternary complex to enhance degradation had not yet been shown.
The transition from bivalent to trivalent degraders might not immediately seem like an obvious approach for improvement of degradation outcomes, particularly given the chemical synthesis challenges and presupposition that increasing molecular weight of degraders would be accompanied by lack of cellular permeability or poor pharmacokinetics. However, with the trivalent PROTAC studied here, we have demonstrated that this is not the case. While indeed SIM1 has slightly reduced permeability compared to parent bivalent inhibitor and PROTACs, it outperformed those in relevant cellular assays used for assessment of BET compound potential for therapeutic use. Furthermore, the remarkably favourable PK profile of SIM1 suggests trivalent PROTACs will be appropriate for in vivo use despite their increased molecular weight. The enhanced potency and increased sites of binding of trivalent PROTACs might potentially allow to alleviate or circumvent some of the emerging cancer resistance mechanisms with monovalent and bivalent degraders, such as missense mutations on the target protein46.
While the chemical design and synthesis of a trivalent PROTAC is more involved than for bivalent ones, the increased effort showed significant benefits and allowed to overcome these perceived challenges, affording a much-improved degrader. To achieve this, outlined is a new linker design strategy for generation of a branched trifunctional scaffold to which both target and E3 binders could be conjugated, which provides highly modular design and opens to numerous future applications (Fig. 6c). Though we have shown here increased valency to address two repeat domains within a target, trivalent compounds could be directed towards two distinct domains on the same protein. A multivalent design concept could be applied to any three protein targets if binding ligands for each are known, wherein all three warheads engage if structural constraints allow (Fig. 6c). Multivalent avidity may allow leveraging weak intramolecular binding at the ternary complex interface, and best exploiting weak binding ligands which can be readily found but can be challenging to optimize as part of mono- or bivalent agents 47. One might imagine two subunits within a multi-protein complex, or even two distinct proteins (albeit at the expense of avidity), could be recruited either simultaneously or independently to the E3 ligase. While this manuscript was in advanced stages of revision, a dual-target PROTAC compound consisting of three warheads was reported,48 however not shown to engage all three warheads simultaneously as we report here.
Initial work with multi-specific drug modalities has been transformative for drug discovery and greatly expanded the therapeutic landscape 1. This trivalent compound concept is not limited to E3 ligase recruitment, and could find utility beyond PROTACs for emerging approaches for small-molecule induced proximity 49–50. We thus anticipate broad applicability of the approach to improve performance of a wide range of multi-specific agents and modalities for chemical biology and pharmaceutical development.
Methods
Compounds
Detailed synthesis of new compounds and their intermediates is described in the Supplementary Information. MZ1 5, MT1 33 and ARV-771 31 were synthesized following previously described procedures, unless stated otherwise.
Cell lines and culture
HEK293, 22Rv1, A549, HL-60 and MV4;11 cells (ATCC) were grown in DMEM and RPMI (Invitrogen) respectively and supplemented with 10% v/v fetal bovine serum (FBS) (South American origin, Life Science Production) at 37°C and 5% CO2 in a humidified atmosphere. CRISPR HiBiT-BRD2, HiBiT-BRD3, and HiBiT-BRD4 HEK293 cells stably expressing LgBiT were grown in DMEM with 10% v/v FBS and CRISPR cMyc-HiBiT MV4;11 cells were grown in RPMI with 10% v/v FBS.
Vector constructs
Wild-type and mutant versions of human proteins BRD2 (P25440), BRD3 (Q15059) and BRD4 (O60885) VHL (UniProt accession number: P40337), ElonginC (Q15369), ElonginB (Q15370), and Ubiquitin UBB (UniProt P0CG47) were used for all protein expression. Cloning of BRD2 tandem into the pCri11b vector with an N-terminal His6-SUMO tag and a SENP1 cleavage site is detailed in a previous publication 51. pET-His-SUMO TEV BRD4 tandem was produced by cloning truncated BRD4 containing the two bromodomains (residue 1- 463) into parent pET His6 Sumo TEV LIC cloning vector (1S) using ligase independent cloning. pET His6 Sumo TEV LIC cloning vector (1S) was a gift from Scott Gradia (Addgene plasmid # 29659). Quikchange mutagenesis was performed on pET-His-SUMO BRD4 tandem with mutagenic primer following standard procedures, to generate mutant with the conserved Asparagine sitting in the Acetyl-lysine binding pocket substituted with Phenylalanine, i.e. BRD4 N140F and BRD4 N433F. For cellular NanoBRET experiments, the following vectors were generated: N-terminal NanoLuc fusions of full-length human BRD4 wild-type (WT), N140F, or N433F, HaloTag-VHL (Promega), HaloTag-UBB (Promega), and the biosensor BRD4 NanoLuc-BD1-BD2-HaloTag containing the tandem BD1-BD2 domain (AA 44-460) with a wild-type sequence or N433F mutation.
Degradation assays
MV4;11 cells were seeded at 1 x 10⁶ cells/mL of 10 cm dishes for 12-24h before treatment. 22Rv1 and HEK293 cells were seeded at 2.5-6 x 10⁵ cells/well of 6 well plates for 12-24h before treatment. Cells were treated with test compounds with and without inhibitors as indicated or an equivalent volume of DMSO and lysed at the stated time point. For lysis, cells were washed twice in ice cold PBS (Invitrogen) then lysed in 250μL/plate for MV4;11 cells or 50-100μL/well for 22Rv1 and HEK293 cells of ice cold lysis buffer containing 50mM Tris hydrochloride pH 7.4, 150mM sodium chloride, 1mM EDTA pH 7.4, 1 % v/v Triton X-100, 1x Halt™ Protease Inhibitor Cocktail (ThermoFisher). Lysates were sonicated, cleared by centrifugation at 4°C, at 15800 x g for 10 mins and the supernatants stored at -80°C. Protein concentration was determined by BCA assay (Pierce) and the absorbance at 562nm measured by spectrophotometry (NanoDrop ND1000) or on a plate reader (BMG Labtech Pherastar). Samples were run on SDS-PAGE using NuPAGE Novex 4-12% Bis-Tris gels (Invitrogen) with 20-40μg total protein/well, transferred to 0.2μm pore nitrocellulose membrane (Amersham) by wet transfer and blocked with 3% w/v BSA (Sigma) in 0.1% TBST. Blots were incubated in anti-BRD2 (1:2000, abcam #ab139690), anti-BRD3 (1:500, abcam #ab50818), anti-BRD4 (1:1000, abcam #ab128874), anti-c-myc (1:1000, abcam #32072), anti-PARP (1:1000, CST #9542S), anti-cleaved PARP (1:1000, BD Pharmingen #51-9000017), anti-caspase-3 (1:1000, CST #9662S), anti-tubulin (1:3,000, Bio-Rad #12004165) or anti-β-actin (1:2500, CTS #4970S) antibody overnight at 4°C with rotation. Blots were then incubated in goat anti-mouse or donkey anti-rabbit IRDye 800CW secondary antibodies (1:10,000, LICOR #925-32210 and #926-32213) for 1h at room temperature with rotation. Bands were detected using a ChemiDoc MP imaging system (BioRad) and quantified (Image Studio Lite, version 5.2) with normalisation to β-actin and the DMSO control per time point. Data are the average of two biological repeats unless indicated otherwise. Degradation data were plotted and fitted by nonlinear regression using a single-phase exponential decay model using GraphPad Prism.
Cell Viability Assay
MV4;11 cells were incubated with compounds at the desired concentration for 48h on a clear-bottom 384-well plate. MV4;11 cells were kept in RPMI medium supplemented with 10% FBS, L-glutamine. Initial cell density was 3 × 10⁵ per mL. The cells were treated with various concentrations of compound or 0.05% DMSO in triplicates for each concentration point. After treatment, cell viability was measured with Promega CellTiter-Glo luminescent cell viability assay kit according to the manufacturer instructions. Signal was recorded on a BMG Labtech PHERAstar luminescence plate reader with recommended settings. Data were analyzed with GraphPad Prism software to obtain EC50 values of each test compound.
Kinetic Degradation, Quantitation, and compound washout experiments
HEK293 cells (ATCC) stably expressing LgBiT (Promega) were edited using CRISPR/Cas9 to endogenously HiBiT tag the N-terminal genomic loci of BRD2, BRD3, or BRD4 23. For kinetic degradation assays, cells were plated in quadruplicate in white 96-well tissue culture plates at a density of 2 × 10⁴ cells per well in 100μL of growth medium and incubated overnight at 37°C, 5% CO2. The following day, medium was replaced with CO2-independent medium (Gibco) containing a 1:100 dilution of Endurazine (Promega) and were incubated at 37°C in 5% CO2 for 2.5h before addition of a 3-fold serial dilution of the indicated concentrations of SIM1, SIM2, SIM3, or ARV-771 (MedChemExpress). Plates retaining lids were placed into the GloMax Discover Microplate Reader (Promega) set to 37°C, and continuous luminescent measurements with readings every 5-15min were made over a 22-24h period. Degradation rate (λ), degradation rate plateau (λmax), and degradation plateau (Dmax) were calculated from above determined kinetic degradation profiles. Briefly, the degradation portion of each kinetic concentration curve was fitted to a single exponential equation where ƛ = degradation rate in units of h–1. The degraded fraction, Dmax, was calculated as 1 – plateau. For each curve, the data points before onset of degradation were excluded from the fits. The Dmax was then plotted against concentration to determine Dmax50 values. For compound washout assays, the CRISPR HiBiT BRD2, BRD3, and BRD4 HEK293 cells were plated as described above for kinetic assays and treated with SIM1 (100nM and 10nM), (R,S)-SIM1 and MZ1 (both at 100nM), and equivalent volume of DMSO for a period of 3.5h, with continual luminescence monitoring. The concentrations were chosen to allow achieving >70% Dmax of all three BET proteins at 3.5h with all three compounds, with the caveat that they reflect different relative ratios with DC50 values for each protein-compound combination. At 3.5h, media was removed and replaced with CO2-independent medium containing Endurazine. The plates were placed back in the luminometer for continued monitoring of protein levels for a further 46.5h.
Mass spectrometry proteomics
Sample preparation
MV4;11 cells in RPMI (Invitrogen) were seeded at 5 × 10⁶ cells on a 100mm plate 24 h before treatment. Cells were treated in triplicate by addition of test compound. After 4 h, the cells were centrifuged at 250g for 5 min and washed twice with 12mL of cold PBS. Cells were lyzed in 500μL of 100mM TRIS pH 8.0, 4% (w/v) SDS supplemented with protease inhibitor cocktail (Roche). The lysate was pulse sonicated briefly and then centrifuged at 15,000g for 10 min at 4°C. Samples were quantified using a micro BCA protein assay kit (Thermo Fisher Scientific) and 200μg of each sample was processed and digested using the filter aided sample preparation method followed by alkylation with iodoacetamide and digestion with trypsin as previously described 17. The samples were then desalted using a 7mm, 3mL C18 SPE cartridge column (Empore, 3M) and labeled with TMT 10-plex Isobaric Label Reagent Set (Thermo Fisher Scientific) as per the manufacturer’s instructions. After labeling, the peptides from the nine samples were pooled together in equal proportion. The pooled sample was fractionated using high pH reverse-phase chromatography on an XBridge peptide BEH column (130Å, 3.5μm, 2.1 × 150mm, Waters) on an Ultimate 3000 HPLC system (Thermo Scientific/Dionex). Buffers A (10mM ammonium formate in water, pH 9) and B (10mM ammonium formate in 90% acetonitrile, pH 9) were used over a linear gradient of 5 to 60% buffer B over 60 min at a flow rate of 200μL min-1. Then, 80 fractions were collected before concatenation into 20 fractions on the basis of the ultraviolet signal of each fraction. All the fractions were dried in a Genevac EZ-2 concentrator and resuspended in 1% formic acid for mass spectrometry analysis.
LC–MS/MS analysis
The fractions were analyzed sequentially on a Q Exactive HF Hybrid Quadrupole-Orbitrap Mass Spectrometer (Thermo Scientific) coupled to an UltiMate 3000 RSLCnano ultra HPLC system (Thermo Scientific) and EasySpray column (75μm ×50cm, PepMap RSLC C18 column, 2μm, 100Å, Thermo Scientific). Buffers A (0.1% formic acid in water) and B (0.08% formic acid in 80% acetonitrile) were used over a linear gradient from 5 to 35% buffer B over 125 min at 300nL min−1. The column temperature was 50°C. The mass spectrometer was operated in data dependent mode with a single mass spectrometry survey scan from 335–1,600 m/z followed by 15 sequential m/z dependent MS2 scans. The 15 most intense precursor ions were sequentially fragmented by higher energy collision dissociation. The MS1 isolation window was set to 0.7 m/z and the resolution set at 120,000. MS2 resolution was set at 60,000. The automatic gain control (AGC) targets for MS1 and MS2 were set at 3 × 10⁶ ions and 1 × 10⁵ ions, respectively. The normalized collision energy was set at 32%. The maximum ion injection times for MS1 and MS2 were set at 50 and 200 ms, respectively.
Peptide and protein identification
The raw mass spectrometry data files for all 20 fractions were merged and searched against the Uniprot-sprot-Human-Canonical database by MaxQuant software v.1.6.0.16 for protein identification and TMT reporter ion quantitation. The MaxQuant parameters were set as follows: enzyme used trypsin/P; maximum number of missed cleavages equal to two; precursor mass tolerance equal to 10 ppm; fragment mass tolerance equal to 20 ppm; variable modifications: oxidation (M), acetyl (N-term), deamidation (NQ), Gln→pyro-Glu (Q N-term); fixed modifications: carbamidomethyl (C). The data was filtered by applying a 1% false discovery rate followed by exclusion of proteins with fewer than two unique peptides. Quantified proteins were filtered if the absolute fold-change difference between the three DMSO replicates was ≥1.5.
Monitoring cMyc Loss and Cell Viability in MV4;11 Cells
CRISPR cMyc-HiBiT MV4;11 cells (Promega) were plated at a density of 5 × 10⁴ cells per well in solid, white 96-well tissue culture plates (Corning Costar #3917). Following an overnight incubation, they were treated with 1-100nM of the indicated compounds and at the plotted time points, and cMyc levels were determined using luminescent measurement with NanoGlo HiBiT lytic reagent (Promega). Replicate plates of all compound treatments were prepared and at identical timepoints as the protein level measurements, and cell viability was measured using Cell-Titer Glo (Promega). Plates were shaken on an orbital shaker for 10-20 min before reading luminescence on a GloMax Discover Microplate Reader (Promega).
Caspase-Glo® 3/7 assays
22Rv1 cells were seeded at 10,000 cells/well of white 96 well plates (Corning #3917) 12-24h before treatment with test compounds with and without inhibitors or an equivalent volume of DMSO for 24h. 100μL/well of Caspase-Glo 3/7 Reagent (Promega) was added and the plate shaken at 500 rpm for 30 s. The plate was incubated for 2h and luminescence measured using a PHERAstar FS plate reader (BMG Labtech).
Clonogenic assay
22Rv1 cells were treated with 10nM SIM1, cis-SIM1, MT1, MZ1 and ARV-711 for 24h. The next day, cells were trypsinised and counted. 500 cells were re-plated and allowed to grow at 37°C and 5% CO2 for 20 days. After 20 days incubation, the cells were fixed with ice-cold 100% (v/v) methanol for 30 min at 4°C. Afterwards, methanol was removed, and the cells were stained with 500μl 0.1% crystal-violet dye (in MeOH) for 30 min at room temperature. Following incubation, the cells were washed with dH2O and left to dry overnight. Plates were scanned on an Epson Perfection V800 Photo scanner. And image analysis was done in ImageJ software v. 1.52n. Plating efficiency (PE) was calculated by counting colonies for each treatment condition and dividing the average by number of cells plated. Survival fraction was determined by diving PE of treated cells by PE of untreated cells, multiplied by 100 52. Bar graphs were generated using GraphPad Prism software. Two independent experiments were performed.
Flow Cytometry
MV4;11 cells were counted on a Countess 3 Automated Cell Counter (Thermo Fisher, UK) with the addition of trypan blue. Cells (1x10⁶) were aliquoted, spun down and resuspended in RPMI media containing test compounds at indicated concentrations. Additionally, QVD OPh (Sigma-Aldrich, UK) and Necrostatin-1 (Sigma-Aldrich) were added to the SIM1 treatment at 20μM final concentration. Treated cells were left to incubate for 24h at 37°C and 5% CO2. On the following day, the cells were collected in a Falcon tube and spun down at 500g for 5 min. Supernatant was aspirated and cells were washed once in 1mL FACS buffer (PBS, 5% FBS, 0.05 % NaN) and afterwards resuspended in 100μL of the same buffer containing Apotracker Green (Biolegend, UK) and DAPI (Sigma-Aldrich) at final concentration of 400nM and 1μg/mL, respectively. Cells were incubated for 20 min on ice and afterwards washed in 1mL of FACS buffer and finally resuspended in 500μL of the same buffer. Measurements were done on BD FACS Canto II flow cytometer (Flow Cytometry and Cell sorting facility, University of Dundee, UK) using blue (ex: 488 nm; em: 530±30 nm) and violet (ex: 405 nm; em: 450±50 nm) laser for detection of FITC and DAPI, respectively. Data were analysed on FlowJo™ 10.7.1. Software and GraphPad Prism. Gating strategy is detailed in Supplementary Figure 1.
Protein expression and purification
For expression of BRD4 tandem construct, N-terminally His6-SUMO-tagged BRD4 (1–463) or similar mutants were expressed in Escherichia coli BL21(DE3) at 18°C for 16h using 0.4mM isopropyl β-D-1-thiogalactopyranoside (IPTG). N-terminally His6-SUMO-tagged BRD2 tandem (73-455) was induced to express in E. coli BL21(DE3) with 0.3 mM IPTG at 18°C for 16h. E. coli cells were lysed using a pressure cell homogenizer (Stansted Fluid Power) or a CF1 Cell Disruptor (Constant Systems Ltd) and lysate clarified by centrifugation. Proteins were purified on a HisTrap HP 5 mL affinity column (GE Healthcare) by elution with an imidazole gradient. The proteins were dialyzed overnight into low imidazole concentration buffer in dialysis bags (14.5 kDa MWCO) with either TEV protease for BRD4 or SENP1 protease for BRD2 to remove the His6-SUMO tags. The cleaved proteins were then flowed through the HisTrap HP column a second time, allowing impurities to bind, as the recombinant proteins eluted without binding. The proteins were then additionally purified by cation exchange and size-exclusion chromatography using HiTrap SP HP 5 mL and Superdex-200 16/600 columns (GE Healthcare), respectively. The final purified proteins were stored in 20mM HEPES, pH 7.5, 100mM sodium chloride and 1mM TCEP. The VCB complex was expressed and purified as described previously 17. Briefly, N-terminally His6-tagged VHL (54–213), ElonginC (17–112) and ElonginB (1– 104) were co-expressed and the complex was isolated by Ni-affinity chromatography, the His6 tag was removed using TEV protease, and the complex further purified by anion exchange and size-exclusion chromatography. The BET protein BDs were expressed and purified as described previously 17. Briefly, N-terminally His6-tagged BRD2-BD1 (71–194), BRD2-BD2 (344–455), BRD3-BD1 (24–146), BRD3-BD2 (306–416), BRD4-BD1 (44–178) and BRD4-BD2 (333–460) were expressed and isolated by Ni-affinity chromatography and size-exclusion chromatography.
Size exclusion chromatography (SEC)
SEC experiments were carried out in a ÄKTA pure system (GE Healthcare) at room temperature. The oligomeric state of the BRD4 BD1-BD2 tandem protein in solution was analyzed by gel filtration in a buffer containing 20mM HEPES (pH 7.5), 100mM NaCl and 1mM TCEP using a Superdex 200 Increase 10/300 GL column (GE Healthcare) calibrated with globular proteins of known molecular weight (GE Healthcare, 28-4038-41/42). BRD4 tandem (25 μM) was incubated with SIM1 (25μM), MZ1 (25μM), MT1 (25μM) or DMSO (0.5 %) for 30 min at room temperature prior to injection. Sample volume for each injection was 200μl, and the flow rate was 0.8 ml/min. Peak elution was monitored using ultraviolet absorbance at 280nm.
ITC
Titrations were performed as reverse titration on an ITC200 micro-calorimeter (Malvern). SIM1 was not soluble enough to be loaded at the required concentrations in the syringe (normal direct titration), therefore reverse titrations were performed. The titrations consisted of 19 injections of 2μl tandem BRD4 BD1-BD2 construct (WT or N140F or N433F) solution in 20mM Bis–Tris propane, 100mM NaCl, 1mM TCEP, 1.6% DMSO, pH 7.5, at a rate of 0.5μl/s at 120 s time intervals. An initial injection of protein (0.4μl) was made and discarded during data analysis. All experiments were performed at 25°C, whilst stirring at 750 r.p.m. SIM1 from 10mM DMSO stock solution and VCB were diluted in buffer containing 20mM Bis-Tris propane, 100mM NaCl, 1mM TCEP, pH 7.5. The final DMSO concentration was 1.6% v/v. BRD4 protein (200μM, in the syringe) was titrated into the SIM1-VCB complex (SIM1 16μM, VCB 32μM, in the cell). Data were fitted to a single-binding site model for each BRD4 mutant to obtain the stoichiometry (n), the dissociation constant (Kd) and the enthalpy of binding (ΔH). Data for WT BRD4 was fitted to a two sets of sites model to account for the reverse titration set-up whereby a two-site protein is titrated into a bivalent ligand (see Malvern MicroCal ITC analysis software using Origin™ User Manual, pg. 102). Data fitting was performed using Microcal LLC ITC200 Origin software provided by the manufacturer.
zAlphaLISA assays
Ligands were titrated against 4nM His-tagged BRD4 BD2 and 10nM biotinylated JQ1. All reagents were diluted in 50mM HEPES, 100mM NaCl, 0.1% BSA, 0.02% CHAPS, pH7.5 (final concentration). On VCB premixed condition, the buffer also included 12.5μM VCB. Ligands were tested over an 11-point 3-fold serial dilution in duplicates for each concentration point, starting at 100μM without VCB or starting at 10μM with 20μM VCB, and giving a final DMSO concentration of 1%. Binding was detected using anti-His6 antibody-conjugated AlphaLISA acceptor beads and streptavidin-coated donor beads (PerkinElmer), with a final concentration of 10μg/ml for each bead). Titrations were prepared in white 384-well Alphaplates (PerkinElmer), and read on a Pherastar FS plate reader (BMG) equipped with an AlphaLISA excitation/emission module. Data was analyzed and dose-response curves generated using GraphPad Prism. Each assay well had a final volume of 25μl. First 10μl of 2.5X ligand or 2.5X ligand with VCB was mixed with 5μl of a 5X mix of bromodomain and biotinylated JQ1 and incubated for 1h at room temperature. The assay plate was then moved to a dark room and 5μl of 5X acceptor beads were added and incubated for 1h. Then (still in darkness) 5μl of 5X donor beads were added, the plate was incubated for 1h before being read.
Fluorescence polarization assay
Fluorescence polarization (FP) competitive binding assays were run as described previously 25 with a final volume of 15μL, with each well solution containing 15 nM VCB protein, 10nM FAM-labeled HIF-1α peptide (FAM-DEALAHypYIPMDDDFQLRSF, “JC9”) and decreasing concentrations of SIM1 (15-point 2-fold serial dilution starting from 10μM) or SIM1:BET tandem bromodomain protein (15-point 2-fold serial dilutions starting from 10μM SIM1:20μM BET protein). Assays were prepared in triplicate on 384-well plates (Corning 3575) and all measurements taken using a PHERAstar FS (BMG LABTECH) with fluorescence excitation and emission wavelengths (λ) of 485 and 520nm, respectively. Components were dissolved from stock solutions using 100mM Bis-Tris propane, 100mM NaCl, 1mM TCEP, pH 7.0, and DMSO was added as appropriate to ensure a final concentration of 1%. Control wells containing VCB and JC9 with no compound (zero displacement), or JC9 in the absence of protein (maximum displacement) were also included to allow for normalization. Normalized (%) displacement values were plotted against log[SIM1] and curves were fitted by nonlinear regression using GraphPad Prism to determine the IC50 values for each titration. Ki values were back-calculated from the K d for JC9 (~2nM, determined from direct binding) and fitted IC50 values, as described previously 53. Cooperativity (α) values were calculated from the ratio of binary K i and ternary K i values determined for JC9 displacement by SIM1 alone or SIM1+BET protein, respectively.
SPR binding studies
SPR experiments were performed on Biacore T200 instruments (GE Healthcare) as described previously 25. Immobilization of biotinylated VCB was carried out at 22 °C on a Series S SA chip in an immobilisation buffer containing 20 mM HEPES, 150 mM NaCl, 1 mM TCEP, 0.05 % TWEEN 20, pH 7.0. For binary studies (binding of SIM1 only) the final surface density of biotinylated VHL was approximately 1600-1800 RU; for ternary studies (binding of pre-formed SIM1:target protein complex) multiple lower surface densities of biotinylated VHL were used (30-50 RU) to minimize mass transfer effects. Biotinylated VCB was prepared as previously described 54. All interaction experiments were performed at 22 °C in a running buffer containing 20mM TRIS, 250mM NaCl, 0.2% (w/v) PEG 3350, 0.2% (w/v) BSA, 1mM TCEP, 0.05% TWEEN 20, 1% DMSO; pH 7.5.
For binary interaction experiments, SIM1 were initially prepared at 1.5μM solution in the running buffer containing 1% DMSO. This stock solution was then serially diluted in the running buffer containing 1% DMSO (two-fold serial dilution). Solutions were injected individually (duplicate wells) in multi-cycle kinetic format (contact time 60s, flow rate 50 μL/min, dissociation time 150s) using a stabilization period of 30s and syringe wash (50 % DMSO) between injections.
For ternary interaction experiments, SIM1 were initially prepared at 500nM in the running buffer containing 2% DMSO. This solution was mixed 1:1 with a solution of 1μM of the BET tandem protein in the running buffer without DMSO, to prepare a final solution of 250nM SIM1 and 500nM BET in running buffer containing 1% DMSO. This complex was then serially diluted in the running buffer containing 500nM BET and 1% DMSO (5-point three-fold serial dilution). All ternary experiments were run in both single-cycle and multi-cycle kinetic modes (two replicate series per experimental repeat, contact time 60s, flow rate 100μL/min, dissociation time 600s) using a stabilization period of 30s and syringe wash (50% DMSO) between injections. Two series of blank injections were performed for all experiments. Sensorgrams from reference surfaces and blank injections were subtracted from the raw data before data analysis using Biacore Insight Evaluation Software. To calculate the association rate (kon), dissociation rate (koff), and dissociation constant (KD), experiments were fitted using a 1:1 Langmuir interaction model, with a term for mass-transport included.
NanoBRET Ubiquitination, Ternary Complex, and Biosensor Experiments.
For endogenous live cell BET:Ubiquitin,BET:VHL, and BET:CRBN assays, CRISPR HiBiT-BRD2, HiBiT-BRD3, and HiBiT-BRD4 HEK293 cells stably expressing LgBiT were transfected with 2μg of HaloTag-UBB,HaloTag-VHL, or HaloTag-CRBN vectors in 6-well plates using FuGENE HD (Promega). For full transient NanoBRET experiments with NanoLuc-BRD4 WT, N433F, or N140F mutants, HEK293 cells (8 ×10⁵) were co-transfected with 0.02μg NanoLuc-BRD4 and 2μg of HaloTag-VHL vectors. For transient NanoBRET experiments with the BRD4 NL-BD1-BD2-HT biosensor containing either the WT tandem BD1-BD2 domain the N433F mutation, HEK293 cells (8 ×10⁵) were transfected with 0.02μg biosensor plasmid and 2μg carrier DNA. The following day, transfected cells (2 × 10⁴) were replated in quadruplicate into white 96-well tissue culture plates in the presence or absence of HaloTag NanoBRET 618 Ligand (Promega) and incubated overnight at 37°C, 5% CO2. For kinetic experiments, medium was replaced with Opti-MEM (Gibco) containing a 1:100 dilution of Vivazine (Promega), and plates were incubated at 37 °C, 5% CO2, for 1h before addition of DMSO or 10nM-1μM final concentration of the indicated compounds. Continual BRET measurements were then made every 3 min up to 5h on a CLARIOstar equipped with an atmospheric control unit (BMG Labtech) set to 37 °C and 5% CO2. For the biosensor experiments, the cells were treated with a 3-fold serial titration of 10μM of the indicated compounds. NanoBRET NanoGlo (Promega) substrate was added and BRET was measured two hours post-compound treatment using a GloMax Discover Microplate Reader (Promega). Dual filtered luminescence was collected with a 460/80nm bandpass filter and a 610nm long pass filter (acceptor, HaloTag NanoBRET ligand) using an integration time of 0.5 s. For all NanoBRET experiments, background subtracted NanoBRET ratios expressed in milliBRET units.Fold increase in BRET was calculated by normalizing mBRET ratios to the average mBRET ratios for DMSO controls.
NanoBRET Target Engagement and Residence Time
For target engagement experiments in live and permeabilized cells, CRISPR HiBiT-BRD2 and BRD4 HEK293 cells stably expressing LgBiT or HEK293 cells transfected with VHL-NanoLuc fusion (Promega N275A) were plated into white 96-well tissue culture plates at a density of 2 × 10⁴ cells/well. Cells were equilibrated for 1h for BET family experiments and 5h for VHL with energy transfer probes and the indicated test compound prior to NanoBRET measurements. NanoBRET tracers were prepared at a working concentration of 20X in tracer dilution buffer (12.5mM HEPES, 31.25% PEG-400, pH 7.5). To measure NanoBRET in live cells, NanoBRET BRD Tracer-02 was added to cells at a final concentration of 0.5μM for BET family experiments and for VHL target engagement assays, NanoBRET VHL tracer was added at a final concentration of 1μM. NanoBRET NanoGlo Substrate and Extracellular NanoLuc Inhibitor (Promega) for VHL assay were added according to the manufacturer’s recommended protocol, and filtered luminescence was measured on a GloMax Discover Microplate Reader (Promega) equipped with 450 nm BP filter (donor) and 600 nm LP filter (acceptor) using 0.3 s integration time. To measure NanoBRET in permeabilized cells, digitonin was added to the cells to a final concentration of 50μg/mL, tracer was added to a final concentration of 0.25μM, and Extracellular NanoLuc inhibitor was omitted during the detection step. Tracer and test compounds were incubated for 10 min prior to measuring BRET. For residence time experiments CRISPR HiBiT-BRD2 and BRD4 HEK293 cells stably expressing LgBiT were trypsinized, washed and resuspended to a density of 2 × 10⁵ cells/ml in Opti-MEM and incubated with either 1μM JQ1, 1μM SIM1, 100nM cis-SIM1, 10μM (R,S)-SIM1, 100nM MT1, 10μM MZ1 or 10μM cis-MZ1 representing the representative IC80 values for tracer displacement in live cell format. Cells were incubated in 15mL conical tubes with caps loosened in a tissue culture incubator for 1h. Following incubation, cells were spun at 300x g for 5 min, washed once with Opti-MEM, spun a second time at 300x g for 5 min, then resuspended with fresh Opti-MEM before plating at 2 × 10⁴ cells/well. NanoBRET BRD Tracer-02 was added at a final concentration of 0.5μM cells and kinetic NanoBRET measurements were collected. NanoBRET ratios were expressed in milliBRET units and calculated according to the equation in the NanoBRET Ubiquitination, Ternary Complex and Biosensor Experiments section.
Statistics and reproducibility
Information regarding error bars, numbers of replicates or samples, and statistical analyses are described in the corresponding figure legends. Representative results of at least two independent experiments are shown unless otherwise indicated.
Reporting Summary
Further information on research design is available in the Nature Research Reporting Summary linked to this paper.
Extended Data
Extended Data Fig. 1.
Extended Data Fig. 2.
Extended Data Fig. 3.
Extended Data Fig. 4.
Extended Data Fig. 5.
Extended Data Fig. 6.
Extended Data Fig. 7.
Extended Data Fig. 8.
Supplementary Material
Acknowledgements
We thank Adam Bond for the synthesis of ARV-771; Guang Liu, Qi Gu, Na Li, Cheng Ji, Shiqun Liao, Chunlei Wang, Huizhao Li and Bixi Guan at ChemPartner for in vivo PK; and Will Farnaby and Thomas Kirkland for discussions and critical reading of the manuscript.
Funding Sources
Research reported in this publication was supported by the European Research Council (ERC, Starting Grant ERC-2012-StG-311460 DrugE3CRLs to A.C.), and Ono Pharma (visiting scientist fund to S.I.). Biophysics and drug discovery activities were supported by Wellcome Trust strategic awards to Dundee (100476/Z/12/Z and 094090/Z/10/Z, respectively). K.M.R., S.D.M., N.M., M.U., and D.L.D. are funded by Promega Corporation.
Footnotes
Author Contributions
A.C. and D.L.D. conceived the idea, directed and supervised the project, and have overall project responsibility. S.I. optimized synthetic routes and synthesized all compounds, performed degradation and cell viability assays, expressed and purified proteins, and performed SEC, AlphaLISA, ITC and SPR assays. K.M.R. performed kinetic degradation assays, washout, and NanoBRET cellular ternary complex, ubiquitination, target engagement, and residence time assays. N.M. designed and synthesized (R,S)-SIM1, scaled up synthesis of SIM1 for in vivo experiments, performed FP and SPR binding assays. V.V. performed PARP-cleavage, clonogenic assays and flow cytometry analysis of apoptosis with assistance from C.C. C.W. performed degradation and Caspase-Glo assays. S.J.H. performed FP displacement assays. N.T. performed mass-spec proteomics assays. S.D.M. performed cellular cMyc and viability assays. N.M. performed the NanoBRET biosensor and mutant ternary complex assays. K.-H. C. designed and cloned tandem BRD4 WT and mutant constructs. A.D.C. expressed and purified tandem BET protein constructs. A.T., C.M. and A.C. designed compounds. A.T. and C.M. designed synthetic routes. M.U. discussed strategy and analyzed data. S.I., K.M.R, D.L.D. and A.C. wrote the manuscript with contributions from all authors.
Competing Interests
The authors declare the following competing financial interest(s): The Ciulli laboratory receives or has received sponsored research support from Almirall, Amphista therapeutics, Boehringer Ingelheim, Eisai, Nurix therapeutics, and Ono Pharmaceuticals. A.C. is a scientific founder, shareholder, and consultant of Amphista therapeutics, a company that is developing targeted protein degradation therapeutic platforms. Promega Corporation is the commercial owner by assignment of patents of the HaloTag, NanoLuc, NanoBRET target engagement, and HiBiT technologies and their applications and K.M.R., S.D.M., N.M. (Nancy Murphy), M.U., and D.L.D. are employees of Promega Corporation. S.I. is an employee of Ono Pharmaceutical. S.H. and A.T. are employees of Amphista therapeutics. K.C. is an employee of GlaxoSmithKline.
Data availability
The authors declare that all data supporting the findings of this study are available within the paper and its supplementary information files. Mass spectrometry proteomics data (Fig. 2e and Extended Data Fig. 2f) are provided in Supplementary Data Set 1. The study report of pharmacokinetics of SIM1 following Single IV and SC administrations to mice provided by Chempartner Co. Ltd, is provided in Supplementary Data Set 2. The study report of BromoScan profiling service data (Fig. 5a) is provided as Supplementary Data Set 3. Source data for Figures 1 and 3, and Extended Data Figures 1, 3 and 4 are provided with this paper.
References
- 1.Deshaies RJ. Multispecific drugs herald a new era of biopharmaceutical innovation. Nature. 2020;580:329–338. doi: 10.1038/s41586-020-2168-1. [DOI] [PubMed] [Google Scholar]
- 2.Che Y, Gilbert AM, Shanmugasundaram V, Noe MC. Inducing protein-protein interactions with molecular glues. Bioorg Med Chem Lett. 2018;28:2585–2592. doi: 10.1016/j.bmcl.2018.04.046. [DOI] [PubMed] [Google Scholar]
- 3.Maniaci C, Ciulli A. Bifunctional chemical probes inducing protein-protein interactions. Curr Opin Chem Biol. 2019;52:145–156. doi: 10.1016/j.cbpa.2019.07.003. [DOI] [PubMed] [Google Scholar]
- 4.Pettersson M, Crews CM. PROteolysis TArgeting Chimeras (PROTACs) - Past, present and future. Drug Discovery Today: Technologies. 2019;31:15–27. doi: 10.1016/j.ddtec.2019.01.002. [DOI] [PMC free article] [PubMed] [Google Scholar]
- 5.Zengerle M, Chan K-H, Ciulli A. Selective Small Molecule Induced Degradation of the BET Bromodomain Protein BRD4. ACS Chem Biol. 2015;10:1770–1777. doi: 10.1021/acschembio.5b00216. [DOI] [PMC free article] [PubMed] [Google Scholar]
- 6.Winter GE, et al. Phthalimide conjugation as a strategy for in vivo target protein degradation. Science. 2015;348:1376–1381. doi: 10.1126/science.aab1433. [DOI] [PMC free article] [PubMed] [Google Scholar]
- 7.Bondeson DP, et al. Catalytic in vivo protein knockdown by small-molecule PROTACs. Nat Chem Biol. 2015;11:611–617. doi: 10.1038/nchembio.1858. [DOI] [PMC free article] [PubMed] [Google Scholar]
- 8.Salami J, et al. Androgen receptor degradation by the proteolysis-targeting chimera ARCC-4 outperforms enzalutamide in cellular models of prostate cancer drug resistance. Commun Biol. 2018;1:100. doi: 10.1038/s42003-018-0105-8. [DOI] [PMC free article] [PubMed] [Google Scholar]
- 9.Hu J, et al. Discovery of ERD-308 as a Highly Potent Proteolysis Targeting Chimera (PROTAC) Degrader of Estrogen Receptor (ER) J Med Chem. 2019;62:1420–1442. doi: 10.1021/acs.jmedchem.8b01572. [DOI] [PubMed] [Google Scholar]
- 10.Qin C, et al. Discovery of QCA570 as an Exceptionally Potent and Efficacious Proteolysis Targeting Chimera (PROTAC) Degrader of the Bromodomain and Extra-Terminal (BET) Proteins Capable of Inducing Complete and Durable Tumor Regression. J Med Chem. 2018;61:6685–6704. doi: 10.1021/acs.jmedchem.8b00506. [DOI] [PMC free article] [PubMed] [Google Scholar]
- 11.Zoppi V, et al. Iterative Design and Optimization of Initially Inactive Proteolysis Targeting Chimeras (PROTACs) Identify VZ185 as a Potent, Fast, and Selective von Hippel-Lindau (VHL) Based Dual Degrader Probe of BRD9 and BRD7. J Med Chem. 2019;62:699–726. doi: 10.1021/acs.jmedchem.8b01413. [DOI] [PMC free article] [PubMed] [Google Scholar]
- 12.Farnaby W, et al. BAF complex vulnerabilities in cancer demonstrated via structure-based PROTAC design. Nat Chem Biol. 2019;15:672–680. doi: 10.1038/s41589-019-0294-6. [DOI] [PMC free article] [PubMed] [Google Scholar]
- 13.Zorba A, et al. Delineating the role of cooperativity in the design of potent PROTACs for BTK. P Natl Acad Sci Usa. 2018;115:E7285–E7292. doi: 10.1073/pnas.1803662115. [DOI] [PMC free article] [PubMed] [Google Scholar]
- 14.Popow J, et al. Highly Selective PTK2 Proteolysis Targeting Chimeras to Probe Focal Adhesion Kinase Scaffolding Functions. J Med Chem. 2019;62:2508–2520. doi: 10.1021/acs.jmedchem.8b01826. [DOI] [PubMed] [Google Scholar]
- 15.Burslem GM, et al. The Advantages of Targeted Protein Degradation Over Inhibition: An RTK Case Study. Cell Chem Biol. 2018;25:67–77.:e3. doi: 10.1016/j.chembiol.2017.09.009. [DOI] [PMC free article] [PubMed] [Google Scholar]
- 16.Bensimon A, et al. Targeted Degradation of SLC Transporters Reveals Amenability of Multi-Pass Transmembrane Proteins to Ligand-Induced Proteolysis. Cell Chem Biol. 2020;27:728–739.:e9. doi: 10.1016/j.chembiol.2020.04.003. [DOI] [PMC free article] [PubMed] [Google Scholar]
- 17.Gadd MS, et al. Structural basis of PROTAC cooperative recognition for selective protein degradation. Nat Chem Biol. 2017;13:514–521. doi: 10.1038/nchembio.2329. [DOI] [PMC free article] [PubMed] [Google Scholar]
- 18.Bondeson DP, et al. Lessons in PROTAC Design from Selective Degradation with a Promiscuous Warhead. Cell Chem Biol. 2018;25:78–87.:e5. doi: 10.1016/j.chembiol.2017.09.010. [DOI] [PMC free article] [PubMed] [Google Scholar]
- 19.Olson CM, et al. Pharmacological perturbation of CDK9 using selective CDK9 inhibition or degradation. Nat Chem Biol. 2018;14:163–170. doi: 10.1038/nchembio.2538. [DOI] [PMC free article] [PubMed] [Google Scholar]
- 20.Tovell H, et al. Design and Characterization of SGK3-PROTAC1, an Isoform Specific SGK3 Kinase PROTAC Degrader. ACS Chem Biol. 2019;14:2024–2034. doi: 10.1021/acschembio.9b00505. [DOI] [PMC free article] [PubMed] [Google Scholar]
- 21.Testa A, et al. 3-Fluoro-4-hydroxyprolines: Synthesis, Conformational Analysis, and Stereoselective Recognition by the VHL E3 Ubiquitin Ligase for Targeted Protein Degradation. J Am Chem Soc. 2018;140:9299–9313. doi: 10.1021/jacs.8b05807. [DOI] [PMC free article] [PubMed] [Google Scholar]
- 22.Han X, et al. Discovery of Highly Potent and Efficient PROTAC Degraders of Androgen Receptor (AR) by Employing Weak Binding Affinity VHL E3 Ligase Ligands. J Med Chem. 2019;62:11218–11231. doi: 10.1021/acs.jmedchem.9b01393. [DOI] [PubMed] [Google Scholar]
- 23.Riching KM, et al. Quantitative Live-Cell Kinetic Degradation and Mechanistic Profiling of PROTAC Mode of Action. ACS Chem Biol. 2018;13:2758–2770. doi: 10.1021/acschembio.8b00692. [DOI] [PubMed] [Google Scholar]
- 24.Daniels DL, Riching KM, Urh M. Monitoring and deciphering protein degradation pathways inside cells. Drug Discovery Today: Technologies. 2019;31:61–68. doi: 10.1016/j.ddtec.2018.12.001. [DOI] [PubMed] [Google Scholar]
- 25.Roy MJ, et al. SPR-Measured Dissociation Kinetics of PROTAC Ternary Complexes Influence Target Degradation Rate. ACS Chem Biol. 2019;14:361–368. doi: 10.1021/acschembio.9b00092. [DOI] [PMC free article] [PubMed] [Google Scholar]
- 26.Nowak RP, et al. Plasticity in binding confers selectivity in ligand-induced protein degradation. Nat Chem Biol. 2018;14:706–714. doi: 10.1038/s41589-018-0055-y. [DOI] [PMC free article] [PubMed] [Google Scholar]
- 27.Mammen M, Choi S-K, Whitesides GM. Polyvalent Interactions in Biological Systems: Implications for Design and Use of Multivalent Ligands and Inhibitors. Angew Chem Int Ed Engl. 1998;37:2754–2794. doi: 10.1002/(SICI)1521-3773(19981102)37:20<2754::AID-ANIE2754>3.0.CO;2-3. [DOI] [PubMed] [Google Scholar]
- 28.Kiessling LL, Gestwicki JE, Strong LE. Synthetic multivalent ligands as probes of signal transduction. Angew Chem Int Ed Engl. 2006;45:2348–2368. doi: 10.1002/anie.200502794. [DOI] [PMC free article] [PubMed] [Google Scholar]
- 29.Wu Q, et al. A chemical toolbox for the study of bromodomains and epigenetic signaling. Nat Commun. 2019;10:1915–14. doi: 10.1038/s41467-019-09672-2. [DOI] [PMC free article] [PubMed] [Google Scholar]
- 30.Gilan O, et al. Selective targeting of BD1 and BD2 of the BET proteins in cancer and immunoinflammation. Science. 2020;368:387–394. doi: 10.1126/science.aaz8455. [DOI] [PMC free article] [PubMed] [Google Scholar]
- 31.Raina K, et al. PROTAC-induced BET protein degradation as a therapy for castration-resistant prostate cancer. P Natl Acad Sci Usa. 2016;113:7124–7129. doi: 10.1073/pnas.1521738113. [DOI] [PMC free article] [PubMed] [Google Scholar]
- 32.Winter GE, et al. BET Bromodomain Proteins Function as Master Transcription Elongation Factors Independent of CDK9 Recruitment. Mol Cell. 2017;67:5–18.:e19. doi: 10.1016/j.molcel.2017.06.004. [DOI] [PMC free article] [PubMed] [Google Scholar]
- 33.Tanaka M, et al. Design and characterization of bivalent BET inhibitors. Nat Chem Biol. 2016;12:1089–1096. doi: 10.1038/nchembio.2209. [DOI] [PMC free article] [PubMed] [Google Scholar]
- 34.Waring MJ, et al. Potent and selective bivalent inhibitors of BET bromodomains. Nat Chem Biol. 2016;12:1097–1104. doi: 10.1038/nchembio.2210. [DOI] [PubMed] [Google Scholar]
- 35.Galdeano C, et al. Structure-guided design and optimization of small molecules targeting the protein-protein interaction between the von Hippel-Lindau (VHL) E3 ubiquitin ligase and the hypoxia inducible factor (HIF) alpha subunit with in vitro nanomolar affinities. J Med Chem. 2014;57:8657–8663. doi: 10.1021/jm5011258. [DOI] [PMC free article] [PubMed] [Google Scholar]
- 36.Filippakopoulos P, et al. Selective inhibition of BET bromodomains. Nature. 2010;468:1067–1073. doi: 10.1038/nature09504. [DOI] [PMC free article] [PubMed] [Google Scholar]
- 37.Frost J, et al. Potent and selective chemical probe of hypoxic signalling downstream of HIF-α hydroxylation via VHL inhibition. Nat Commun. 2016;7:13312. doi: 10.1038/ncomms13312. [DOI] [PMC free article] [PubMed] [Google Scholar]
- 38.Zhu XF, et al. Knockdown of heme oxygenase-1 promotes apoptosis and autophagy and enhances the cytotoxicity of doxorubicin in breast cancer cells. Oncol Lett. 2015;10:2974–2980. doi: 10.3892/ol.2015.3735. [DOI] [PMC free article] [PubMed] [Google Scholar]
- 39.Maniaci C, et al. Homo-PROTACs: bivalent small-molecule dimerizers of the VHL E3 ubiquitin ligase to induce self-degradation. Nat Commun. 2017;8:830. doi: 10.1038/s41467-017-00954-1. [DOI] [PMC free article] [PubMed] [Google Scholar]
- 40.Klein VG, et al. Understanding and Improving the Membrane Permeability of VH032-Based PROTACs. ACS Med Chem Lett. 2020;11:1732–1738. doi: 10.1021/acsmedchemlett.0c00265. [DOI] [PMC free article] [PubMed] [Google Scholar]
- 41.Runcie AC, et al. Optimization of a ‘bump-and-hole’ approach to allele-selective BET bromodomain inhibition. Chem Sci. 2018;9:2452–2468. doi: 10.1039/c7sc02536j. [DOI] [PMC free article] [PubMed] [Google Scholar]
- 42.Smith BE, et al. Differential PROTAC substrate specificity dictated by orientation of recruited E3 ligase. Nat Commun. 2019;10:131. doi: 10.1038/s41467-018-08027-7. [DOI] [PMC free article] [PubMed] [Google Scholar]
- 43.Hughes SJ, Ciulli A. Molecular recognition of ternary complexes: a new dimension in the structure-guided design of chemical degraders. Essays Biochem. 2017;61:505–516. doi: 10.1042/EBC20170041. [DOI] [PMC free article] [PubMed] [Google Scholar]
- 44.Testa A, Hughes SJ, Lucas X, Wright JE, Ciulli A. Structure-Based Design of a Macrocyclic PROTAC. Angew Chem Int Ed Engl. 2020;59:1727–1734. doi: 10.1002/anie.201914396. [DOI] [PMC free article] [PubMed] [Google Scholar]
- 45.Fisher SL, Phillips AJ. Targeted protein degradation and the enzymology of degraders. Curr Opin Chem Biol. 2018;44:47–55. doi: 10.1016/j.cbpa.2018.05.004. [DOI] [PubMed] [Google Scholar]
- 46.Jiang B, et al. Discovery and resistance mechanism of a selective CDK12 degrader. Nat Chem Biol. 2021;17:675–683. doi: 10.1038/s41589-021-00765-y. [DOI] [PMC free article] [PubMed] [Google Scholar]
- 47.Lucas X, Van Molle I, Ciulli A. Surface Probing by Fragment-Based Screening and Computational Methods Identifies Ligandable Pockets on the von Hippel-Lindau (VHL) E3 Ubiquitin Ligase. J Med Chem. 2018;61:7387–7393. doi: 10.1021/acs.jmedchem.8b00842. [DOI] [PMC free article] [PubMed] [Google Scholar]
- 48.Zheng M, et al. Rational Design and Synthesis of Novel Dual PROTACs for Simultaneous Degradation of EGFR and PARP. J Med Chem. 2021;64:7839–7852. doi: 10.1021/acs.jmedchem.1c00649. Epub 2021 May 26. [DOI] [PubMed] [Google Scholar]
- 49.Yamazoe S, et al. Heterobifunctional Molecules Induce Dephosphorylation of Kinases-A Proof of Concept Study. J Med Chem. 2020;63:2807–2813. doi: 10.1021/acs.jmedchem.9b01167. [DOI] [PubMed] [Google Scholar]
- 50.Siriwardena SU, et al. Phosphorylation-Inducing Chimeric Small Molecules. J Am Chem Soc. 2020;142:14052–14057. doi: 10.1021/jacs.0c05537. [DOI] [PubMed] [Google Scholar]
- 51.Baud MGJ, et al. A bump-and-hole approach to engineer controlled selectivity of BET bromodomain chemical probes. Science. 2014;346:638–641. doi: 10.1126/science.1249830. [DOI] [PMC free article] [PubMed] [Google Scholar]
- 52.Munshi A, Hobbs M, Meyn RE. Clonogenic cell survival assay. Methods Mol Med. 2005;110:21–28. doi: 10.1385/1-59259-869-2:021. [DOI] [PubMed] [Google Scholar]
- 53.Van Molle I, et al. Dissecting fragment-based lead discovery at the von Hippel-Lindau protein:hypoxia inducible factor 1α protein-protein interface. Chem Biol. 2012;19:1300–1312. doi: 10.1016/j.chembiol.2012.08.015. [DOI] [PMC free article] [PubMed] [Google Scholar]
- 54.de Castro GV, Ciulli A. Spy vs. spy: selecting the best reporter for 19F NMR competition experiments. Chem Commun (Camb) 2019;55:1482–1485. doi: 10.1039/c8cc09790a. [DOI] [PMC free article] [PubMed] [Google Scholar]
Associated Data
This section collects any data citations, data availability statements, or supplementary materials included in this article.
Supplementary Materials
Data Availability Statement
The authors declare that all data supporting the findings of this study are available within the paper and its supplementary information files. Mass spectrometry proteomics data (Fig. 2e and Extended Data Fig. 2f) are provided in Supplementary Data Set 1. The study report of pharmacokinetics of SIM1 following Single IV and SC administrations to mice provided by Chempartner Co. Ltd, is provided in Supplementary Data Set 2. The study report of BromoScan profiling service data (Fig. 5a) is provided as Supplementary Data Set 3. Source data for Figures 1 and 3, and Extended Data Figures 1, 3 and 4 are provided with this paper.


