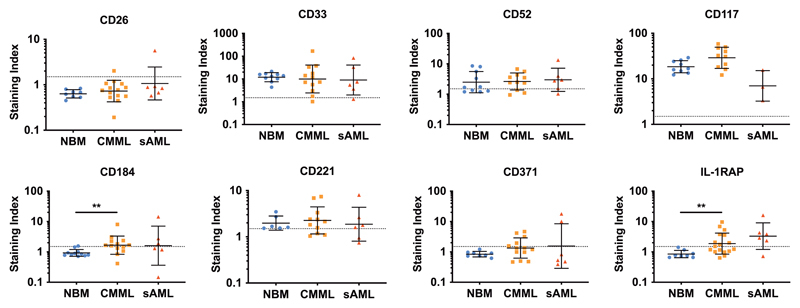
Figure 3. Expression of selected markers on the surface of CMML- and sAML-LSC.
BM samples from patients with CMML (n=20), sAML (n=6) or healthy control samples (normal BM = NBM, n=12) were stained with fluorochrome-labeled antibodies against CD34, CD38 and CD45, and LSC identified as CD34+/CD38– cells (Supplementary Figure S1). Expression of markers and targets on normal BM cells (blue dots), CMML LSC (orange squares) and post-CMML sAML LSC (red triangles) was quantified by multi-color flow cytometry. Results are expressed as staining index (i.e. median fluorescence intensity of the indicated marker divided by the median fluorescence intensity of the isotype control). Each dot represents a single donor. Horizontal lines show geometric mean±SD values in each cohort. The dotted lines (at a staining index of 1.5) show the threshold above which a marker was considered to be positive. **, p<0.01. Abbreviations: NBM, normal bone marrow; CMML, chronic myelomonocytic leukemia; sAML, post-CMML secondary acute myeloid leukemia; IL-1RAP, interleukin-1 receptor accessory protein.

