Abstract
Comparison of intratumor genetic heterogeneity in cancer at diagnosis and relapse suggests that chemotherapy induces bottleneck selection of subclonal genotypes. However, evolutionary events subsequent to chemotherapy could also explain changes in clonal dominance seen at relapse. We, therefore, investigated the mechanisms of selection in childhood B-cell precursor acute lymphoblastic leukemia (BCP-ALL) during induction chemotherapy where maximal cytoreduction occurs. To distinguish stochastic versus deterministic events, individual leukemias were transplanted into multiple xenografts and chemotherapy administered. Analyses of the immediate post-treatment leukemic residuum at single-cell resolution revealed that chemotherapy has little impact on genetic heterogeneity. Rather, it acts on extensive, previously unappreciated, transcriptional and epigenetic heterogeneity in BCP-ALL, dramatically reducing the spectrum of cell states represented, leaving a genetically polyclonal but phenotypically uniform population with hallmark signatures relating to developmental stage, cell cycle and metabolism. Hence, canalization of cell state accounts for a significant component of bottleneck selection during induction chemotherapy.
There is increasing evidence that the evolution of cancers and their responses to treatment are shaped by the complex interplay of their inherent genetic and epigenetic heterogeneities1. However, the relative contributions of these factors to the phenotypes of treatment-resistant tumor cells remain poorly understood.
Intratumor genetic heterogeneity has been observed in all cancers. It evolves through branched trajectories and can be both spatially segregated and highly dynamic2–6. The existence of genetically variegated subclones might explain resistance to chemotherapy and subsequent relapse. Indeed, comparisons of genetic variegation in paired samples from the same patient at diagnosis and relapse have found differences in clonal architecture, suggesting chemotherapy may deterministically select for specific genetic variants 2,7–10. However, relapse typically occurs several months or even years after presentation, and often long after treatment has ceased. Thus, any insights into the biology of chemo-resistance provided by such analyses are retrospective. While the cellular substrate for relapse of any cancer clearly comprises those tumor cells that remain post-treatment, the complex - and often subclinical - process of post-therapy disease re-establishment provides ample opportunity for these cells to proliferate and undergo further genetic evolution that is not the direct result of treatment-induced selection processes. Hence, relapse samples may no longer be directly representative of the genetic landscape that prevailed immediately after therapy.
In addition to intratumor genetic heterogeneity, phenotypic heterogeneity - broadly encapsulated by epigenetic (non-genetic) influences on gene expression - might also provide a substrate for selection during both radio- and chemotherapy11–15. However, whether this occurs independently of variability in genetic makeup remains unknown.
Very few studies have explored the genetic and epigenetic landscape of the disease residuum that persists during treatment16,17. This is largely due to difficulties in obtaining and analyzing the appropriate material when cell numbers are limiting, because sampling tumors is difficult or - particularly in the context of haematological malignancies - because universal tumor cell surface markers are lacking. Furthermore, since each patient has a genetically unique tumor which is treated only once, directly resolving deterministic from stochastic selection is not possible; although in principle could be inferred from large cohorts of patients.
Because of its relatively simple genetics and its restriction to a well-characterized blood lineage, BCP-ALL has proven paradigmatic in illuminating many fundamental principles of cancer biology18,19. While treatment of BCP-ALL is based on a multi-drug extended protocol lasting up to 36 months, maximum cytotoxicity (typically much greater than 99%) is achieved during the first cycle of treatment (induction chemotherapy, lasting 28-days). After this, most patients will be deemed in complete remission, without detectable disease. In some patients, however, a small number of leukemic cells, almost always subclinical and known as minimum or measurable residual disease (MRD), remain post-induction, and these cells presumably provide the substrate for relapse20. Molecular quantification of this residual disease provides the single most potent indicator of long-term clinical outcome21,22; clearly demonstrating the clinical importance of this cell compartment.
To overcome the technical and logistic hurdles outlined above, we used a patient-derived xenograft (PDX) model of BCP-ALL, whereby leukemic cells from children were transplanted into multiple xenograft recipients, each of which developed almost identical leukemias. Mice were then treated with Vincristine (a microtubule poison) and Dexamethasone (a glucocorticoid), mimicking the first 28 days of BCP-ALL treatment. These two drugs form the longstanding core of the standard multi-drug regimens in clinical use, which also typically include the enzyme L-Asparaginase. Additional compounds, acting primarily through targeting nucleic acid and its synthesis (e.g., doxorubicin, cytarabine, methotrexate, 6-MP etc.), are variably used during induction chemotherapy, and always used during the subsequent intensification and maintenance phases. We then deployed a wide range of bulk and single-cell resolution assays to assess at high resolution the genotype and phenotype of the surviving cells.
Results
Defining the clonal architecture of BCP-ALL
To date, genetic variegation in BCP-ALL has been inferred by bulk sequencing and/or multicolour FISH (mFISH) using a limited range of probes. To understand the true extent of intratumoral genetic heterogeneity, and to dissect the likely order in which mutations are acquired, we performed high-resolution single cell whole genome sequencing (scWGS).
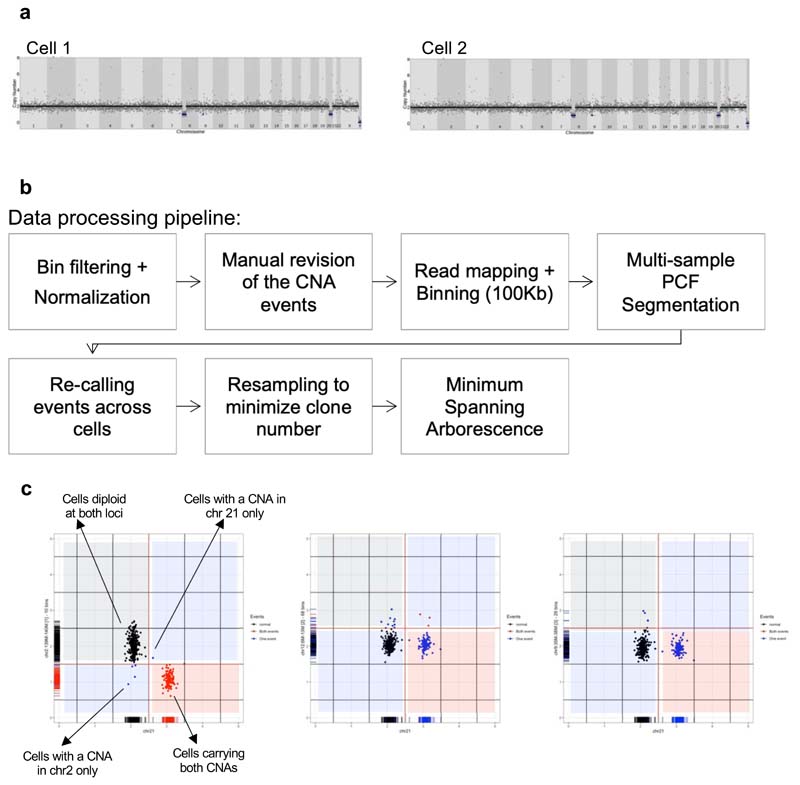
We developed a new script for Picoplex whole-genome amplification (WGA) using the Fluidigm C1 platform, which is suitable for analysing small cell numbers (Extended Data Fig.1). Picoplex chemistry efficiently detects copy number aberrations (CNAs)23, the commonest genomic lesions in BCP-ALL24. We studied clonal complexity in bone marrow (BM) samples taken at diagnosis (i.e. prior to treatment) from six cases of childhood BCP-ALL, analysing 756 cells in total.
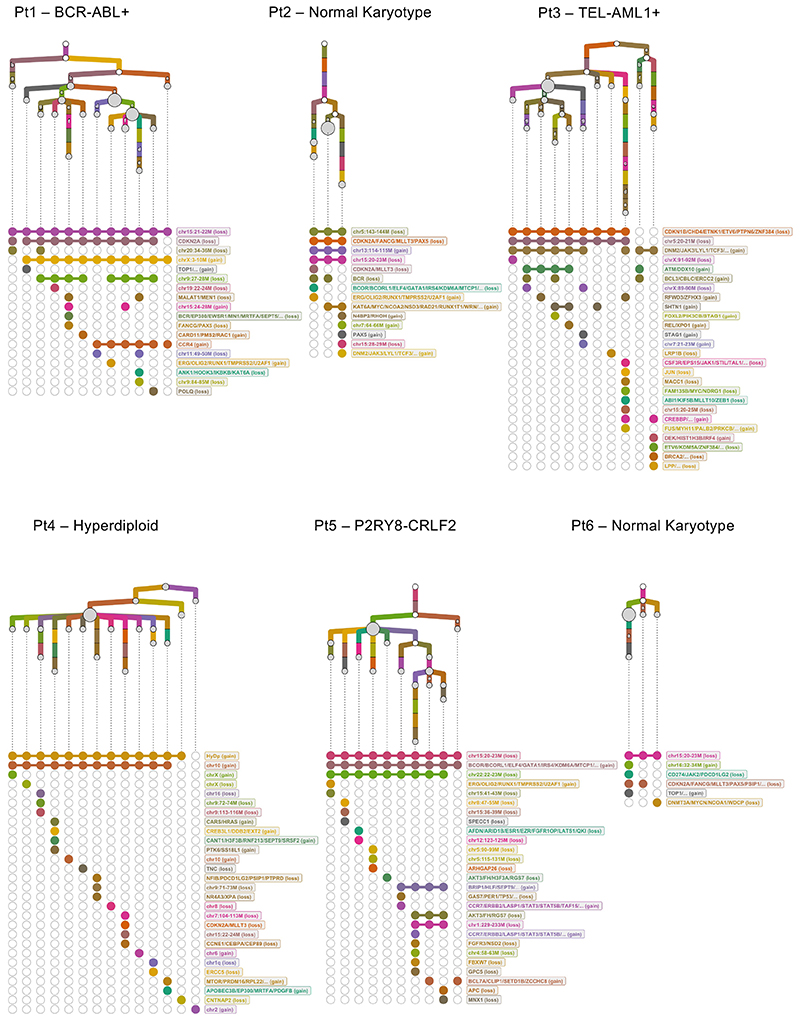
Most cases displayed branching clonal architectures with 4-19 descendant sub-clones (Fig.1). Alongside commonly recurring lesions, we identified a number of rarer or previously unreported subclonal CNAs (i.e. APOBEC3B amplification, MYC amplification, and DNMT3A deletion). In each case, we observed multiple independent lesions targeting the same locus. These were characterized by distinct genetic breakpoints and associated with different sets of CNAs, and so segregated onto separate branches of the leukemias’ phylogenetic trees.
Figure 1. Defining the clonal architecture of BCP-ALL at single-cell resolution.
Phylogenetic trees mapping the evolutionary histories of 6 diagnostic leukemias as inferred by scWGS. Each clone is represented by a grey circle whose diameter reflects the size of the clone within the leukemia. White circles represent inferred ancestors (not detected by the analysis). Branches linking the subclones to one another are coloured-coded by their copy-number events. Events that appear in more than one branch within each tree are marked with the same letter. Below each tree, a dot matrix shows the combination of copy-number events for each leaf clone. Linked dots represent copy number events shared through a common ancestor. Disconnected dots correspond to cases where the same event happens in more than one lineage. Due to a technical failure of the flow sorter, only 9 cells from Pt2 were available for whole-genome sequencing. Normal early B-cell progenitors from 2 umbilical cord-blood units were used as controls to normalize read counts and exclude potential technical artefacts.
This points to parallel evolution as a highly pervasive mechanism of genomic diversification in BCP-ALL, consistent with previous reports that serial and sustained RAG- and AID-mediated deletions contribute to the genetic heterogeneity observed in this leukemia25,26. Furthermore, it suggests genetically distinct sub-clones might exhibit similar fitness during the development of BCP-ALL, implying that some mutations might be evolutionarily neutral.
Genotype and resistant states do not co-segregate in BCP-ALL
We next analysed the relationship between leukemic genotypes and disease-relevant cell states, asking to what extent a given genotype corresponds to a specific phenotype. We focused on CD19+/CD34+/CD38–/low cells, which comprise a rare sub-population present in leukemia but so far undetected in healthy blood or bone marrow. This compartment is enriched in developmentally primitive, quiescent cells that have previously been suggested to hold LIC potential and to be linked to increased chemoresistance in patients 27,28.
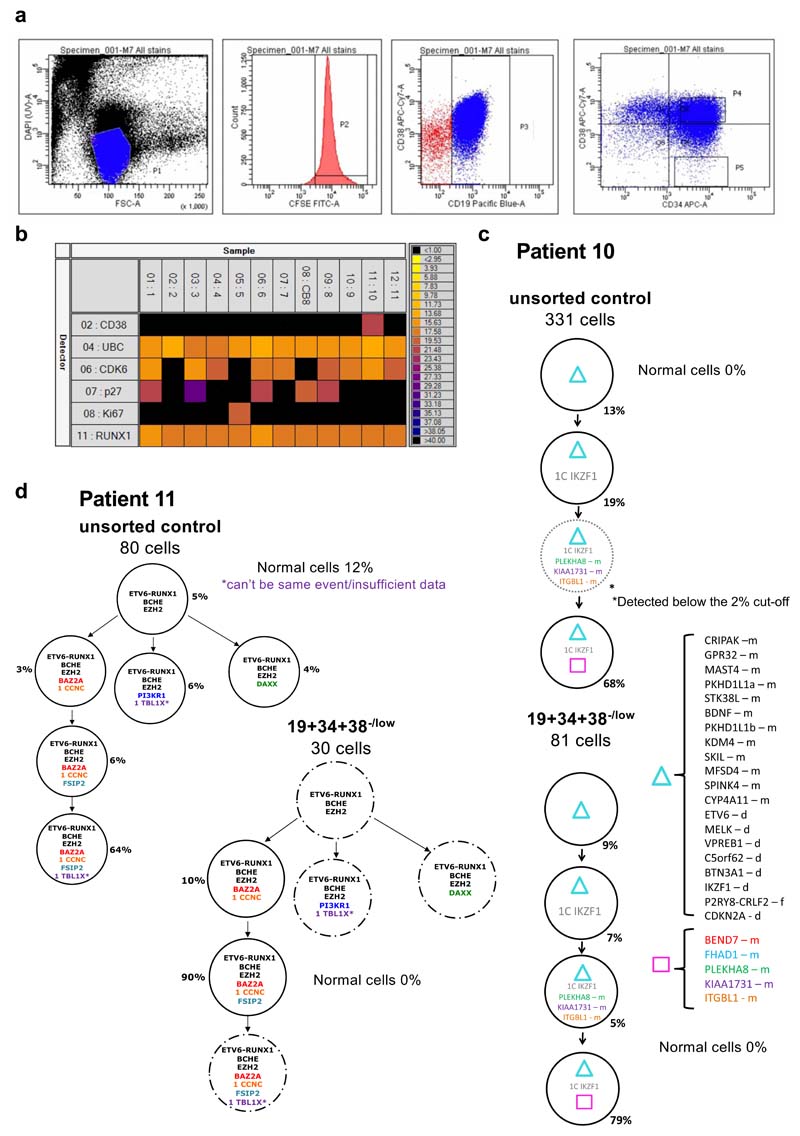
To simultaneously assess genotype and phenotype of individual cells, we used previously published25,29 bulk whole-genome sequencing data of five unsorted diagnostic leukemias with different karyotypic abnormalities to identify patient-specific genetic alterations present at varying allele frequencies, allowing us to group cells into genetically similar sub-clones and infer a phylogenetic, clonal architecture for each patient. We then isolated CD19+/CD34+/CD38–/low and unsorted control cells and used single-cell qPCR to assess in a targeted fashion the presence/absence of each patient-specific genomic alteration (non-synonymous single-nucleotide variants (SNVs) or CNA mutations), as well as expression of the proliferation marker Ki67 and other differentiation markers. This analysis validated that CD19+/CD34+/CD38–/low cells are, as anticipated, predominantly non-cycling (see representative data in Extended Data Fig.2a-b).
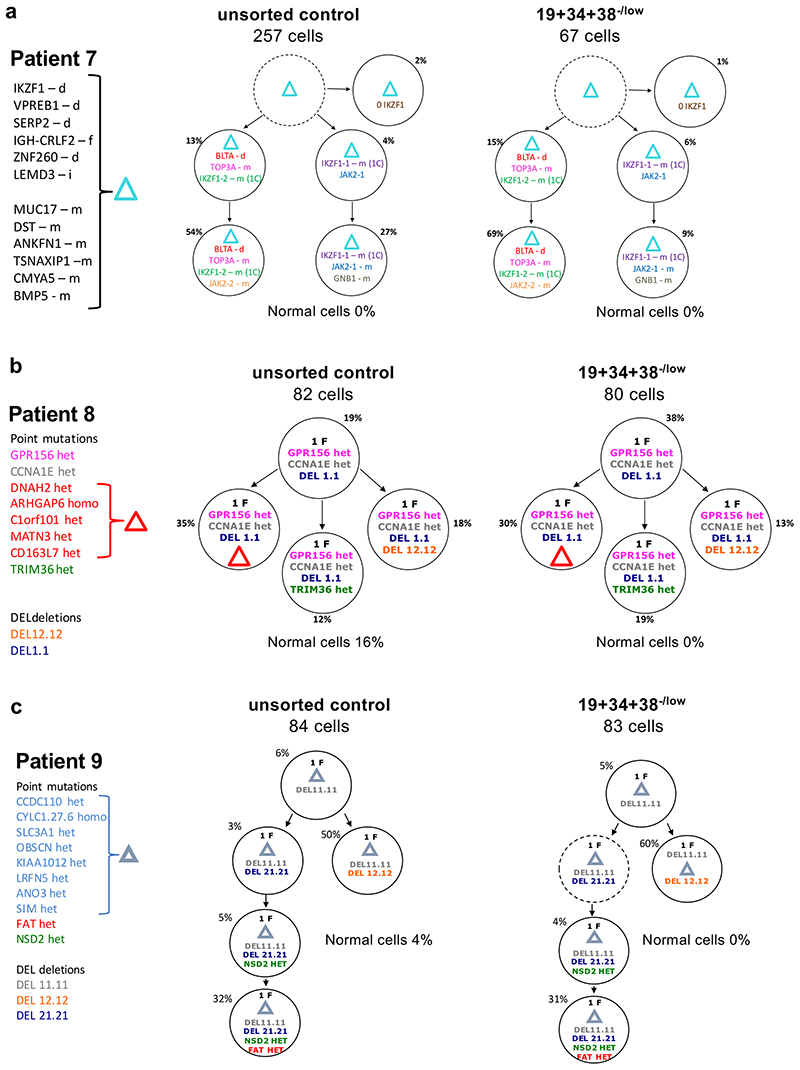
In four of the five cases, all but one of 18 sub-clones were identified in the CD19+/CD34+/CD38–/low cells, in proportions similar to those in the corresponding bulk leukemic cells. In one case (Pt.11), CD19+/CD34+/CD38–/low cells were restricted to a single minor sub-clone, representing ~5% of the total bulk population (Fig.2, Extended Data Fig.2c-d and Supplementary Table 1). We therefore conclude that all genotypes in BCP-ALL equally populate cell states associated with non-proliferative status (here defined as Ki67-) and early B-cell differentiation.
Figure 2. Genotype and cell-states associated with resistance do not co-segregate in BCP-ALL.
(a-c) Subclonal genetic architecture of bulk (unsorted) and non-cycling (CD34+/CD19+/CD38-) diagnostic leukemic cells from 3 childhood BCP-ALL patients as inferred by single-cell multiplex targeted Q-PCR. Informative patient-specific Q-PCR probes detecting either non-synonymous SNV or copy number alterations (CNA) were selected based on whole-genome sequencing data of the same diagnostic samples. 80-300 cells were analyzed per compartment, and a ~2% threshold was implemented to control for false-positive events. In the figure, f=fusion, d=deletion, i=insertion, m=mutation, het=heterozygous, homo=homozygous.
Intratumor genetic heterogeneity is unaffected by treatment
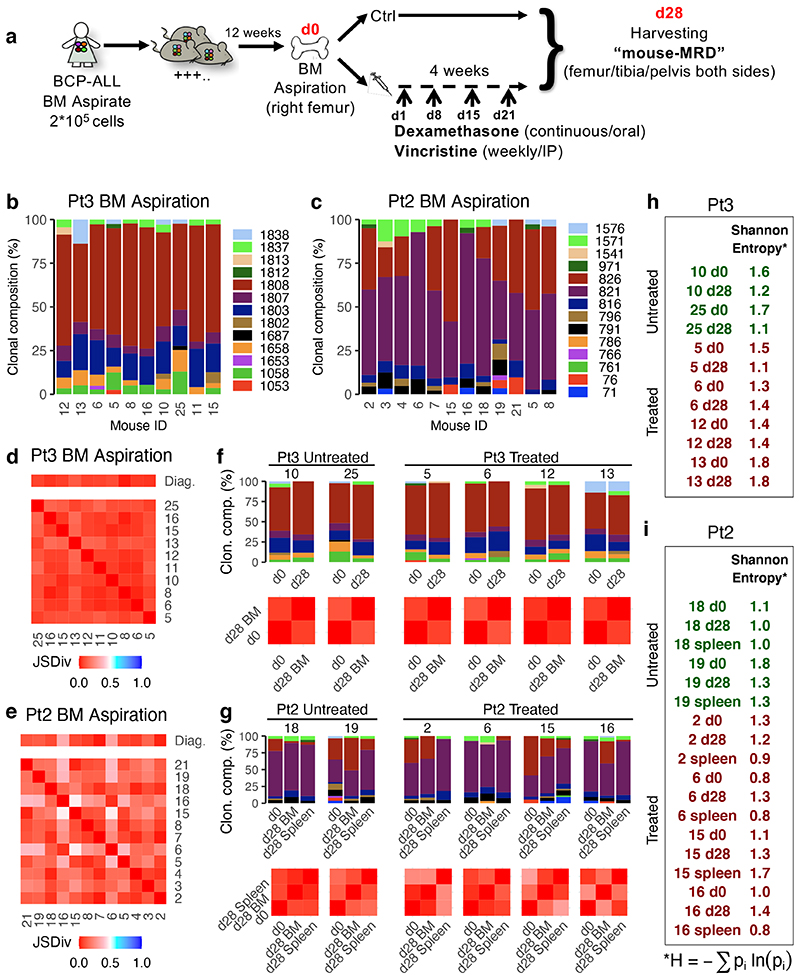
Next, we explored the implications of this lack of segregation between genotypes and phenotypes canonically associated with resistance in BCP-ALL shaped by the selective pressure of induction chemotherapy. We addressed this using patient-derived xenografts (PDXs) (Fig.3a), whereby bone marrow cells from BCP-ALL patients were transplanted into multiple mice and treatment outcomes assessed by tracking clonal dynamics longitudinally in all recipients; therefore directly comparing clonal variegation before (bone marrow, BM, aspiration) and after (total BM) identical chemotherapy treatment (Extended Data Fig.3a),
Figure 3. Treatment in a mouse model of childhood BCP-ALL does not affect the overall extent of intratumor genetic heterogeneity.
(a) Treatment model: NSG mice received an intramedullary injection (right leg) of primary leukemic cells from pediatric ALL patients. 12 weeks after injection (d0), all mice underwent a bone marrow aspiration (right leg). Upon engraftment, mice were randomly assigned to either control or treatment groups. Treated mice received Dexamethasone (6mg/L continuous administration in the drinking water) and Vincristine (0.50mg/Kg IP/weekly) for 4 weeks. Following treatment, the BM (from femur, tibia and pelvis from both sides) of each mouse was harvested. (b-c) Barplots showing the subclonal composition of each engrafted diagnostic Pt3 (b) or Pt2 (c) leukemia. Clonal makeup was determined by mFISH (n=1186 cells across n=10 Pt3 engrafted mice and n=2268 cells across n=12 Pt2 engrafted mice) using probes for TEL (ETV6), AML1 (RUNX1), (TEL-AML1), PAX5 and CDKN2A (p16). Cells were grouped into genetically similar subclones based on their combinatorial copy number status, and each subclone was then assigned a unique identifier number and color code (Extended Data Figure 3c-d). (d and e) Heatmap showing the results of all possible pairwise comparisons of the clonal composition of individual engrafted leukemias using the Jensen-Shannon divergence index (bounded between 0 and 1). (f) Bar plots showing the BM clonal composition of 2 control and 4 treated mice (identified by the tag number shown above the chart) engrafted with Pt3 cells at d0 (BM aspiration) and d28 (total BM harvest). Below the bar plots are the corresponding pairwise Jensen-Shannon divergence analysis results. (g) Same as (e) but for mice engrafted with Pt2 cells. In this case, also the spleen was analyzed at d28. (h and i) Shannon entropy was used to quantify the overall diversity of the matching pre-and post-treatment specimens for each recipient.
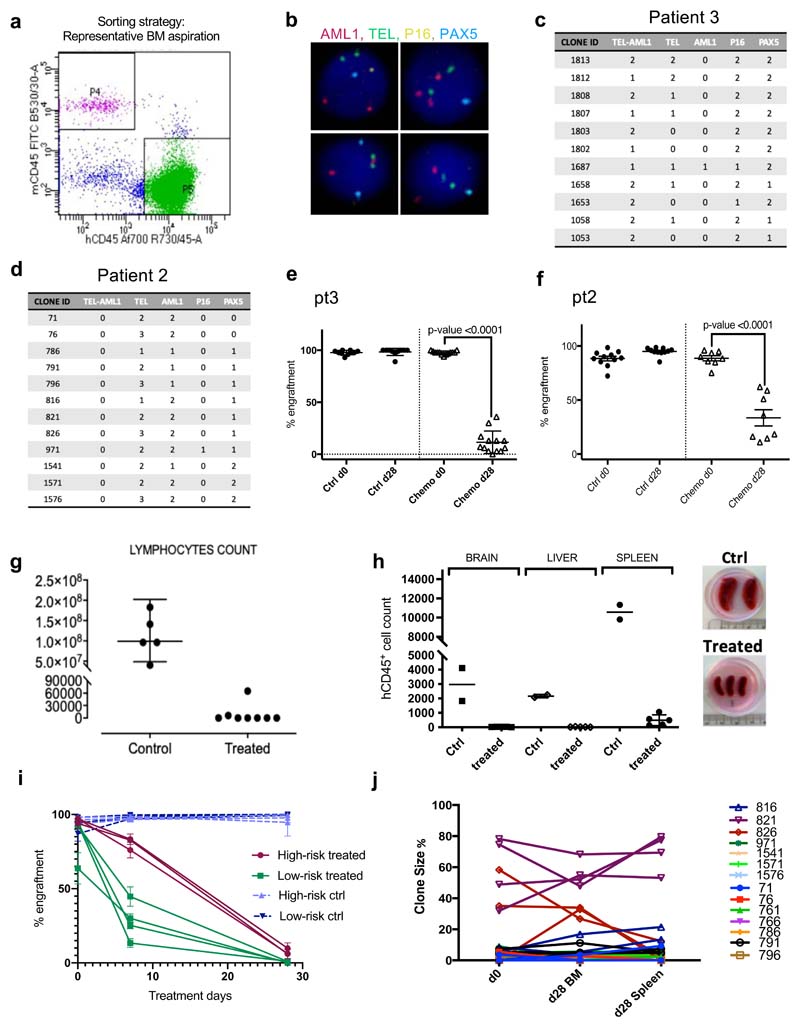
Multicolor fluorescence in situ hybridization (mFISH) was used to score the co-occurrence of CNAs and/or translocation events in >250 cells, and thereby group cells into genetic sub-clones (Fig.3b-c and Extended Data Fig.3b-d). We used probes for AML1 (RUNX1), TEL (ETV6), TEL-AML1 (ETV6-RUNX1), CDKN2A (p16) and PAX5 (BSAP), which are amongst the most frequently altered genes in childhood BCP-ALL. Using the Jensen Shannon index of divergence, which measures the similarity between two probability distributions, we verified that, at day0, the clonal compositions of the leukemias in all mice engrafted with the same primary sample were effectively the same (Fig.3d-e).
Next, we treated half the mice with vincristine and dexamethasone over 28 days, with the remaining mice as controls. These drugs are key components of systemic BCP-ALL induction chemotherapy, which also includes L-asparaginase, and sometimes additional agents targeting DNA replication through distinct mechanisms. Treatment with vincristine and dexamethasone produced cytoreduction in the PDX model comparable, if not superior (>10 logs), to that observed in patients (Extended Data Fig.3e-h). Mice engrafted with cells from high-risk patients showed both slower kinetics of response and a higher percentage of residual cells after treatment than mice transplanted with cells from low-risk patients (Extended Data Fig.3i).
While treatment markedly reduced overall leukemic burden, most genetic sub-clones were still detectable (Fig.3f-g); suggesting they display broadly similar fitness to chemotherapy. Where we observed differences in the size of specific sub-clones, these changes were i) also detected in control mice and ii) inconsistent between recipients and between disease sites (BM and spleen) within an individual mouse; highlighting their stochastic rather than deterministic nature (Fig.3g and Extended Data Fig.3j). We quantified the overall extent of intratumor genetic heterogeneity before and after chemotherapy by estimating the Shannon entropies for the subclonal composition of untreated and treated PDX recipients. This entropy index provides a measurement of a sample’s diversity and richness in species (in this case the different genotypes), that also takes into account how evenly distributed these are. We found that chemotherapy did not significantly change the Shannon entropies in recipients, suggesting it has little impact on the genetic complexity of residual disease (Fig.3h-i).
While mFISH captures the most common recurrent genetic alterations in childhood BCP-ALL and affords high throughput, its resolution is limited by the number of markers that can be tested in a single experiment and might, therefore, underestimate genetic complexity. Higher-resolution approaches should better elucidate the dynamics of minor sub-clones, and so we analysed leukemic cells from a third patient by scWGS.
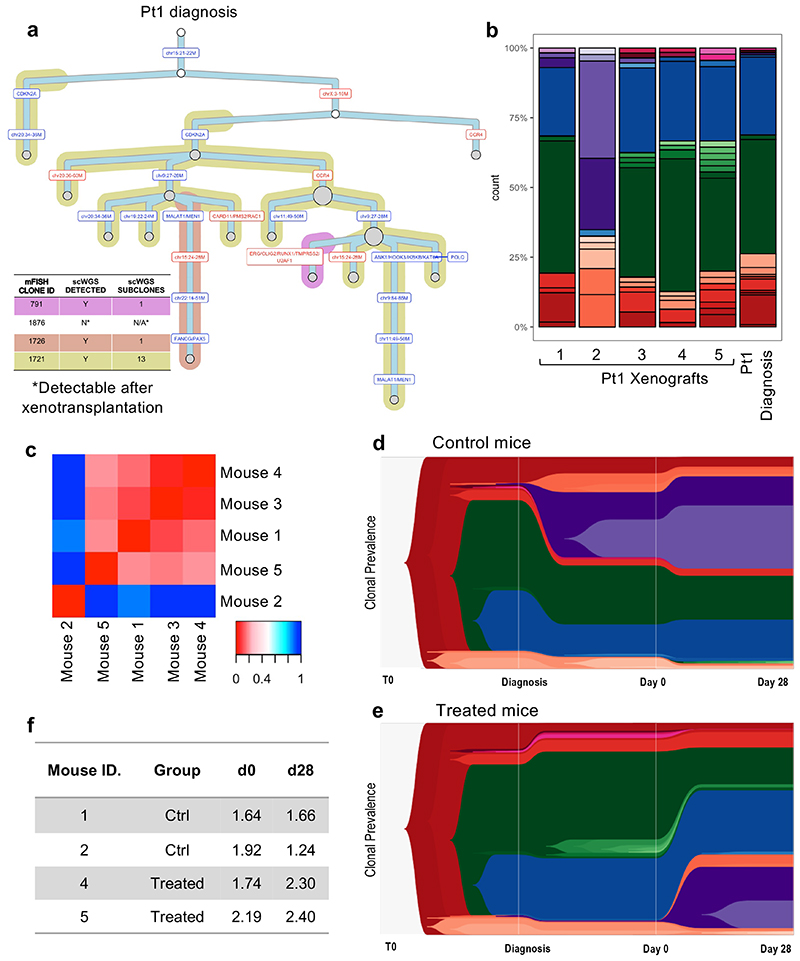
Firstly, we asked how much of the heterogeneity identified by scWGS of untreated cells from patient 1 had been captured by mFISH. We used sequencing data to consolidate individual cells into sub-clones defined solely by the copy number status of the markers assessed by mFISH. To further sub-classify these clones, we then extended the copy number analysis to full genome resolution. We found a high level of agreement between the two approaches. Most cells could be classified into mFISH-defined sub-clones. Only cells belonging to a single subclone, diploid with respect to all loci assessed by mFISH, remained unassigned; suggesting that multicolor FISH provides a good estimate of the overall sub-clonal composition of childhood BCP-ALL. This notwithstanding, whole-genome information allowed us to further divide each clone identified by mFISH into up to 13 smaller sub-clones (Fig.4a).
Figure 4. Single-cell whole-genome sequencing confirms limited selection of genetic subclones in response to chemotherapy.
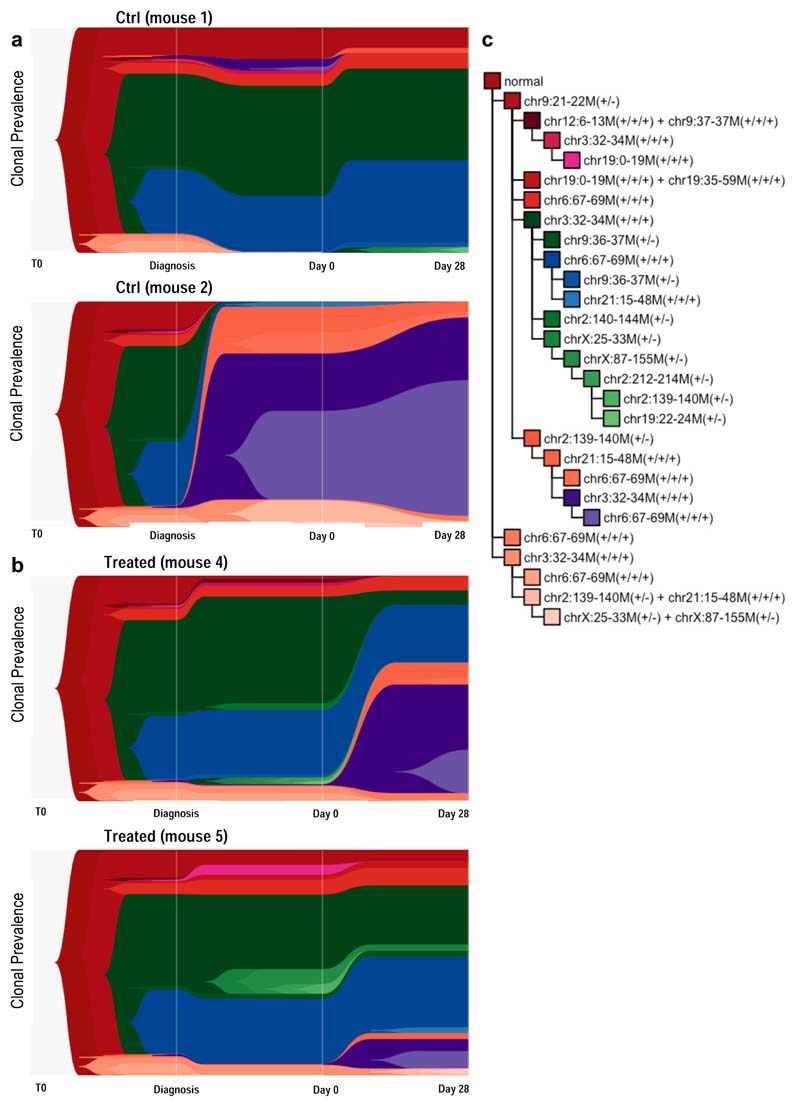
(a) Phylogenetic tree of Pt1 diagnostic leukemia as inferred by scWGS. Background shading is used to highlight clones previously defined by mFISH. (b) Subclonal genetic composition of 5 mice engrafted with Pt1 leukemia at d0 (before treatment) and Pt1 diagnostic disease (c) Heatmap showing all Jensen-Shannon divergence index-based comparisons of clonal compositions between pairs of engrafted mice at d0. (d-e). TimeScape plots visualizing tumor evolution over time in 2 control (grouped) and 2 treated (grouped) mice. The plots show the clonal composition at 3 timepoints: i) the primary diagnostic leukemia ii) at d0 in the xenografts (BM aspirate), and ii) at d28 in the xenografts (total BM harvest). Clonal identities as detailed in Figure S4C. (f) Table summarizing the Shannon entropy values of each control and treated engrafted leukemia at d0 and d28.
Next, we investigated at whole-genome resolution the clonal dynamics of leukemic cells in PDX recipients undergoing treatment. The Jensen Shannon index of divergence confirmed that leukemic cells in the majority of recipients (4 out 5) sampled by BM aspiration prior to treatment shared the same distribution of sub-clones as the primary material from which they were derived. Enrichment for a subset of minor diagnostic subclones in one of the recipients suggested a possible sampling error at the time of injection (Fig.4b-c).
We treated two of the mice, using two as controls. The fifth mouse was culled early due to unrelated complications. High-resolution scWGS analysis of the immediate post-treatment residuum confirmed that treatment-resistant cells in childhood BCP-ALL are as genetically heterogeneous as untreated cells. Of all the clones observed before chemotherapy, only one minor clone (frequency <3% at d0) became undetectable in both treated mice (Fig.4d-e and Extended Data Fig.4). This notwithstanding, a slight increase in Shannon entropy’s index values suggested a more uniform distribution of subclones post-treatment (Fig.4F). This resulted from partial expansion of a few minor subclones present at very low frequency prior to chemotherapy. While our data do not categorically exclude the possibility that particular genotypes might confer some degree of enhanced resistance to chemotherapy, they strongly suggest very limited selection of genetic subclones and reinforce our prior conclusion that the overall genetic complexity of childhood BCP-ALL remains intact in the post-chemotherapy residuum.
Transcriptionally driven phenotypes determine resistance
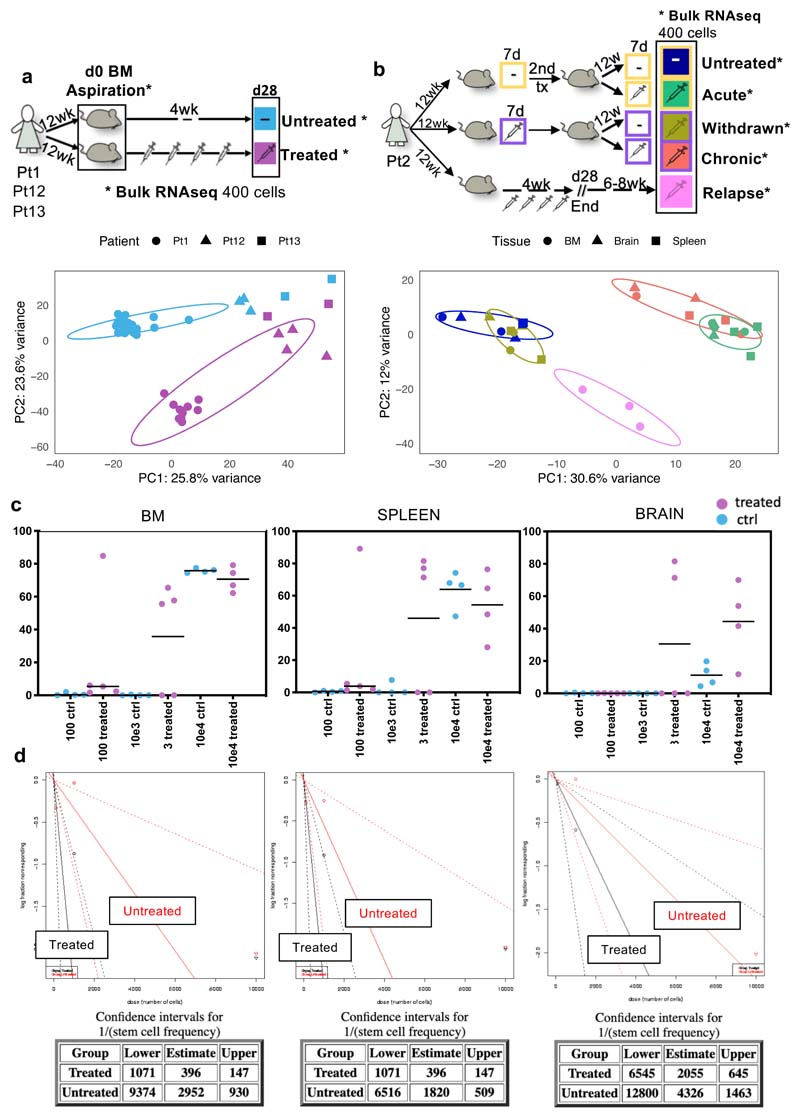
The absence of bottleneck genetic selection after chemotherapy for BCP-ALL suggests resistance operates through alternative mechanisms, and we envisaged two distinct scenarios; Either (i) survival is purely stochastic and some cells escape treatment by chance, or (ii) convergent evolution underpins selection of specific cell state(s) with reduced chemotherapy-sensitivity. These state(s) may pre-exist before treatment or be induced by it. To distinguish between these hypotheses, we tested whether leukemic cells that survive treatment are transcriptionally distinct from their treatment-naïve counterparts, through small cell number bulk RNAseq on treatment-naïve and -resistant cells from multiple mice engrafted with cells from three patients with different cytogenetics (Fig.5a). Principal component analysis (PCA) demonstrated significant transcriptional differences in leukemic cells retrieved from treated and untreated mice (Extended Data Fig.5a).
Figure 5. Transcriptionally driven phenotypes contribute to treatment resistance in BCP-ALL and DNA methylation analysis identifies epigenetically deregulated hotspots in BCP-ALL resistant cells.
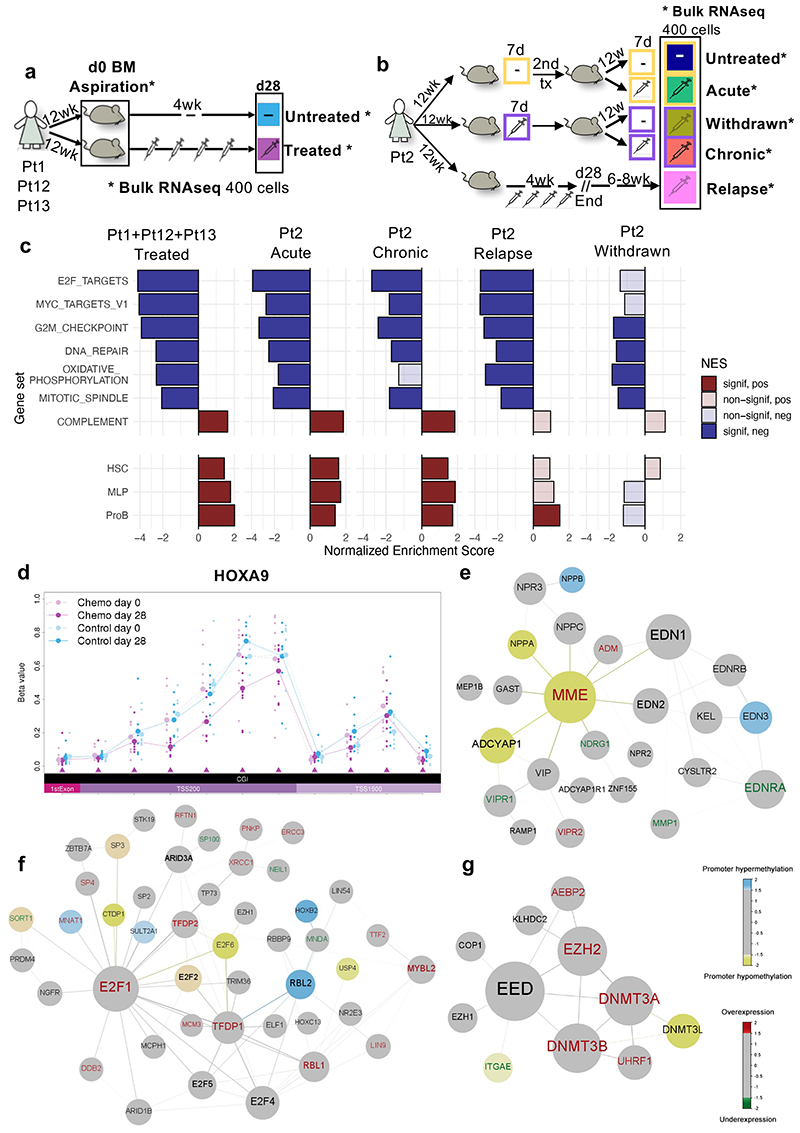
(a-b) Graphical representation of the standard and multi-arm treatment models. In the standard model (a) matching d0 and d28 cells harvested from 9 untreated and 9 treated mice were analyzed. Untreated samples, shown in light blue, represent d0 cells from untreated mice and treated mice, as well as d28 samples from untreated mice. In the multi-arm model (b), two consecutive rounds of transplantation and treatment (7 days) allowed the analysis of ‘acutely treated’ (green), ‘treatment withdrawn’ (dark yellow), ‘chronically treated’ (red), and ‘untreated control’ (dark blue) cells harvested from 3 mice each (see main text). ‘Relapse-like’ cells were also obtained through a separate arm of the experiment, whereby 2 mice were treated for 28 days and then allowed to relapse in situ in the absence of further treatment (6-8 weeks). (c) Hallmark gene-sets and published signatures associated with predefined differentiation stages of the B-cell ontogeny32,47, which represent the core processes deregulated during chemotherapy across different patient subtypes and treatment regimens (see Supplementary Table 4 for the full list). Each population is compared to the corresponding untreated control. P-values are obtained using 2-sided permutation test48 with 10,000 permutations; significance thresholds: <0.05 after Benjamini-Hochberg multiple test correction. (d) Representative example of a region (HOXA9 locus) differentiallymethylated in d28 treated mice as compared to both d0 treated-mice and untreated-mice at d0/d28. All annotated CpG regions for the loci are listed at the bottom of the plot in chromosomal order. Each line shows the mean beta value of the corresponding sample. TSS200 = 0–200 bases upstream of the transcriptional start site (TSS). TSS1500 = 200–1500 bases upstream of the TSS. (e-f-g) Representative results of 3 out of 5 gene modules identified using the Functional Epigenetic Modules (FEM) algorithm31 comparing treated versus untreated d28 cells using the default FEM protein-protein interaction network. In each representation, the largest circle represents the ‘seeds’ (or master regulator) of the corresponding functional epigenetic module. In the figure, blue nodes represent significantly hypermethylated gene promoters, yellow nodes represent significantly hypomethylated gene promoters, red labels represent significantly overexpressed genes and green labels represent significantly underexpressed genes.
We reasoned that this transcriptional signature was likely a composite of the unique intrinsic transcriptional program(s) of cells with reduced sensitivity to chemotherapy - which had the potential to be retained throughout treatment and subsequent relapse - and a ‘generic’ stress-related, and more transient, transcriptional response to cytotoxic therapy. To discriminate these distinct elements, we compared the transcriptomes of xenografted leukemic cells under five different experimental conditions involving two rounds of transplantation and treatment, namely; (i) ‘chronically treated cells’: both primary and secondary recipients were treated for seven days; (ii) ‘acutely treated cells’: primary recipients untreated, secondary recipients treated; (iii) ‘treatment withdrawn cells’: primary recipients treated, secondary recipients untreated, (designed to address the reversibility of transcriptional phenotypes associated with a short exposure to chemotherapy); (iv) ‘untreated controls’: cells were not exposed to chemotherapy in primary or secondary recipients; (v) ‘relapse cells’: recipients were treated for four weeks and then allowed to relapse “in situ” in the absence of further transplantation (Fig.5b).
PCA clustered samples according to their exposure to chemotherapy; with PC1 discriminating ‘untreated’ and ‘treatment withdrawn cells’ from ‘acutely’ and ‘chronically treated’ cells (Figure S5b). Compared to untreated cells, acutely treated cells showed the highest number of differentially expressed genes. As hypothesized, pathways involved in response to cellular stress (e.g., inflammatory response and complement activation) were expressed at significantly higher level in acute than in chronically treated cells (Supplementary Table 2 acute vs chronic comparison). We hence refined our definition of the core gene expression program of residual disease, by focusing on pathways that were altered across all four treatments and appeared to be similarly deregulated in both acutely and chronically treated cells. In line with previous reports by our group and others 28,30, this analysis identified a striking downregulation of pathways involved in cell cycle regulation, cell activation and cell metabolism. Our data also suggest that following treatment, signatures associated with earlier stages of the differentiation hierarchy are up-regulated in residual leukemic cells (Fig.5c). To test whether these phenotypic changes had any functional impact on the biology of resistant cells, we used a limiting dilution approach to quantify leukemia-initiating cells (LIC) in treated and untreated PDX recipients and found that cells from treated recipients had increased tumorigenicity (Extended Data Fig 5c-d).
While the global transcriptome of cells treated for seven days and then re-transplanted (i.e., ‘withdrawn’) reverted towards that of treatment-naïve cells, the reversion was incomplete. Additionally, “relapsed” leukemic cells from a separate branch of the experiment that more closely mimicked the clinical situation, retained many transcriptional characteristics of resistant cells; even if harvested 6-8 weeks after the end of treatment at a time when the leukemia was fully re-established. These cells showed persistent downregulation of G2M checkpoint, E2F and MYC1 gene targets signatures, and up-regulation of the proB-cell differentiation signature compared to treatment-naïve cells (Fig.5c).
Together, our data further define the nature of the polyclonal leukemic cells that escape chemotherapy in childhood BCP-ALL; they have features associated with both primitive differentiation status and quiescence and exhibit increased LIC potential. Furthermore, some of the key transcriptional features of the chemotherapy-resistant post-treatment residuum persist through in vivo relapse.
We next asked to what extent the gene expression programs associated with resistance are encoded through epigenetic modifications. We performed bulk DNA methylation analysis on the same matching pre- and post-treatment samples that were used for RNA sequencing. We defined a core set of resistance-associated methylation differences, identified as regions of the genome that were consistently differentially methylated in pre- (d0) and post-treatment (d28) samples while remaining unchanged in control mice. Of 669 significantly differentially methylated regions (DMRs), the vast majority mapped in promoter regions (430 in total). Reassuringly, several DMRs spanned genes previously described as drivers of cancer, BCP-ALL progression and drug resistance (e.g., HOXA9, MAPR3, ADAM12, ELAVL4, PD4DE) (representative Fig.5d and Supplementary Table 3).
We then performed an integrative analysis of our RNAseq and methylome data using the functional epigenetic modules (FEM) algorithm31, which identifies gene modules of coordinated differential methylation and expression in the context of a human interactome. Several coordinated modules in resistant cells encoded known regulators of early B-cell differentiation, cell-cycle, and methylation itself (i.e., MME/CD10, E2F1 and EZH2), suggesting that resistance phenotypes, at least in part, extend to the epigenome level (Fig.5e-g).
Epigenetic variability provides a substrate for selection
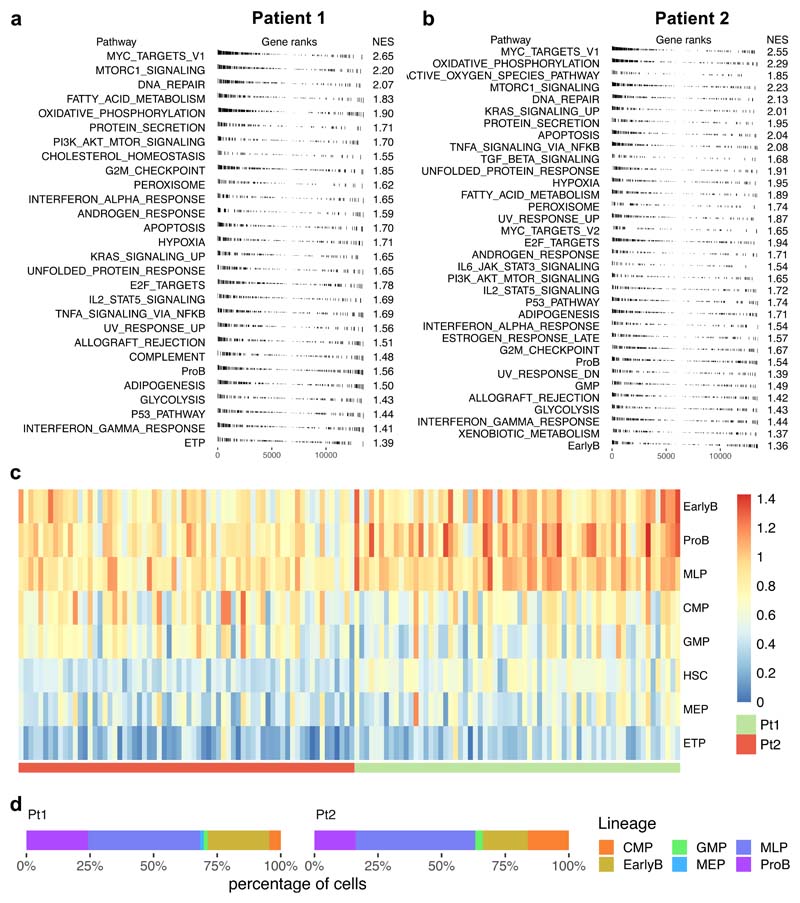
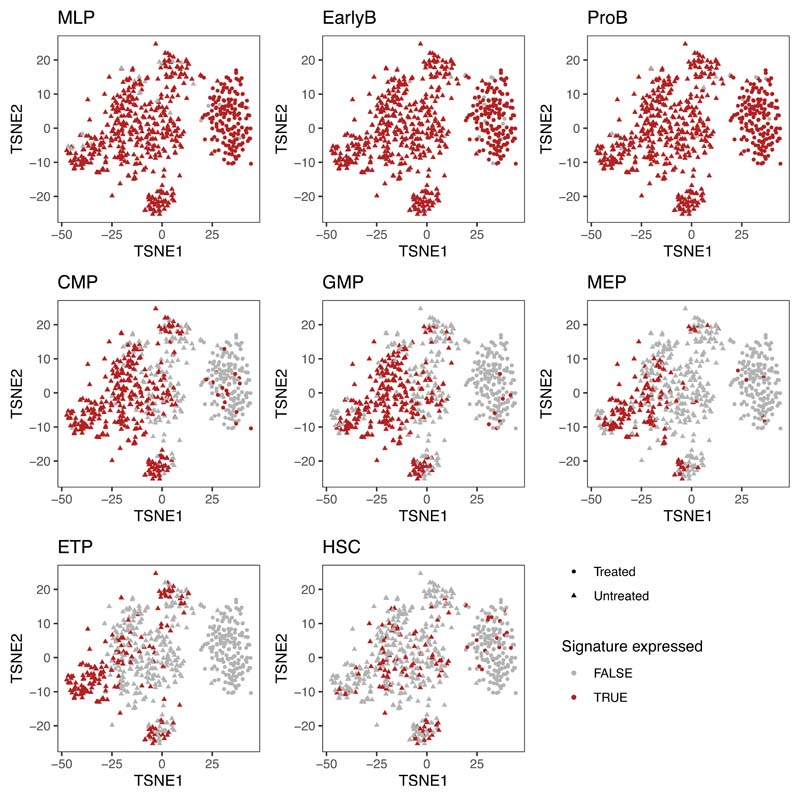
We next used single-cell RNA sequencing to explore the transcriptional heterogeneity of BCP-ALL and its contribution to treatment resistance. We examined two diagnostic leukemias (Pt1 and Pt2) and cells from Pt1 PDXs, whose genotypes had previously been characterised at single-cell WGS resolution. We found considerable transcriptional heterogeneity in untreated primary leukemias, with expression of genes involved in proliferation, metabolism (oxidative phosphorylation), apoptosis (p53 pathway), and differentiation status being the most variable between cells (Extended Data Fig.6a-b). Most pre-treatment diagnostic and xenografted leukemic cells showed promiscuous expression of signatures characteristic of distinct hematopoietic lineages and differentiation stages (Extended Data Fig.6c and Extended Data Fig.7), and when assigned to their most closely related normal counterpart32, we found that BCP-ALL cells can map transcriptionally to any point of the hierarchy (Extended Data Fig 6d and Fig.7d).
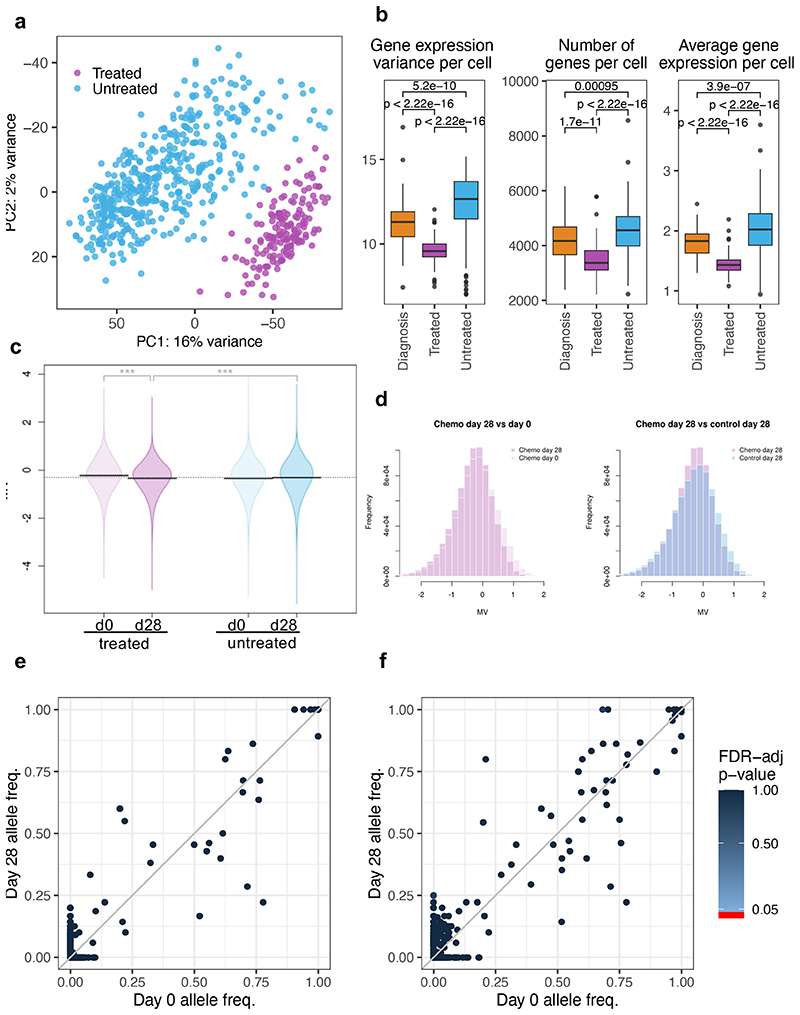
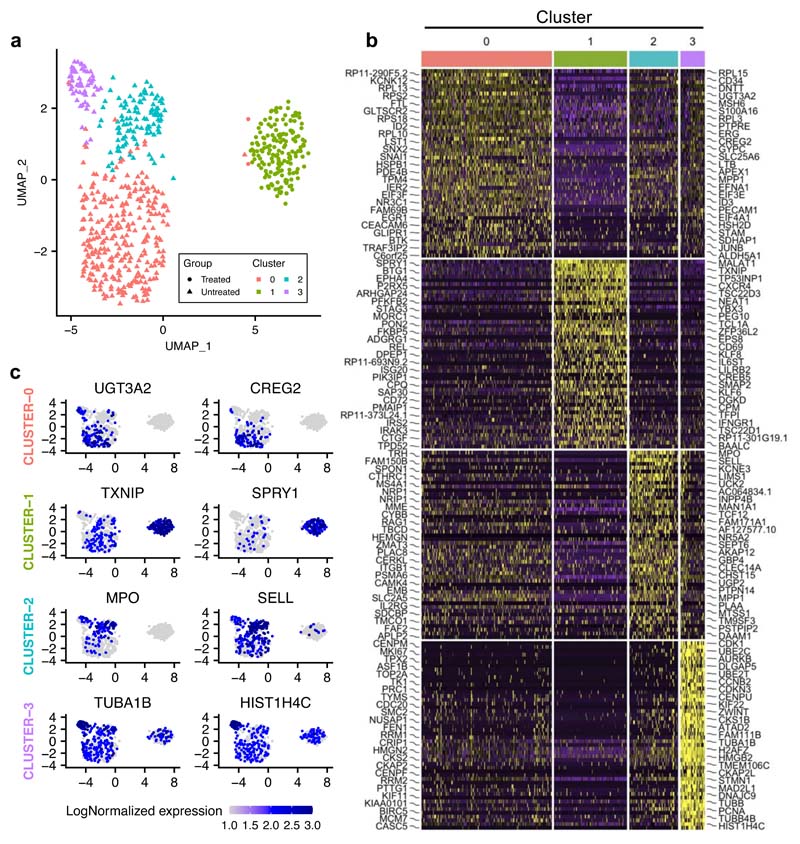
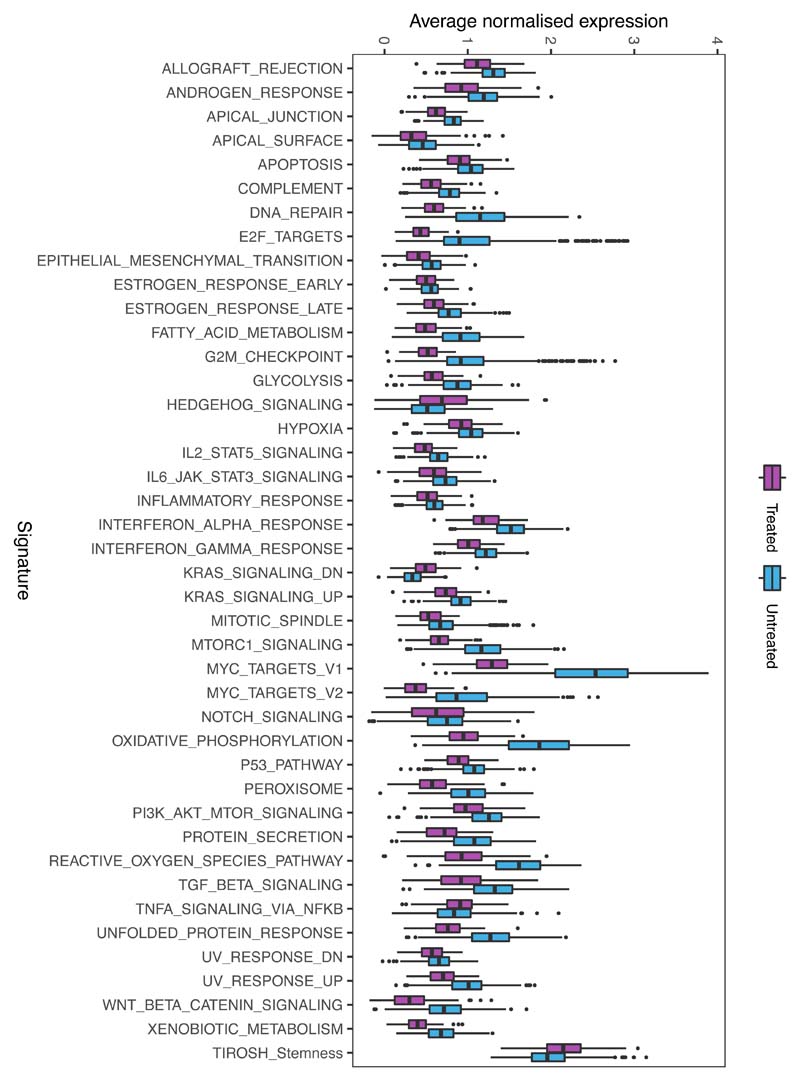
PCA showed that, in contrast to untreated cells, treated cells occupied a well-defined, limited projection space, suggesting greater transcriptional homogeneity (Fig.6a), as further confirmed by statistical analysis. Furthermore, treated cells expressed significantly fewer genes per cell, and at a lower level, than their untreated counterparts, suggesting global transcriptional repression, in line with the bulk RNA-seq results (Fig.6b). We validated the greater heterogeneity of untreated cells using Uniform Manifold Approximation and Projection (UMAP), which classified untreated cells into three distinct clusters while assigning treated cells to a single subpopulation (Extended Data Fig.8a) and used the R toolkit (Seurat) to identify markers defining each cluster (Extended Data Fig.8b-c). Of note, even though most signalling cascades were downregulated, resistant cells retained - and even upregulated - signatures corresponding to Hedgehog signalling, Tirosh stemness and TNFA via the NFKB pathway (Extended Data Fig.9), previously implicated in the maintenance of cancer stem cells33–35.
Figure 6. Transcriptional and epigenetic variability provide a substrate for genotype-independent selection over treatment.
Single-cell RNA sequencing of d0 (BM aspiration) and d28 (total BM harvest), primary cells from 3 untreated and 4 treated Pt1 xenografts. Untreated cells (light blue) comprise d0 and d28 cells from control mice and d0 cells (engrafted before to treatment) from treated mice. Treated cells (purple) are d28 cells from mice that received chemotherapy. (a) Principal component analysis of the single-cell data displaying variations in the transcriptomes of individual untreated and treated cells. (b) Boxplots showing gene expression variance per cell (left), number of genes expressed per cell (middle), and average gene expression per cell (right) in diagnostic (n=448 cells), treated (n=163 cells) and untreated cells (n=66 cells). Data is normalized for sequencing coverage. Each boxplot shows the median, the 25th and the 75th percentiles; whiskers cover all data points within a 1.5x the inter-quantile range from the bounds of the box; remaining data points are plotted as outliers. Distributions are compared using a 2-sided Wilcoxon test (unadjusted p-values). (c) Violin plots showing mean methylation variance (MV) scores across n=763949 array probes for n=6 control and n=9 treated mice at d0 and d28. Statistical significance (2-sided T-test) is shown above each MV comparison. P-value statistical significance corresponds to: ***<1e-3 (d) Histogram representation of the MV scores for control and treated mice. (e) SNV analysis comparing the frequency of COSMIC mutations across cells in paired day 0 and d28 post-treatment samples. Only mutations supported by at least 10 reads in at least 10% of the cells were included in the analysis (total 813 COSMIC-annotated SNVs). No SNV was found to be significantly enriched (2-sided Fisher exact test, p-value < 0.05, FDR multiple-test correction). (f) Same as (e) but clustering mutations by gene (538 mutated genes in total).
In line with these findings, our methylome analysis also showed that “RNA polymerase II transcription factor activity” was the most significantly deregulated gene set following treatment (identified by pathway enrichment analysis; p-value 1.85e-02), and methylation variability was also significantly reduced compared to untreated cells. This was true even when taking into account the reduced sensitivity inherent to any bulk assay (Fig.6c-d).
By calling single nucleotide variants (SNVs) directly in the scRNA-seq data and comparing their frequency in the paired pre- and post-treatment samples, we validated our earlier CNA-based finding that chemotherapy did not primarily select for genotypes and demonstrated that those very same transcriptionally homogenous cells that survive the transcriptional bottleneck are as mutationally heterogenous as the untreated disease (Fig.6e). This lack of selection was true even when the identified variants (1155 in total, previously reported in the COSMIC dataset) were clustered by affected gene, demonstrating that no specific mutated gene is preferentially enriched either before (d0) or after (d28) treatment (Fig.6f).
Only a subset of G0 cells are chemoresistant
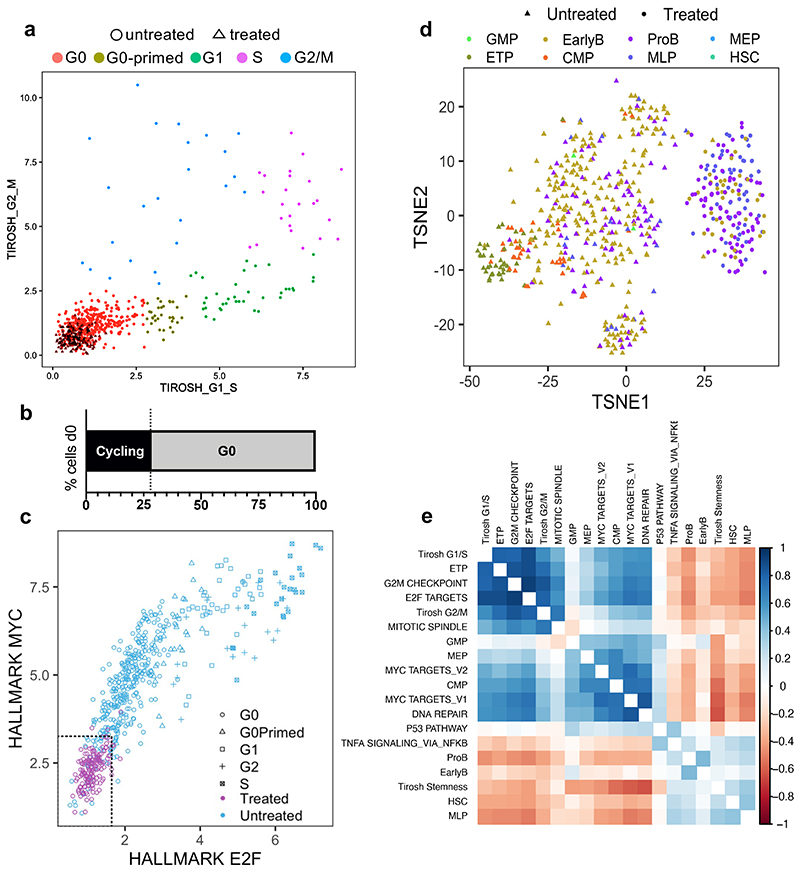
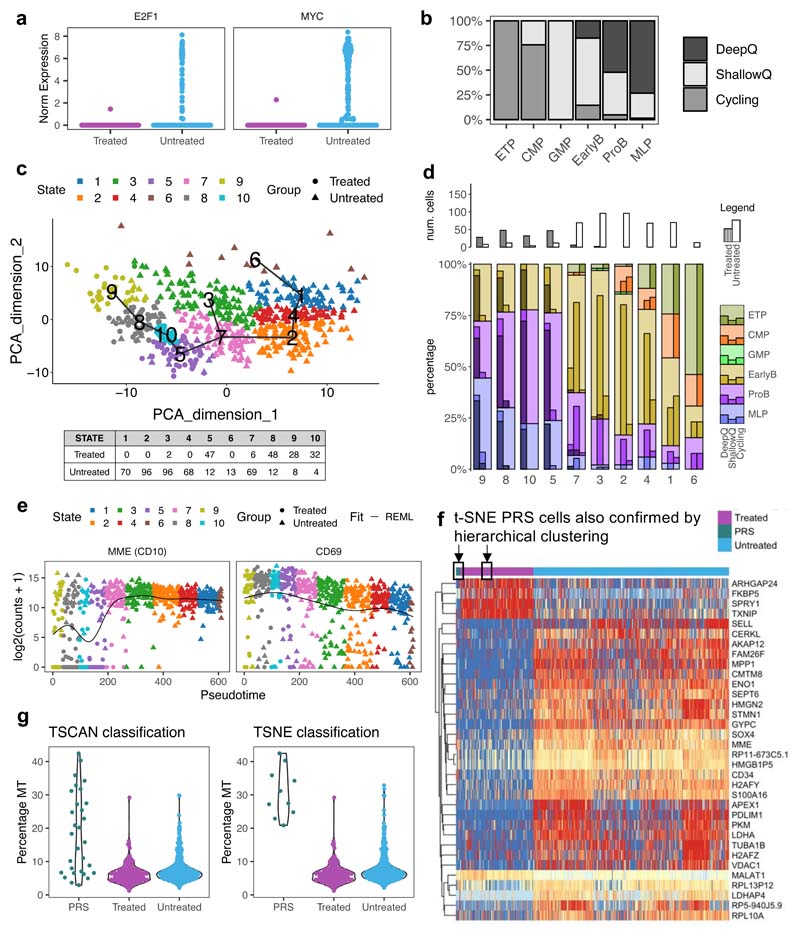
G0 non-proliferative cell-state and resistance to cytotoxic drugs have previously been linked in cancer in general, and specifically in the context of BCP-ALL28,30,36. We therefore explored at single-cell resolution the contribution of cell-cycle and differentiation state to the intercellular heterogeneity of leukemic cells and chemo-resistance. To address whether all quiescent leukemic cells displayed equally reduced sensitivity to treatment, we analyzed the relative expression of gene sets associated with G1/S and G2/M cell cycle phases in untreated and treated cells to assign each to its corresponding cell cycle stage. As expected, while untreated cells could be at any stage of the cell cycle, treated cells were restricted to G0 (Fig.7a). Surprisingly, however, G0 cells also accounted for approximately 70% of the leukemic cells harvested from xenograft recipients before treatment (Fig.7b). Since our treatment model achieved very large levels of cytoreduction (>10 logs), this suggests that quiescent cells resistant to cytotoxic drugs likely represent a specific and rare subset of a wider quiescent compartment - operationally defined by molecular profiling - that is, for the most part, sensitive to treatment.
Figure 7. Resistant BCP-ALL cells represent a small subset of G0 cells with MLP-like transcriptional features.
(a) Scatter plot showing the classification of n=611 cells to non-cycling/G0 and different stages of the cell cycle based on the relative expression of gene-sets associated with the G1/S (x-axis) and G2/M (y-axis) phases. Gene sets obtained from ref34. and available in Supplementary Table 4. (b) Bar plot showing the percentages of Cycling and G0 cells within untreated leukaemia at d0 (n=351 cells). Treated cells were found exclusively in the G0 compartment. (c) Scatter plot showing the classification of non-cycling/G0 n=611 cells as deep quiescent and shallow quiescent based on the relative expression of gene-sets associated with E2F signaling (x-axis) and MYC signaling (y-axis). The 95th percentile of the expression of each signature in treated cells was used as a reference to establish the approximate cut-off values for deep quiescence. (d) Nonlinear dimension reduction and visualization t-SNE analysis. Each cell is assigned to its closest normal hematopoietic cell lineage based on the expression of known marker genes (signature with the highest Z-score average)32. (e) Correlation matrix looking at the relationship between different gene signatures associated with cell cycle and lineage. Correlated expression patterns are displayed in blue and anticorrelated in red.
Consistent with this, in cell cycle scatter plots, untreated and treated G0 cells only partially overlap (Fig.7a), indicating that more than one quiescence state might exist in childhood BCP-ALL. We explored this further by looking at MYC and E2F1 which are amongst the genes most differentially expressed between treated and untreated cells (Extended Data Fig.10a), and have previously been implicated in the regulation of quiescence depth and the propensity to proliferate in normal fibroblasts37,38. Analysis of co-expression showed that progressively shallower quiescence in leukemic cells is defined by the concomitant upregulation of Myc and (Rb)-E2F signalling. Once a Rb-E2F-dependent restriction point (or expression plateau) is reached, cells begin proliferating; suggesting that as in normal cells, a MYC-dependent E2F switching threshold regulates the propensity to enter cell cycle in childhood BCP-ALL (Fig.7c).
Treatment enriched for cells expressing the multi-lymphoid progenitor (MLP) signature (Fig.7d) - which identifies the earliest precursors that have both lymphoid (B, T and NK) and myelomonocytic potential - while high expression of other signatures (CMP, GMP, ETP) was never observed in any deeply quiescent untreated or treatment-resistant cells (Fig.7d, Extended Data Fig.10b). Accordingly, expression of markers associated with the ETP lineage, as well as to a lesser extent CMP, MEP and GMP lineages, positively correlate with the signatures of cycling cells (i.e., MYC, E2F, G2M) (Fig.7e).
Thus G0 cells in childhood BCP-ALL appear to vary in quiescence depth, and, while the untreated disease comprises predominantly “shallow” quiescent cells interspersed with rare “deeply” quiescent cells, the chemoresistant population is highly populated by the latter; which are also developmentally distinct. Crucially, the existence of rare phenotypic sub-states within the G0 compartment with different sensitivities to treatment resonates well with the observation that, in the clinical setting, only a miniscule percentage of leukemic cells survives chemotherapy - typically there are less than 10-4-10-5 residual leukemic cells in the BM of MRD positive patients.
Treatment selects a rare pre-existing cell state
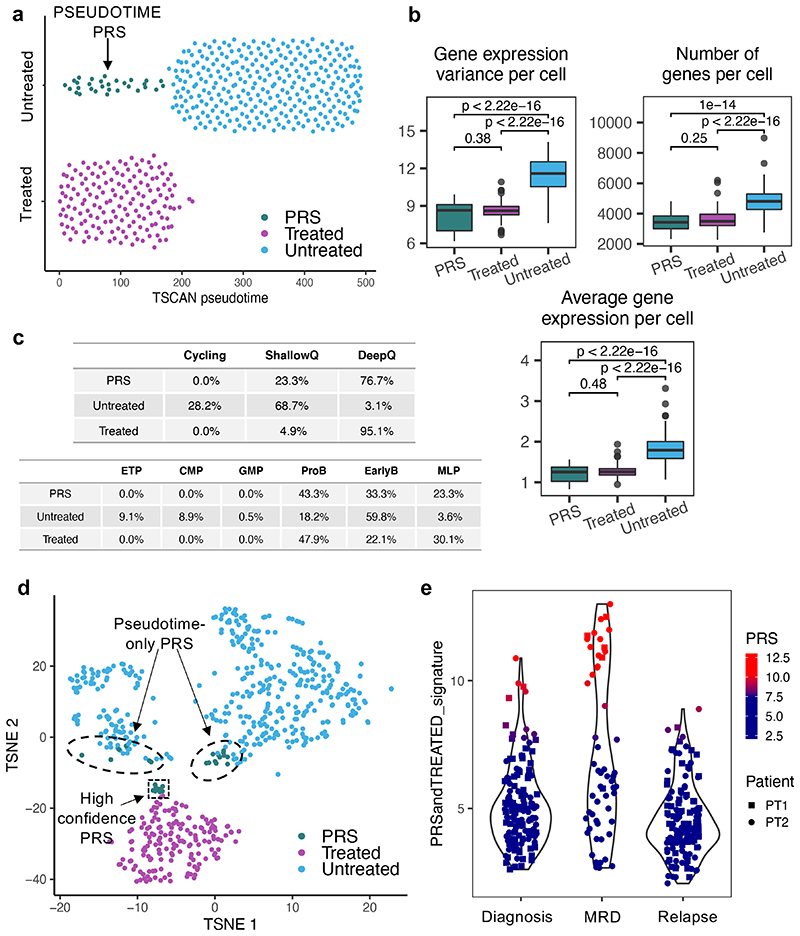
We next asked whether leukemic cells with the transcriptional phenotype associated with chemo-resistance were present before treatment. We used the TSCAN algorithm39 to cluster cells with similar gene expression profiles, irrespective of treatment status, and ordered these clusters along an inferred pseudotime trajectory based on the average expression values of all genes. Most untreated and treated cells were positioned at opposite ends of the resulting minimum spanning tree, with the more heterogeneous untreated cells being distributed over a more significant number of clusters than treated cells (Extended Data Fig.10c). Expression of genes involved in cell cycle status and differentiation varied as a function of cells’ position along the inferred pseudo-time axis (Extended Data Fig.10d-e). Strikingly, a sub-population of cells in the untreated leukemia had transcriptomes more closely related to those of the chemo-resistant cells that persisted after treatment than to the rest of the untreated sample (Fig.8a), suggesting that some cells were in a pre-existing resistant state (PRS) that closely resembles the chemo-resistant cells.
Figure 8. Treatment selects a rare pre-existing cell state.
(a) (a) Ordering of n=492 cells along the main path of the TSCAN39 inferred pseudotime (see Fig S8C). The plot shows n=30 pre-existing resistant cells (PRS) that, although untreated, cluster together with treated cells with respect to pseudotime. (b) Boxplots showing the variance of gene expression per cell (left), number of genes expressed per cell (middle) and average gene expression per cell (right) in PRS (n=30 cells), treated (n=163 cells) and untreated cells (n=418 cells). Data is normalized for sequencing coverage. Each boxplot shows the median, the 25th and the 75th percentiles; whiskers cover all data points within a 1.5x the inter-quantile range from the bounds of the box; remaining data points are plotted as outliers. Distributions are compared using a 2-sided Wilcoxon test (unadjusted p-values). (c) Tables showing the percentage of untreated (n=418 cells), PRS (n=30 cells) and treated cells (n=163 cells) assigned to different cell cycle states (top) and differentiation stage (bottom). (d) T-SNE clustering of all n=611 cells.. PRS cells as defined by both this approach and pseudotime analysis are highlighted by a black box and arrow. (e) Identification of PRS-like treatment resistant cells in matching diagnosis, MRD and relapse specimens from two patients that underwent standard BCP-ALL treatment. The xenograft data was used to generate a ‘resistance’ signature comprising the union of the top 50 genes differentially expressed between both treated vs untreated (non-cycling only) and PRS vs untreated (non-cycling only) cells, after removing any gene differentially expressed between treated and PRS cells. The signature expression was then tested on the un-transplanted specimens.
When compared to the rest of the untreated cells, these PRS cells represented a more homogenous population enriched for markers characteristic of chemo-resistant treated cells, including deep transcriptional quiescence and the expression of lineage markers associated with primitive developmental state (Fig.8b-c). Unsupervised heatmap clustering of cells based on the most variable genes and t-SNE-clustering also independently confirmed the presence of PRS cells within the untreated disease (Fig.8d and Extended Data Fig.10f). Of note, the t-SNE analysis also provided insight into the ‘spatial relationship’ between untreated, PRS and treated cells and identified a subset of cells that, although previously defined as PRS by pseudotime analysis, now lay outside the limits of the PRS occupied area. Such cells might present an additional intermediate cell state that might acquire full phenotypic resistance only upon treatment exposure. Interestingly, PRS cells display enhanced expression of mitochondrial genes, which may contribute to their capacity to withstand chemotherapy (Extended Data Fig.10g)
To assess the relevance of these findings to clinical practice, we performed single-cell RNAseq analysis of matching diagnosis, MRD and relapse specimens from two patients undergoing standard BCP-ALL treatment (including with L-asparaginase). Of note, residual leukemic cells in primary MRD specimens typically account for less than 10-4-10-5 cells, and there are no universal markers that can be used to separate malignant cells from healthy hematopoietic cells, making the direct interrogation of this disease compartment extremely challenging.
We first used the xenograft data to generate a signature of resistant and PRS cells by differential gene expression analysis (DGE) of treated vs untreated non-cycling cells, and of PRS vs untreated non-cycling cells. Our signature consisted of the top 50 genes, after pre-emptively filtering out both untreated cycling cells and cell-cycle related genes to ensure the DGE results would not solely reflect cell-cycle differences between the populations. To account for the very small size of the PRS compartment, which makes direct comparison with larger populations statistically challenging, and to ensure weighting of the signature in favor of genes important for PRS cells, we also filtered out genes differentially expressed between treated and PRS cells.
Testing the expression of the generated signature in individual cells from the clinical specimens demonstrated that prior to any treatment, the diagnostic disease contains a rare population of cells with high expression of the xenograft-based PRS/treated signature. Crucially, in agreement with our idea that treatment selects for cells in this state, this population is considerably enlarged in the matching post-induction chemotherapy day28 MRD samples (Figure 8e). Altogether, therefore, our data paint a direct and clinically relevant picture of the prime mechanisms of selection operating during the critical phase of induction therapy in BCP-ALL, which entail selection for a rare pre-existing cell state rather than a specific genotype.
Discussion
We have sought to understand the principles shaping the genetic and epigenetic landscapes of the leukemic residuum that persists in children with BCP-ALL immediately after the completion of induction chemotherapy as modelled through in vivo transplantation and treatment. These cells are typically subclinical but are ultimately responsible for disease recurrence.
Using analyses linking genotype and cell state of individual leukemic cells to their phenotype, we have tested the prevailing notion that intratumor genetic heterogeneity is the primary determinant of resistance to chemotherapy in BCP-ALL. Surprisingly, but in line with the results of a similar recent study of colorectal cancer40, this is not the case; rather, phenotypic heterogeneity is the primary source of escape.
Our treatment studies deployed xenografts; a model that is particularly well suited to the study of B-cell malignancies. The primary leukemic cells that engraft recipients retain the range of genotypic and phenotypic heterogeneities of the leukemia from which they are derived2,6,41, and are routinely used to test new drugs42–44. Inevitably, the chemotherapy regimen we used in our experiments is not a perfect replica of that utilized in children, which always includes L-asparaginase, and sometimes additional cytotoxic drugs with distinct mechanisms of action. Additionally, induction chemotherapy in BCP-ALL patients is followed by 24–36 months of consolidation/maintenance treatment, aimed at preventing disease recurrence. Since this lengthy protocol would be problematic to fully recapitulate in xenografted mice, whether genetic selection occurs during these later phases of treatment remains to be assessed. Nevertheless, induction chemotherapy is where maximum cytoreduction occurs, and dexamethasone and vincristine - which we administered to PDXs in line with standard clinical schedules - together comprise the backbone of this crucial phase of treatment in BCP-ALL. Furthermore, our in vivo treatment regimen achieved a degree of cytoreduction and disease clearance that is comparable, if not superior, to that observed in clinical practice, and we were able to confirm some our key findings directly in patients receiving complete clinical regimens. The model also allowed us to independently treat cells from the same leukemia multiple times, something which is not possible in patients; and therefore, afforded insights into the deterministic versus stochastic nature of selection at the level of the genotype of individual tumor cells.
Our finding that induction chemotherapy in BCP-ALL does not primarily select tumor genotypes deterministically, suggests that most subclones have similar fitness in response to the selective pressure of treatment. This resonates with our observation that there is no clear co-segregation between BCP-ALL phenotypes classically associated with treatment resistance - such as absence of Ki67 expression - and genotype. While in some instances we observed minor differences in clonal size post-treatment, which could either reflect stochastic drifts or potentially modest differences in treatment sensitivity, none were of a magnitude compatible with major bottleneck selection acting on genotypic differences as has been inferred by earlier studies of diagnosis and relapse8.
However, as alluded to above, the persistence of genetic heterogeneity provides a plausible substrate for the later diversification and expansion of specific genetic sub-clones during the evolution of relapse, either on- or off-treatment (intensification/maintenance). Thus, while leukemic subclones of all genotypes survive induction chemotherapy to a broadly similar extent, those that either recover/expand/proliferate fastest (either deterministically or stochastically) - or stochastically acquire de novo mutations that confer increased resistance to subsequent treatment (maintenance and consolidation) - will likely dominate at relapse.
In the absence of significant genetic selection during induction treatment, our transcriptomic analysis nevertheless uncovered a severe bottleneck at the cell state level. Leukemic cells in newly diagnosed patients span a spectrum of cell states varying in phenotypic traits such as cell cycle, metabolic status, and differentiation stage. Furthermore, analogous to normal hematopoietic stem and progenitor cells45 they exhibit promiscuous expression of genes associated with distinct blood lineages and maturation stages. In contrast, MRD-like cells generated through in vivo treatment capture a unique cellular phenotype characterized by both an early multi-lymphoid developmental stage and diminished expression of MYC, E2F and their target genes.
Furthermore, we have demonstrated a previously unappreciated correlation between cell cycle status and differentiation stage, and identified gene modules of coordinated differential methylation and expression involved in regulating these essential phenotypic traits that might explain their persistence throughout in vivo relapse. Crucially, we find that cells with the same transcriptional phenotype as MRD-like cells are already present at very low numbers in untreated leukemias, both in xenografted and direct clinical specimens.
Given the limited sample size and possible limitations associated with the use of a model system, it will be interesting to see how the relative contribution to resistance of genetic vs epigenetic heterogeneity plays out in a larger cohort of patients. In light of the strong association observed in clinical practice between cytogenetics and prognosis, such a cohort should span all cytogenetic subtypes, and encompass patients with varied time from diagnosis to relapse, as the clinical observation that some BCP-ALL patients relapse during treatment while others relapse off-treatment might suggest different underlying selection processes. Whether or not our findings apply more broadly to different tumor types remains to be assessed. Genetic heterogeneity might play a more predominant role in other cancers, particularly in fast-evolving tumors and/or spatially segregated solid tumors. Deterministic selection for genotypes is also likely to underlie treatment resistance in the context of targeted therapy, where earlier studies have indeed led to the identification of subsets of genetic variants directly involved in sensitivity to relevant inhibitors46. Nonetheless, these findings argue for the importance of exploring the immediate post-treatment disease landscape and evaluating cell state as a determinant of resistance in a broader range of hematologic and solid malignancies and further advocate epigenetic cell state as a candidate target of any subsequent therapeutic interventions.
Methods
Patients and samples
Diagnostic childhood BCP-ALL bone marrow (BM) samples (see Supplementary Table 5). were obtained from human participants aged 3-18 upon informed consent and approval by the relevant research ethics committees at John Radcliffe Hospital, Oxford, UK and Centro Ricerca Tettamanti, Clinica Pediatrica Universitaria Milano Bicocca, Italy.
Bone marrow reconstitution assay
Primary childhood BCP-ALL mononuclear cells isolated by Ficoll gradient centrifugation were transplanted into 8-12 weeks old NOD/SCID IL2Rγhull (NSG) sub-lethally irradiated mice (either females or males) via intramedullary injection. To minimize possible adverse effects of sublethal irradiation, mice were administered acid water for a week before the procedure, and Baytril (resuspended at 25.5 mg/kg in the drinking water) for the 2 weeks following it. Sub-lethal irradiation was achieved with a single dose of 375 cGy. Each mouse received 2 × 10⁵ primary leukemia cells resuspended in 40μl PBS 0.5% FBS, unless otherwise stated,. In the case of secondary limiting dilution assays, a specified equal dose of treated and control leukemic cells harvested from the BM of primary recipients was injected. Twelve-week post-injection mice were sampled by bone marrow aspiration, and the percentage of human engraftment was evaluated by flow cytometry (hCD45/(hCD45+ + mCD45+)). At the same time, human cells were also FACS sorted for downstream applications. Mice displaying at least 70% human engraftment were randomly assigned to either control or treatment groups (see below for details on the treatment protocol). After 28 days tibias, femurs, pelvises, spleen, and brain harvested. Total BM and spleen cellularity were estimated through the Sysmex XP-300™ Automated Hematology Analyzer, and all remaining cells were then stained for FACS sorting.
In vivo Treatment Protocol
All in vivo experiments were performed in strict accordance with the United Kingdom Home Office regulations. Mice were treated with pharmaceutical-grade Vincristine and Dexamethasone [Vincristine Sulphate 1 mg/ml Injection (Hospira) and Dexamethasone 2mg tablets (Auden Mckenzie)] The treatment regimen was first optimized on mice engrafted with commercially available healthy donor cord blood cells (Lonza) and consisted of 0,50 mg/Kg Vincristine administered weekly via IP, and 6 mg/L Dexamethasone supplemented to the drinking water (continuous administration). Unless otherwise stated, treatment was administered for a total of four weeks.
Flow cytometry
In the case of material freshly harvested from mice, primary cells were treated with ACK buffer (0.15M NH4Cl, 1.0mM KHCO3, 0.1mM EDTA) to lyse red blood cells prior to staining. Primary patient samples were brought from liquid nitrogen to room temperature and washed in Dulbecco’s phosphate buffered saline (DPBS). Single cell suspensions were washed with FACS buffer (PBS + 10% FBS) and stained (15min, 4°C) with the appropriate fluorochrome-conjugated antibodies (Supplementary Table 6) diluted to optimal working concentration in PBS 10% FBS. A wash in FACS buffer was performed prior to analysis. Appropriate unstained, single color and FMO controls were used for compensation set-up and to define the gating strategy. Leukemic cells were defined as hCD45+, and “quiescent cells” as CD34+/CD19+/CD38-. Data was analyzed with FlowJo v8.6 (Tree Star) software.
Karyotype preparation
Flow sorted cells (500-1*10e6) were collected in a 1.5mL screwcap tube filled with 10-200ul of FACS buffer (PBS + 10% FBS). Cells were centrifuged at 400g for 10min and, after removing the supernatant, resuspended in 700μl of pre-heated KCl (5.6g in 1L of purified water) and incubated at 37°C for 15 minutes. Cells were then prefixed by adding 300μl of ice-cold methanol-acetic acid fixing solution dropwise (3-parts methanol and 1-part glacial acetic acid). Tubes were mixed by inversion and centrifuged at 400g for 10min. After removing the supernatant, cells were fixed by adding 1ml of ice-cold fixing solution dropwise while holding the tube on a vortex (speed 7 or 8). Cells were left to rest for 5min before spinning down at 400g for 10min. If needed, cells were stored at 4°C (short-term) or −20°C (long-term).
Cytocell Aquarius probes for multicolor FISH
Locus specific FISH probes targeting chromosomes 9, 12 and 21 were custom designed and manufactured by Cytocell. Probes were directly labelled with different fluorochromes, allowing for the simultaneous detection of four different fluorescent signals upon hybridization to target sequences (Supplementary Table 7).
Multicolor FISH protocol
Following karyotype preparation, frozen cell suspensions were pelleted by centrifugation at 400g for 15 minutes, washed in 800μl of freshly prepared ice-cold fixing solution (prepared as above), and centrifuged again. Supernatants were removed, and cell pellets were resuspended in 5-50μl of ice-cold methanol-acetic acid fixing solution. Cells were spotted dropwise onto a moist slide and allowed to air dry for a few minutes. Spotted slides were immersed in 2X SSC for 5min and washed x3 (1min) in distilled water at room temperature (RT). Slides were then incubated in Pepsin Working Solution (Sigma-Aldrich) [Stock solution: 100mg/ml diluted in distilled water (35ul aliquots stored at −20°C); Working solution: 0.05 mg/ml diluted in 10mM HCl at 37°C] for 2 min and washed 3 times (1min) in distilled water at RT. Slides were dehydrated through immersion in ethanol series (70%, 85%, 100%, 2min each at RT) and air-dried. Pre-denaturation of the probe and the sample was achieved by spotting warm probe mix (5ul/slide, pre-heated for 5min at 37°C) on heated slides (5min on a hot-plate set to 37°C). A 22x22 coverslip (VWR®) was applied over the spotted area, bubbles were removed by gentle pressure, and the coverslip was sealed with rubber glue (Fixogum) and let to dry. Simultaneous denaturation of probe and sample was achieved placing slides on a hybridizer (ThermoBrite®) at 75°C for 2min, and was followed by overnight incubation in the hybridizer at 37°C. The following day, coverslips were removed, and a series of post-hybridization washes were performed. Slides were incubated in 0.4X SSC at 72°C for 2min, followed by 30 seconds in 2X SSC/0.1% IGEPAL at RT. Upon air-drying, slides were stained with 5μl of Cytocell DAPI/antifade and covered with a 22x22 coverslip.
Microscopes and probe visualization
A Zeiss Axio Observer z1 Apotome fluorescence microscope was used for the imaging and scoring of mFISH samples. The microscope was set up with commercially available DAPI (Filter Set 49, 488049-9901-000) and FITC (Filter Set 38 HE, 489038-9901-000) filters purchased from Zeiss, and of custom-made DEAC (49302), Texas Red (49008), GOLD (49034), FITC/TXR (59022) filters purchased from Chroma. Slides were scanned overnight using Metafer (MetaSystems), an automated high-throughput software specialized in FISH images acquisition and processing. For each sample, 100-600 interphase nuclei were scanned, and 100-250 cells manually scored for the presence of the ETV6–RUNX1 fusion gene in combination with deletion (hemizygous or homozygous) or amplification of ETV6 (TEL), RUNX1 (AML1), PAX5 and CDKN2A (p16).
Establishing cut-off levels
Each probe hybridization efficiency was quantified, scoring unexpected abnormal signal patterns in two types of positive control samples: i) unenriched PBMCs from normal peripheral blood and ii) CD19-enriched cells from the bone marrow of two normal karyotype individuals. In each case, >200 nuclei were scored for the presence/absence of TEL-AML1 fusion gene as well as copy number variants involving ETV6 (TEL), RUNX1 (AML1), PAX5 and CDKN2A (p16) genes. The mean percentage of cells with loss or amplification of any single gene signal was 0–1.87%. Combinatorial cut-off levels were obtained by two independent approaches i) visually scoring slides for the coexistence of any two lesions (cut-off of 0.45%) and ii) by mathematical calculation of the likelihood of any two events happening at the same time based on scoring data collected for each probe (cut-off of 0.35%). Based on these results (Supplementary Table 8), a conservative threshold of 2% was set in order for a clone with any single additional CNA (compared to its closest predecessor) to be called; an additional requirement was also set requiring at least 3 cells with a given genetic makeup to be scored within a sample.
Small cell number RNA sequencing
Small cell number RNA-seq from equivalent cell numbers (400 cells) was performed as described in Böiers et al., Dev Cell 201849.
Single cell gene expression (qPCR) analysis
Single cells were sorted into 96 well PCR plates as described in Potter et al50. cDNA synthesis from sorted single cells and subsequent target probe pre-amplification with genes of interest was performed as described by Moignard et al51. Gene probes used in these experiments included: CD34, CD38, CD19, UBC, polr2A, CDK6, CDKN1B, Ki67, TRFR, CD3e, RUNX1 and ETV6-RUNX1 (TaqMan™ gene expression assays, Thermo Fisher).
Single-cell RNA sequencing
Single-cell RNAseq experiments were performed as previously described in Ghorani et al., Nat Cancer 202052. For each experiment, 1500 single hCD45+ viable (Hoechst 33258 negative) leukemic cells were flow-sorted directly into a 10-to 17-μm-diameter C1 Integrated Fluidic Circuit (IFC; Fluidigm).
Single-cell Whole Genome Sequencing
1500 single hCD45+ viable (Hoechst 33258 negative) leukemic cells were flow-sorted directly into a 10-17-μm C1 Integrated Fluidic Circuit (IFC; Fluidigm) preloaded with 3.5μl of PBS 0.5% BSA. Post-sorting the total well volume was measured and brought to 5ul with PBS 0.5% BSA. 1ul of C1 Cell Suspension Reagent was added to final solution. Each C1 IFC capture site was carefully examined using the EVOS FL Auto Imaging System (Thermo Fisher Scientific). An automated scan of all capture sites was also obtained for future reference. Cell lysing and whole genome amplification from Single Cells were performed on the C1 Single-Cell Auto Prep IFC using the PicoPLEX WGA Kit (Rubicon Genomics). To this end, a custom-made script was generated through the C1 Script Builder.
Methylation analysis
Genomic DNA was isolated by phenol-chloroform extraction of primary human CD45+ BM cells harvested from untreated and treated mice. DNA quantification and purity were determined by Nanodrop and QuBit. The EZ DNA methylation kit (Zymo Research bisulfite conversion) was used for bisulfite conversion following manufacturer instructions (final elution in 6μl). Samples were analysed at the UCL Genomics facility using the Infinium Human Methylation EPIC array (Illumina).
Processing of bulk RNAseq
Bulk RNAseq samples were processed using a nextflow pipeline (https://github.com/UCL-BLIC/rnaseq) which runs FastQC, TrimGalore!, STAR and featureCounts to clean, map the reads to the human reference GRCh38.p12 and quantify gene expression using the Ensembl v96 annotations. Analyses were performed within the R statistical computing framework, version 3.5.1 using packages from Bioconductor version 3.10 (https://Bioconductor.org). The DEseq2 Bioconductor package was used for outlier detection, normalization and differential gene expression analyses. PCA were derived using the top 1000 most variable genes after DESeq2 vst transformation.
Processing of single Cell RNAseq
We used STAR to map the reads to the GRCh38 reference human genome, as included in Ensembl v84, RSEM to quantify transcript and gene expression abundance, scater for quality assessment and scran for normalization. All count data, metadata and intermediate results were kept within a SingleCellExperiment R object. Unless otherwise specified, all analyses were performed using log-transformed normalized counts. We used the t-SNE method implemented in the Rtsne package. Seurat package was used to build the UMAP, cluster the cells and identify cluster gene markers (only among genes detected in at least 25% of the cells). Pseudo-time reconstruction was obtained using the TSCAN package 39 with 10 clusters, as suggested by the SC3 package. PRSandTREATED signature was derived using the SingleR package with the top 50 genes in a 3-way comparison, where we removed any genes identified as differentially expressed between PRS and treated cells.
Gene sets and Gene Set Enrichment Analysis
Gene signatures of potential biological interest were retrieved from the Hallmark dataset (MSigDB version 6.1). These were complemented with gene signatures defining the different stages of haematopoietic lineage differentiation32. Gene signatures identifying cell cycle marker were also included genes34,53 (Supplementary Table 4). This combined set of gene signatures was used for enrichment analysis, lineage determination, cell cycle state determination, single-cell latent variable model analysis and correlation analysis between these different factors. The fGSEA package48 was used to determine gene set enrichment for each of the signatures.
Lineage Classification for single cells
For hematopoietic lineage determination, we followed a previously published approach for assigning a lineage to each cell 54. In more detail, to achieve normal distribution, data were re-normalized as z-scores of log(TPM+1); the lineage score of each signature within a given cell was then computed as the average value of all signature genes. In the single lineage analysis, each cell was assigned to the lineage with the highest score. For multi-lineage analyses, a threshold of z-score=0.75 was used as a cut-off for a positive lineage call.
Processing of single cell Whole Genome Sequencing
Single-cell whole-genome data were processed using a nexflow pipeline (https://github.com/UCL-BLIC/nf-ginkgo; commit 2fb0ac0) which run at the time: FastQC v0.11.8; MultiQC v1.6; TrimGalore! v0.5.0; bwa mem v0.7.12-r1039; samtools v1.9 for sorting and indexing; Picard MarkDuplicates v2.18.9-SNAPSHOT; BEDTools v2.27.1 to generate BED files with read information and Ginkgo (https://github.com/robertaboukhalil/ginkgo; commit 892b2e9) to bin the reads, GC-correct and normalise the counts, produce per-cell QC plots and initial CN profiles. Data were re-normalised using control single-cells obtained from 2 cord blood samples (1 male, 1 female) initially processed as above. Bins characterised as deletions, amplifications or displaying excessive variability among control cells were excluded. Initial CN events were detected for each sample using the multi-sample PCF (R package copynumber v1.14.0) with gamma = 5. These CN events were manually inspected and compared to the raw data, and CN calls using single-sample PCF (gamma = 10) to confirm the edges, adjust the CN thresholds (usually 0.5 for homozygous deletion, 1.5 for heterozygous deletion, 2.5 for 1-copy gain, etc.) and resolve possible overlaps between CN events. To mitigate the effect of choosing one common CN threshold for all cells, we sample around each CN threshold (using a truncated normal distribution, sd = 0.05) and around each cell CN value (using a normal distribution, sd = 0.05). Final CN calls are a consensus of the best 100 out of 10,000 trials to reduce the total number of clones in each sample. The results were then manually inspected to confirm the soundness of the selected thresholds and clone assignments. The final tree is inferred using getMinimumArborescence from the optrees v1.0 R package. Pt1 PDX tree was trimmed to remove leaf nodes with a single cell. Fishplots were drawn using the R package Timescape v1.10.
Illumina Infinium EPIC data pre-processing
DNA methylation levels were measured using Illumina Infinium MethylationEPIC BeadChips (‘EPIC array’) according to the manufacturer’s protocol. Data preprocessing steps were carried out using methods incorporated in the R packages minfi55,56 and ChAMP57. First, we filtered out probes based on the following criteria: (1) detection p-value greater than 0.01; (2) bead count of less than three in at least 5% of samples; (3) non-CG probes; (4) containing SNPs with a MAF of at least 1% in the European population (1000 Genomes Project) within five base pairs of the probed CG58; (5) mapping to multiple genomic locations58; and (6) mapping to sex chromosomes. The filtering procedure resulted in 763,949 out of 866,238 probes. Next, we applied PBC normalization, a peak-based method, to correct for probe bias in Illumina Infinium Methylation data59 and reduce technical variation. We adjusted for batch effects due to multiple samples processed on each slide using the ComBat function of the R package SVA60. To assess data quality and identify further potential batch effects or outlier samples, we performed singular value decomposition (SVD) to determine components of variation and applied multidimensional scaling (MDS), principal component analysis (PCA) and hierarchical clusterings at all steps of the data preprocessing procedure.
Quantification of DNA methylation
DNA methylation values are provided as either M-values or Beta-values. M-values are the log2 ratio of the intensities of the methylated probe versus the unmethylated probe on the EPIC array. Beta-values are calculated as the ratio of the methylated probe intensity and the overall intensity. All analyses of DNA methylation data were performed on M-values. Beta-values, which have more straightforward interpretability, was used for the visualization of DNA methylation data in figures (i.e., 0–100% DNA methylation). To quantify DNA methylation variability (MV) and correct for the dependency of variability measurements on the mean, we adapted the method of Alemu et al.61 as previously described62.
Analysis of differential methylation
We applied a paired limma model63,64 to identify differentially methylated positions (DMPs). Statistical significance was defined as BH-corrected65 p < 0.05 and an absolute fold change >= 1. Differentially methylated regions (DMRs) were identified by bumphunter setting the minimum number of neighbouring probes to four, the maximum length of a DMR to 300 bp, the number of permutations to 250. Statistical significance was again defined as BH-corrected p < 0.05.
Analysis of differential methylation variability
We applied a combined statistical approach based on DiffVar66, which is embedded in the framework of limma, and the MV as previously described62. Paired tests were used to identify differentially variable positions (DVPs). Statistical significance was defined as BH-corrected p < 0.05 and MV difference ≥ 10% relative to the observed range of MV values. Differentially variable regions (DVRs) were identified by DMRcate67 based on limma, setting the individual BH-corrected p-value threshold to 0.25 and considering regions with a minimum of four neighbouring CpGs. Statistical significance was defined by the default region-based p-value cutoff determined by DMRcate.
Methylation array pathway analysis
We analyzed the biological functions and pathway enrichment of flanking genes with GREAT68 using the standard parameters: association rule = basal plus extension (proximal 5 kb upstream, 1 kb downstream, up to 1 Mb extension); curated regulatory domains = included.
Statistics and reproducibility
Statistics calculations were carried out in either Prism (version 8) or R (version 3.4.3). Power calculations and Monte-Carlo simulations based on earlier data (Anderson et al. 2011) were used to inform the design of the in vivo experiments. Investigators were not blinded to allocation during the experiments and outcome assessment. Samples for transplantation were chosen based on the appropriate cellularity of the specimen. Mice assignment to either the control or treatment group was randomized. Where appropriate, P values were adjusted using the Benjamini–Hochberg method to control the type 1 error rate in the context of multiple testing. scWGS samples were excluded if they had an MAPD > 0.6, fewer than 500,000 reads, a median number of reads per bin smaller than 10; a Gini index >0.35, or displayed unusual profiles in the QC plots produced by Ginkgo. Three bulk RNAseq samples were excluded from the analysis. These include one PT1 untreated, one PT2 acutely treated and one PT12 treated sample because they failed to cluster with the related samples in a PCA analysis. Single-cell RNAseq libraries with fewer than 1 million reads or fewer than 2000 genes expressed were removed. In the downstream analysis, genes with more than 20 read counts in fewer than 6 cells (scRNA-seq) or samples (bulk RNA-seq) were also excluded.
Reporting Summary
Further information on research design is available in the Nature Research Reporting Summary linked to this article.
Extended Data
Extended Data Fig. 1.
Extended Data Fig. 2.
Extended Data Fig. 3.
Extended Data Fig. 4.
Extended Data Fig. 5.
Extended Data Fig. 6.
Extended Data Fig. 7.
Extended Data Fig. 8.
Extended Data Fig. 9.
Extended Data Fig. 10.
Supplementary Material
Aknowledgements
The authors thank all clinicians and the Blood Cancer UK Leukaemia Cell Bank for samples, Y. Guo for the assistance with the in vivo work, B. Gaal for sharing her matlab expertise, I. Titley and A. Ford for cell sorting and Ki67 analysis of single quiescent cells, and Fluidigm for technical support. We also acknowledge the UCL-CI CRUK-funded flow cytometry, microscopy and genomics facility for access to instrumentation and for practical help with FACS analysis (W. Day, Y. Guo, B. Wilbourne and G. Morrow). The authors acknowledge the use of the UCL Legion and Myriad High Performance Computing Facility (Legion@UCL; Myriad@UCL), and associated support services, in the completion of this work. This work was supported by Blood Cancer UK project grants (T.E, M.G and S.E.W.J) and partially supported by the Francis Crick Institute, which receives its core funding from Cancer Research UK (FC001202), the UK Medical Research Council (FC001202), and the Wellcome Trust (FC001202). V.A.T was funded by grants from Children with Cancer UK and Blood Cancer UK, N.P was founded by Gabriel’s Angels, J.A.G-A and L.C were funded by the Cancer Research UK-University College London (CRUK-UCL) Centre Award, MT is a postdoctoral fellows supported by the European Union’s Horizon 2020 research and innovation program (Marie Skłodowska-Curie Grant Agreement No. 747852-SIOMICS), PVL is a Winton Group Leader in recognition of the Winton Charitable Foundation’s support towards the establishment of The Francis Crick Institute, and M.G by the The Wellcome Trust, L.J.R was funded by The Kay Kendall Leukaemia Fund and Leuka, G.C was funded by the Italian Association for Cancer Research (AIRC) grants IG2017 n.20564 to AB and grant IG2015 n.17593 to GC, AB and GC were funded by the Comitato Maria Letizia Verga, and S.E.W.J. by the UK Medical Research Council (MC_UU_12009/5).
Footnotes
Author Contributions
Conceptualization: V.A.T, T.E., M.G, and S.E.J; Methodology: V.A.T, M.L, J.B, A.W and M.H; Investigation: V.A.T, N.P, I.M and A.D; Formal Analysis: J.A.G-A, M.T, P.V.L, S.B and J.H; Data Curation: J.A.G-A, A.W, S.E, C.D, C.J, C.L and J.H; Resources: S.E.J, G.W.H, A.B, L.R, S.I, P.A, G.C and L.R; Supervision: T.E, S.E.J and M.G; Manuscript writing: V.AT, R.G, G.M, T.E and M.G Funding Acquisition: T.E and M.G.
Competing Interest
M.L was an employee of Fluidigm Corporation at the time of the study.
Data Availability
Bulk and single-cell DNA and RNA sequencing and methylation array data (see Supplementary Table 9) that support the findings of this study have been deposited in the European Genome-phenome Archive (EGA), which is hosted by the EBI and the CRG, under accession numbers EGAS00001004407. Previously published whole-genome-sequencing data from ref.29 and ref.25 are available under accession numbers EGAD00001000076 and EGAD00001000636. Source data for Figures 1–8 Extended data figures 2–10 have been provided as Source D ata Files.
Code availability
Code used for this analysis is available at https://github.com/UCL-BLIC-analysis/Turati_NatCancer_2021.
References
- 1.Almendro V, Marusyk A, Polyak K. Cellular Heterogeneity and Molecular Evolution in Cancer. Annu Rev Pathol Mech Dis. 2013;8:277–302. doi: 10.1146/annurev-pathol-020712-163923. [DOI] [PubMed] [Google Scholar]
- 2.Anderson K, et al. Genetic variegation of clonal architecture and propagating cells in leukaemia. Nature. 2011;469:356–361. doi: 10.1038/nature09650. [DOI] [PubMed] [Google Scholar]
- 3.Gerlinger M, et al. Intratumor Heterogeneity and Branched Evolution Revealed by Multiregion Sequencing. N Engl J Med. 2012;366:883–892. doi: 10.1056/NEJMoa1113205. [DOI] [PMC free article] [PubMed] [Google Scholar]
- 4.Jamal-Hanjani M, et al. Tracking the Evolution of Non–Small-Cell Lung Cancer. N Engl J Med. 2017;376:2109–2121. doi: 10.1056/NEJMoa1616288. [DOI] [PubMed] [Google Scholar]
- 5.McGranahan N, Swanton C. Clonal Heterogeneity and Tumor Evolution: Past, Present, and the Future. Cell. 2017;168:613–628. doi: 10.1016/j.cell.2017.01.018. [DOI] [PubMed] [Google Scholar]
- 6.Notta F, et al. Evolution of human BCR-ABL1 lymphoblastic leukaemia-initiating cells. Nature. 2011;469:362–7. doi: 10.1038/nature09733. [DOI] [PubMed] [Google Scholar]
- 7.Mullighan CG, et al. Genomic analysis of the clonal origins of relapsed acute lymphoblastic leukemia. Science (80- .) 2008;322:1377–1380. doi: 10.1126/science.1164266. [DOI] [PMC free article] [PubMed] [Google Scholar]
- 8.Dobson SM, et al. Relapse-Fated Latent Diagnosis Subclones in Acute B Lineage Leukemia Are Drug Tolerant and Possess Distinct Metabolic Programs. Cancer Discov. 2020 doi: 10.1158/2159-8290.cd-19-1059. [DOI] [PMC free article] [PubMed] [Google Scholar]
- 9.Ding L, et al. Clonal evolution in relapsed acute myeloid leukaemia revealed by whole-genome sequencing. Nature. 2012;481:506–510. doi: 10.1038/nature10738. [DOI] [PMC free article] [PubMed] [Google Scholar]
- 10.Landau DA, et al. Evolution and Impact of Subclonal Mutations in Chronic Lymphocytic Leukemia. Cell. 2013;152:714–726. doi: 10.1016/j.cell.2013.01.019. [DOI] [PMC free article] [PubMed] [Google Scholar]
- 11.Clevers H. The cancer stem cell: Premises, promises and challenges. Nat Med. 2011;17:313–319. doi: 10.1038/nm.2304. [DOI] [PubMed] [Google Scholar]
- 12.Good Z, et al. Single-cell developmental classification of B cell precursor acute lymphoblastic leukemia at diagnosis reveals predictors of relapse. Nat Publ Gr. 2018;24 doi: 10.1038/nm.4505. [DOI] [PMC free article] [PubMed] [Google Scholar]
- 13.Nguyen A, Yoshida M, Goodarzi H, Tavazoie SF. Highly variable cancer subpopulations that exhibit enhanced transcriptome variability and metastatic fitness. Nat Commun. 2016;7:1–13. doi: 10.1038/ncomms11246. [DOI] [PMC free article] [PubMed] [Google Scholar]
- 14.Ramirez M, et al. Diverse drug-resistance mechanisms can emerge from drug-tolerant cancer persister cells. Nat Commun. 2016;7:1–8. doi: 10.1038/ncomms10690. [DOI] [PMC free article] [PubMed] [Google Scholar]
- 15.Velde Robert Vander, 1, 2, Yoon Nara, 3, Marusyk Viktoriya, 1, Durmaz Arda, 3, 4, Dhawan Andrew, 3, Myroshnychenko Daria, 1, Lozano-Peral Diego, 1, Desai Bina, 1, 5, Balynska Olena, 1, Poleszhuk J, 7, Kenian Liu, 8, et al. Resistance to targeted therapies as a multifactorial, gradual adaptation to inhibitor specific selective pressures. bioRxiv Prepr. 2018;43 doi: 10.1038/s41467-020-16212-w. [DOI] [PMC free article] [PubMed] [Google Scholar]
- 16.Schuh A, et al. Monitoring chronic lymphocytic leukemia progression by whole genome sequencing reveals heterogeneous clonal evolution patterns. Blood. 2012;120:4191–4196. doi: 10.1182/blood-2012-05-433540. [DOI] [PubMed] [Google Scholar]
- 17.Almendro V, et al. Inference of Tumor Evolution during Chemotherapy by Computational Modeling and In Situ Analysis of Genetic and Phenotypic Cellular Diversity. Cell Rep. 2014;6:514–527. doi: 10.1016/j.celrep.2013.12.041. [DOI] [PMC free article] [PubMed] [Google Scholar]
- 18.Greaves M. Nothing in cancer makes sense except…. BMC Biol. 2018;16:22. doi: 10.1186/s12915-018-0493-8. [DOI] [PMC free article] [PubMed] [Google Scholar]
- 19.Greaves M. Leukaemia ‘firsts’ in cancer research and treatment. Nature Reviews Cancer. 2016;16:163–172. doi: 10.1038/nrc.2016.3. [DOI] [PubMed] [Google Scholar]
- 20.Cooper SL, Brown PA. Treatment of pediatric acute lymphoblastic leukemia. Pediatric Clinics of North America. 2015;62:61–73. doi: 10.1016/j.pcl.2014.09.006. [DOI] [PMC free article] [PubMed] [Google Scholar]
- 21.Panzer-Grumayer ER, et al. Rapid molecular response during early induction chemotherapy predicts a good outcome in childhood acute lymphoblastic leukemia. Blood. 2000;95:790–794. [PubMed] [Google Scholar]
- 22.Theunissen PMJ. Normal and malignant B-cells in acute lymphoblastic leukemia. 2016 [Google Scholar]
- 23.Deleye L, et al. Performance of four modern whole genome amplification methods for copy number variant detection in single cells. Sci Rep. 2017;7:1–9. doi: 10.1038/s41598-017-03711-y. [DOI] [PMC free article] [PubMed] [Google Scholar]
- 24.Mullighan CG, et al. Genome-wide analysis of genetic alterations in acute lymphoblastic leukaemia. Nature. 2007;446:758–764. doi: 10.1038/nature05690. [DOI] [PubMed] [Google Scholar]
- 25.Papaemmanuil E, et al. RAG-mediated recombination is the predominant driver of oncogenic rearrangement in ETV6-RUNX1 acute lymphoblastic leukemia. Nat Genet. 2014;46 doi: 10.1038/ng.2874. [DOI] [PMC free article] [PubMed] [Google Scholar]
- 26.Swaminathan S, et al. Mechanisms of clonal evolution in childhood acute lymphoblastic leukemia. Nat Immunol. 2015;16:766–774. doi: 10.1038/ni.3160. [DOI] [PMC free article] [PubMed] [Google Scholar]
- 27.Hong D, et al. Initiating and cancer-propogating cells in TEL-AML1-associated childhood leukemia. Science (80- .) 2008;319:336–339. doi: 10.1126/science.1150648. [DOI] [PubMed] [Google Scholar]
- 28.Lutz C, et al. Quiescent leukaemic cells account for minimal residual disease in childhood lymphoblastic leukaemia. Leukemia. 2013;27:1204–1207. doi: 10.1038/leu.2012.306. [DOI] [PMC free article] [PubMed] [Google Scholar]
- 29.Russell LJ, et al. Characterisation of the genomic landscape of CRLF2-rearranged acute lymphoblastic leukemia. Genes Chromosom Cancer. 2017;56:363–372. doi: 10.1002/gcc.22439. [DOI] [PMC free article] [PubMed] [Google Scholar]
- 30.Ebinger S, et al. Characterization of Rare, Dormant, and Therapy-Resistant Cells in Acute Lymphoblastic Leukemia. Cancer Cell. 2016;30:849–862. doi: 10.1016/j.ccell.2016.11.002. [DOI] [PMC free article] [PubMed] [Google Scholar]
- 31.Jiao Y, Widschwendter M, Teschendorff AE. Systems biology A systems-level integrative framework for genome-wide DNA methylation and gene expression data identifies differential gene expression modules under epigenetic control. 2014;30:2360–2366. doi: 10.1093/bioinformatics/btu316. [DOI] [PubMed] [Google Scholar]
- 32.Laurenti E, et al. The transcriptional architecture of early human hematopoiesis identifies multilevel control of lymphoid commitment. Nat Immunol. 2013;14:756–763. doi: 10.1038/ni.2615. [DOI] [PMC free article] [PubMed] [Google Scholar]
- 33.Vazquez-Santillan K, Melendez-Zajgla J, Jimenez-Hernandez L, Martínez-Ruiz G, Maldonado V. NF-κB signaling in cancer stem cells: a promising therapeutic target? doi: 10.1007/s13402-015-0236-6. [DOI] [PubMed] [Google Scholar]
- 34.Tirosh I, et al. Single-cell RNA-seq supports a developmental hierarchy in human oligodendroglioma. Nat Publ Gr. 2016;539 doi: 10.1038/nature20123. [DOI] [PMC free article] [PubMed] [Google Scholar]
- 35.Niyaz M, Khan MS, Mudassar S. Hedgehog Signaling: An Achilles’ Heel in Cancer. Translational Oncology. 2019;12:1334–1344. doi: 10.1016/j.tranon.2019.07.004. [DOI] [PMC free article] [PubMed] [Google Scholar]
- 36.Li L, Bhatia R. Stem cell quiescence. Clin Cancer Res. 2011;17:4936–4941. doi: 10.1158/1078-0432.CCR-10-1499. [DOI] [PMC free article] [PubMed] [Google Scholar]
- 37.Kwon JS, et al. Controlling Depth of Cellular Quiescence by an Rb-E2F Network Switch. Cell Rep. 2017;20:3223–3235. doi: 10.1016/j.celrep.2017.09.007. [DOI] [PMC free article] [PubMed] [Google Scholar]
- 38.Fujimaki K, Yao G. Crack the state of silence: Tune the depth of cellular quiescence for cancer therapy. Mol Cell Oncol. 2018;5:e1403531. doi: 10.1080/23723556.2017.1403531. [DOI] [PMC free article] [PubMed] [Google Scholar]
- 39.Ji Z, Ji H. TSCAN: Pseudo-time reconstruction and evaluation in single-cell RNA-seq analysis. Nucleic Acids Res. 2016;44:e117. doi: 10.1093/nar/gkw430. [DOI] [PMC free article] [PubMed] [Google Scholar]
- 40.Rehman SK, et al. Article Colorectal Cancer Cells Enter a Diapause-like DTP State to Survive Chemotherapy ll Article Colorectal Cancer Cells Enter a Diapause-like DTP State to Survive Chemotherapy. 2021:226–242. doi: 10.1016/j.cell.2020.11.018. [DOI] [PMC free article] [PubMed] [Google Scholar]
- 41.Baersch G, et al. Good engraftment of B-cell precursor ALL in NOD-SCID mice. Klin Padiatr. 1997;209:178–185. doi: 10.1055/s-2008-1043947. [DOI] [PubMed] [Google Scholar]
- 42.Kang MH, et al. Activity of vincristine, L-ASP, and dexamethasone against acute lymphoblastic leukemia is enhanced by the BH3-mimetic ABT-737 in vitro and in vivo. Blood. 2007;110:2057–2066. doi: 10.1182/blood-2007-03-080325. [DOI] [PubMed] [Google Scholar]
- 43.Samuels AL, et al. A pre-clinical model of resistance to induction therapy in pediatric acute lymphoblastic leukemia. Blood Cancer J. 2014;4:e232. doi: 10.1038/bcj.2014.52. [DOI] [PMC free article] [PubMed] [Google Scholar]
- 44.Szymanska B, et al. Pharmacokinetic modeling of an induction regimen for in vivo combined testing of novel drugs against pediatric acute lymphoblastic leukemia xenografts. PLoS One. 2012;7:e33894. doi: 10.1371/journal.pone.0033894. [DOI] [PMC free article] [PubMed] [Google Scholar]
- 45.Laurenti E, Göttgens B. From haematopoietic stem cells to complex differentiation landscapes. Nat Publ Gr. 2018;553 doi: 10.1038/nature25022. [DOI] [PMC free article] [PubMed] [Google Scholar]
- 46.Quek L, et al. Clonal heterogeneity of acute myeloid leukemia treated with the IDH2 inhibitor enasidenib. Nature Medicine. 2018:1–11. doi: 10.1038/s41591-018-0115-6. [DOI] [PMC free article] [PubMed] [Google Scholar]
- 47.Liberzon A, et al. The Molecular Signatures Database Hallmark Gene Set Collection In Brief Through extensive automated and manual curation, Liberzon et al. provide a refined and concise collection of ‘“hallmark”‘ gene sets from the Molecular Signatures Database for gene set enrichment analysis. Cell Systems The Molecular Signatures Database Hallmark Gene Set Collection. Cell Syst. 2015;1:417–425. doi: 10.1016/j.cels.2015.12.004. [DOI] [PMC free article] [PubMed] [Google Scholar]
- 48.Sergushichev AA. An algorithm for fast preranked gene set enrichment analysis using cumulative statistic calculation. bioRxiv. 2016:060012 [Google Scholar]
- 49.Böiers C, et al. A Human IPS Model Implicates Embryonic B-Myeloid Fate Restriction as Developmental Susceptibility to B Acute Lymphoblastic Leukemia-Associated ETV6-RUNX1. Dev Cell. 2018;44:362–377.:e7. doi: 10.1016/j.devcel.2017.12.005. [DOI] [PMC free article] [PubMed] [Google Scholar]
- 50.Potter NE, et al. Single-cell mutational profiling and clonal phylogeny in cancer. Genome Res. 2013;23:2115–25. doi: 10.1101/gr.159913.113. [DOI] [PMC free article] [PubMed] [Google Scholar]
- 51.Moignard V, et al. Decoding the regulatory network of early blood development from single-cell gene expression measurements. Nat Biotechnol. 2015;33:269–276. doi: 10.1038/nbt.3154. [DOI] [PMC free article] [PubMed] [Google Scholar]
- 52.Ghorani E, et al. The T cell differentiation landscape is shaped by tumour mutations in lung cancer. Nat Cancer. 2020;1:546–561. doi: 10.1038/s43018-020-0066-y. [DOI] [PMC free article] [PubMed] [Google Scholar]
- 53.Kowalczyk MS, et al. Single-cell RNA-seq reveals changes in cell cycle and differentiation programs upon aging of hematopoietic stem cells. Genome Res. 2015;25:1860–72. doi: 10.1101/gr.192237.115. [DOI] [PMC free article] [PubMed] [Google Scholar]
- 54.Zhao X, et al. Single-Cell RNA-Seq Reveals the Differentiation Hierarchy of Normal Human Bone Marrow and a Distinct Transcriptome Signature of Monosomy 7 Cells. Blood. 2016;128 [Google Scholar]
- 55.Aryee MJ, et al. Minfi: A flexible and comprehensive Bioconductor package for the analysis of Infinium DNA methylation microarrays. Bioinformatics. 2014;30:1363–1369. doi: 10.1093/bioinformatics/btu049. [DOI] [PMC free article] [PubMed] [Google Scholar]
- 56.Fortin JP, Triche TJ, Hansen KD. Preprocessing, normalization and integration of the Illumina HumanMethylationEPIC array with minfi. Bioinformatics. 2017;33:558–560. doi: 10.1093/bioinformatics/btw691. [DOI] [PMC free article] [PubMed] [Google Scholar]
- 57.Tian Y, et al. ChAMP: Updated methylation analysis pipeline for Illumina BeadChips. Bioinformatics. 2017;33:3982–3984. doi: 10.1093/bioinformatics/btx513. [DOI] [PMC free article] [PubMed] [Google Scholar]
- 58.Zhou W, Laird PW, Shen H. Comprehensive characterization, annotation and innovative use of Infinium DNA methylation BeadChip probes. Nucleic Acids Res. 2017;45:e22. doi: 10.1093/nar/gkw967. [DOI] [PMC free article] [PubMed] [Google Scholar]
- 59.Dedeurwaerder S, et al. Evaluation of the Infinium Methylation 450K technology. Epigenomics. 2011;3:771–784. doi: 10.2217/epi.11.105. [DOI] [PubMed] [Google Scholar]
- 60.Leek JT, Johnson WE, Parker HS, Jaffe AE, Storey JD. Relapse fated latent diagnosis subclones in acute B lineage leukaemia are drug tolerant and possess distinct metabolic programs Authors. Bioinformatics. 2012;28:882–883. [Google Scholar]
- 61.Alemu EY, Carl JW, Bravo HC, Hannenhalli S. Determinants of expression variability. Nucleic Acids Res. 2014;42:3503–3514. doi: 10.1093/nar/gkt1364. [DOI] [PMC free article] [PubMed] [Google Scholar]
- 62.Ecker S, et al. Genome-wide analysis of differential transcriptional and epigenetic variability across human immune cell types. Genome Biol. 2017;18 doi: 10.1186/s13059-017-1156-8. [DOI] [PMC free article] [PubMed] [Google Scholar]
- 63.Smyth GK. Bioinformatics and Computational Biology Solutions Using R and Bioconductor. Springer-Verlag; 2005. limma: Linear Models for Microarray Data; pp. 397–420. [DOI] [Google Scholar]
- 64.Ritchie ME, et al. Limma powers differential expression analyses for RNA-sequencing and microarray studies. Nucleic Acids Res. 2015;43:e47. doi: 10.1093/nar/gkv007. [DOI] [PMC free article] [PubMed] [Google Scholar]
- 65.Benjamini Y, Hochberg Y. Controlling the False Discovery Rate: A Practical and Powerful Approach to Multiple Testing. J R Stat Soc Ser B. 1995;57:289–300. [Google Scholar]
- 66.Phipson B, Oshlack A. DiffVar: a new method for detecting differential variability with application to methylation in cancer and aging. Genome Biol. 2014;15:465. doi: 10.1186/s13059-014-0465-4. [DOI] [PMC free article] [PubMed] [Google Scholar]
- 67.Peters TJ, et al. De novo identification of differentially methylated regions in the human genome. Epigenetics and Chromatin. 2015;8 doi: 10.1186/1756-8935-8-6. [DOI] [PMC free article] [PubMed] [Google Scholar]
- 68.McLean CY, et al. GREAT improves functional interpretation of cis-regulatory regions. Nat Biotechnol. 2010;28:495–501. doi: 10.1038/nbt.1630. [DOI] [PMC free article] [PubMed] [Google Scholar]
- 69.Hu Y, Smyth GK. ELDA: Extreme limiting dilution analysis for comparing depleted and enriched populations in stem cell and other assays. J Immunol Methods. 2009;347:70–78. doi: 10.1016/j.jim.2009.06.008. [DOI] [PubMed] [Google Scholar]
- 70.Lun ATL, McCarthy DJ, Marioni JC. A step-by-step workflow for low-level analysis of single-cell RNA-seq data with Bioconductor. F1000Research. 2016;5:2122. doi: 10.12688/f1000research.9501.1. [DOI] [PMC free article] [PubMed] [Google Scholar]
- 71.Laurenti E, et al. Cell Stem Cell Hematopoietic Stem Cell Function and Survival Depend on c-Myc and N-Myc Activity. Stem Cell. 3:611–624. doi: 10.1016/j.stem.2008.09.005. [DOI] [PMC free article] [PubMed] [Google Scholar]
- 72.Satija R, Farrell JA, Gennert D, Schier AF, Regev A. Spatial reconstruction of single-cell gene expression data. Nat Biotechnol. 2015;33:495–502. doi: 10.1038/nbt.3192. [DOI] [PMC free article] [PubMed] [Google Scholar]
Associated Data
This section collects any data citations, data availability statements, or supplementary materials included in this article.
Supplementary Materials
Data Availability Statement
Bulk and single-cell DNA and RNA sequencing and methylation array data (see Supplementary Table 9) that support the findings of this study have been deposited in the European Genome-phenome Archive (EGA), which is hosted by the EBI and the CRG, under accession numbers EGAS00001004407. Previously published whole-genome-sequencing data from ref.29 and ref.25 are available under accession numbers EGAD00001000076 and EGAD00001000636. Source data for Figures 1–8 Extended data figures 2–10 have been provided as Source D ata Files.
Code used for this analysis is available at https://github.com/UCL-BLIC-analysis/Turati_NatCancer_2021.


