Abstract
Despite major advancements in lung cancer treatment, long-term survival is still rare, and a deeper understanding of molecular phenotypes would allow the identification of specific cancer dependencies and immune evasion mechanisms. Here we performed in-depth mass spectrometry (MS)-based proteogenomic analysis of 141 tumors representing all major histologies of non-small cell lung cancer (NSCLC). We identified six distinct proteome subtypes with striking differences in immune cell composition and subtype-specific expression of immune checkpoints. Unexpectedly, high neoantigen burden was linked to global hypomethylation and complex neoantigens mapped to genomic regions, such as endogenous retroviral elements and introns, in immune-cold subtypes. Further, we linked immune evasion with LAG3 via STK11 mutation-dependent HNF1A activation and FGL1 expression. Finally, we develop a data-independent acquisition MS-based NSCLC subtype classification method, validate it in an independent cohort of 208 NSCLC cases and demonstrate its clinical utility by analyzing an additional cohort of 84 late-stage NSCLC biopsy samples.
Introduction
Lung cancer is the most common type of cancer worldwide with 2.1 million new cases each year. Most cases are diagnosed when the cancer has already metastasized and surgical resection is no longer an option, resulting in a dismal overall 5-year survival rate for non-small cell lung cancer (NSCLC) of 24% and only 6% in stage 4 disease (seer.cancer.gov). Rapid development of targeted therapies and immunotherapy present a major opportunity, but the impact on survival so far is blunted by a lack of biomarkers for therapy selection and limited knowledge of how therapies should be combined. Exploratory DNA- and RNA-level omics analyses of clinical cancer cohorts have demonstrated the value of a systems-level understanding of lung cancer1,2.
With the improved analytical depth provided by modern mass spectrometry (MS) we can finally measure the actual druggable molecular phenotype directly, i.e., the proteome, which is imperative for predictive medicine. An important feature of such analysis is that it provides a readout of not only the cancer cells in the sample, but also the stromal component and infiltrating immune cells. Altogether, this provides a picture of the dominant molecular cancer phenotype, or simply the most distinct features of the tumor as an organ3. For lung cancer, proteogenomic studies was recently performed on squamous cell carcinoma (SqCC, n=108)4, and on adenocarcinoma (AC) in three studies (Gillette et al.5, n=110; Xu et al 6, n=103; and Chen et al.7, n=103). For the AC studies, much focus was put on cancer in never-smokers (46%, 77%, and 83% of cohorts, respectively) and consequently on EGFR mutation-driven AC due to enrichment of this mutation in never-smoker cases (EGFR mutations in 34%, 50%, and 85% samples, respectively).
Here we have performed, in-depth analysis of the NSCLC proteome landscape, covering nearly 14,000 proteins and all major NSCLC histological subtypes. Based on this data, we defined six proteome subtypes of NSCLC and used the protein-level information to demonstrate clinical implications of the proteome subtypes, such as prognostic or treatment predictive value. Our in-depth analysis provides crucial new information for potential stratification of NSCLC patients in relation to immuno-therapy and targeted therapy, underscoring the value of the herein defined proteome subtypes. Finally, we developed a MS-based classification method that can be used for both early- and late-stage NSCLC samples in a clinical setting.
Results
1. Proteome subtypes of NSCLC
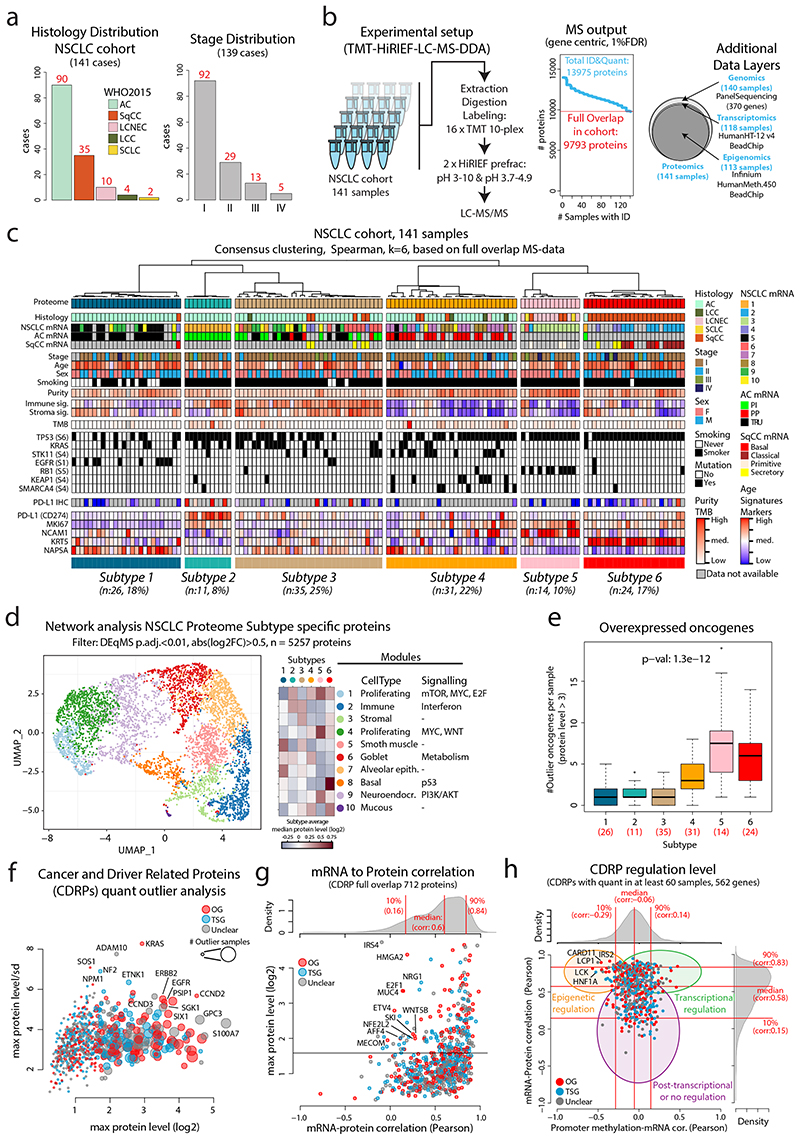
The 2015 WHO histological classification subdivides NSCLC into AC, SqCC, large-cell neuroendocrine carcinoma (LCNEC), and large-cell lung cancer (LCC), all represented in the current cohort of resected tissue samples (n=141), together with two small-cell lung cancer (SCLC) samples for reference (Figure 1a, Supplementary Table 1). The cohort primarily consists of early-stage (I-II, 87%) cancer, as late-stage (III-IV) NSCLC rarely involves surgical removal of the tumor. For a comprehensive phenotype-level analysis of NSCLC we used isobaric labelling and HiRIEF-LC-MS8,9 with data-dependent acquisition (DDA) reaching an analytical depth of 13,975 identified proteins (gene-centric search, FDR<1%, Figure 1b, Supplementary Table 2). In addition to MS-data, mutation analysis for cancer-associated genes was performed by panel sequencing (n=370 genes), furthermore genome-wide methylation and mRNA-level data were available for most samples10–12 (Supplementary Table 2).
Figure 1. MS-based identification of NSCLC proteome subtypes.
a. Bar plots showing histology and stage distribution in the patient cohort. b. Overview of experimental setup for MS-based proteome profiling, analysis output, and supporting data levels. c. Hierarchical tree showing the results from consensus clustering used to identify NSCLC proteome subtypes. Annotation bars below indicate clinical information of samples, mRNA subtypes, infiltration signatures, common mutations, and protein levels of selected markers. d. NSCLC proteome subtype network analysis with UMAP plot colored by modules (left), modules vs subtypes heatmap (center), and cell types/signaling pathway enrichment analysis output for the 10 modules (right). e. Boxplot indicating the number of overexpressed oncogenes per sample by NSCLC proteome subtype (n = 141 samples). Middle line, median; box edges, 25th and 75th percentiles; whiskers, most extreme points that do not exceed ±1.5 × the interquartile range (IQR). P-value was calculated using Kruskal-Wallis test and the number of samples per subtype is indicated in red. f. Bubble plot indicating cancer- and driver-related proteins (CDRPs) commonly overexpressed in the NSCLC cohort. g. Scatterplot indicating mRNA to protein Pearson’s correlation of CDRPs. The corresponding correlation density plot is displayed on top. h. Scatterplot showing promoter methylation to mRNA correlation vs mRNA to protein correlation for CDRPs. Indicated on top and to the right are the corresponding density plots for the full gene-wise overlap (9,018 genes). Dunn’s multiple comparison tests with Benjamini-Hochberg adjustment for boxplot (e) are available in Supplementary Table 3.
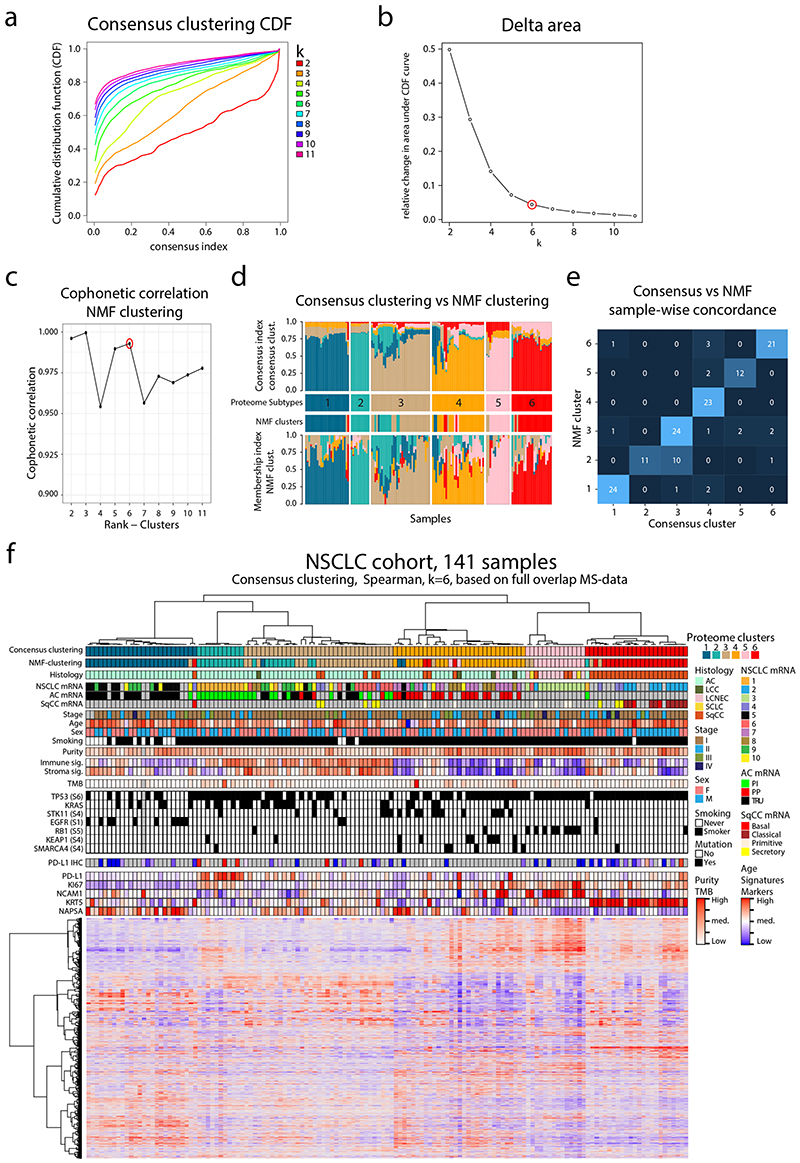
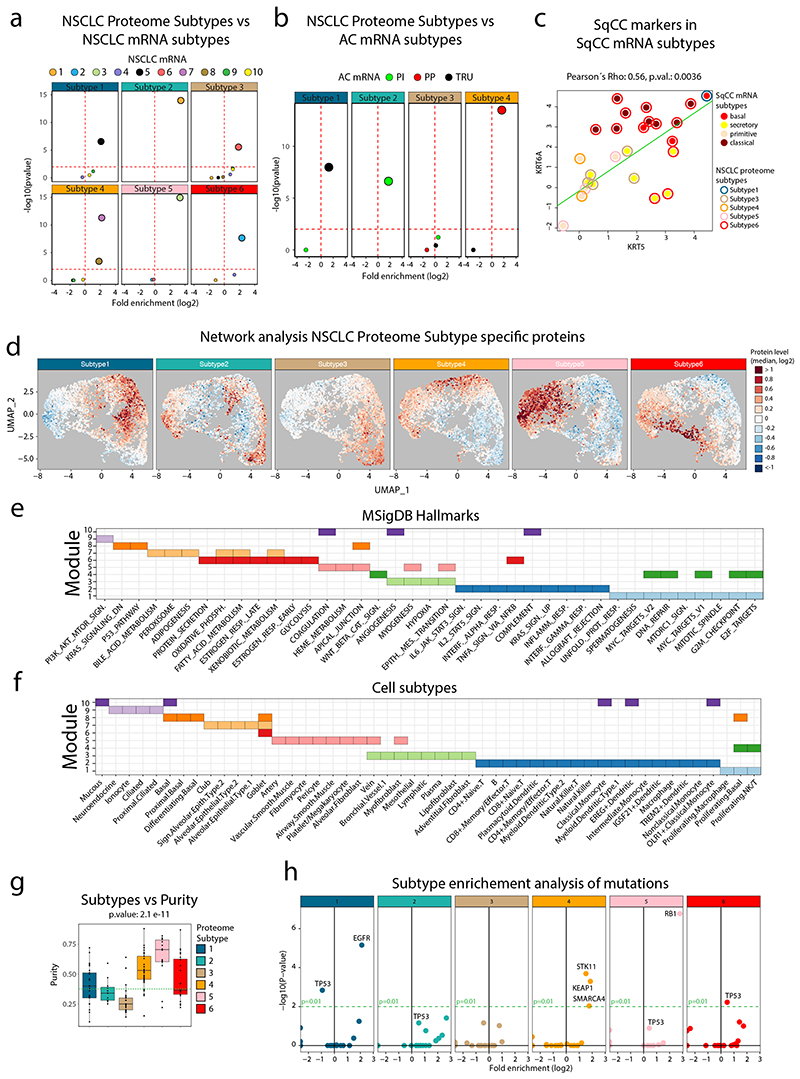
For proteome-level molecular subtyping of NSCLC consensus clustering was performed resulting in six distinct clusters (Figure 1c, Extended Data Figure 1), hereinafter, referred to as (proteome) Subtypes 1–6. To evaluate the robustness of these subtypes we also performed NMF clustering13, indicating only minor differences in sample clustering (Extended Data Figure 1). Subtype 1–4 samples were primarily AC (77–100%), Subtype 5 samples LCNEC (64%), and Subtype 6 samples SqCC (96%), and both SCLC samples grouped together with LCNEC samples as expected due to neuroendocrine lineage origin. Further, never-smokers were enriched in Subtype 1 while evaluation of sex, tumor stage, and age distribution did not reveal any specific enrichment patterns (Supplementary Figure 1a-e). A previous subtyping of the current NSCLC cohort based on mRNA-level analysis10 revealed ten different subtypes showing a partial overlap with the six proteome subtypes identified here (Figure 1c, Extended Data Figure 2a). Subtyping performed by The Cancer Genome Atlas (TCGA) network based on mRNA expression for AC specifically identified three expression subtypes; terminal respiratory unit (TRU); proximal-inflammatory (PI); and proximal proliferative (PP)2. Classification of the AC samples in the current cohort into these three subtypes based on RNA-level data revealed that Subtype 1 consisted primarily of TRU samples, Subtype 2 of PI samples, and Subtype 4 of PP samples (Figure 1c, Extended Data Figure 2b). Importantly, Subtype 3 did not show enrichment of any previous AC mRNA subtype. SqCC mRNA expression subtypes (“classical”, “primitive”, “secretory”, and “basal”) have also been described by the TCGA network1. Interestingly, all “classical” SqCC samples (9/9) in our analysis are found in Subtype 6, while “primitive” are found in Subtype 5 (3/5) or Subtype 4 (2/5), and 5/8 of the “secretory” in Subtype 3 (Figure 1c). SqCC samples clustering outside of Subtype 6 (12/35) commonly also express lower levels of SqCC markers (KRT5 and KRT6A), indicating that these cancers may be more atypical SqCC (Extended Data Figure 2c). Recently, a proteomics-based subtyping was reported for SqCC, with 4,880 proteins identified in at least 90% of samples where consensus clustering indicated three subtypes termed “Inflamed” (40% of samples), “Redox” (47%) and “Mixed” (13%)4. Analysis in relation to mRNA expression subtypes showed that the “Redox” subtype consisting primarily of “classical” samples, while “secretory” and “basal” samples spread out over “Inflamed” and “Mixed” subtypes and “primitive” samples distributed evenly over all three proteome subtypes4. Based on this, we conclude that Subtype 6 defined here most closely parallels the “Redox” SqCC proteome subtype defined by Stewart et al.
For a broad phenotypic characterization of the NSCLC proteome subtypes we performed a network analysis (Figure 1d, Extended Data Figure 2d-f) based on protein-level differences identified using DEqMS14 (Supplementary Figure 2, Supplementary Table 3). This analysis indicated subtype separation based on cell types and cell signaling with clear immune infiltration in Subtypes 2 and 3 and stromal component in Subtype 3, also supported by signature analysis using the ESTIMATE method15 (Figure 1c). These results agreed with the cell composition evaluation, as Subtypes 2 and 3 showed the lowest tumor cell content (“purity”, Extended Data Figure 2g). Further, the network analysis indicated the highest proliferation in Subtype 5, and the lowest in Subtype 1, which was supported by Ki67 levels as measured by MS (Figure 1c).
Panel sequencing confirmed previously reported mutation patterns in NSCLC and revealed enrichment of EGFR mutations in Subtype 1; STK11, KEAP1 and SMARCA4 in Subtype 4; RB1 mutations in Subtype 5 and TP53 mutations in Subtype 6 (Extended Data Figure 2h, Supplementary Figure 3, Supplementary Table 2). Further, the mutation patterns agree with the phenotype-level network analysis as E2F1/MYC signaling and RB1 mutations were enriched in Subtype 5, metabolism and STK11 mutations in Subtype 4, and both p53 signaling and TP53 mutations in Subtype 6. Interestingly, all three SqCC samples in Subtype 5 harbored RB1 mutations, and the only LCNEC sample outside of Subtype 5 was mutated for both STK11 and KEAP1 and grouped with Subtype 4. This indicates that the NSCLC Proteome Subtypes capture dominant molecular cancer phenotypes related to driver signaling pathways notwithstanding the formal histological classification.
2. Cancer- and driver-related proteins
To associate proteome-level information to known cancer-associated genes, we defined a list of 951 “Cancer- and Driver-Related Proteins” (CDRPs), 832 of which were quantified in the NSCLC cohort (Supplementary Figure 4, Supplementary Table 4). Out of these CDRPs, 291 showed outlier levels (defined here as extreme level, i.e., sample protein level > 3-fold up or down compared to cohort median, Supplementary Figure 4) in at least one sample, 85% of the samples showed outlier expression of at least one oncogene, and 26% of at least five. Subtype 5 showed the highest number of overexpressed oncogenes per sample (Figure 1e), commonly including the transcriptional activator MYB. Of the AC-enriched subtypes (Subtypes 1–4), Subtype 4 showed the highest number of overexpressed oncogenes per sample with common overexpression of the receptor tyrosine kinase RET (Supplementary Figure 5). Further, the analysis revealed overexpression of known NSCLC drivers such as EGFR, ERBB2, and KRAS, but also of oncogenes not commonly implicated in NSCLC such as the oncogenic kinase SGK1 (Figure 1f, Supplementary Figure 5).
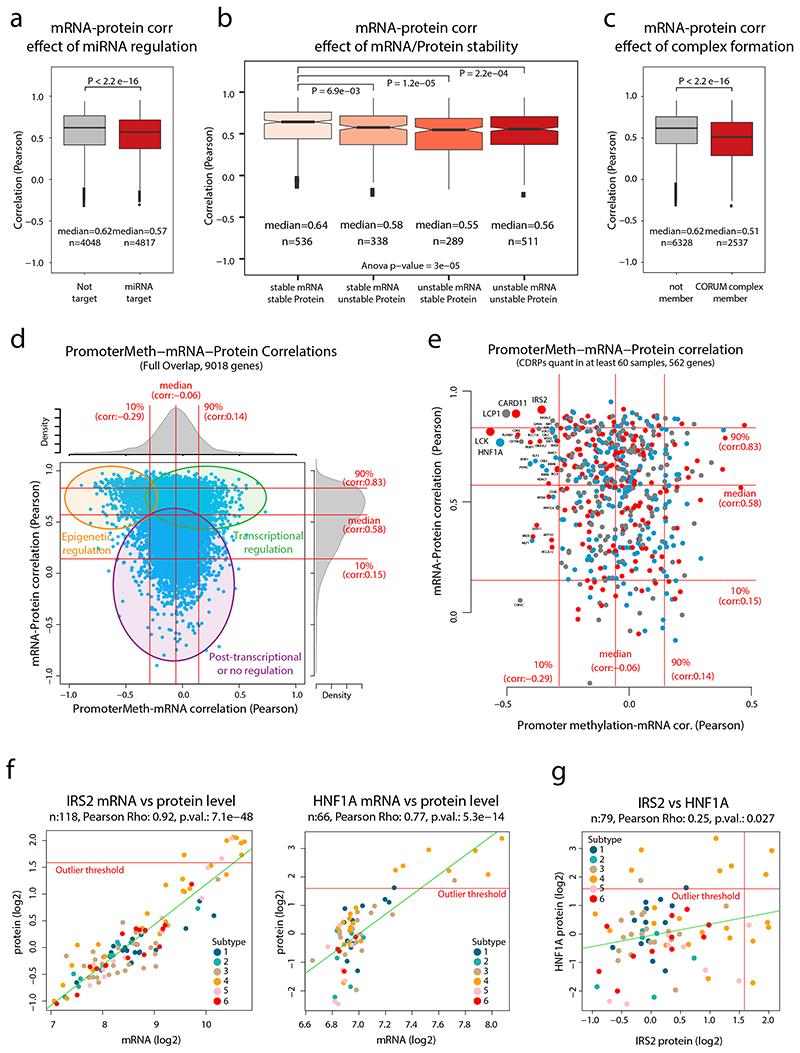
Overall, the mRNA-protein correlation for the majority of CDRPs with outlier expression was high, however, for a subset of CDRPs mRNA levels poorly explained the protein levels (Figure 1g). As contributing causes for this, we noted significantly lower mRNA-protein correlation for known miRNA targets16, known protein complex members17 as well as mRNAs and proteins with low stability18 (Extended Data Figure 3a-c). For example, the analysis pointed out a lack of mRNA-protein correlation for HMGA2 (regulation by the let-7 microRNA19), MUC4 (degraded via hypoxia-induced autophagy20), IRS4 (oncogenic driver in breast cancers21), and E2F1 (regulated by the ubiquitin-proteasome system22, Supplementary Figure 6). Interestingly, E2F1 protein levels were specifically elevated in Subtype 5 samples, suggesting that E2F1 degradation was reduced specifically in this subtype. Elevated E2F signaling in Subtype 5 was also identified by the network analysis (Figure 1d).
The analytical depth of our MS-analysis, together with supporting genome-wide transcriptomics and methylation data allowed evaluation of gene regulation levels. Plotting the promoter methylation-mRNA correlation against mRNA-protein correlation indicated genes likely to be epigenetically regulated, transcriptionally regulated, and post-transcriptionally regulated (Extended Data Figure 3d-e, Supplementary Table 5). This analysis indicated several CDRPs potentially regulated epigenetically (significant negative methylation-mRNA and positive mRNA-protein correlation) such as LCK, HNF1A, LCP1, CARD11 and IRS2 (Figure 1h). LCK, LCP1, and CARD11 all showed modestly higher mRNA and protein levels in more immune-infiltrated subtypes (Subtypes 2 and 3, Supplementary Figure 6), consistent with blood cell- and lymphoid tissue-specific expression as indicated in the Human Protein Atlas (www.proteinatlas.org). IRS2 and HNF1A, on the contrary, showed outlier expression in a subset of Subtype 4 samples (Extended Data Figure 3f). IRS2 is an insulin receptor substrate, methylation of this gene is associated with high fasting insulin levels, indicating epigenetic control of IRS2 23. HNF1A is a liver-specific transcription factor that is a master regulator of metabolism, mutations in this gene are one of the most common causes of Maturity Onset Diabetes of the Young (MODY)24. Interestingly, overexpression of these two proteins occurred in different cases, suggesting that sample-specific altered epigenetic control of different metabolic genes occurs in Subtype 4 (Extended Data Figure 3g).
3. Immune landscape of NSCLC Subtypes
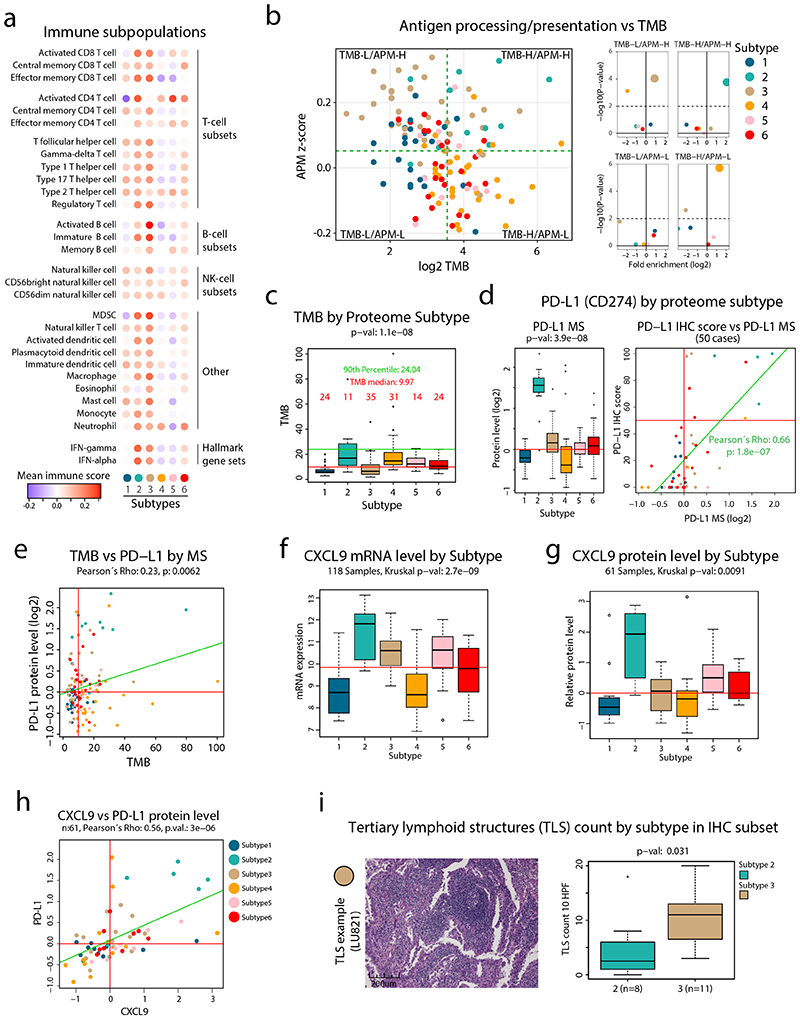
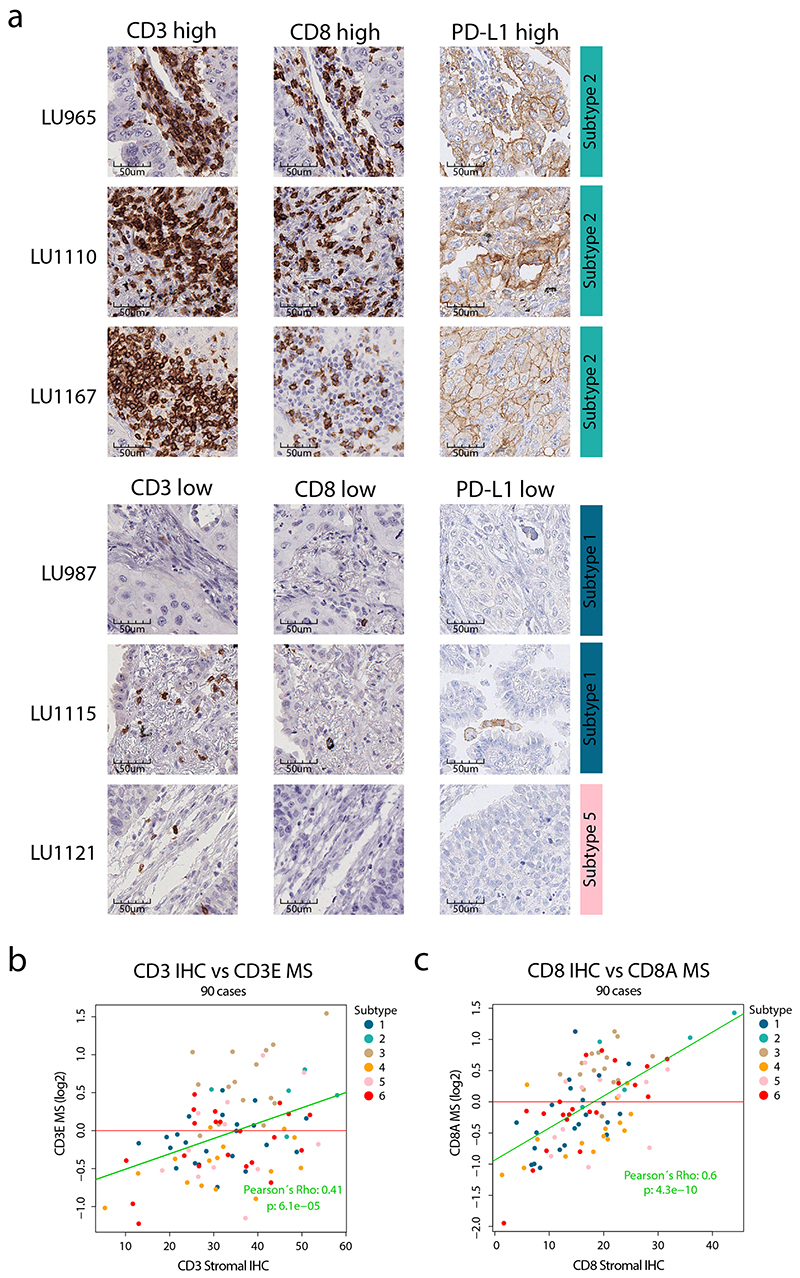
To evaluate the infiltrating immune cell subpopulations in the cohort samples, we applied previously described immune signatures25 to our MS-data. This analysis confirmed the overall high immune infiltration in Subtypes 2 and 3 samples. In particular, there was high signal for T-cells and IFN signaling in Subtype 2, and for B-cells in Subtype 3, suggesting a differential immune response in these two subtypes (Figure 2a, Supplementary Figure 7). CD3 and CD8A immunohistochemistry (IHC) was performed on a subset of cases and showed correlation between MS data and stromal staining (Extended Data Figure 4, Supplementary Table 1). In contrast, Subtype 4 had very low signals for all immune cell subpopulations, indicating an overall immune-cold subtype. Next, we investigated antigen processing and presentation machinery (APM, Supplementary Figure 8) in relation to tumor mutation burden (TMB, Supplementary Figure 9) to evaluate the potential of neoantigen-dependent immune cell activation as recently performed for endometrial carcinoma26. This analysis indicated that Subtype 2 samples were associated with both high TMB and APM, while Subtype 3 showed high APM but low TMB, and Subtype 4 high TMB but low APM (Figure 2b-c). Subtype 2 thus fulfils the requirements to elicit a strong immune activation as high TMB and APM would suggest production of neoantigens that are also presented. Interestingly, the subtype marker analysis revealed PD-L1 as one of the clearest marker proteins of Subtype 2 (Figure 2d-e, Extended Data Figure 4), suggesting that targeting the PD-L1/PD-1 immune checkpoint would be efficient in these patients. In addition, Subtype 2 showed the highest mRNA and protein levels of the chemokine CXCL9 that was described as one of the strongest predictors of immune checkpoint response in a recent meta-analysis of clinical studies across different cancer types27 (Figure 2f-h).
Figure 2. Immune landscape in NSCLC.
a. Overview of infiltrating immune cell subpopulations for each NSCLC proteome subtype. b. Scatter plot showing antigen processing/presentation machinery (APM) scores vs tumor mutation burden (TMB) for each sample. Dotted lines indicate subdivision of the samples into four subgroups: TMB-Low/APM-High, TMB-High/APM-High, TMB-Low/APM-Low, TMB-High/APM-Low as described in methods. Right side panels show for each subgroup enrichment analysis of NSCLC proteome subtypes. Y-axes denote enrichment p-values calculated using two-sided Fisher’s exact test with Benjamini-Hochberg adjustment. c. Boxplots indicating TMB by proteome subtype in tumor mutation burden (TMB) analysis in NSCLC cohort (n = 139 samples). Red line, TMB median; green line, TMB 90th percentile. d. Boxplot indicating protein levels (n = 141 samples) of PD-L1 by proteome subtype based on MS-data (left). Right figure shows the result of PD-L1 immunohistochemistry (IHC) vs MS analysis for a subset of the samples (n = 50 samples). e. Scatterplots indicating TMB vs PD-L1 protein level quantified by MS (n = 139 samples). f. Boxplots indicating the mRNA levels of the cytokine CXL9 by proteome subtype (n = 118 samples). g. Boxplots indicating the protein levels of the cytokine CXL9 by proteome subtype (n = 61 samples). h. Scatter plot indicating the protein levels (n = 61 samples) of CXCL9 and CD274 (PD-L1). i. IHC analysis of tertiary lymph node structures (TLSs) in selected subtype 2 and 3 samples (n = 19 samples). For scatter plots (d, e, and h): Samples are colored by proteome subtype and a linear regression trendline is displayed in green. The associated Pearson’s correlation coefficients (Rho) and two-sided p-values from t-distribution with n − 2 degrees of freedom are provided. For boxplots: middle line, median; box edges, 25th and 75th percentiles; whiskers, most extreme points that do not exceed ±1.5 × the interquartile range (IQR). P-values were calculated by Kruskal-Wallis test (c, d, f, and g) or two-sided Wilcoxon rank-sum test (i). Dunn’s multiple comparison tests with Benjamini-Hochberg adjustment for boxplots are available in Supplementary Table 3.
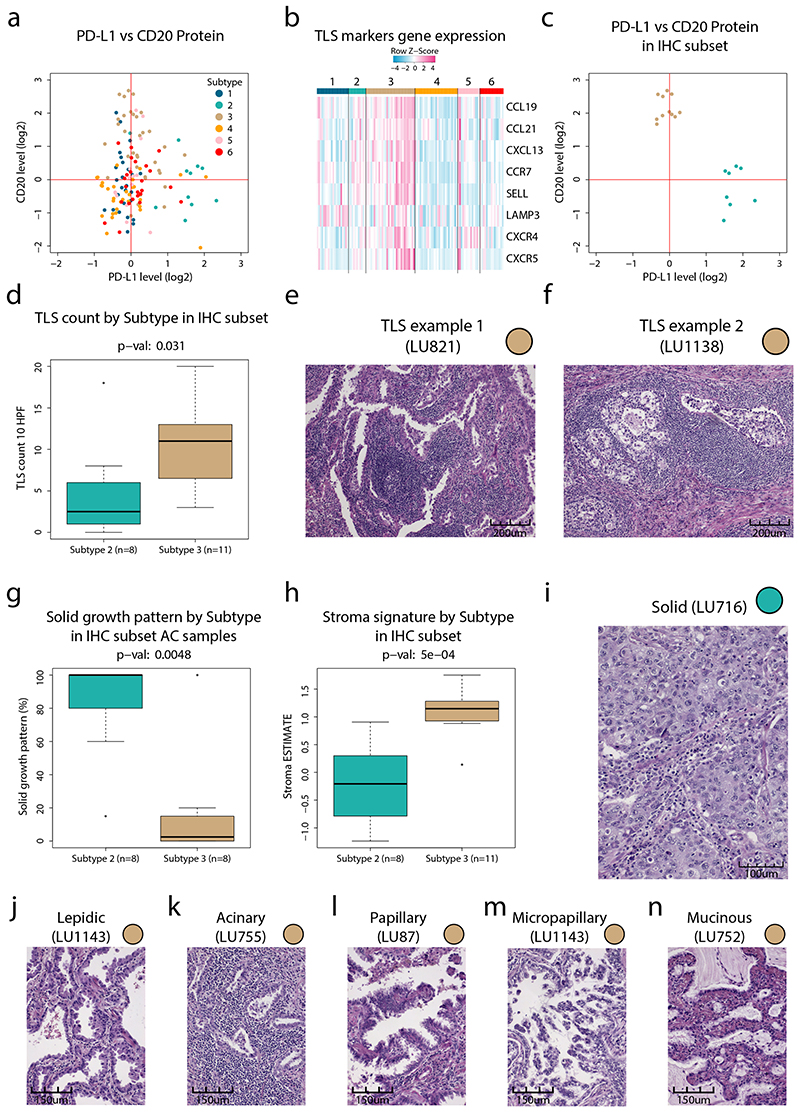
The immune landscape evaluation suggested high infiltration of B-cells in Subtype 3 samples, and in addition we noted a dichotomy between the expression of B-cell markers and the expression of PD-L1 (Extended Data Figure 5a). B-cell rich tertiary lymphoid structures (TLSs) have previously been shown associated with good prognosis28 and response to immunotherapy29. An evaluation of TLS markers based on mRNA-level analysis as previously described29 indicated high expression in a subset of Subtype 3 samples (Extended Data Figure 5b). To investigate this further we evaluated tumor sections from a subset of the samples with either high levels of PD-L1 (Subtype 2) or B-cell markers (Subtype 3, Extended Data Figure 5c). This analysis supported the presence of TLSs in Subtype 3 (Figure 2i, Extended Data Figure 5d-f), but also indicated differences in predominant growth patterns between AC samples in Subtypes 2 and 3 (Supplementary Table 6). While Subtype 2 samples almost exclusively showed a solid growth pattern with low stromal component, Subtype 3 samples showed variable degrees of lepidic, acinary, papillary, micropapillary, mucinous, and solid growth patterns (Extended Data Figure 5g-n). Overall, these results emphasize that while both Subtypes 2 and 3 samples are infiltrated by immune cells, the type of infiltrating immune cells and the AC growth pattern is strikingly different.
4. Tumor neoantigen burden in NSCLC
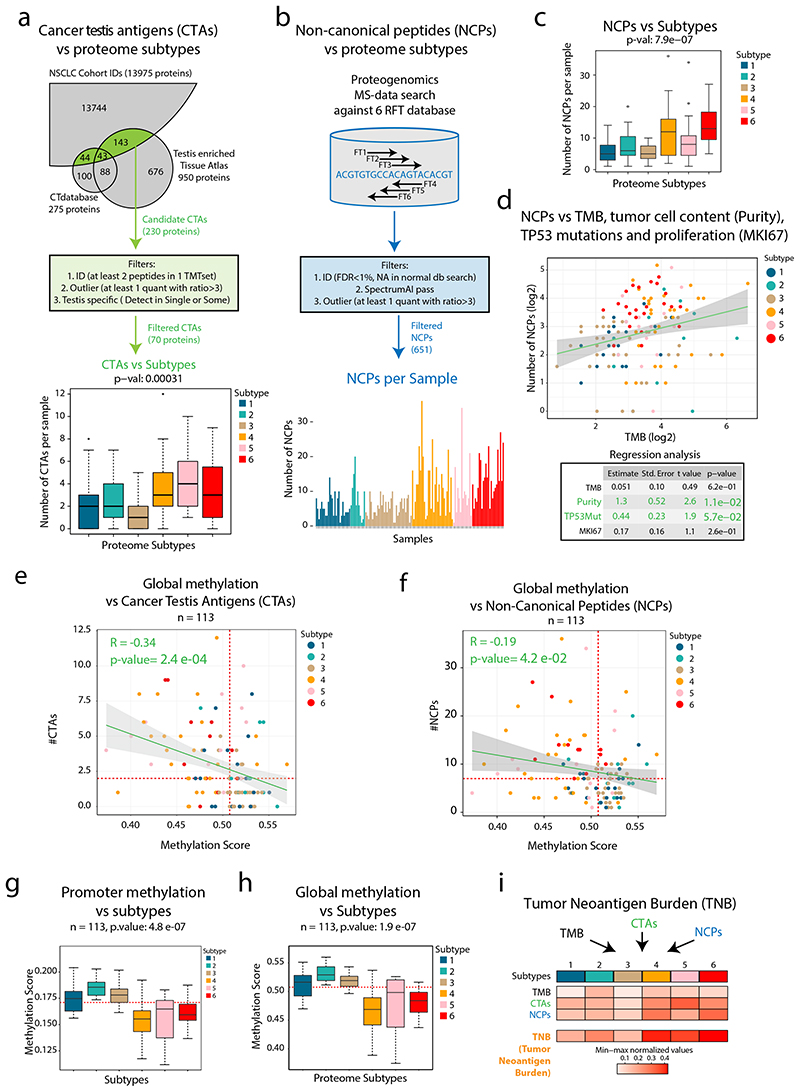
Apart from mutations, aberrant transcription of cancer testis antigens (CTAs) and of DNA sequences not expected to produce proteins at all, such as pseudogenes or endogenous retroviral (ERV) elements, could also produce neoantigens and elicit an immune reaction against the cancer cells30–33. These so-called “non-canonical”, “alternative”, or “aberrantly expressed” structures will be referred to here as non-canonical proteins/peptides (NCPs). Out of 230 CTAs (CTdatabase34 or annotated as testis-enriched in www.proteinatlas.org) identified at the protein level in the current cohort, 70 were identified with at least 2 unique peptides and showed outlier expression pattern (sample protein level > 3-fold up compared to the cohort median) and were evaluated further. Intriguingly, the expression of CTAs was found to be higher in the immune-cold subtypes (Subtype 4–6, Figure 3a, Supplementary Figure 10).
Figure 3. Cancer-Testis (CT) antigens, neoantigen burden and methylation in NSCLC.
a. Overview of cancer testis antigen (CTA) evaluation in NSCLC. Bottom part shows boxplot indicating the number of CTAs expressed per sample by proteome subtype (n = 141 samples). b. Overview of proteogenomic analysis by 6-reading frame translation (6FT) database searching. Lower part shows bar plot indicating the number of identified NCPs per sample (n = 141 samples). c. Boxplot indicating the number of non-canonical peptides (NCPs) per sample by proteome subtype (n = 141 samples). d. Scatter plot (top) showing the number of NCPs per sample vs TMB (n = 139 samples) and output from a multivariate linear regression analysis (bottom) between the number NCPs and TMB, tumor cell content (“purity”), TP53 mutations and proliferation (Ki67 quantified by MS) (n = 139 samples). e-f. Scatter plot indicating the global methylation plotted against the number of CT antigens per sample or the number of NCPs per sample (n = 113 samples). g-h. Boxplots indicating the global and promoter methylation by proteome subtype (n = 113 samples). i. Heatmap showing Tumor Neoantigen Burden (TNB) by proteome subtype where TNB is defined as a summary score based on TMB, CTAs and NCPs. In figures e, f, g, and h, red dotted lines indicate median values and the number of samples with quantitative information at both methylation and protein level is provided. For scatter plots d, e, and f: Samples are colored by proteome subtype. The number of samples with quantitative information at both methylation and protein level is provided and a linear regression trendline is displayed in green. 95% confidence intervals are shown in grey. The associated Pearson’s correlation coefficients (Rho) and two-sided p-values from t-distribution with n − 2 degrees of freedom are provided. For boxplots a, c, g, and h: middle line, median; box edges, 25th and 75th percentiles; whiskers, most extreme points that do not exceed ±1.5 × the interquartile range (IQR). P-values were calculated by Kruskal-Wallis test. Dunn’s multiple comparison tests with Benjamini-Hochberg adjustment for boxplots are available in Supplementary Table 3.
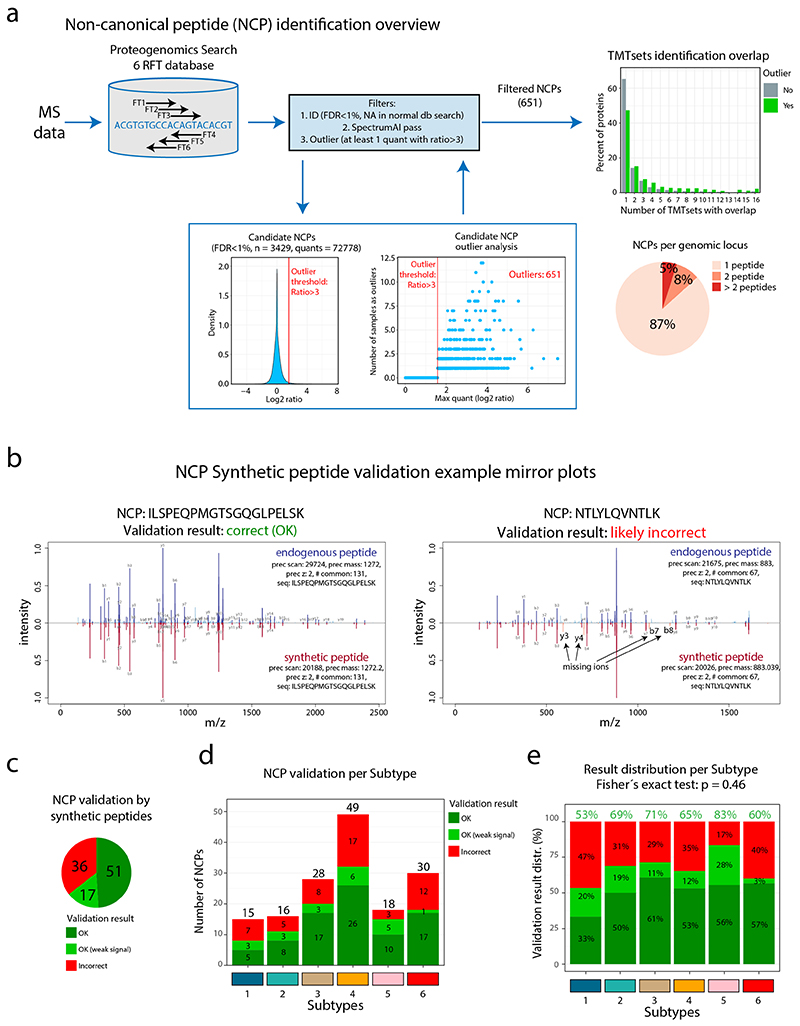
Next, for an unbiased evaluation of NCPs, we performed proteogenomic analysis by searching MS-data against a peptide database produced by 6-reading frame translation (6FT) of the entire human genome as previously described8,9 (Figure 3b, Extended Data Figure 6a). Following the same outlier expression pattern as in CT antigens (FC > 3), we identified 651 NCPs (class-specific FDR estimation<1%), with 13% of the corresponding genetic loci supported by more than one peptide (Supplementary Table 7). As the actual FDR is difficult to estimate in searches against large proteogenomic databases we evaluated the spectra of 105 NCPs by comparison to the spectra of the corresponding synthetic peptides (Supplementary Data 1), suggesting a false discovery rate of approximately 35%, not atypical of proteogenomics using very large search spaces (Extended Data Figure 6b-e). Interestingly, as in the case of CT-antigens, these complex NCP-antigens were detected in highest numbers in immunologically cold tumors (Subtypes 4 and 6, Figure 3b-c, Supplementary Figure 11a). Further, regression analysis suggested that the number of NCPs per sample was associated with tumor cell content (P = 0.011) and TP53 mutation (P = 0.057), but not to TMB or proliferation probed by Ki67 (Figure 3d).
Previous research has shown that global hypomethylation and promoter-specific hypomethylation is associated with CTA expression35. In our proteome-wide analysis, the number of identified CTAs per sample showed a significant negative correlation to both global methylation and promoter methylation, indicating that looser epigenetic control contributes to protein-level expression of CTAs in NSCLC (Figure 3e, Supplementary Figure 11b). Importantly, also the number of identified NCPs per sample showed negative correlation to global methylation (Figure 3f, Supplementary Figure 11c). Further, the analysis revealed significant differences between subtypes in global and promoter methylation (Figure 3g-h), with the lowest methylation found in Subtypes 4 and 6.
To evaluate the potential for activation of anti-cancer immune response more comprehensively, we evaluated TMB in relation to CTA and NCP expression in the NSCLC cohort and summarized these three metrices into a Tumor Neoantigen Burden (TNB) score (Figure 3i). This analysis indicates that while Subtype 2 has the highest TMB, Subtypes 4, 5, and 6 produce other types of neoantigens that could elicit a strong immune response given efficient presentation and infiltration of immune cells.
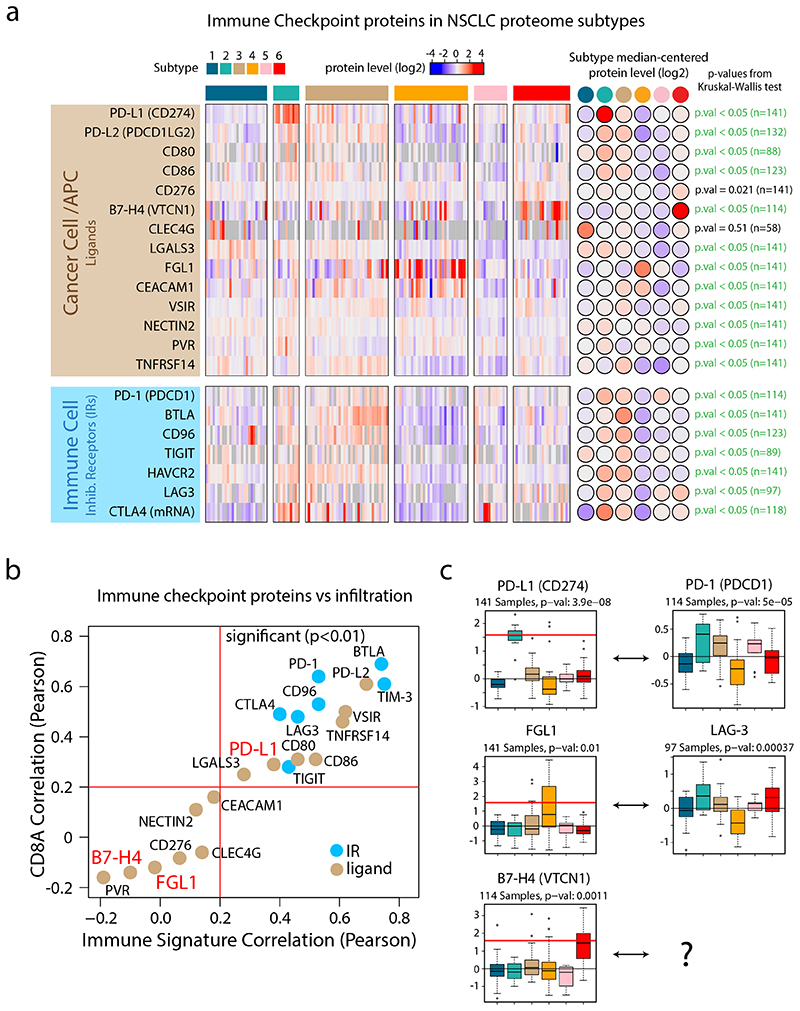
Next, we performed a systematic evaluation of immune checkpoints based on previously identified inhibitory receptors (IRs) and their corresponding ligands36,37 (Figure 4, Supplementary Figure 12). This analysis indicated that the protein levels of IRs in general correlated with infiltration of T-cells. IR ligands (expressed by cancer cells and APCs), on the contrary, showed more variable patterns, suggesting that different subtypes may use different immune evasion mechanisms. The most striking IR ligand expression was found for PD-L1 in Subtype 2, but intriguingly the analysis also revealed two other subtype-specific IR ligands, FGL1 in Subtype 4 and B7-H4 in Subtype 6 (Figure 4). FGL1 was recently identified as a tumor cell-secreted, high-affinity ligand to LAG3, causing FGL1-LAG3-mediated supression of T-cells38. B7-H4 acts as an immune checkpoint to prevent autoimmunity39, and targeting of B7-H4 reduces the tumor growth and the formation of lung metastases in CT26 mouse models40. Taken together, the immunophenotype, the neoantigen burden, and the checkpoint analyses show that the NSCLC proteome subtypes identified here may have predictive value for different types of checkpoint inhibitors already in clinical use, or investigated in clinical trials.
Figure 4. Immune Checkpoints in NSCLC proteome subtypes.
a. Heatmap indicating protein levels of inhibitory receptors (IRs) and their ligands. All values represent protein level quantifications (log2) except for CTLA4 where mRNA levels (log2) are displayed since it was not detected by the MS data. P-values were calculated using Kruskal-Wallis test. b. Scatter plot indicating the correlation between checkpoint proteins and overall immune infiltration signature (x-axis) vs the correlation between checkpoint proteins and CD8A as a marker of cytotoxic T-cells (y-axis). All values were estimated using protein-level quantifications (log2) except for CTLA4 where mRNA levels (log2) were used since it was not detected by the MS analysis. Red lines indicate significant Pearson’s correlation coefficient threshold (p-value < 0.01, two-sided, t-distribution with n − 2 degrees of freedom). c. Boxplots indicating protein levels of inhibitory receptors (IRs) and their ligands (n = 141 samples (PD-L1, FGL1), 114 samples (PD-1, B7-H4) and 97 samples (LAG-3)). The number of samples with quantitative information at protein level is provided. Red lines in boxplots, where present, indicate outlier expression threshold. P-values were calculated using Kruskal-Wallis test. Dunn’s multiple comparison tests with Benjamini-Hochberg adjustment for heatmap (a) and boxplots (c) are available in Supplementary Table 3.
5. STK11 inactivation and liver-specific signaling in Subtype 4
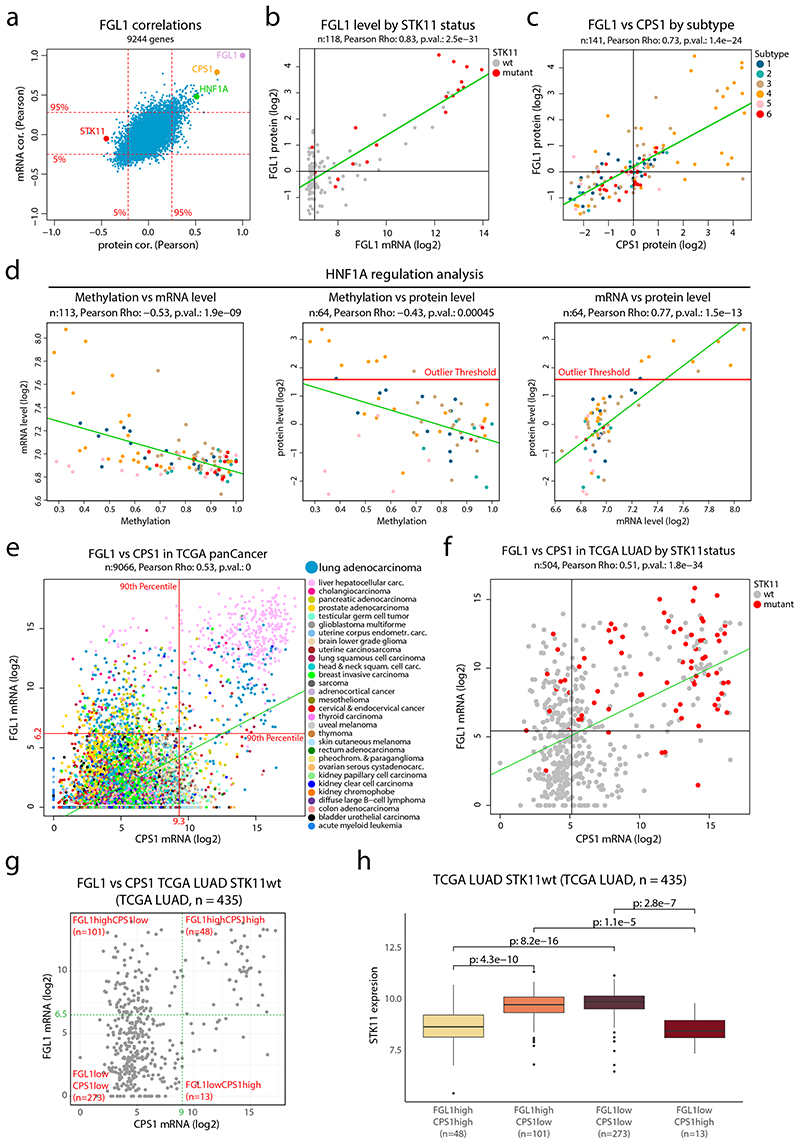
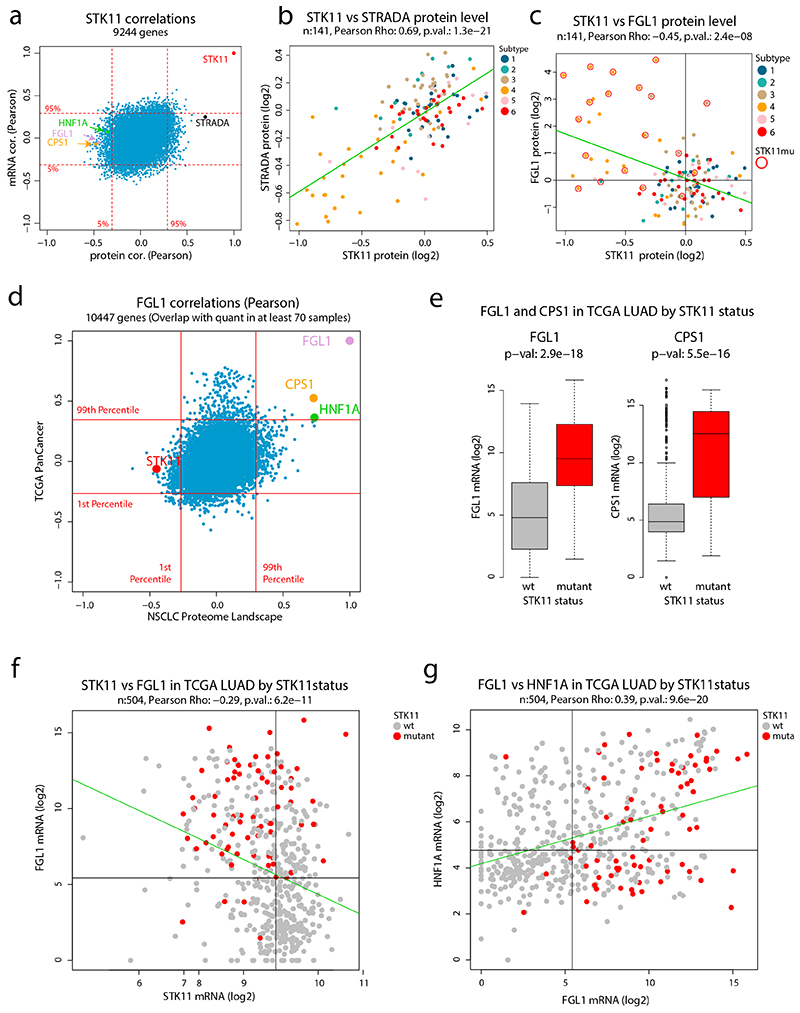
To investigate the mechanism behind FGL1 expression in Subtype 4, we performed a correlation analysis to identify FGL1-associated proteins and transcripts. This analysis showed a strong negative correlation between FGL1 and the tumor suppressor STK11/LKB1 at protein, but not mRNA, level, suggesting post-transcriptional regulation of STK11 (Figure 5a, Supplementary Figure 13a-b). STK11 forms a functional heterotrimeric complex with STRADα and CAB39 (MO25α)41, and in our data a stabilizing effect of this complex was supported as the correlation between STK11 and STRADα was much higher at protein level (0.69) than at the mRNA level (0.25, Extended Data Figure 7a-b). Further evaluation revealed a strong coincidence between STK11 mutation and high FGL1 protein and mRNA levels in Subtype 4 (Figure 5b, Extended Data Figure 7c).
Figure 5. FGL1 and STK11 status in NSCLC cohort and TCGA pan cancer data a.
FGL1 mRNA- and protein-level correlations in the NSCLC cohort for 9,244 genes with overlapping information at mRNA and protein level and quantitative protein level information in at least 70 samples. b. FGL1 mRNA expression plotted against the FGL1 protein level colored by STK11 mutation status (n = 118 samples). c. FGL1 and CPS1 protein levels in the NSCLC cohort colored by proteome subtype (n = 141 samples). d. Scatterplots for evaluation of HNF1A regulation showing promotor methylation vs mRNA level (n = 113 samples) (left), promotor methylation vs protein level (n = 64 samples) (center) and mRNA level vs protein level (n = 64 samples) (right) in NSCLC cohort colored by proteome subtype. e. CPS1 and FGL1 mRNA expression in the TCGA pan cancer dataset colored by cancer type (n = 9,066 samples). Indicated by red lines are the 90th percentiles of mRNA expression for both genes. f. CPS1 and FGL1 mRNA expression in the TCGA lung adenocarcinoma (LUAD) dataset colored by STK11 mutation status (n = 504 samples). Indicated by black lines is the median mRNA expression of both genes. g. Scatterplot showing CPS1 vs FGL1 mRNA levels of STK11wt samples in the TCGA LUAD dataset (n = 435 samples). Indicated in the figure are four expression subgroups, FGL1highCPS1high, FGL1highCPS1low, FGL1lowCPS1low, FGL1lowCPS1high (cut-offs arbitrarily chosen). f. Boxplot indicating the STK11 mRNA expression by expression subgroups as defined in (g) (n = 435 samples). Middle line, median; box edges, 25th and 75th percentiles; whiskers, most extreme points that do not exceed ±1.5 × the interquartile range (IQR). Two-sided Wilcoxon rank-sum tests uncorrected for multiple testing. For scatter plots b-f: linear regression trendline is displayed in green. The associated Pearson’s correlation coefficients (Rho) and two-sided p-values from t-distribution with n − 2 degrees of freedom are provided.
Intriguingly, the protein/mRNA with the highest correlation to FGL1 was CPS1, a mitochondrial urea cycle enzyme known to be upregulated in cancer through the AMPK-mTOR signaling pathway after inactivation of STK1142 (Figure 5a, c and Supplementary Figure 13c-d). FGL1 and CPS1 are normally only expressed in liver38,42, but our data suggests that STK11 inactivation results in transcriptional upregulation of both genes also in lung cancer. Evaluating the FGL1 mRNA/protein correlation analysis against transcriptions factors as annotated in the animalTF database43 indicated the liver-specific HNF1A as the highest correlating transcription factor (Figure 5a). Interestingly, as described above, HNF1A was also noted as a gene potentially regulated by epigenetic mechanisms in NSCLC which is common for tissue/lineage-specific genes (Figure 5d).
Further, gene expression data covering 31 different cancer types (TCGA PanCancer dataset44) supported a strong co-expression of FGL1, CPS1, and HNF1A but not correlation between FGL1 and STK11, as in our NSCLC data (Extended Data Figure 7d). Hepatocellular carcinoma samples showed high mRNA-levels of FGL1 and CPS1 as expected, but importantly also a subset of lung adenocarcinoma (Figure 5e). Further, both genes were significantly higher expressed in STK11-mutated AC cases, supporting that FGL1 and CPS1 transcription is controlled by STK11-dependent signaling (Figure 5f, Extended Data Figure 7e). STK11 wild-type lung adenocarcinoma with high mRNA expression of FGL1 and CPS1 showed reduced mRNA level of STK11, indicating that transcriptional or epigenetic regulation could contribute to STK11 inactivation (Figure 5g-h). Increased FGL1 and CPS1 mRNA levels and reduced STK11 mRNA expression was particularly evident in lung adenocarcinoma, suggesting cancer type-specific deregulation (Extended Data Figure 7f, Supplementary Figure 13e-f). Finally, FGL1 mRNA expression significantly correlated to HNF1A mRNA expression in lung adenocarcinoma (Extended Data Figure 7g).
6. HNF1A and FGL1 are controlled by STK11-AMPK in NSCLC
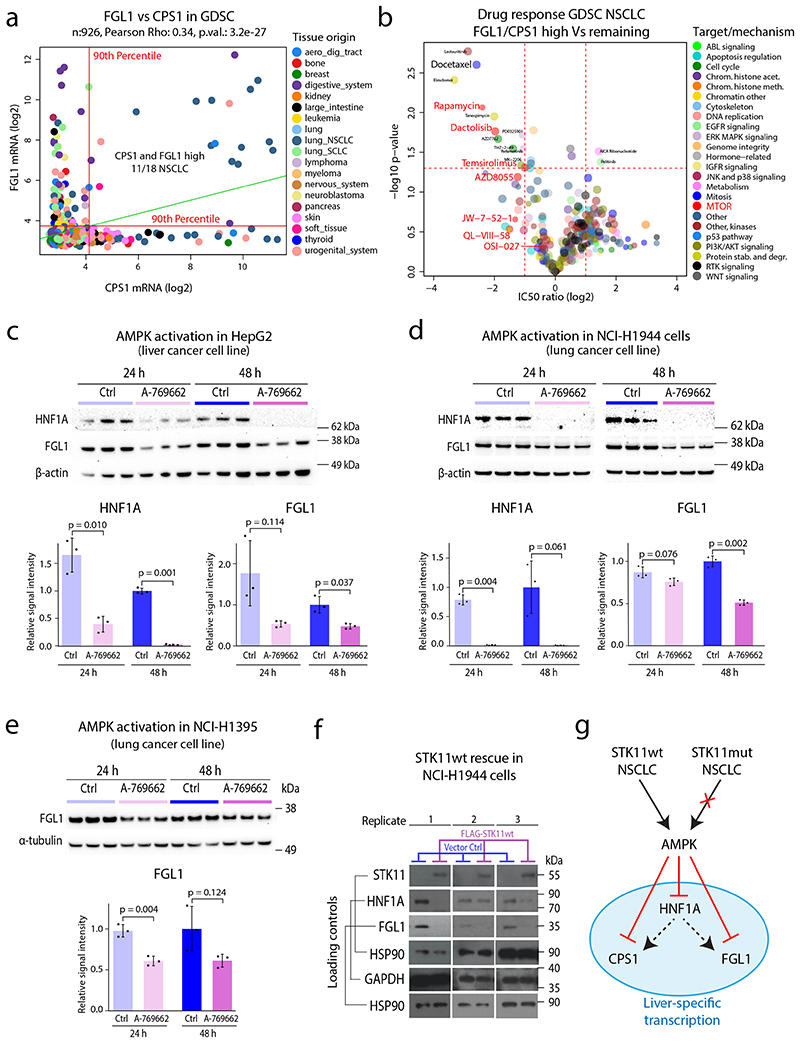
Analysis of the mRNA levels of FGL1 and CPS1 across 926 cell lines in the Genomics of Drug Sensitivity in Cancer (GDSC) project45 revealed co-expression specifically in a subgroup of NSCLC cell lines (Figure 6a). Focusing on NSCLC cell lines (n=109), we continued to evaluate differences in drug response between cell lines with high FGL1 and CPS1 expression (n=11) and the remaining cell lines (n=98) (Supplementary Figure 14a). This analysis revealed higher sensitivity of FGL1/CPS1-expressing cells to docetaxel, a chemotherapeutic agent commonly used in NSCLC, but strikingly also higher sensitivity to multiple compounds targeting mTOR signaling (Figure 6b, Supplementary Figure 14b-c). STK11 inhibits mTOR signaling through activation of AMPK, and in cancer cells with loss of AMPK activity, mTOR becomes an oncogenic driver46. Our results indicate that elevated FGL1/CPS1 levels is a solid indicator of loss of STK11-AMPK signaling, and as such a potential predictor of mTOR addiction in this group of lung adenocarcinoma. Importantly, STK11 mutation alone could not predict sensitivity to mTOR inhibitors, again indicating alternative STK11 inactivation mechanism and highlighting the need of phenotype-level information for a more comprehensive understanding of pathway activity (Supplementary Figure 14d).
Figure 6. Co-expression of FGL1 and CPS1 predicts sensitivity to docetaxel and mTOR inhibitors and mechanism investigation of STK11-FGL1 signaling.
a. CPS1 and FGL1 mRNA expression in the GDSC dataset colored by cell line tissue origin. Indicated by red lines are the 90th percentiles of mRNA expression for both genes (n = 926 cell lines). Linear regression trendline is displayed in green. The associated Pearson’s correlation coefficient (Rho) and two-sided p-value from t-distribution with n − 2 degrees of freedom are provided. b. Volcano plot indicating differences in drug sensitivity between NSCLC cells with high mRNA expression of CPS1/FGL1 vs remaining NSCLC cells. Indicated in the plot is docetaxel and several drugs targeting mTOR. P-values were calculated by two-sided Welch’s t-test uncorrected for multiple testing. c. HNF1A and FGL1 levels in HepG2 cells after 24 and 48 h treatment with an AMPK activator (250 μM A-769662). The densitometric values were normalized to α-actin and then to the 48-h control mean and are represented as mean ± SD (n = 3 independent cell cultures). The p-values were calculated using Welch’s two-sided t-test. d. HNF1A and FGL1 levels in STK11-mutant NCI-H1944 cells after 24- and 48-h treatment with an AMPK activator (250 μM A-769662). The densitometric values were normalized to β-actin and then to the 48-h control mean and are represented as mean ± SD (n = 3 independent cell cultures). The p-values were calculated using Welch’s two-sided t-test. e. FGL1 levels in STK11-mutant NCI-H1395 cells after 24 and 48 h treatment with an AMPK activator (250 μM A-769662). The densitometric values were normalized to β-tubulin and then to the 48-h control mean and are represented as mean ± SD (n = 3 independent cell cultures). The p values were calculated using Welch’s two-sided t-test. f. STK11, HNF1A, and FGL1 levels in NCI-H1944 cells expressing FLAG-STK11wt or vector control after retroviral transduction. The Western blots show results from three separately transduced cell cultures. g. Model showing the suggested impact of STK11 inactivation in lung cancer cells. STK11 inactivation by e.g., mutation results in loss of AMPK dependent control over liver-specific transcription resulting in upregulation of HNF1A, FGL1, and CPS1. HNF1A is a known master regulator of liver specific transcription and potentially responsible for transactivation of FGL1 and CPS1.
Treatment of HepG2 cells (liver cancer) with the AMPK activator A-769662 for 24 and 48 h resulted in reduced levels of HNF1A and FGL1 as evaluated by Western blot analysis (Figure 6c). Importantly, the same effect of AMPK activation on HNF1A and FGL1 levels was detected in STK11-mutated (mut) lung cancer cell lines, NCI-H1944 and NCI-H1395 (Figure 6d-e, HNF1A not detected in NCI-H1395). Finally, we validated the role of STK11 signaling in a rescue experiment by introducing wild-type (wt) STK11 in NCI-H1944 cells (Figure 6f). Re-expression of this tumor suppressor was poorly tolerated by the cells, nevertheless three replicate experiments showed that STK11wt protein expression was associated with loss of both FGL1 and HNF1A. Thus, our analysis shows that STK11 inactivation in lung cancer results in loss of AMPK dependent control of downstream signaling, leading to upregulation of several liver specific genes including the transcription factor HNF1A, FGL1, and CPS1 (Figure 6g). Further, our analysis indicates that this signaling aberration is a feature of Subtype 4 that together with overactivation of mTOR signaling, potentially contributes to both immune evasion and cancer growth.
7. DDA- and DIA-based classification of NSCLC Subtypes
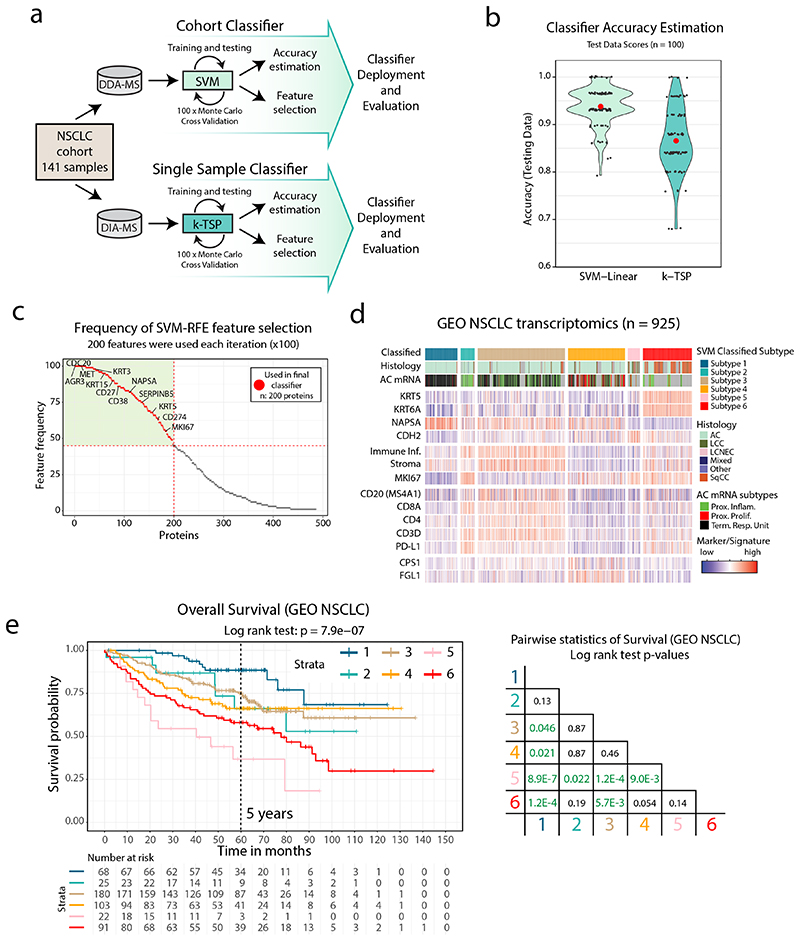
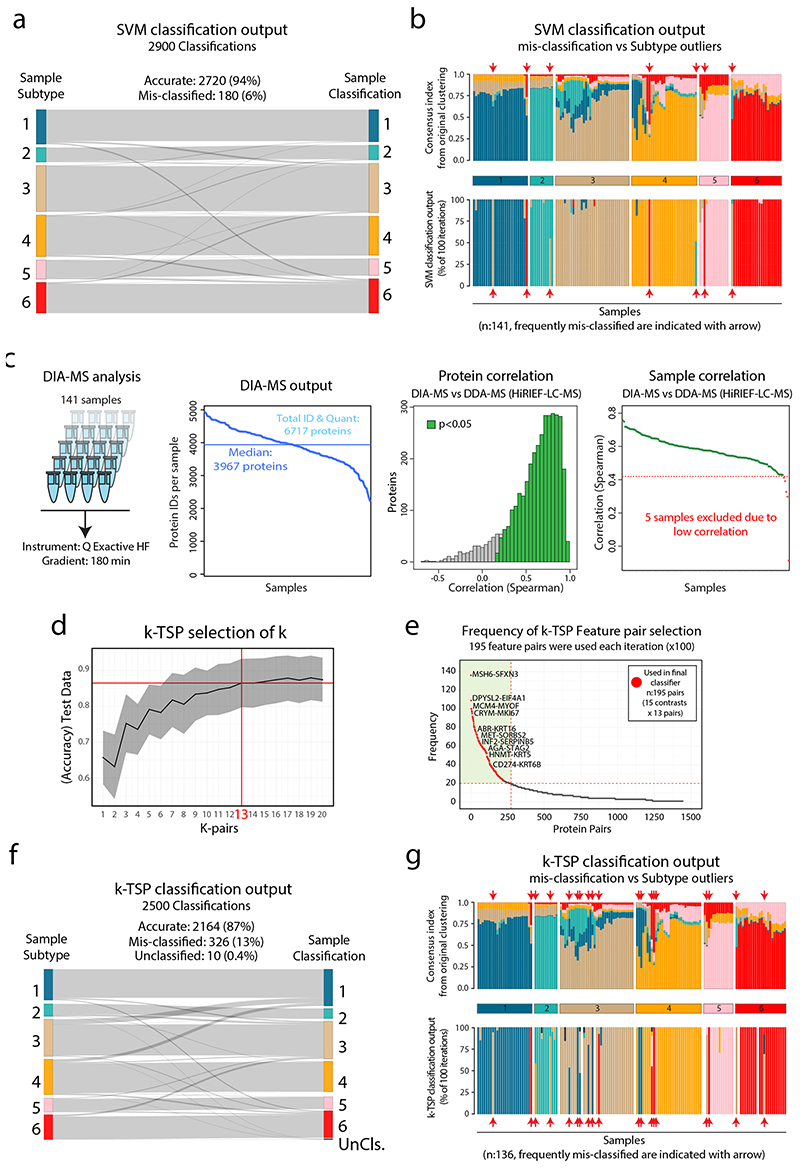
Our analysis above indicated clinical value of the NSCLC proteome subtypes presented here. To enable knowledge transfer into a clinical setting, we developed two NSCLC classification pipelines: one support vector machine (SVM)-based for classification of sample cohorts, and one k-Top Scoring Pairs (k-TSP)-based for single-sample classification (Figure 7a, Supplementary Figure 15a). The SVM classifier was optimized by Monte Carlo cross-validation (100 iterations) indicating consistently high accuracy (average: 94%, Figure 7b) and an overlap in selected feature sets (Figure 7c, Supplementary Table 8). Misclassifications were sparse (6%, Extended Data Figure 8a) and mostly restricted to samples with ambiguity in the consensus index analysis generated during the original clustering of the 141 samples, indicating that the samples were cluster outliers (Extended Data Figure 8b).
Figure 7. NSCLC classification pipelines validate NSCLC proteome subtypes and indicate clinical utility a.
Overview of NSCLC Proteome Subtype classification pipelines. b. Violin plot indicating the accuracy of the SVM classifier and the k-TSP classifier based on test data output from Monte Carlo cross-validation (MCCV) iterations. Median accuracy is shown in red. c. Scatterplot showing SVM classifier feature importance evaluated by the frequency each feature was used across the MCCV iterations. Indicated by dotted red lines is the lowest feature frequency for the 200 features that were selected for the final classifier. d. SVM-based classification of the GEO NSCLC cohort based on mRNA-level data. Indicated below each subtype is sample annotation by histology, mRNA subtype and marker/signature levels. e. Kaplan-Meier plot showing overall survival in the GEO NSCLC cohort by classified subtype (n = 489 samples) with associated pairwise statistics as calculated by log-rank test with Benjamini-Hochberg adjustment.
For the k-TSP single-sample classifier, we first re-analyzed the NSCLC cohort using rapid label-free, data-independent acquisition (DIA)-based MS analysis. As expected, due to limited MS time per sample, the proteome coverage in the DIA analysis (6,717 proteins identified, median 3,967 IDs per sample, FDR<1%) was less comprehensive, but importantly showed overall high correlation to the original DDA data (Extended Data Figure 8c, Supplementary Table 2). The k-TSP classifier uses quantitative information from a set of protein pairs measured in a single sample for classification (Extended Data Figure 8d, Supplementary Figure 15b). The k-TSP classifier was optimized as the SVM classifier and resulted in high accuracy (average: 87%, Figure 7b, Extended Data Figure 8d-f, Supplementary Figure 15b), and feature pair overlap between iterations (Supplementary Table 8). Misclassifications spread out between subtypes, largely overlapping with subtype outliers as indicated by the consensus index (Extended Data Figure 8g).
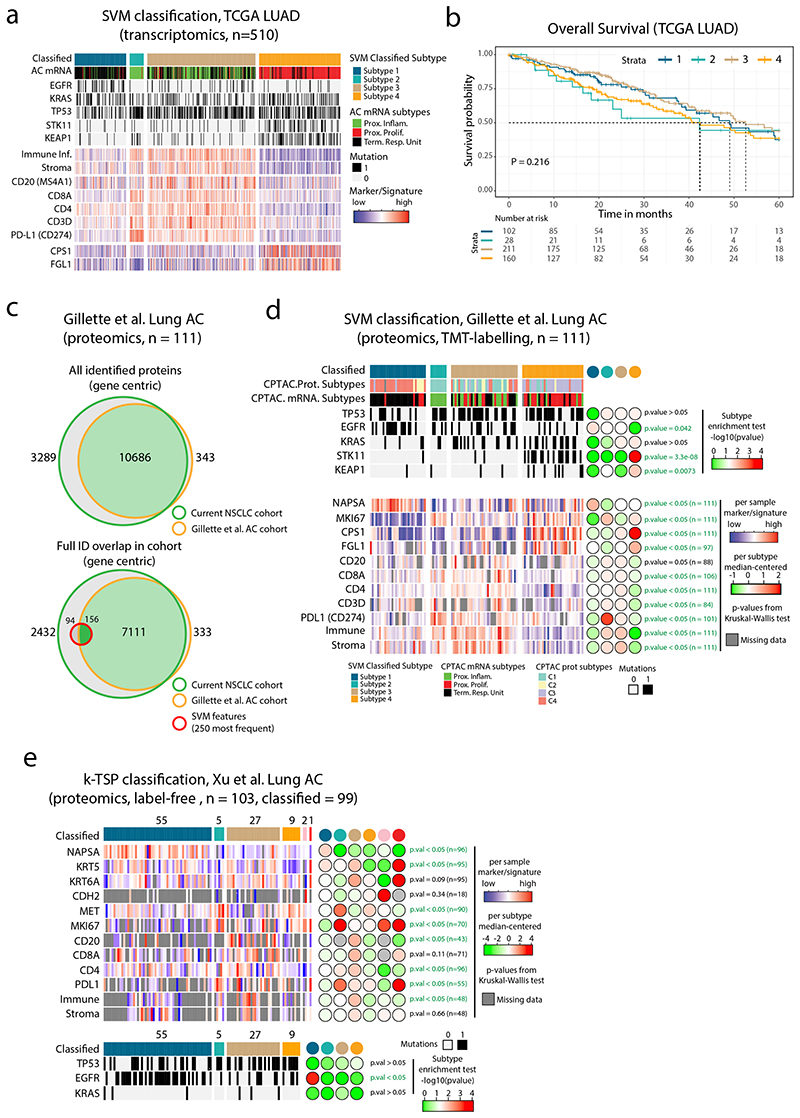
Due to the lack of previous datasets describing the NSCLC proteome across histology types, we validated the SVM classifier using a NSCLC transcriptomics meta-dataset (GEO NSCLC dataset47). Importantly, the classification of the GEO NSCLC cohort reproduced the six NSCLC proteome subtypes with highly similar characteristics in terms of subtype size, signature, and marker expression (Figure 7d). Notably, AC samples that were classified into Subtype 6, showed expression of SqCC markers (KRT5 and KRT6A) and lacked the AC marker Napsin A (NAPSA). The associated overall survival data indicated differences in prognosis between the classified subtypes, suggesting a predictive value of the NSCLC proteome subtypes (Figure 7e). Next, we used the TCGA lung AC transcriptomics dataset2 (TCGA-LUAD, n=510 samples), but as this dataset is restricted to AC, we re-trained the SVM classifier for the four AC enriched proteome subtypes (Subtypes 1–4). Again, SVM classification reproduced the 4 AC proteome subtypes in terms of subtype size, mutation enrichment pattern, signature, and marker expression (Extended Data Figure 9a), with a trend for poorer survival in Subtype 4, and better survival in Subtype 1 (Extended Data Figure 9b). This finding indicates that adjuvant therapy could be beneficial in Subtype 4. To further validate the proteome subtypes, we analyzed a recently published MS-dataset (TMT-labeled) for lung AC (Gillette et al.5). Overall, the classification of this dataset again demonstrated that proteome Subtypes 1–4 were distinct and reproducible between datasets and analytical platforms (Extended Data Figure 9c-d). The k-TSP classifier was evaluated in another recent lung AC MS-dataset (label-free, Xu et al.6). In this dataset the lowest k-TSP feature pair coverage was 92%, and all 103 cases were included in the analysis, resulting in successful classification of 99 cases. Once again, the classification produced subtypes with characteristics matching those in the original discovery cohort (Extended Data Figure 9e).
8. DIA-based validation in two independent cohorts
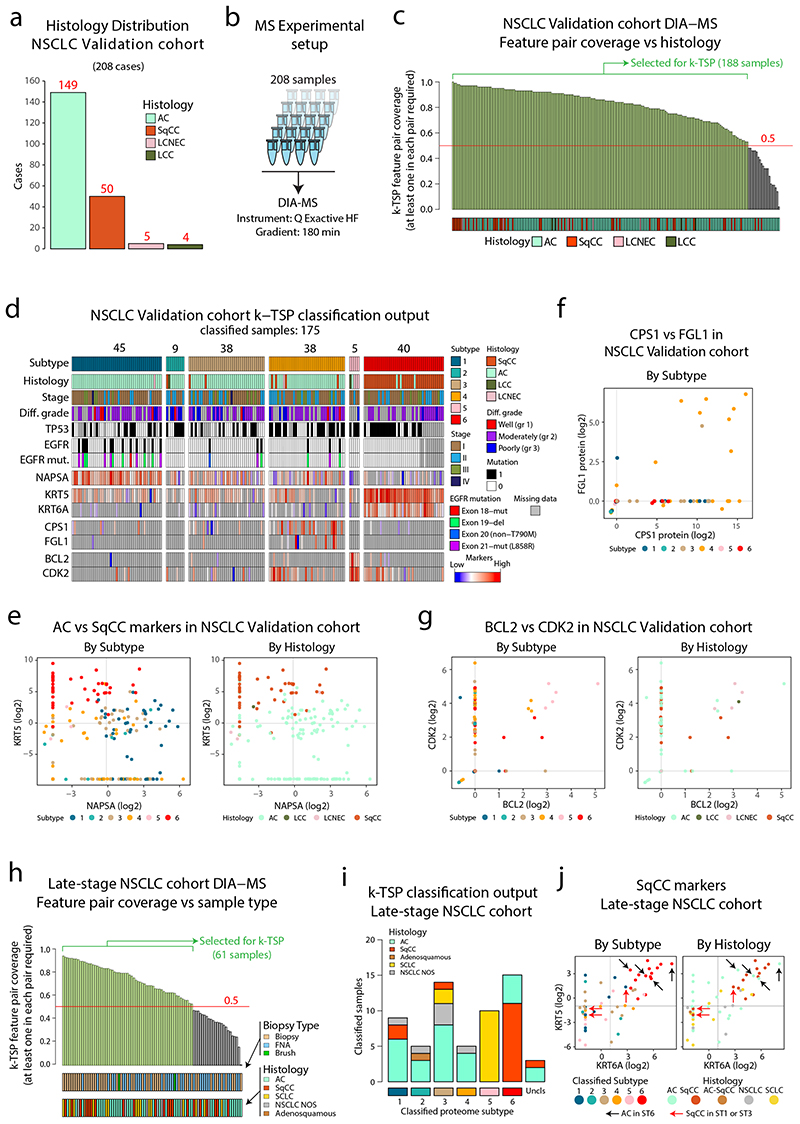
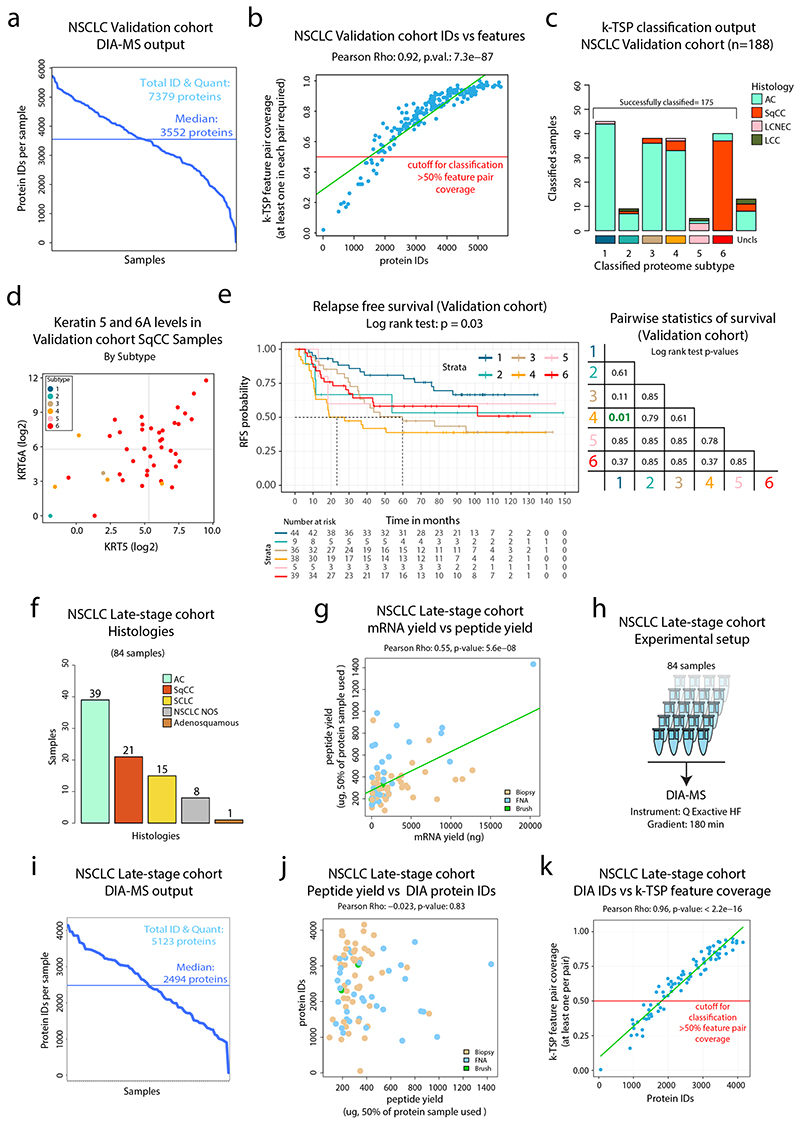
To further evaluate the full MS-based classification pipeline, a second independent cohort of NSCLC was analyzed using DIA-MS (“Validation cohort”, n=208, Figure 8a-b, Extended Data Figure 10a and Supplementary Table 9). Samples with at least 50% coverage of the k-TSP feature pairs were selected for classification (188 samples, Figure 8c and Extended Data Figure 10b), resulting in successful classification of 175 cases (Extended Data Figure 10c). The validation cohort classification reproduced the six NSCLC proteome subtypes described here with similar characteristics of subtype and histology distributions (Figure 8d). As previously, unexpected classifications (AC samples in, and SqCC outside of Subtype 6) were commonly associated with atypical expression of AC and SqCC marker proteins (KRT5, KRT6A, and NAPSA, Figure 8e and Extended Data Figure 10d). Further validating the results from the initial cohort, EGFR mutant cases were classified to Subtype 1 in 13/19 cases (Fisher test P = 6.8 × 10⁻⁵) and poorly differentiated cancers were enriched in Subtype 2 (3.5-fold, P = 0.004). The DIA-MS analysis resulted in identification of both FGL1 and CPS1 in only nine cases, and eight of these were classified as Subtype 4, underscoring the capacity of the DIA-based classification pipeline of identifying this potentially clinically important NSCLC subgroup (Figure 8f). Further, 3/5 LCNEC cases were classified into Subtype 5, and all five Subtype 5 cases showed high protein levels of BCL2 and CDK2 (Figure 8g), two targetable oncogenic proteins indicated as Subtype 5 markers in the initial NSCLC cohort analysis (Supplementary Figure 2d). Finally, analysis of relapse-free survival (RFS) in the validation cohort samples once again indicated differences in prognosis between the classified subtypes, with significantly longer RFS in Subtype 1 cases than in Subtype 4 cases (Extended Data Figure 10e).
Figure 8. Validation of DIA-MS based NSCLC classification pipelines in two separate NSCLC cohorts.
a. Barplot showing the histology distribution of the 208 cases included in the validation cohort. b. Experimental setup for DIA-MS analysis of validation cohort samples. c. DIA-MS data coverage of the k-TSP feature pairs in the validation cohort in relation to histology. Indicated in the plot are the 188 samples with more than 50% coverage of the k-TSP feature pairs that were included for classification. d. Output from k-TSP-based classification of the NSCLC validation cohort for the 175 samples that were successfully classified. Indicated below is sample annotation by histology, stage, differentiation grade, mutation patterns, and marker levels. e. Scatter plot indicating Napsin A (AC marker) vs Keratin 5 (SqCC marker) protein levels in the classified subset of the validation cohort as quantified by DIA-MS. Left plot is color-coded by classified subtype and right plot by histology. f. FGL1 and CPS1 protein levels in the validation cohort colored by classified proteome subtype. g. Scatter plot indicating BCL2 and CDK2 protein levels in the classified subset of the validation cohort as quantified by DIA-MS. Left plot is color-coded by classified subtype and right plot by histology. h. DIA-MS data coverage of the k-TSP feature pairs in the late-stage NSCLC cohort in relation to biopsy type and histology. Biopsy = forceps biopsy by bronchoscopy, FNA = fine needle aspiration by EBUS (endobronchial ultrasound), Brush = bronchial brush by bronchoscopy. i. k-TSP classifier output for the 61 late-stage cohort samples where at least 50% of k-TSP feature pairs were covered colored by histological subgroup. j. Scatter plots indicating the protein levels of SqCC markers Keratin 5 (KRT5) and Keratin 6A (KRT6A) in the classified subset of the late-stage NSCLC cohort as quantified by DIA-MS. Left plot is color-coded by classified subtype and right plot by histology. Indicated by arrows in the plots are cases with unexpected classification output. Lines indicate median abundances.
Next, to evaluate the k-TSP classifier in a late-stage setting, we analyzed a cohort of biopsy samples from inoperable NSCLC (“late-stage cohort”, 84 samples, Supplementary Table 10) by label-free DIA-MS (Extended Data Figure 10f-h). The analytical depth was lower in the late-stage cohort compared to the discovery cohort and the validation cohort, likely as a result of inferior quality in biopsy samples compared to surgical material samples (Extended Data Figure 10i-k). The 50% feature pair coverage cutoff left 61 samples (Figure 8h) for single-sample k-TSP classification, 58 of which were successfully classified with an overall good agreement between histological subgroup and the classified NSCLC proteome subtype (Figure 8i). Disagreement was however indicated for a few samples, e.g., SqCC samples classified to Subtype 3 and SCLC samples classified to Subtypes 1 and 3, possibly due to atypical or borderline histology samples as shown by KRT5/Napsin A levels (Figure 8j) and neural markers (Supplementary Figure 16). In summary, this analysis shows that DIA-MS-based analysis of either early-stage surgical material or late-stage biopsy material enables accurate classification of NSCLC into the six NSCLC proteome subtypes described here.
Discussion
Apart from early detection, prediction of treatment response and optimal therapy combinations are two of the most urgent clinical needs in the management of non-small cell lung cancer (NSCLC). A systems-level understanding of the disease biology is crucial to achieve more accurate and precise molecular subtyping of the disease and fulfil these needs. The current study subdivides NSCLC into six proteome subtypes by in-depth molecular phenotype analysis of tumors, capturing driver pathways and new immune phenotypes.
Intriguingly, TNB was highest in the immune-cold Subtypes 4 and 6, that also showed common expression of NCPs exemplified by peptides from ERV elements and intronic/intergenic regions. Such peptides with longer “non-self” stretches are suggested to be more immunogenic than SNV-mutation derived neoantigens, which are often too similar to the self-antigen48,49. These findings suggest that expression of highly immunogenic CTAs and NCPs may be incompatible with immune infiltration as this would elicit a strong immune response and killing of the cancer cells. Further, NCPs did not correlate with TMB suggesting that mutations are not the main cause of these types of neoantigens. Instead in our data, both CTA and NCP expression are associated with global hypomethylation suggesting looser epigenetic control, in line with previous reports for CTAs35. It is also likely that immunoediting impacts the evolution of the neoantigen repertoire and its relation to immune evasion mechanisms in individual tumors. From a treatment point of view these findings are interesting as NCP-antigens are more likely to be widely shared by different tumors than SNV-mutation-derived neoantigens, which tend to be patient-specific49. This renders NCP neoantigens more promising for off-the-shelf immunotherapy development.
In relation to current immunotherapy, Subtype 2 is characterized by high PD-L1 and CXCL9 levels, T-cell infiltration, activated IFNγ signaling, proficient antigen presentation and high TMB, all indicators of response to PD1/PD-L1 checkpoint inhibition. Currently used single predictive biomarkers for PD1/PD-L1 inhibitors in NSCLC (PD-L1 IHC or the less-established TMB) have low sensitivity or may even be uninformative, and complex biomarkers that hold multi-level information are likely to improve the predictive accuracy50. Our data presented here indicate that MS-based proteome-level subtyping of NSCLC could offer a powerful and competitive method for therapy prediction in the future.
A second wave of checkpoint inhibitors are currently investigated in clinical trials with targets including the inhibitory T-cell receptors LAG-3, TIM-3, and TIGIT36. Based on positive results in mouse models51, antibody-based inhibition of LAG-3 is currently investigated in multiple clinical trials with the majority focusing on combined LAG3 and PD-1/PD-L1 inhibition36. Importantly, FGL1 was recently identified as a high-affinity ligand to LAG-3: binding resulted in T-cell suppression while blockade of the interaction potentiated anti-tumor immunity38. Our analysis reveals that FGL1 is overexpressed in Subtype 4 NSCLC, which depends on inactivation of the tumor suppressor STK11. Interestingly, Subtype 4 is immune-cold and secretion of FGL1 could potentially contribute to a systemic inhibition of T-cell activation and of tumor infiltration by immune cells. Further, if FGL1 is indeed the major cancer-derived ligand of LAG-3, our data indicate that immune cell infiltration or intra-tumoral CD8 (+) cells would be a poor predictor of response to LAG-3 inhibitors as neither of these correlate with FGL1 levels. Instead, our analysis suggests that Subtype 4 could function as stratification for checkpoint inhibitors targeting LAG-3, or, if developed, FGL1.
Our analysis also indicates that B7-H4 may contribute to immune evasion in Subtype 6, which is supported by previous studies where B7-H4 and B7-H3 were found to be higher in SqCC than in AC52. B7-H4 belongs to the same ligand family as PD-1 and CTLA4, and it inhibits T-cell growth, cytokine secretion, and development of cytotoxicity53, but so far the target receptor has not been identified. Similarly to FGL1, B7-H4 can also be secreted as was previously demonstrated in both rheumatoid arthritis54 and ovarian carcinoma55, however the impact of secreted B7-H4 on the immune response in cancer remains to be shown. For the highly proliferating and relatively immune-cold Subtype 5 (LCNEC) our data do not reveal any subtype-specific IR ligand expression. The neoantigen burden analysis however indicates high expression of potentially immunogenic proteins. This raises the question if other, so far unidentified, IR ligands are expressed on the surface of or secreted by Subtype 5 cancer cells. Subtype 1 (EGFRmut-enriched) is also immune-cold but has low neoantigen burden, low immune infiltration, and low levels of all clinically relevant ligands of T-cell inhibitory receptors, in line with EGFR-mutant NSCLC being refractory to checkpoint inhibitors50. Overall, our study reveals new patterns of checkpoint protein expression and provides a resource for filling the knowledge gaps.
Our analyses show a striking co-expression of FGL1, CPS1, and HNF1A in a subset of Subtype 4 samples with STK11 inactivation. HNF1A is a liver-specific transcription factor as shown by us56 and others57, that activates broad liver-specific transcriptional programs with the potential to reprogram fibroblasts into hepatocytes58. Further, transfection of HNF1A into human fibroblasts resulted in a dramatic upregulation of multiple genes including FGL1 59. No direct link has previously been shown between STK11 inactivation and HNF1A activation, however the mouse equivalent to HNF1A, TCF1 is upregulated and activated by mTORC1-STAT360. Our analysis here suggests that reduced HNF1A promoter methylation in STK11 mutated samples contributes to elevated HNF1A mRNA levels, but the mechanism for this epigenetic regulation of HNF1A remains to be further elucidated. Collectively our data indicates that inactivation of STK11 in NSCLC modulates two cancer hallmarks at once by increasing growth rate by loss of mTOR signaling control and promoting immune evasion by expression of FGL1. Importantly, this finding also indicates a potential future combination therapy strategy in Subtype 4 NSCLC cases, where LAG-3/FGL1 checkpoint inhibitors are combined with mTOR inhibitors.
As our analysis demonstrates clinical utility of the proteome subtypes of NSCLC, we developed two methods for classification/subtyping of NSCLC that would be applicable in a clinical setting. The cohort-level classifier (SVM-based) is valuable in a clinical trial setting where multiple samples are collected and analyzed together. The single sample classifier (k-TSP) can be used in a routine diagnostic setting for rapid, label-free analysis of individual samples. Both classifiers showed high accuracy and robustness, and evaluation of the developed classifiers in multiple independent internal and external cohorts replicated close to perfectly the characteristics of the six proteome subtypes. Importantly, in a first proof-of-concept analysis we demonstrate that the DIA-MS based single-sample k-TSP classifier can be successfully utilized even in late-stage NSCLC where very limited sample material is available. It should be noted that neither the sampling, nor the sample preparation was optimized for MS-based classification, so we predict significant improvement and increased quality of the DIA-based classification method.
In summary, we present a first comprehensive proteome analysis of NSCLC, demonstrating the value of high-resolution molecular phenotype analysis as an important component in our quest to understand cancer. Importantly, our analysis indicates, for the first time, that different immune evasion mechanisms are used by cancer cells depending on the type of neoantigens expressed. Immune response towards simpler mutation-derived neoantigens appear to be neutralized locally by PD-L1 as seen in Subtype 2, featuring high TMB but low non-canonical neoantigens. Immune infiltration would be detrimental to cancer cells with complex, likely more immunogenic neoantigens, thus secreted checkpoint ligands, such as FGL1, are expressed for a systemic inhibition of the immune response as seen in Subtype 4. Further studies are needed to determine how these strong neoantigens push for immune evasion mechanisms that hinder immune cell infiltration, and how to best target these processes.
Methods
Collection of NSCLC samples and ethical approvals
The early-stage cohort (also referred to as the “discovery cohort”) comprised resected lung cancer tumor samples from a total of 192 patients with operable lung cancer that were surgically treated at the Skåne University Hospital in Lund, Sweden. The samples were collected as described in previous studies10–12. The late-stage cohort comprised biopsy material from inoperable lung cancer (84 samples). The study was approved by the Regional Ethical Review Board in Lund, Sweden (Registration no. 2004/762 and 2014/32), and all experiments were conducted in agreement with patient consent and ethical review board regulations and decisions.
By decision of the Ethical Review Board, and as no sensitive data were used for this study, specific written informed consent was not required for the minority of patients who were included before the Southern Swedish Lung Cancer Study (conducted 2004–2014) or the ongoing LUCAS study (The Lung Cancer Study in Southern Sweden, started 2014), for which written informed consent existed. In accordance with the decision of the Ethical Review Board, information about the study was available for all patients through local advertisements in news media in the region. The validation cohort comprised resected lung cancer tumor samples from a total of 209 patients that underwent surgery for lung cancer at the Oslo University Hospital in Oslo, Norway from 2006 to 2015. Tumor tissue from the tumor center was snap-frozen in liquid nitrogen and stored at -80 °C until shipment on dry ice and further processing in 2020–2021. One sample was excluded due to insufficient material. Survival was followed until November 2018. All patients signed informed consent. The study was approved by the Regional Ethical Committee for Medical and Health Research Ethics, REK South-East in Oslo, Norway (ref: S-06402b). Clinical data from medical journals including follow-up has been made available for all patients. EGFR status was retrieved from routine diagnostics and TP53 status was retrieved from analysis performed in a previous publication61.
All relevant clinical data for the samples in the three cohorts are reported in the source data.
MS-based proteomic analysis of NSCLC cohorts
Detailed methods describing HiRIEF-LC-MS data-dependent acquisition (DDA)-based and label-free data-independent acquisition (DIA)-based analyses of NSCLC cohorts are deposited at the Nature Portfolio Protocol Exchange platform62.
Synthetic peptide analysis
Synthetic versions of the 105 randomly selected non-canonical peptides (NCPs) were purchased from JPT Peptide Technologies. To improve the probability of success of the synthesis and also to limit costs, we limited the selection of peptides so as to include only lengths up to 20 amino acids. The peptides were pooled into 5 batches, labeled by TMT 10plex reagent 131, cleaned by SCX-SPE (Strata-X-C columns P/N 8B-S029-TAK-TN from Phenomenex), dried in a SpeedVac, dissolved in LC solvent A (final solution containing 100 ng/μl of each peptide), and analyzed by LC-MS using the same settings as described above. Annotated spectra of synthetic peptides were obtained by searching the MS raw files against a database containing only the 105 peptides. The annotated MS2 spectra of synthetic peptides were then aligned to their endogenous counterparts in “mirror plots” shown in Supplementary Data 1. One synthetic peptide failed to produce useful MS2 spectra and thus 104 “mirror plots” remained to be manually assessed. The inspection focused mainly on ions from the b and y series that are notable on the synthetic side but absent from the endogenous side, and also on peak proportionality, particularly in regard to the general expectation of a strong peak on the n-term side of proline residues.
Panel sequencing of early-stage NSCLC cohort
Library preparation and sequencing
An amount of 250 ng genomic DNA of each sample was used for library preparation, which was performed with Twist Biosciences enzymatic library preparation kit (Twist Biosciences) with the following modifications: fragmentation using a 7-min incubation in fragmentation step, xGen Duplex Seq adapters (3–4 nt unique molecular identifiers, 0.6 mM, Integrated DNA Technologies) were used for the ligation and xGen Indexing primers (2 mM, with unique dual indices, Integrated DNA Technologies) were used for PCR amplification (5 cycles). Target enrichment was performed in a multiplex fashion with a library amount of 187.5 ng (8-plex). The libraries were hybridized to a custom designed capture probes panel (Twist Bioscience), xGen Universal Blockers - TS Mix (Integrated DNA Technologies) and COT Human DNA (Life Technologies) for 16 h. The post-capture PCR was performed with xGen Library Amp Primer (0.5 mM, Integrated DNA Technologies) for 10 cycles. Quality control was performed with the Qubit dsDNA HS assay (Invitrogen) and TapeStation HS D1000 assay (Agilent). Sequencing was done on NovaSeq 6000 (Illumina) using paired-end 150 nt readout, aiming at 30 M read pairs per sample. Demultiplexing was done using Illumina bcl2fastq2 Conversion Software v2.20.
The custom designed panel is a 370-gene panel and has been designed to enable detection of clinically relevant single-nucleotide variants (SNV) and insertion/deletion variants (INDEL), copy-number aberrations (CNA), fusion events (fusions), microsatellite instability (MSI) and to estimate the tumor mutational burden (TMB) in a single assay. The panel also contains selected hotspot variants in 9 genes where there is strong evidence of pharmacogenetic relevance. The panel contains approximately 21,000 baits, covering 1.9 Mb of target. Full coding sequence is captured of 198 genes, hotspot regions of 132 genes, CNVs for 86 genes, intronic sequences for SV detection of 19 genes and full gene-body sequencing of 9 genes.
Sequence data analysis
Detailed methods describing the data analysis are deposited at the Nature Portfolio Protocol Exchange platform63.
Gene expression and DNA methylation analysis
Pre-processed Illumina gene expression data for 118 cases in the early-stage NSCLC cohort was obtained from Karlsson et al.10 and DNA methylation data was available from previous studies for 113/141 lung cancer tumors in this cohort (GSE60645 and GSE149521)11,12. DNA methylation data processing and filtering were performed as previously described11,12, resulting in a final dataset interrogating 459,790 genomic positions. Methylation probes were annotated using the IlluminaHumanMethylation450kprobe (v2.0.6) R package and promoter regions were defined as TSS +/- 500bp and extracted using the promoters() function in the TxDb.Hsapiens.UCSC.hg19.knownGene (v3.2.2) R package. Methylation probes and promoter regions were overlapped using the findOverlaps() function in the GenomincRanges R package (v1.34.0), resulting in a total of 72,442 methylation probes in the promoter regions of 19,327 genes. For each gene, the promoter-overlapping probe with the highest standard deviation was selected and the Pearson correlation between probe methylation beta values and log2 transformed mRNA levels was derived.
The promoter methylation score for each tumor was calculated as the per sample mean of methylation beta values for promoter-overlapping probes. Similarly, the overall methylation score per sample was derived as the mean of methylation beta values for all probes.
Immunohistochemistry
Detailed methods describing immune landscape evaluation, including histological, tertiary lymphoid structure, and immunohistochemical analysis, performed on a subset of early-stage NSCLC samples are deposited at the Nature Portfolio Protocol Exchange platform64.
Statistical analysis of NSCLC cohort data
All statistical analyses were conducted using R (v.3.6.2 or higher). Correlations and associated p-values (Spearman and Pearson) were calculated with the R functions cor() or cor.test(). Linear models built with the R function lm(). Pairwise comparisons were computed by two-sided Wilcoxon rank-sum test with the R function wilcox.test() or two-sided Welch’s t-test using t.test(). For the multiple group comparisons, Kruskal-Wallis test was used with the R function kruskal.test() or ANOVA test using anova(). Two-sided post-hoc tests were computed using dunn.test() R function from dunn.test R package (v.1.3.5). Enrichment analysis were conducted in R by one- or two-sided hypergeometric tests with the R function phyper() or fisher.test(). Where indicated, p-values were corrected for multiple testing using the Benjamini-Hochberg (BH) method65 in R. Survival analysis was conducted using Kaplan-Meier estimator from survminer (v.0.4.8) and survival (v.3.2-7) R packages. For the analysis of differential protein levels between samples DEqMS14 (v1.6.0) R package was used. BiomaRt R package (v.2.44.1) was used for gene-symbol conversion across data. Plots were created using base R graphics and ggplot2 (v.3.3.3) and using ComplexHeatmap (v.2.2.0) R packages.
Integrated downstream analysis and bioinformatics
Consensus clustering for determination of NSCLC Proteome Subtypes
Consensus clustering R package (v.1.50.0)66 was used to group samples based on proteins quantified across all samples (input matrix: 9793 x 141). The following parametrization was applied: clusterAlg = ‘hc’, innerLinkage, finalLinkage = ‘ward.D2’, distance = “spearman”, pItem=0.8, pFeature = 1, reps = 1000, maxK = 11. The number of clusters (k = 6) was determined by the elbow method applied to the relative change in consensus index cumulative distribution function (CDF) curve and the empirical assessment of enriched mutations, MSigDB hallmark gene sets and immune/stroma signatures for k = 5,6,7. The consensus index for each sample was extracted and normalized to unity as an indication of the sample membership/outlierness to each cluster.
Non-negative matrix factorization (NMF) clustering
Non-negative matrix factorization (NMF) clustering for proteomics data was performed using NMF R package (v.0.23.0)13 as previously described in5. Specifically, the input data consisted of a concatenated non-negative log2 ratio matrix generated by the initial proteomics data after two modifications: firstly, after converting all negative numbers to zero and, secondly, after converting all positive numbers to zero and removing the signs of all negative numbers. NMF function was run with the following parameters: K = 2:11, method = ‘brunet’, nrun=100. The cophenetic correlation coefficient was used to evaluate the clustering quality. The cluster membership score was estimated as the fractional score of the corresponding column in the factorized matrix H.
Correlation network analysis
Filtering was first performed based on DEqMS analysis (|log2 ratio| > 0.5 and P.adj. < 0.01) and quantitative data in at least 70% of samples. Pairwise Pearson correlations were then calculated for the remaining 5,257 proteins. The resulting correlation matrix (input matrix: 5257 x 5257) was used for downstream analysis with Seurat R package (v.4.0.0)67. Specifically, PCA dimensionality reduction was performed on standardized correlations and the first 8 principal components were retained according to the elbow of the PCA standard deviation plot (PCAtools v1.2.0). These components were used to project proteins in 2-dimensional UMAP coordinates with n.neighbors = 20 and min.dist = 0.2 after empirical assessment of the local and global patterns captured in visualizations with different parameters. An Euclidean distance-based, shared nearest neighbor graph was constructed using the same n.neighbors (n=20), and Louvain community detection algorithm68 was applied to find distinct protein clusters. The resolution parameter (n_resolution = 0.6) was chosen as the maximum value for which every cluster could be assigned to at least one MsigDB hallmark (ClusterProfiler v3.14.369, enrichment adj.p-value < 0.05). Cell-type enrichments were assigned with the same p-value significance threshold based on genes with absolute average log2 fold change > 0.5, adjusted p-value < 0.01) taken from Travaglini et al.70. Per subtype networks were visualized after estimating the median of the log2 ratios for each protein across the respective samples. The heatmap shows the above-estimated ratios averaged per term.
mRNA-protein differences
We calculated mRNA - protein Pearson correlations of genes with quantification values in at least 70% of samples (n.genes = 8,865). The correlations were Fisher z-transformed, and the differences caused by complex membership, stability – based on ranking in the top (bottom) one third of half-lives for stable (unstable) assignment – and miRNA-targeting were assessed using external experiment data16–18. Two-group and multi-group comparisons were assessed with two-sided t-tests and ANOVA, respectively.
Immune/stroma estimation – immune gene-set scores
Standardized immune and stroma scores were calculated using the ESTIMATE (v1.0.11) method15 on the complete proteomics data. Previously defined immune cell markers25 and hallmarks of ‘INTERFERON ALPHA RESPONSE’ and ‘INTERFERON GAMMA RESPONSE’ from MSigDB71 were used as input for single-sample gene-set enrichment analysis (ssGSEA) in GSVA R package (v. 1.34.0)72.
TMB – antigen presentation machinery correlation
To evaluate the relationship between TMB and antigen presentation machinery (APM), a similar analysis to Dou et al.26 was followed. Specifically, samples were separated into TMB-high/-low cases based on their log2 TMB values and into APM-high/-low based on their enrichment score in ‘KEGG ANTIGEN_PROCESSING_AND_PRESENTATION’73. k-means algorithm was used with means of five highest and lowest values of TMB as initial centers for TMB-high and -low groups. We performed a similar analysis based on enrichment scores to define AMP-high/-low samples. For each of the four TMB/APM categories, subtype over-representation was evaluated by hypergeometric test and p-values were corrected for multiple testing.
Cancer- and driver-related proteins (CDRPs)
Detailed methods describing the identification of CDRPs are deposited at the Nature Portfolio Protocol Exchange platform63. The list of 832 CDRPs and their annotations can be found in Supplementary Table 4.
Proteogenomics 6FT search
Detailed methods describing the proteogenomics 6FT search are deposited at the Nature Portfolio Protocol Exchange platform63.
NCP - TMB relationship
Based on prior knowledge about factors that influence tumor mutational burden, we evaluated the relationship between the number of NCPs per sample and TMB using lm() function in R under the following linear model specification:
Where:
NCPs – number of NCPs per sample,
TMB – log2 values of the tumor mutational burden,
MKI67 – Proteomics log2 ratios of Ki-67 as a proliferation index,
TP53-mutation – presence/absence of mutation in TP53 gene, and
Purity – ASCAT-estimated sample purity.
Tumor Neoantigen Burden (TNB)
We devised the TNB score per tumor by:
Applying min-max normalization to each of the TMB, NCP and CTA values across tumors in order to rescale them to a range of [0,1].
Summing the rescaled TMB, NCP and CTA values per sample.
Applying min-max normalization to the sums.
Per subtype TNB score was estimated by the median of the TNB scores across the respective tumors.
Building and applying cohort and single-sample classifiers
Detailed methods describing the support-vector machine (SVM)-based cohort classifier and k-TSP-based single-sample classifier are deposited at the Nature Portfolio Protocol Exchange platform63. The list of features/marker proteins for the classifiers can be found in Supplementary Table 9.
STK11 pathway in vitro validation
Detailed methods describing in vitro validation of the STK11 pathway, including via AMPK activation, rescue of STK11wt and subsequent Western Blot analysis are deposited at the Nature Portfolio Protocol Exchange platform74. Uncropped blots are available as Supplementary Data 2.
Extended Data
Extended Data Fig. 1. Consensus clustering vs NMF clustering based on proteome data in NSCLC cohort.
Consensus clustering vs NMF clustering based on proteome data in NSCLC cohort. Clustering of NSCLC based on 9,793 proteins identified and quantified across all 141 samples in the cohort. a. ConsensusClusterPlus graphic output of Cumulative Distribution Function (CDF) plot, number of clusters k = 2:11. b. ConsensusClusterPlus graphic output for relative change in area (delta area) under the CDF curve, number of clusters k = 2:11. c. Cophonetic correlation coefficient for the different choice of rank (clusters) in the non-negative matrix factorization (NMF) clustering. d. Consensus clustering index and NMF membership index across the six subtypes in the NSCLC cohort. e. Overlap of samples in subtype assignment between Consensus clustering and NMF. f. Annotated heatmap showing the results of the consensus clustering including the six identified clusters. Annotations include: Histology, mRNA subtypes1-3, Stage, Age, Sex, Smoking, Tumor cell content (“Purity”), Immune and Stromal Signatures as described in (Yoshihara et al. 2013), TMB calculated from panel sequencing data, selected putative functional mutations from panel sequencing analysis, PD-L1 from IHC, PD-L1 from MS, KI-67 from MS, and Histological subtype markers from MS (NCAM1, KRT5, NAPSA).
Extended Data Fig. 2. Enrichments for the NSCLC Proteome Subtypes.
Enrichments for the NSCLC Proteome Subtypes. Volcano plots showing the output from enrichment tests of NSCLC mRNA subtypes (a) and AC mRNA subtypes (Proximal Inflammatory (PI), Proximal Proliferative (PP) and Terminal Respiratory Unit (TRU)) (b). P-values were calculated using one-sided hypergeometric test with Benjamini-Hochberg adjustment. c. Scatter plot indicating the expression of SqCC markers KRT5 and KRT6A across the SqCC samples in the cohort (n = 25) colored by SqCC mRNA subtype (center) and proteome subtype (border). The associated Pearson’s correlation coefficient (Rho) and two-sided p-value from t-distribution with n − 2 degrees of freedom are provided. d. Network analysis of NSCLC proteome subtypes. UMAP plots or each proteome subtype separately. Colors indicate subtype median protein level (log2) for the 5,257 proteins. e. Module enrichment analysis performed against MSigDB Hallmarks gene sets. Indicated in the figure for each module are significantly enriched gene sets (One-sided hypergeometric test, Benjamini-Hochberg adjusted p-values < 0.05). f. Module enrichment analysis performed against cell subtypes gene sets gene sets. Indicated in the figure for each module are significantly enriched gene sets (One-sided hypergeometric test, Benjamini-Hochberg adjusted p-values < 0.05). g. Boxplot indicating the tumor cell content (“purity”, calculated based on panel sequencing data) across the NSCLC Proteome Subtypes (n = 140). Green dotted line indicates cohort median. Middle line, median; box edges, 25th and 75th percentiles; whiskers, most extreme points that do not exceed ±1.5 × the interquartile range (IQR). P-value was calculated by Kruskal-Wallis test. Dunn’s multiple comparison tests with Benjamini–Hochberg adjustment are available in Supplementary Table 3. h. Volcano plots showing mutation enrichment analysis for the six NSCLC proteome subtypes. Horizontal red and green dotted lines in all volcano plots indicate p-value=0.01. P-values were calculated using Two-sided Fisher’s exact test with Benjamini-Hochberg adjustment.
Extended Data Fig. 3. CDRP outlier regulation level analysis.
CDRP outlier regulation level analysis. a. mRNA-protein correlation for genes (n = 8,865) divided based on annotation as either miRNA targets or not according to previously published data (Helwak et al. 2013). Statistical testing was performed using two-sided Welch’s t-test (exact p-value = 1.56 × 10⁻¹⁹). b. mRNA-protein correlation for genes (n = 1,674 gene symbols) divided based on mRNA and protein stability as previously determined (Schwanhausser et al. 2011). Statistical testing was performed using one-way analysis of variance (ANOVA) and pairwise two-sided Welch’s t-test uncorrected for multiple testing. c. mRNA-protein correlation for genes (n = 8865 gene symbols) divided based on corresponding proteins annotation as member of a protein complex according to CORUM (Giurgiu et al. 2019). Statistical testing was performed using two-sided Welch’s t-test (exact p-value = 1.13 × 10-56). d. Scatter plot showing promoter methylation to mRNA correlation vs mRNA to protein correlation for full gene-wise overlap (n = 9,018 gene symbols). Indicated on top and to the right are the corresponding density plots. e. Same as in a. but showing only CDRPs with quantification in at least 60 samples. f. Scatter plots indicating the mRNA and protein levels of IRS2 (n = 118 samples) and HNF1A (n = 66 samples). g. Scatter plot indicating the protein levels of IRS2 and HNF1A (n = 79 samples). For boxplots (a-c): middle line, median; box edges, 25th and 75th percentiles; whiskers, most extreme points that do not exceed ±1.5 × the interquartile range (IQR). Indicated in scatter plots is the number of samples with quantitative information at both mRNA and protein level (f), or for both proteins (g), a linear regression trendline (green) and outlier expression threshold (red). The associated Pearson’s correlation coefficients (Rho) and two-sided p-values from t-distribution with n − 2 degrees of freedom are provided.
Extended Data Fig. 4. Immunohistochemistry (IHC) evaluation of selected proteins.
Immunohistochemistry (IHC) evaluation of selected proteins. a. Examples of positive (high) and negative (low) CD3, CD8 and PD-L1 determined by IHC. Images showing example stainings for the immune cell markers CD3 (left) and CD8 (center), and PD-L1 (right). Top three rows show high stromal staining of CD3 and CD8 as well as cancer cell staining of PD-L1 as exemplified from three Subtype 2 samples. Bottom three rows show examples of low/negative staining for all three proteins from proteome Subtype 1 and Subtype 5. b. Immune cell marker expression in NSCLC proteome subtypes. Scatter plots showing MS-based quantification vs stromal staining determined by IHC for CD3E (left, n = 90 samples), and CD8A (right, n = 90 samples). IHC scores were based on at least 100 cells per sample and staining. Indicated in the plots are the linear regression trendlines in green. The associated Pearson’s correlation coefficients (Rho) and two-sided p-values from t-distribution with n − 2 degrees of freedom are provided.
Extended Data Fig. 5. Tertiary lymphoid structures (TLSs) and B-cell infiltration in NSCLC proteome subtypes.
Tertiary lymphoid structures (TLSs) and B-cell infiltration in NSCLC proteome subtypes. a. Scatter plot indicating protein levels of PD-L1 vs the B-cell marker CD20 (MS4A1) in the entire NSCLC cohort (n = 141). b. Heatmap indicating mRNA expression levels of known TLS marker genes. Cohort samples are ordered as in main Figure 1. c. Scatterplot indicating protein levels of PD-L1 vs the B-cell marker CD20 in cohort subset selected for whole section IHC evaluation (n = 19). d. TLS count (10 high power fields per sample) by subtype (n = 19 samples). e-f. IHC images showing examples of tertiary lymphoid structures from two different Subtype 3 samples (out of 11 stained samples). g. Boxplot indicating percent solid growth pattern in AC samples analyzed by whole section IHC (n = 16 samples). h. Boxplot indicating stromal signature in Subtype 2 and 3 samples analyzed by whole section IHC (n = 19 samples). i-n. IHC images showing examples of different growth patterns in six AC samples analyzed by whole section IHC (out of 16 stained samples). For boxplots: middle line, median; box edges, 25th and 75th percentiles; whiskers, most extreme points that do not exceed ±1.5 × the interquartile range (IQR). P-values in boxplots were calculated using two-sided Wilcoxon rank-sum test.
Extended Data Fig. 6. Proteogenomic analysis for detection of non-canonical peptides (NCPs) in the NSCLC cohort.
Proteogenomic analysis for detection of non-canonical peptides (NCPs) in the NSCLC cohort. a. Overview of the proteogenomic analysis. Six reading frame translation (6FT) database search was performed as previously described (Branca et al. 2014, Zhu et al. 2018) and search hits were filtered based on FDR<1%; SpectrumAI for automatic MS2 spectrum inspection/validation of single-substitution peptide identifications; and outlier expression pattern. Resulting 651 NCPs showed low identification overlap across cohort samples indicating sample specific expression. Thirteen percent of corresponding genetic loci were supported by more than one unique peptide. b. Examples of mirror plots from NCP synthetic peptide validation for a peptide that passed the manual inspection (left) and a peptide that failed the manual inspection (right). For each example the upper part shows the annotated MS2 spectrum of the NCP identified in the original proteogenomic analysis, and the lower part shows the MS2 spectrum of the corresponding synthetic peptide. In the right figure, missing fragment ions in the spectrum of the synthetic peptide are indicated. Mirror plots of all 104 NCPs that were evaluated by synthetic peptides can be found in Supplementary Data 1. c. Pie chart indicating the results of the NCP synthetic peptide validation. d. Bar plot showing the results of the NCP synthetic peptide validation for each of the six NSCLC Subtypes. In total, the 104 NCPs evaluated were identified in 156 samples (the same NCP can be identified in several samples). e. Distribution of NCP synthetic peptide validation results per subtype indicating no statistically significant difference between subtypes. P value was calculated using two-sided Fisher’s exact test.
Extended Data Fig. 7. FGL1 and STK11 in NSCLC proteome landscape and TCGA dataset.
FGL1 and STK11 in NSCLC proteome landscape and TCGA dataset. a. Scatter plot showing protein vs mRNA level Pearson’s correlations in the NSCLC cohort for 9,244 genes where mRNA data and quantitative protein data was available for at least 70 samples. Red dotted lines indicate 5th and 95th percentiles of mRNA and protein level correlations. b. Scatterplot showing STK11 vs STRADA protein levels in NSCLC cohort colored by proteome subtype (n = 141 samples). c. Scatter plot showing STK11 vs FGL1 protein levels in NSCLC cohort colored by proteome subtype (n = 141 samples). Indicated by red circles are samples with STK11 mutations. d. Scatter plot showing protein level Pearson’s correlations in the NSCLC cohort vs mRNA level correlation in the TCGA PanCancer dataset for 10,447 genes where mRNA data and quantitative protein data were available for at least 70 samples. Red lines indicate 5th and 95th percentiles of mRNA and protein level correlations. e. Boxplots showing FGL1 (left) and CPS1 (right) mRNA levels by STK11 mutation status in the TCGA lung adenocarcinoma (LUAD) dataset (n = 504 samples). Middle line, median; box edges, 25th and 75th percentiles; whiskers, most extreme points that do not exceed ±1.5 × the interquartile range (IQR). P-values were calculated using two-sided Wilcoxon rank-sum test. f. Scatter plot showing STK11 vs FGL1 mRNA levels in the TCGA LUAD dataset colored by STK11 mutation status (n = 504 samples). g. Scatterplot showing FGL1 vs HNF1A mRNA levels in the TCGA LUAD dataset colored by STK11 mutation status (n = 504 samples). For scatter plots b, c, f, and g, linear regression trendlines are indicated in green. The associated Pearson’s correlation coefficients (Rho) and two-sided p-values from t-distribution with n − 2 degrees of freedom are provided.
Extended Data Fig. 8. Support-vector machine (SVM) and k-Top Scoring Pairs (k-TSP) based classification of NSCLC subtype.
Support-vector machine (SVM) and k-Top Scoring Pairs (k-TSP) based classification of NSCLC subtype. a. Sankey plot showing the SVM classification output from the SVM testing (100 Monte Carlo cross-validation (MCCV) iterations) with 94% accuracy. b. Stacked bar plots showing the subtype outlierness indicated by consensus index from the original clustering (top) and the classification output form the 100 MCCV iterations (bottom). Indicated by red arrows are seven samples that were frequently mis-classified by the SVM. c. DIA-MS analysis of the 141 samples resulted in the identification of 6,717 proteins (FDR<1%) with a minimum of 2220 proteins per sample and a full overlap of 1202 proteins across all samples. Right part shows protein-wise and sample-wise correlation between DIA-MS based, and DDA-MS based quantifications. d. Selection of (k) for the k-TSP classifier was performed based on accuracy in test data, resulting in k=13 feature pairs. e. k-TSP classifier feature pair importance evaluated by the frequency each feature pair was used across the 100 MCCV iterations. After training, the accuracy of the classifier was estimated using the test set samples. The overall accuracy was reported as the average accuracy of the 100 iterations. The 13 most frequently used feature pairs for each binary model (15 models), resulting in 195 final feature pairs, were used to build the final model. f. Sankay plot showing the classification output from the k-TSP test data (100 iterations) resulting in 87% accuracy. g. Stacked bar plots showing the subtype outlierness indicated by consensus index from the original clustering (top) and the classification output form the 100 MCCV iterations (bottom). Indicated by red arrows are 19 samples that were frequently mis-classified by the k-TSP.
Extended Data Fig. 9. SVM and k-TSP based classification of public domain AC transcriptomics and proteomics data.
SVM and k-TSP based classification of public domain AC transcriptomics and proteomics data. a. Output from SVM-based classification of the TCGA lung adenocarcinoma (LUAD) cohort based on mRNA-level data. Indicated below is sample annotation by mRNA subtype, mutation patterns and marker/signature levels. b. Kaplan-Meier plot showing overall survival in the TCGA LUAD cohort by classified subtype (n = 501 samples). P-value was calculated using log-rank test. c. Venn diagrams showing overlap between current early-stage NSCLC cohort and the Gillette et al. lung AC cohort in all identified proteins (top) and proteins with full overlap in respective cohorts (bottom). Indicated by red circle is the overlap with 250 most frequently used features from the SVM classifier optimization. d. Output from SVM-based classification of the Gillette et al. AC cohort (n = 111 samples). Indicated below is sample annotation by mRNA and protein subtype, mutation patterns and marker/signature levels. To the right, results are displayed by classified subtype including p-values from Kruskal-Wallis test (markers and signatures) or one-sided hypergeometric test with Benjamini-Hochberg adjustment (mutations). e. Output from k-TSP-based classification of the Xu et al. lung AC cohort (n = 99 samples). Indicated below is sample annotation by mutation patterns and marker/signature levels. To the right, results are displayed by classified subtype including p-values from Kruskal-Wallis test (markers and signatures) or one-sided hypergeometric test with Benjamini-Hochberg adjustment (mutations).
Extended Data Fig. 10. DIA-MS analysis and k-TSP based classification of NSCLC Validation and late-stage cohorts.
DIA-MS analysis and k-TSP based classification of NSCLC Validation and late-stage cohorts. a. DIA-MS analysis of the 208 samples in the NSCLC validation cohort resulted in the identification of 7,379 proteins (FDR<1%), with a median number of identified proteins per sample of 3,552. b. Scatter plot showing k-TSP feature pair coverage vs number of identified proteins per sample. Red line indicate threshold for classification inclusion. c. k-TSP classifier output for the 188 samples where at least 50% of k-TSP feature pairs were covered colored by histological subgroup. d. Scatter plot indicating the levels of SqCC markers Keratin 5 (KRT5) and Keratin 6A (KRT6A) in the SqCC subset of the NSCLC validation cohort color-coded by classified subtype as quantified by DIA-MS. e. (Left) Kaplan-Meier plot showing relapse-free survival in the NSCLC validation cohort by classified subtype (n = 171 samples). P-value was calculated using log-rank test. (Right) Pairwise statistics for relapse free survival in classified subtypes of the NSCLC validation cohort with p-values calculated by log-rank test with Benjamini-Hochberg adjustment. f. Bar plot showing the histologies of the 84 samples included in the late-stage cohort. g. Scatter plot showing mRNA and peptide yields from the sample prep of biopsy samples using Allprep kit followed by digestion, colored by biopsy type (n = 84 samples). h. Experimental setup for DIA-MS analysis of late-stage cohort samples. i. DIA MS analysis of the 84 samples resulted in the identification of 5,124 proteins (FDR<1%), with a median number of identified proteins per sample of 2,494. j. Scatter plot showing peptide yield vs number of identified proteins per sample, colored by biopsy type (n = 84 samples). k. Scatter plot showing k-TSP feature pair coverage vs number of identified proteins per sample (n = 84 samples). Red line indicate threshold for classification inclusion. For scatter plots (b, g, and k), linear regression trendlines are indicated in green. The associated Pearson’s correlation coefficients (Rho) and two-sided p-values from t-distribution with n − 2 degrees of freedom are provided.
Supplementary Material
Acknowledgements
DNA sequencing was performed at SciLifeLab Clinical Genomics Facility, at Stockholm; and the MS-analysis was supported by SciLifelab proteogenomics facility and Karolinska University Hospital Clinical proteomics facility. We thank Dr. Marcus Buggert for critical reading of the immune system regulation related parts. We thank Dr. Johan Lindberg and Dr. Valtteri Wirta for expert support on DNA sequencing analysis. pBABE-FLAG-LKB1 was a gift from Lewis Cantley (Addgene plasmid #8592). The study was funded by The Swedish Research Council, Swedish Cancer Society, The Cancer Research Funds of Radiumhemmet, European Council H2020 financing (projects Rescuer, OncoBiome, AipBAND, DART), The Swedish Foundation for Strategic Research, The Erling-Persson Family Foundation, the Sjöberg Foundation, the Fru Berta Kamprad Foundation, Karolinska Institutet’s funding for doctoral education (KID), BioCARE a Strategic Research Program at Lund University, Stiftelsen Jubileumsklinikens Forskningsfond mot Cancer (Gustav V:s Jubilee Foundation), and The National Health Services (Region Skåne/ALF). C.G.H. lab is supported by a University of Edinburgh Chancellor’s Fellowship and the Worldwide Cancer Research. K.P.P. is funded by MRC Precision Medicine DTP Studentship.
Footnotes
Author contributions
The project was conceived and supervised by J.L., M.Planck, J.S. and L.M.O. Clinical data review and inclusion of patients: S.I., M.K., and M.Planck. Clinical sampling, sample prep and transcriptomics data generation was performed by M.J., A.K., and J.S. Pathological evaluation and immunohistochemistry was performed by F.S., M.J., and H.B. Clinical sampling, inclusion of patients and clinical data review for the validation cohort was performed by O.T.B., V.D.H., and Å.H. In-vitro cell line part was coordinated and performed by O.B. and L.M.O. STK11 rescue experiments were performed by K.P.P., R.C. and C.G.H. Proteomics sample prep, MS data generation and searching was performed by Y.P., O.B., G.M., M.Pirmoradian, H.J.J, and R.M.B. Analysis of the sequencing data was performed by T.A., I.S., H.F.A., and D.T. DNA methylation data generation and analysis: E.A. and M.A. Proteogenomics analysis was performed by I.S., H.M.U., R.M.B and L.M.O. Classification was performed by T.A. and L.M.O. Integrative downstream analyses were performed by T.A., I.S., O.B., and L.M.O. The paper was written by J.L. and L.M.O.
Competing interests
J.L. has received grant funding from AstraZeneca, Roche and Novartis (not financing of the current manuscript). J.L. and L.M.O. are share holders of FenoMark Diagnostics. J.L., T.A., I.S., and L.M.O are co-inventors on a patent application related to this work. J.L. and D.T. are associate with Roche financed Cancer Core Europe clinical trial (not associated to current manuscript). Since completing his contribution to the current work, M.Pirmoradian has become an employee of AstraZeneca. All other authors declare no competing interests.
Reporting summary
Further information on research design is available in the Nature Research Reporting Summary linked to this article.
Data availability
The mass spectrometry proteomics data for DDA and DIA analyses have been deposited to the ProteomeXchange Consortium via the PRIDE partner repository with the dataset identifier PXD020191 (DDA discovery cohort), PXD020548 (DIA discovery and late-stage cohorts), and PXD025560 (DIA validation cohort).
For panel sequencing, sequence data has been deposited at the European Genome-phenome Archive (EGA), which is hosted by the EBI and the CRG, under accession number EGAS00001005482.
Previously published proteomics data that was re-analyzed in this study are available in PRIDE with the identifier PXD010429, in iProx Consortium with the subproject ID IPX0001804000 and CPTAC Data Portal (https://cptac-data-portal.georgetown.edu/study-summary/S056).
Previously published gene expression data that were re-analyzed here are available under accession codes GSE60645 and GSE149521, and in ArrayExpress with the identifier E-MTAB-6043. The human [Pan-Cancer Atlas and lung adenocarcinoma (LUAD) gene expression data] data were derived from the TCGA Research Network: http://cancergenome.nih.gov/. The dataset derived from this resource that supports the findings of this study is available at https://gdc.cancer.gov/access-data.
Previously published resource of drug sensitivity in cancer cell lines data are available at https://www.cancerrxgene.org/. Source data for all figures and Extended Data figures have been provided as Source Data files. All other data supporting the findings of this study are available from the corresponding author upon reasonable request.
Code availability
Custom code for the classifiers (SVM-RFE and k-TSP) can be found at https://github.com/lehtiolab/Code-Availability/tree/main/Lehtio_et_al_Nature_Cancer_2021.
References
- 1.Cancer Genome Atlas Research, N. Comprehensive genomic characterization of squamous cell lung cancers. Nature. 2012;489:519–525. doi: 10.1038/nature11404. [DOI] [PMC free article] [PubMed] [Google Scholar]
- 2.Cancer Genome Atlas Research, N. Comprehensive molecular profiling of lung adenocarcinoma. Nature. 2014;511:543–550. doi: 10.1038/nature13385. [DOI] [PMC free article] [PubMed] [Google Scholar]
- 3.Egeblad M, Nakasone ES, Werb Z. Tumors as organs: complex tissues that interface with the entire organism. Dev Cell. 2010;18:884–901. doi: 10.1016/j.devcel.2010.05.012. [DOI] [PMC free article] [PubMed] [Google Scholar]
- 4.Stewart PA, et al. Proteogenomic landscape of squamous cell lung cancer. Nat Commun. 2019;10:3578. doi: 10.1038/s41467-019-11452-x. [DOI] [PMC free article] [PubMed] [Google Scholar]
- 5.Gillette MA, et al. Proteogenomic Characterization Reveals Therapeutic Vulnerabilities in Lung Adenocarcinoma. Cell. 2020;182:200–225.:e235. doi: 10.1016/j.cell.2020.06.013. [DOI] [PMC free article] [PubMed] [Google Scholar]
- 6.Xu JY, et al. Integrative Proteomic Characterization of Human Lung Adenocarcinoma. Cell. 2020;182:245–261.:e217. doi: 10.1016/j.cell.2020.05.043. [DOI] [PubMed] [Google Scholar]
- 7.Chen YJ, et al. Proteogenomics of Non-smoking Lung Cancer in East Asia Delineates Molecular Signatures of Pathogenesis and Progression. Cell. 2020;182:226–244.:e217. doi: 10.1016/j.cell.2020.06.012. [DOI] [PubMed] [Google Scholar]
- 8.Branca RM, et al. HiRIEF LC-MS enables deep proteome coverage and unbiased proteogenomics. Nat Methods. 2014;11:59–62. doi: 10.1038/nmeth.2732. [DOI] [PubMed] [Google Scholar]
- 9.Zhu Y, et al. Discovery of coding regions in the human genome by integrated proteogenomics analysis workflow. Nat Commun. 2018;9:903. doi: 10.1038/s41467-018-03311-y. [DOI] [PMC free article] [PubMed] [Google Scholar]
- 10.Karlsson A, et al. Gene Expression Profiling of Large Cell Lung Cancer Links Transcriptional Phenotypes to the New Histological WHO 2015 Classification. J Thorac Oncol. 2017;12:1257–1267. doi: 10.1016/j.jtho.2017.05.008. [DOI] [PubMed] [Google Scholar]
- 11.Karlsson A, et al. Genome-wide DNA methylation analysis of lung carcinoma reveals one neuroendocrine and four adenocarcinoma epitypes associated with patient outcome. Clin Cancer Res. 2014;20:6127–6140. doi: 10.1158/1078-0432.CCR-14-1087. [DOI] [PubMed] [Google Scholar]
- 12.Arbajian E, et al. Methylation Patterns and Chromatin Accessibility in Neuroendocrine Lung Cancer. Cancers (Basel) 2020;12 doi: 10.3390/cancers12082003. [DOI] [PMC free article] [PubMed] [Google Scholar]
- 13.Gaujoux R, Seoighe C. A flexible R package for nonnegative matrix factorization. BMC Bioinformatics. 2010;11:367. doi: 10.1186/1471-2105-11-367. [DOI] [PMC free article] [PubMed] [Google Scholar]
- 14.Zhu Y, et al. DEqMS: A Method for Accurate Variance Estimation in Differential Protein Expression Analysis. Mol Cell Proteomics. 2020;19:1047–1057. doi: 10.1074/mcp.TIR119.001646. [DOI] [PMC free article] [PubMed] [Google Scholar]
- 15.Yoshihara K, et al. Inferring tumour purity and stromal and immune cell admixture from expression data. Nat Commun. 2013;4:2612. doi: 10.1038/ncomms3612. [DOI] [PMC free article] [PubMed] [Google Scholar]
- 16.Helwak A, Kudla G, Dudnakova T, Tollervey D. Mapping the human miRNA interactome by CLASH reveals frequent noncanonical binding. Cell. 2013;153:654–665. doi: 10.1016/j.cell.2013.03.043. [DOI] [PMC free article] [PubMed] [Google Scholar]
- 17.Giurgiu M, et al. CORUM: the comprehensive resource of mammalian protein complexes-2019. Nucleic Acids Res. 2019;47:D559–D563. doi: 10.1093/nar/gky973. [DOI] [PMC free article] [PubMed] [Google Scholar]
- 18.Schwanhausser B, et al. Global quantification of mammalian gene expression control. Nature. 2011;473:337–342. doi: 10.1038/nature10098. [DOI] [PubMed] [Google Scholar]
- 19.Mayr C, Hemann MT, Bartel DP. Disrupting the pairing between let-7 and Hmga2 enhances oncogenic transformation. Science. 2007;315:1576–1579. doi: 10.1126/science.1137999. [DOI] [PMC free article] [PubMed] [Google Scholar]
- 20.Joshi S, Kumar S, Ponnusamy MP, Batra SK. Hypoxia-induced oxidative stress promotes MUC4 degradation via autophagy to enhance pancreatic cancer cells survival. Oncogene. 2016;35:5882–5892. doi: 10.1038/onc.2016.119. [DOI] [PMC free article] [PubMed] [Google Scholar]
- 21.Ikink GJ, Boer M, Bakker ER, Hilkens J. IRS4 induces mammary tumorigenesis and confers resistance to HER2-targeted therapy through constitutive PI3K/AKT-pathway hyperactivation. Nat Commun. 2016;7:13567. doi: 10.1038/ncomms13567. [DOI] [PMC free article] [PubMed] [Google Scholar]
- 22.Campanero MR, Flemington EK. Regulation of E2F through ubiquitin-proteasome-dependent degradation: stabilization by the pRB tumor suppressor protein. Proc Natl Acad Sci U S A. 1997;94:2221–2226. doi: 10.1073/pnas.94.6.2221. [DOI] [PMC free article] [PubMed] [Google Scholar]
- 23.Liu J, et al. An integrative cross-omics analysis of DNA methylation sites of glucose and insulin homeostasis. Nat Commun. 2019;10:2581. doi: 10.1038/s41467-019-10487-4. [DOI] [PMC free article] [PubMed] [Google Scholar]
- 24.Valkovicova T, Skopkova M, Stanik J, Gasperikova D. Novel insights into genetics and clinics of the HNF1A-MODY. Endocr Regul. 2019;53:110–134. doi: 10.2478/enr-2019-0013. [DOI] [PubMed] [Google Scholar]
- 25.Charoentong P, et al. Pan-cancer Immunogenomic Analyses Reveal Genotype-Immunophenotype Relationships and Predictors of Response to Checkpoint Blockade. Cell Rep. 2017;18:248–262. doi: 10.1016/j.celrep.2016.12.019. [DOI] [PubMed] [Google Scholar]
- 26.Dou Y, et al. Proteogenomic Characterization of Endometrial Carcinoma. Cell. 2020;180:729–748.:e726. doi: 10.1016/j.cell.2020.01.026. [DOI] [PMC free article] [PubMed] [Google Scholar]
- 27.Litchfield K, et al. Meta-analysis of tumor- and T cell-intrinsic mechanisms of sensitization to checkpoint inhibition. Cell. 2021;184:596–614.:e514. doi: 10.1016/j.cell.2021.01.002. [DOI] [PMC free article] [PubMed] [Google Scholar]
- 28.Sautes-Fridman C, Petitprez F, Calderaro J, Fridman WH. Tertiary lymphoid structures in the era of cancer immunotherapy. Nat Rev Cancer. 2019;19:307–325. doi: 10.1038/s41568-019-0144-6. [DOI] [PubMed] [Google Scholar]
- 29.Cabrita R, et al. Tertiary lymphoid structures improve immunotherapy and survival in melanoma. Nature. 2020;577:561–565. doi: 10.1038/s41586-019-1914-8. [DOI] [PubMed] [Google Scholar]
- 30.Attermann AS, Bjerregaard AM, Saini SK, Gronbaek K, Hadrup SR. Human endogenous retroviruses and their implication for immunotherapeutics of cancer. Ann Oncol. 2018;29:2183–2191. doi: 10.1093/annonc/mdy413. [DOI] [PubMed] [Google Scholar]
- 31.Chong C, et al. Integrated proteogenomic deep sequencing and analytics accurately identify non-canonical peptides in tumor immunopeptidomes. Nat Commun. 2020;11:1293. doi: 10.1038/s41467-020-14968-9. [DOI] [PMC free article] [PubMed] [Google Scholar]
- 32.Johansson HJ, et al. Breast cancer quantitative proteome and proteogenomic landscape. Nat Commun. 2019;10:1600. doi: 10.1038/s41467-019-09018-y. [DOI] [PMC free article] [PubMed] [Google Scholar]
- 33.Laumont CM, et al. Noncoding regions are the main source of targetable tumor-specific antigens. Sci Transl Med. 2018;10 doi: 10.1126/scitranslmed.aau5516. [DOI] [PubMed] [Google Scholar]
- 34.Almeida LG, et al. CTdatabase: a knowledge-base of high-throughput and curated data on cancer-testis antigens. Nucleic Acids Res. 2009;37:D816–819. doi: 10.1093/nar/gkn673. [DOI] [PMC free article] [PubMed] [Google Scholar]
- 35.Simpson AJ, Caballero OL, Jungbluth A, Chen YT, Old LJ. Cancer/testis antigens, gametogenesis and cancer. Nat Rev Cancer. 2005;5:615–625. doi: 10.1038/nrc1669. [DOI] [PubMed] [Google Scholar]
- 36.Andrews LP, Yano H, Vignali DAA. Inhibitory receptors and ligands beyond PD-1, PD-L1 and CTLA-4: breakthroughs or backups. Nat Immunol. 2019;20:1425–1434. doi: 10.1038/s41590-019-0512-0. [DOI] [PubMed] [Google Scholar]
- 37.Qin S, et al. Novel immune checkpoint targets: moving beyond PD-1 and CTLA-4. Mol Cancer. 2019;18:155. doi: 10.1186/s12943-019-1091-2. [DOI] [PMC free article] [PubMed] [Google Scholar]
- 38.Wang J, et al. Fibrinogen-like Protein 1 Is a Major Immune Inhibitory Ligand of LAG-3. Cell. 2019;176:334–347.:e312. doi: 10.1016/j.cell.2018.11.010. [DOI] [PMC free article] [PubMed] [Google Scholar]
- 39.Wei J, Loke P, Zang X, Allison JP. Tissue-specific expression of B7x protects from CD4 T cell-mediated autoimmunity. J Exp Med. 2011;208:1683–1694. doi: 10.1084/jem.20100639. [DOI] [PMC free article] [PubMed] [Google Scholar]
- 40.Jeon H, et al. Structure and cancer immunotherapy of the B7 family member B7x. Cell Rep. 2014;9:1089–1098. doi: 10.1016/j.celrep.2014.09.053. [DOI] [PMC free article] [PubMed] [Google Scholar]
- 41.Zeqiraj E, Filippi BM, Deak M, Alessi DR, van Aalten DM. Structure of the LKB1-STRAD-MO25 complex reveals an allosteric mechanism of kinase activation. Science. 2009;326:1707–1711. doi: 10.1126/science.1178377. [DOI] [PMC free article] [PubMed] [Google Scholar]
- 42.Kim J, et al. CPS1 maintains pyrimidine pools and DNA synthesis in KRAS/LKB1-mutant lung cancer cells. Nature. 2017;546:168–172. doi: 10.1038/nature22359. [DOI] [PMC free article] [PubMed] [Google Scholar]
- 43.Zhang HM, et al. AnimalTFDB 2.0: a resource for expression, prediction and functional study of animal transcription factors. Nucleic Acids Res. 2015;43:D76–81. doi: 10.1093/nar/gku887. [DOI] [PMC free article] [PubMed] [Google Scholar]
- 44.Cancer Genome Atlas Research, N et al. The Cancer Genome Atlas Pan-Cancer analysis project. Nat Genet. 2013;45:1113–1120. doi: 10.1038/ng.2764. [DOI] [PMC free article] [PubMed] [Google Scholar]
- 45.Yang W, et al. Genomics of Drug Sensitivity in Cancer (GDSC): a resource for therapeutic biomarker discovery in cancer cells. Nucleic Acids Res. 2013;41:D955–961. doi: 10.1093/nar/gks1111. [DOI] [PMC free article] [PubMed] [Google Scholar]
- 46.Shackelford DB, Shaw RJ. The LKB1-AMPK pathway: metabolism and growth control in tumour suppression. Nat Rev Cancer. 2009;9:563–575. doi: 10.1038/nrc2676. [DOI] [PMC free article] [PubMed] [Google Scholar]
- 47.Lim SB, Tan SJ, Lim WT, Lim CT. A merged lung cancer transcriptome dataset for clinical predictive modeling. Sci Data. 2018;5:180136. doi: 10.1038/sdata.2018.136. [DOI] [PMC free article] [PubMed] [Google Scholar]
- 48.Ott PA, et al. An immunogenic personal neoantigen vaccine for patients with melanoma. Nature. 2017;547:217–221. doi: 10.1038/nature22991. [DOI] [PMC free article] [PubMed] [Google Scholar]
- 49.Smith CC, et al. Alternative tumour-specific antigens. Nat Rev Cancer. 2019;19:465–478. doi: 10.1038/s41568-019-0162-4. [DOI] [PMC free article] [PubMed] [Google Scholar]
- 50.Camidge DR, Doebele RC, Kerr KM. Comparing and contrasting predictive biomarkers for immunotherapy and targeted therapy of NSCLC. Nat Rev Clin Oncol. 2019;16:341–355. doi: 10.1038/s41571-019-0173-9. [DOI] [PubMed] [Google Scholar]
- 51.Woo SR, et al. Immune inhibitory molecules LAG-3 and PD-1 synergistically regulate T-cell function to promote tumoral immune escape. Cancer Res. 2012;72:917–927. doi: 10.1158/0008-5472.CAN-11-1620. [DOI] [PMC free article] [PubMed] [Google Scholar]
- 52.Parra ER, et al. Immunohistochemical and Image Analysis-Based Study Shows That Several Immune Checkpoints are Co-expressed in Non-Small Cell Lung Carcinoma Tumors. J Thorac Oncol. 2018;13:779–791. doi: 10.1016/j.jtho.2018.03.002. [DOI] [PubMed] [Google Scholar]
- 53.Sica GL, et al. B7-H4, a molecule of the B7 family, negatively regulates T cell immunity. Immunity. 2003;18:849–861. doi: 10.1016/s1074-7613(03)00152-3. [DOI] [PubMed] [Google Scholar]
- 54.Azuma T, et al. Potential role of decoy B7-H4 in the pathogenesis of rheumatoid arthritis: a mouse model informed by clinical data. PLoS Med. 2009;6:e1000166. doi: 10.1371/journal.pmed.1000166. [DOI] [PMC free article] [PubMed] [Google Scholar]
- 55.Simon I, et al. B7-h4 is a novel membrane-bound protein and a candidate serum and tissue biomarker for ovarian cancer. Cancer Res. 2006;66:1570–1575. doi: 10.1158/0008-5472.CAN-04-3550. [DOI] [PubMed] [Google Scholar]
- 56.Wei B, et al. A protein activity assay to measure global transcription factor activity reveals determinants of chromatin accessibility. Nat Biotechnol. 2018;36:521–529. doi: 10.1038/nbt.4138. [DOI] [PubMed] [Google Scholar]
- 57.Courtois G, Morgan JG, Campbell LA, Fourel G, Crabtree GR. Interaction of a liver-specific nuclear factor with the fibrinogen and alpha 1-antitrypsin promoters. Science. 1987;238:688–692. doi: 10.1126/science.3499668. [DOI] [PubMed] [Google Scholar]
- 58.Huang P, et al. Direct reprogramming of human fibroblasts to functional and expandable hepatocytes. Cell Stem Cell. 2014;14:370–384. doi: 10.1016/j.stem.2014.01.003. [DOI] [PubMed] [Google Scholar]
- 59.Simeonov KP, Uppal H. Direct reprogramming of human fibroblasts to hepatocyte-like cells by synthetic modified mRNAs. PLoS One. 2014;9:e100134. doi: 10.1371/journal.pone.0100134. [DOI] [PMC free article] [PubMed] [Google Scholar]
- 60.Xu L, et al. The Kinase mTORC1 Promotes the Generation and Suppressive Function of Follicular Regulatory T Cells. Immunity. 2017;47:538–551.:e535. doi: 10.1016/j.immuni.2017.08.011. [DOI] [PubMed] [Google Scholar]
- 61.Halvorsen AR, et al. TP53 Mutation Spectrum in Smokers and Never Smoking Lung Cancer Patients. Front Genet. 2016;7:85. doi: 10.3389/fgene.2016.00085. [DOI] [PMC free article] [PubMed] [Google Scholar]
- 62.Janne Lehtiö TA, Siavelis Ioannis, Pan Yanbo, Socciarelli Fabio, Berkovska Olena, Umer Husen M, Mermelekas Georgios, Pirmoradian Mohammad, Jönsson Mats, Brunnström Hans, Terje Brustugun Odd, et al. Nature Portfolio Protocol Exchange. 2021 doi: 10.21203/rs.3.pex-1560/v1. [DOI] [Google Scholar]
- 63.Janne Lehtiö TA, Siavelis Ioannis, Pan Yanbo, Socciarelli Fabio, Berkovska Olena, Umer Husen M, Mermelekas Georgios, Pirmoradian Mohammad, Jönsson Mats, Brunnström Hans, Terje Brustugun Odd, et al. Nature Portfolio Protocol Exchange. 2021 doi: 10.21203/rs.3.pex-1562/v1. [DOI] [Google Scholar]
- 64.Janne Lehtiö TA, Siavelis Ioannis, Pan Yanbo, Socciarelli Fabio, Berkovska Olena, Umer Husen M, Mermelekas Georgios, Pirmoradian Mohammad, Jönsson Mats, Brunnström Hans, Terje Brustugun Odd, et al. Nature Portfolio Protocol Exchange. 2021 doi: 10.21203/rs.3.pex-1565/v1. [DOI] [Google Scholar]
- 65.Benjamini Y, Hochberg Y. CONTROLLING THE FALSE DISCOVERY RATE - A PRACTICAL AND POWERFUL APPROACH TO MULTIPLE TESTING. J R Stat Soc Ser B-Stat Methodol. 1995;57:289–300. [Google Scholar]
- 66.Wilkerson MD, Hayes DN. ConsensusClusterPlus: a class discovery tool with confidence assessments and item tracking. Bioinformatics. 2010;26:1572–1573. doi: 10.1093/bioinformatics/btq170. [DOI] [PMC free article] [PubMed] [Google Scholar]
- 67.Butler A, Hoffman P, Smibert P, Papalexi E, Satija R. Integrating single-cell transcriptomic data across different conditions, technologies, and species. Nat Biotechnol. 2018;36:411–420. doi: 10.1038/nbt.4096. [DOI] [PMC free article] [PubMed] [Google Scholar]
- 68.Blondel VD, Guillaume J-L, Lambiotte R, Lefebvre E. Fast unfolding of communities in large networks. Journal of Statistical Mechanics: Theory and Experiment. 2008;2008:P10008. doi: 10.1088/1742-5468/2008/10/p10008. [DOI] [Google Scholar]
- 69.Yu G, Wang LG, Han Y, He QY. clusterProfiler: an R package for comparing biological themes among gene clusters. OMICS. 2012;16:284–287. doi: 10.1089/omi.2011.0118. [DOI] [PMC free article] [PubMed] [Google Scholar]
- 70.Travaglini KJ, et al. A molecular cell atlas of the human lung from single-cell RNA sequencing. Nature. 2020;587:619–625. doi: 10.1038/s41586-020-2922-4. [DOI] [PMC free article] [PubMed] [Google Scholar]
- 71.Liberzon A, et al. The Molecular Signatures Database (MSigDB) hallmark gene set collection. Cell Syst. 2015;1:417–425. doi: 10.1016/j.cels.2015.12.004. [DOI] [PMC free article] [PubMed] [Google Scholar]
- 72.Hanzelmann S, Castelo R, Guinney J. GSVA: gene set variation analysis for microarray and RNA-seq data. BMC Bioinformatics. 2013;14:7. doi: 10.1186/1471-2105-14-7. [DOI] [PMC free article] [PubMed] [Google Scholar]
- 73.Ogata H, et al. KEGG: Kyoto Encyclopedia of Genes and Genomes. Nucleic Acids Res. 1999;27:29–34. doi: 10.1093/nar/27.1.29. [DOI] [PMC free article] [PubMed] [Google Scholar]
- 74.Janne Lehtiö TA, Siavelis Ioannis, Pan Yanbo, Socciarelli Fabio, Berkovska Olena, Umer Husen M, Mermelekas Georgios, Pirmoradian Mohammad, Jönsson Mats, Brunnström Hans, Terje Brustugun Odd, et al. Nature Portfolio Protocol Exchange. 2021 doi: 10.21203/rs.3.pex-1561/v1. [DOI] [Google Scholar]
Associated Data
This section collects any data citations, data availability statements, or supplementary materials included in this article.
Supplementary Materials
Data Availability Statement
The mass spectrometry proteomics data for DDA and DIA analyses have been deposited to the ProteomeXchange Consortium via the PRIDE partner repository with the dataset identifier PXD020191 (DDA discovery cohort), PXD020548 (DIA discovery and late-stage cohorts), and PXD025560 (DIA validation cohort).
For panel sequencing, sequence data has been deposited at the European Genome-phenome Archive (EGA), which is hosted by the EBI and the CRG, under accession number EGAS00001005482.
Previously published proteomics data that was re-analyzed in this study are available in PRIDE with the identifier PXD010429, in iProx Consortium with the subproject ID IPX0001804000 and CPTAC Data Portal (https://cptac-data-portal.georgetown.edu/study-summary/S056).
Previously published gene expression data that were re-analyzed here are available under accession codes GSE60645 and GSE149521, and in ArrayExpress with the identifier E-MTAB-6043. The human [Pan-Cancer Atlas and lung adenocarcinoma (LUAD) gene expression data] data were derived from the TCGA Research Network: http://cancergenome.nih.gov/. The dataset derived from this resource that supports the findings of this study is available at https://gdc.cancer.gov/access-data.
Previously published resource of drug sensitivity in cancer cell lines data are available at https://www.cancerrxgene.org/. Source data for all figures and Extended Data figures have been provided as Source Data files. All other data supporting the findings of this study are available from the corresponding author upon reasonable request.
Custom code for the classifiers (SVM-RFE and k-TSP) can be found at https://github.com/lehtiolab/Code-Availability/tree/main/Lehtio_et_al_Nature_Cancer_2021.


