Abstract
Plasma membrane tension strongly affects cell surface processes, such as migration, endocytosis and signalling. However, it is not known whether membrane tension of organelles regulates their functions, notably intracellular traffic. The ESCRT-III complex is the major membrane remodelling complex that drives Intra-Lumenal Vesicle (ILV) formation on endosomal membranes. Here, we made use of a fluorescent membrane tension probe to show that ESCRT-III subunits are recruited onto endosomal membranes when membrane tension is reduced. We find that tension-dependent recruitment is associated with ESCRT-III polymerization and membrane deformation in vitro, and correlates with increased ILV formation in ESCRT-III decorated endosomes in vivo. Finally, we find that endosomal membrane tension decreases when ILV formation is triggered by EGF under physiological conditions. These results indicate that membrane tension is a major regulator of ILV formation and of endosome trafficking, leading us to conclude that membrane tension can control organelle functions.
Keywords: ESCRT-III, membrane tension, intra-lumenal vesicle ILV, endosomes, ALIX, TSG-101, epidermal growth factor EGF
Introduction
Several lines of evidence indicate that membrane tension regulates basic functions of the plasma membrane, including migration, signalling and endocytosis 1, but much less is known about intracellular membranes. As membrane tension controls the membrane remodelling activities of proteins involved in endocytosis 2–4, one may wonder if the same concept also applies to intracellular membranes.
Activated signalling receptors that need to be down-regulated are ubiquitinated and incorporated via nascent intralumenal vesicles (ILVs) into early endosomes. These form upon deformation of the endosome limiting membrane, giving rise to multivesicular endosomes5. Eventually, ILVs are delivered to lysosomes and degraded together with their cargo of receptors. Receptor sorting into ILVs and ILV formation depend on endosomal sorting complexes required for transport (ESCRT)-0, -I, -II and -III. ESCRT-0 initiates the process by binding both PI3P on the membrane and ubiquitin conjugated to cargo molecules, and recruits ESCRT-I, which in turn recruits ESCRT-II as nucleator for ESCRT-III filaments6,7.
ESCRT-III is thought to exhibit membrane remodelling activity during ILV formation, including membrane fission from inside the ILV neck, and to play essential roles in other membrane fission processes that share the same orientation8–13. Hence, ESCRT-III functions as a general membrane fission machinery with an orientation opposite to endocytosis, away from the cytoplasm.
In vitro, subunits of ESCRT-III were shown to assemble into curved filaments in the form of flat spirals14–16 or helical cylinders17,18, and similar structures were also observed in vivo19–22.
The polymerization of these filaments is proposed to drive the membrane deformation that leads to ILV formation23,24, but the mechanism is still under debate25,26. Membrane deformation could be driven by a buckling transition related to the filaments’ polymerization and elastic properties16 — a transition presumably controlled by membrane tension27. Regardless of the mechanism, increased tension is expected to hinder deformation, and thus polymerization.8–13.
We thus wondered whether membrane tension plays a role in the remodelling of endosomal membranes during multivesicular endosome biogenesis. Here, we monitored endosomal membrane tension using a fluorescent probe, and found that ESCRT-III subunits are recruited onto endosomal membranes when membrane tension is reduced leading to the formation of ILVs containing the EGF receptor. We conclude that the functions of ESCRT-III in ILV formation are controlled by endosomal membrane tension, and thus that membrane tension can control endosome trafficking and organelle functions.
Results
Hypertonic shock triggers CHMP4B membrane recruitment
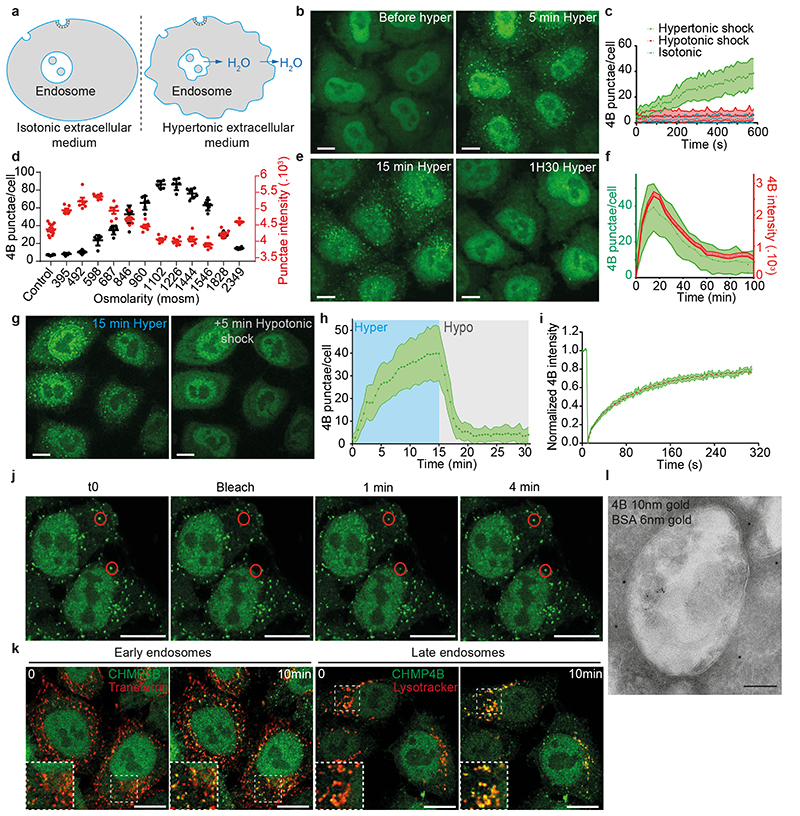
When cells are bathed in a hypertonic solution, the cytoplasmic volume is reduced through water expulsion, causing a plasma membrane tension decrease28. We reasoned that then the endosome volume and membrane tension should also be reduced (see outline Fig 1a), and thus investigated whether hypertonic conditions affected ESCRT-III membrane association, and, if so, whether the process depended on membrane tension. In HeLa-Kyoto cells stably expressing the ESCRT-III subunit CHMP4B-GFP at near-endogenous levels29, CHMP4B-GFP showed a diffuse, nuclear and cytosolic pattern, with few dots presumably corresponding to endosomes (Fig 1b). This distribution changed dramatically after hyperosmotic shock (+0.5M sucrose, final osmolarity ~830mOsm): CHMP4B-GFP relocalized to cytoplasmic punctae (Fig 1b, Movie S1), as did endogenous CHMP4B in HeLa MZ cells (Extended Data Fig.1e). The redistribution was both rapid (Fig 1c, Extended Data Fig.1f) and transient (Fig 1e-f): CHMP4B punctae appeared within minutes after hypertonic shock (Fig 1b-c, e-f), with a maximum at ≈ 20 min (Fig 1f), and then disappeared with slower kinetics (Fig 1e-f, Movie S2). The number and intensity of CHMP4B punctae increased with increasing osmolarity up to a threshold and then decreased (Fig 1d). The best compromise between punctae number and intensity was reached around 900 mOsm — an osmolarity used as hypertonic treatment throughout this study (Fig 1d).
Figure 1. Hypertonic shock triggers fast and transient CHMP4B recruitment on endosomes.
a) Outline of the effect of hypertonic conditions on the cellular and endosomal volumes and membranes. b) Confocal projections of HeLa cells stably expressing CHMP4B-GFP before and after a 5min incubation with a hypertonic solution (~900 mOsm). Image representative of 3 experiments. Bars: 10 μm. c) Average number of CHMP4B punctae per cell with time after hypertonic (~900 mOsm), isotonic (~330 mOsm) or hypotonic (~250 mOsm) shocks. Shaded areas: mean ± SEM (N=27 (hyper), 30 (iso) and 31 (hypo) cells from 3 independent replicates). d) Number per cell (black) and intensity (red) of CHMP4B-GFP punctae after 10min incubation under hypertonic conditions at different osmolarities (Mean±SEM, N= 6 wells, each dot on the graph is the mean of an individual well. Analysis by automated microscopy with a total of 180 fields per condition and 10-40 cells per field). e) Confocal projections of CHMP4B-GFP HeLa cells for later time points (15 and 90 min) after hypertonic shock. Image representative of 3 experiments. Bars: 10 μm. f) Mean intensity of CHMP4B punctae (Red curve, red shaded area: SEM) and average number of CHMP4B punctae per cell (green curve, green shaded area: SD) over 100 min. (N=22 cells, 3 independents replicates. g) Representative confocal projections of one experiment quantified in (h). Image representative of 3 experiments. Bars: 10 μm. h) Average number of CHMP4B-GFP punctae per cell during a 15min hypertonic shock (~800 mOsm, Blue) followed by 15min of hypotonic shock (~250 mOsm, grey). Shaded area: SD (N=47 cells from 3 independent replicates). i) Mean fluorescence recovery curve after photobleaching of CHMP4B-GFP punctae, fitted with a double exponential (dotted line). Shaded area: SEM (N=33 punctae from 3 independent replicates). j) Representative confocal images of one experiment quantified in (i). Image representative of 3 experiments. Bars: 5 μm. k) Representative confocal images of Hela-CHMP4B-GFP cells incubated for 10min with Transferrin-Alexa594 or labelled with lysotracker and then subjected to a hypertonic shock. Image representative of 2 experiments. Bars: 10 μm. l) BSA-gold (6nm) was endocytosed for 15min followed by a 10min hypertonic shock. Cells were processed for immuno-electron microscopy using anti CHMP4B antibody followed by 10nm ProteinA-gold. Bar: 100 nm.
By contrast, hypotonic or isotonic medium did not trigger CHMP4B relocalization (Fig 1c and Extended Data Fig.1c). Relocalization was not dependent on the chemical nature of the osmolyte (Extended Data Fig.1b). Furthermore, the disappearance of CHMP4B punctae could be accelerated by replacing the hypertonic medium with isotonic (Extended Data Fig.1j) or even more so hypotonic medium (Fig 1g-h).
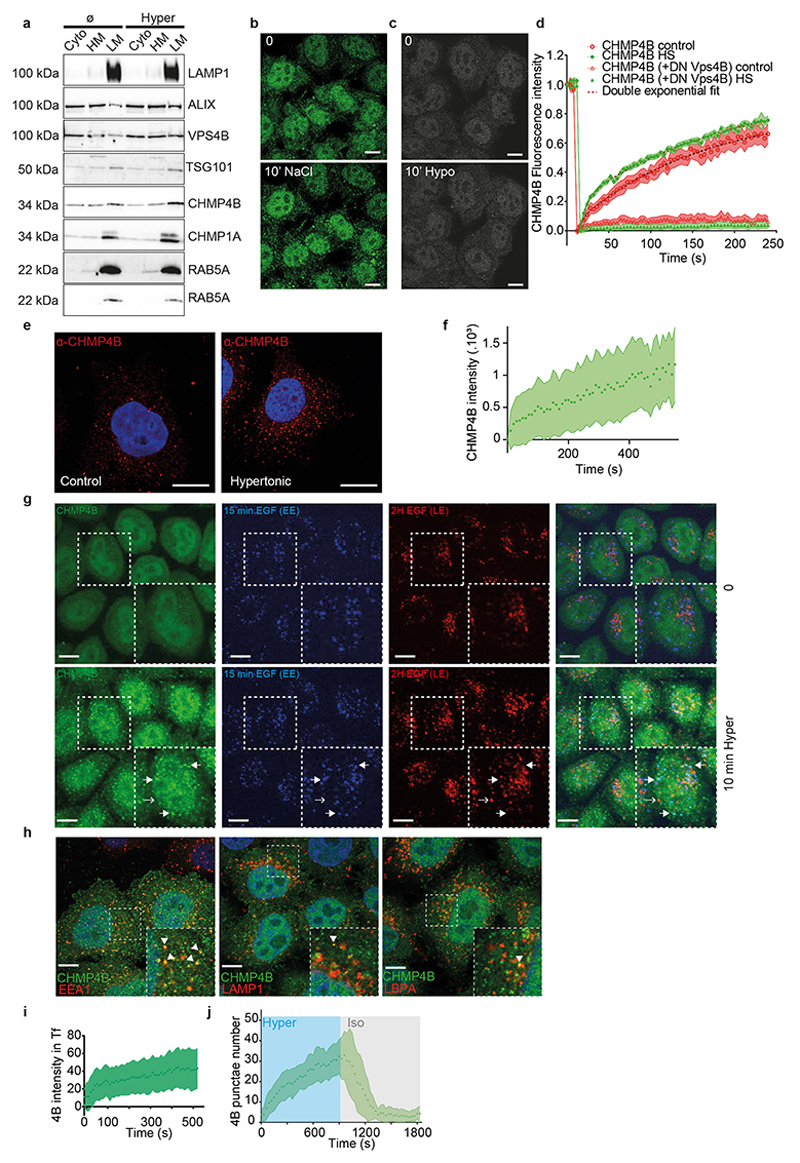
These punctae were not CHMP4B aggregates, as after photobleaching CHMP4B fluorescence recovered to ≈ 80% of the initial value with a t1/2 ≈ 1 min (Fig 1i-j), showing that subunits were readily exchanged with cytosolic CHMP4B. Moreover, this fast turnover was inhibited by a dominant negative mutant of VPS4 (Figure S1d), suggesting that CHMP4B punctae observed after hypertonic shock are functional assemblies of ESCRT-III. Indeed, Vps4-dependent high-turnover of ESCRT-III subunits is associated with functionality of ESCRT-III assemblies30. We conclude that hypertonic conditions stimulated the rapid and transient recruitment of ESCRT-III onto cytoplasmic structures.
After hypertonic shock CHMP4B is recruited on endosomes via nucleators
We next wondered whether these structures were endosomes. Indeed, CHMP4B after hypertonic shock colocalized with a pulse of internalized transferrin (Fig 1k) or EGF (Extended Data Fig.1g) on early endosomes, and with lysotracker, which labels acidic compartments (Fig 1k). Similarly, CHMP4B colocalized partially with the early endosomal marker EEA1 (Figure s1k) and the late endosomal markers LAMP1 and lysobisphosphatidic acid (LBPA) (Extended Data Fig.1h) or with EGF chased to late endosomes (Extended Data Fig.1g). Consistently, subcellular fractionation showed that CHMP4B was increased in endosomal membrane fractions after hypertonic shock (Extended Data Fig.1a). Finally, immunogold-labelling of cryo-sections showed that, after hypertonic shock, the limiting membrane of endosomes containing BSA-gold endocytosed for 15min was decorated with CHMP4B antibody (Fig 1l, Extended Data Fig.2a).
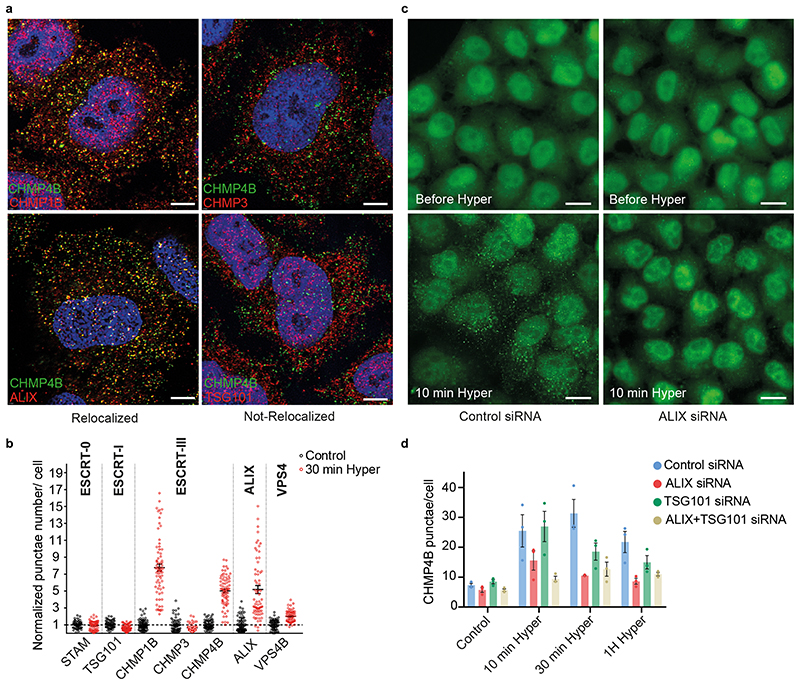
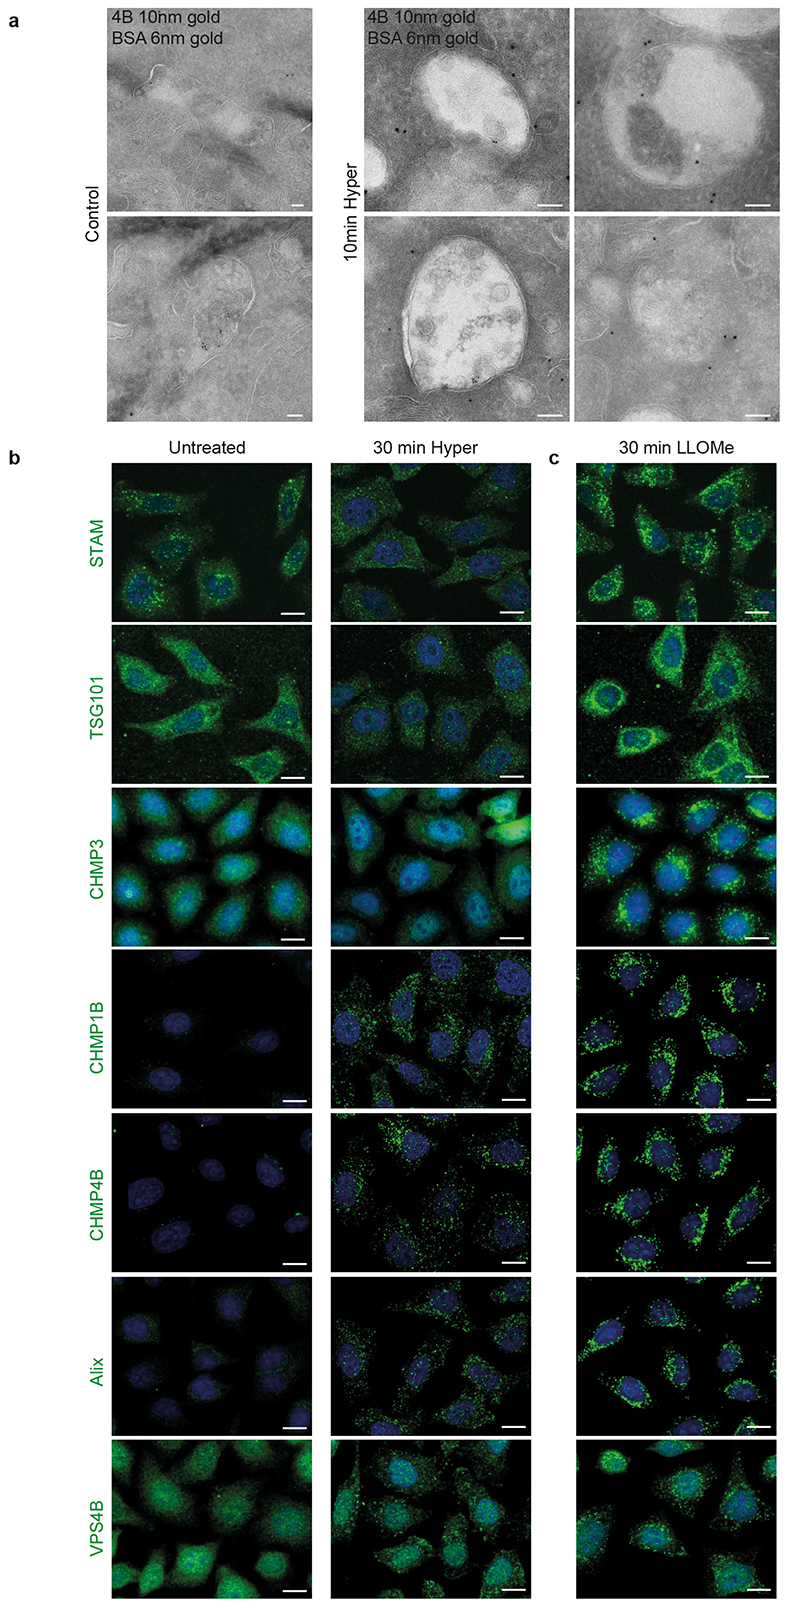
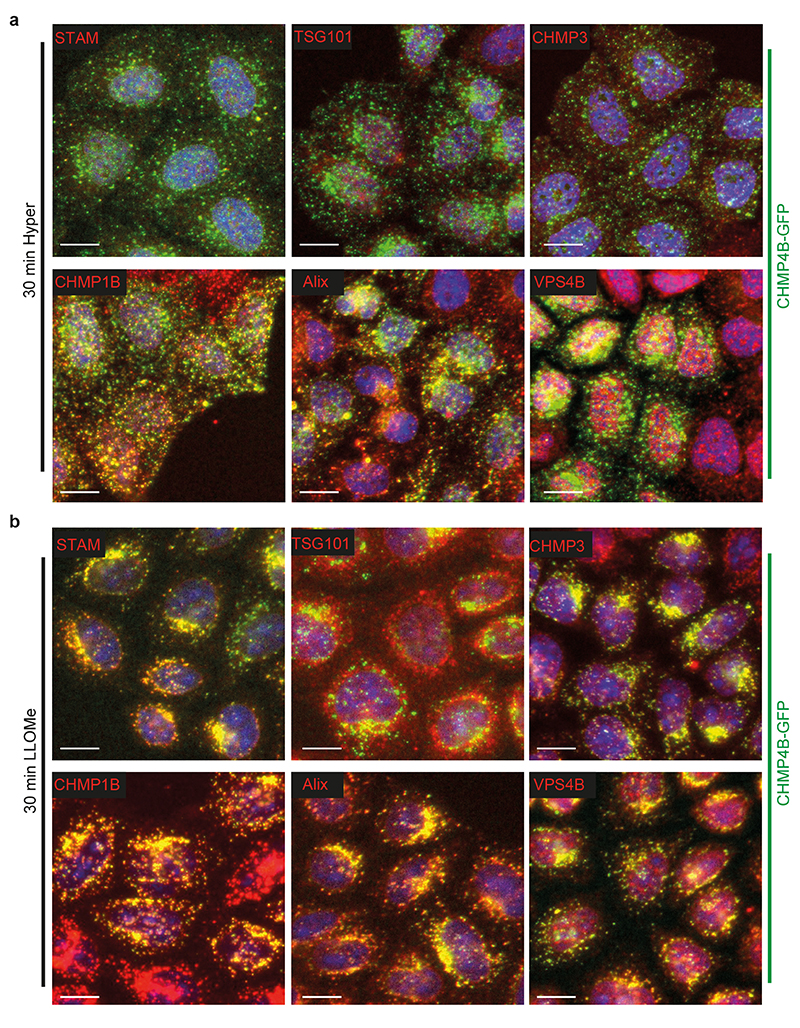
Another ESCRT-III subunit CHMP1B, but not CHMP3, showed an enhanced punctate distribution, as did VPS4 (Fig 2a-b; Extended Data Fig.2b, Extended Data Fig.3a), demonstrating that most ESCRT-III subunits were recruited onto endosomes after hypertonic shock. ESCRT recruitment was not caused by ESCRT-dependent membrane repair pathway triggered by damage to endo-lysosomal membranes, since endo-lysosomes remained intact after hypertonic shock (Fig 1k compare with LLOMe treatment in Extended Data Fig.5f).
Figure 2. Specificity for ESCRT subunits relocalization following hypertonic shock.
a) Confocal immunofluorescence images showing colocalization between CHMP4B-GFP and indicated ESCRT subunits after 10min hypertonic shock. Image representative of 4 experiments. Bars: 4 μm. b) Quantification of punctae number per cell from automated confocal images of immunofluorescence before (black) and after 30min hypertonic shock (red) for various markers. Bars are mean±SEM. One dot corresponds to the average number of punctae per cell in one field of view (N values are from 3 independent experiments: STAM, STAM hyper and VPS4B: 60 fields; VPS4B hyper: 61 fields; TSG101 hyper, CHMP4B and CHMP3: 71 fields; others: 72 fields; 10-40 cells per field) normalized to the average number before shock (black). c) Confocal convolved images of CHMP4B-GFP HeLa cells before and after 10min hypertonic shock, pre-treated with anti-ALIX siRNAs or control siRNAs against VSV-G. Image representative of 3 experiments. Bars: 15 μm. d) Mean number of CHMP4B punctae per cell, for cells treated with control siRNAs or siRNAs against ALIX, TSG101 or both, before and after hypertonic shocks of various duration. (N=3 independent replicates represented by dots on the graph with mean±SEM. Analysis by automated microscopy with a total of 72 fields per condition and10-40 cells per field.)
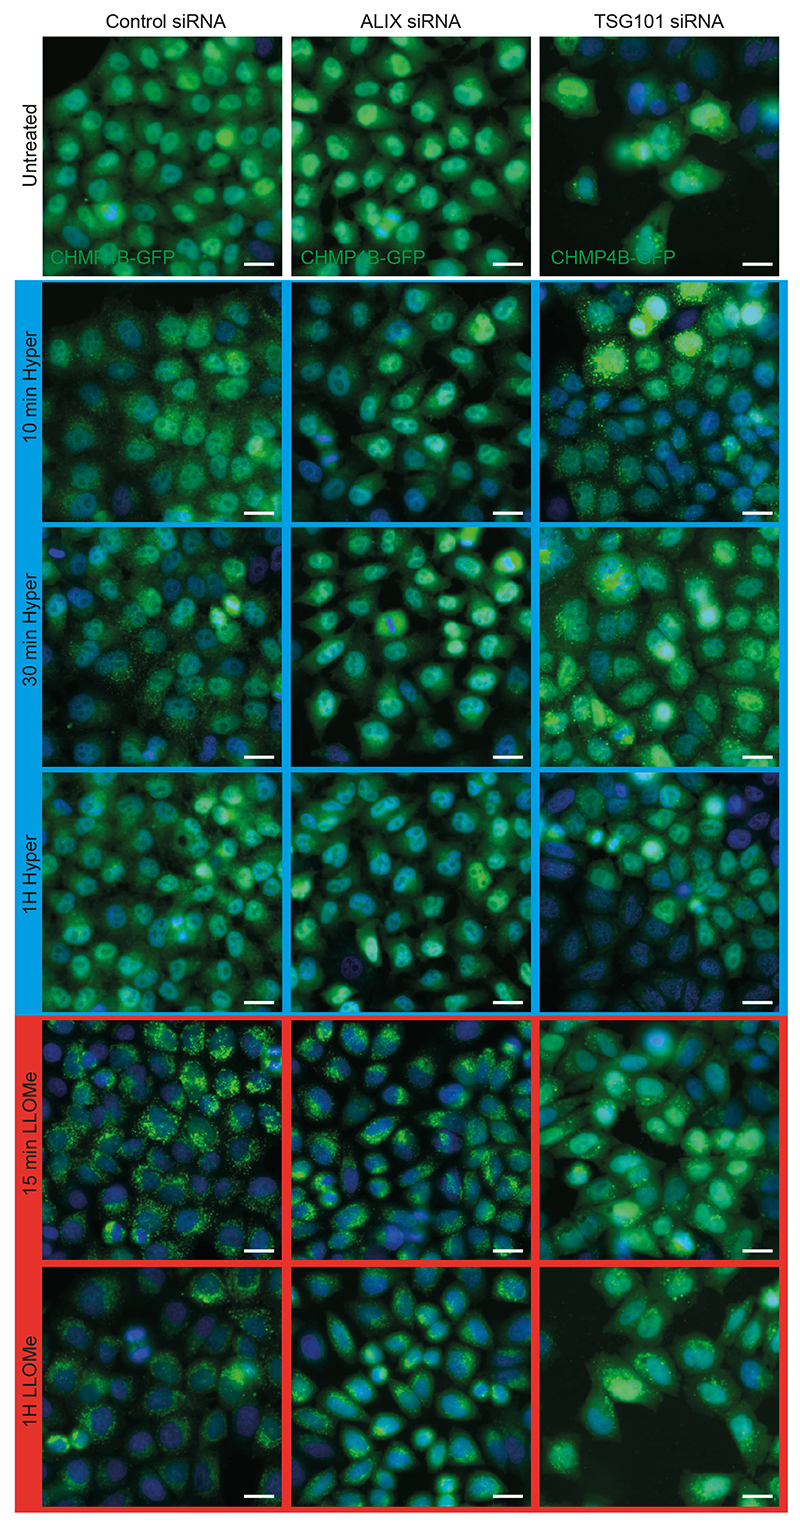
ESCRT-0, -I and -II promote ESCRT-III nucleation6,7, as does the ESCRT-associated protein ALIX13,31. We thus wondered whether ESCRT-III relocalization depended on its nucleators. The components of ESCRT-0 and ESCRT-I, STAM and TSG101 respectively, were not significantly recruited suggesting that those complexes remained largely unaffected after hypertonic shock (Fig 2a-b, Extended Data Fig.2b, Extended Data Fig.3a). By contrast, ALIX was efficiently recruited onto endosomes after hypertonic shock (Figure 2a-b, Extended Data Fig.2b, Extended Data Fig.3a), and ALIX knockdown partially inhibited CHMP4B membrane recruitment (Fig 2c-d; Extended Data Fig.4) showing that the process depends on ALIX. This agrees well with our recent observations that ALIX acts as CHMP4B nucleator on endosomes32. While TSG101 depletion only slightly reduced CHMP4B recruitment (Fig 2d, Extended Data Fig.4), the double ALIX-TSG101 knockdown inhibited CHMP4B membrane recruitment more efficiently at least at early time-points (Fig 2d), consistent with the view that ALIX and TSG101 function in parallel pathways33,34. Presumably, ALIX, and to a lesser extent TSG101, was recruited on endosomes via interactions with partner lipid and protein32–34. Upon changes in osmolarity, ALIX not only recruited ESCRT-III subunits but was also stabilized onto membranes via the assembly of ESCRT-III filaments. In fact, the constitutively active form of ALIX, deltaPRR-ALIX, accumulates onto endosomes along with ESCRT-III, in an ESCRT-III-dependent manner32. Altogether, these data indicate that hypertonic conditions cause the selective recruitment and polymerization of ESCRT-III subunits onto endosomal membranes through their physiological nucleators.
Endosome volume and membrane tension decreases are coupled
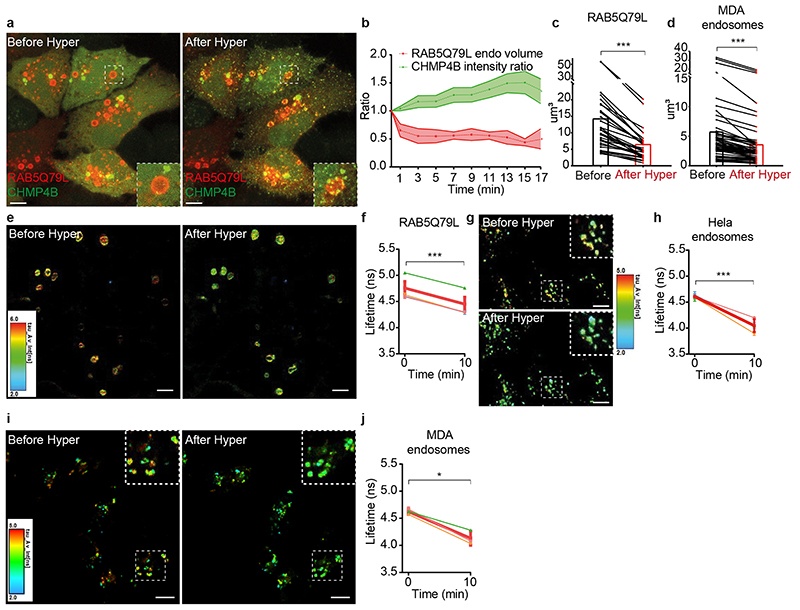
Next, we investigated whether hypertonic conditions would also reduce the endosome volume and in turn membrane tension (see outline Fig 1a). In order to measure the volume of individual endosomes, enlarged early endosomes were generated upon transfection with the active RAB5 mutant RAB5Q79L. Upon hypertonic shock, CHMP4B relocalizes onto defined ESCRT domains35,36 of the large endosomes (Fig 3a-b). Strikingly, hypertonic conditions decreased the RAB5Q79L endosome volume by more than 50% (Fig 3b-c). Note that the volume change occurs faster than CHMP4B accumulation (Fig 3a-b), due to slower nucleation and polymerization processes. The endosomal volume also decreased by ≈40% after hypertonic shock in non-transfected MDA-MB-231 cells with intrinsically large endosomes (Fig 3d). Changes in endosomal volumes are highly unlikely to result from alterations in the endocytic membrane flux, since hypertonic conditions are known to stop endocytic membrane transport37,38.
Figure 3. Hypertonic shock decreases membrane tension of endosomes.
a) Maximum projection of confocal images of HeLa-CHMP4B-GFP cells expressing mCherry-Rab5Q79L before and after a 20min hypertonic shock. Image representative of 3 experiments. Bars: 5 μm. b) Average volume of Rab5Q79L endosomes (red curve, shaded area is SD) and average intensity of CHMP4B-GFP (green curve, shaded area is SD) after hypertonic shock (time 0), and normalized to initial value. (shaded areas are SD from N=6 representative RAB5Q79L endosomes). c) Volumes of single RAB5Q79L endosomes before (black) and after a 10min hypertonic shock (red) (N=30 endosomes from 3 independent replicates, two-tailed Wilcoxon test: P=0.0000000019). d) Volumes of single MDA-MB-231 endosomes labeled with FM4-64 before (black) and after (red) a 10min hypertonic shock. (N=52 endosomes from 3 independent replicates, two-tailed Wilcoxon test: P<10-15). e) FLIM images of FliptR-labelled mCherry-RAB5Q79L endosomes in live HeLa MZ cells before and after a 10min hypertonic shock. Bars: 5 μm. f) FliptR lifetime measurements from 4 independent experiments as shown in (e). Thin coloured lines: single experiments; thick red line: mean±SEM of the 4 experiments (two-tailed paired t-test: P=0.0003338778). g) FLIM images of HeLa endosomes labelled with Lyso Flipper before and after 10min hypertonic shock. Bars: 10 μm. h) Lyso Flipper lifetime measurements from (g) before and after hypertonic shock. Thin coloured lines: 5 independents experiments; thick red line: mean with SEM (two-tailed paired t-test: P=0.00000884003). In f and h for each experiment, average fluorescent lifetimes were calculated from >500 endosomes taken from at least 3 different cells. i) Representative FLIM images of endosomes in MDA cells stained with Lyso-Flipper before and after hypertonic shock. Image representative of 3 experiments. Bars: 10 μm j) The graph shows the quantification of these experiments where each thin line is an individual experiment (with at least 3 cells and several dozens of endosomes) and the thick line the mean of these 3 experiments. Error bars represent SEM. (two-tailed paired t-test: P= 0.0217491697).
We then investigated whether the decrease in endosomal volume was correlated with a decrease in membrane tension (Fig 1a). To this end, we used FliptR (Fluorescent lipid tension Reporter, also called Flipper-TR), a probe that reports changes in membrane tension by changes in fluorescence lifetime28,39. In cells expressing RAB5Q79L incubated for 2h at 37°C with FliptR in order to label endosomes, FliptR fluorescence lifetime decreased after hypertonic shock (Fig 3e-f), correlating well with the observed decrease in endosomal volume (Fig 3a-c). Decrease in membrane tension upon hypertonic shock was also observed in non-transfected cells (HeLa MZ cells: Fig 3g-h; MDA-MD-231 cells: Fig 3i-j) using a modified FliptR called Lyso Flipper that targets acidic compartments39. These observations suggest that hypertonicity reduced membrane tension of endosomes by deflating them, which in turn may trigger ESCRT-III recruitment. Alternatively, hypertonic conditions may also trigger ESCRT-III recruitment by increasing the cytosolic concentration of its subunits. We thus investigated whether membrane tension could be decreased without changing cytosolic concentrations.
LLOMe-mediated endosome perforation reduces membrane tension and recruits CHMP4B
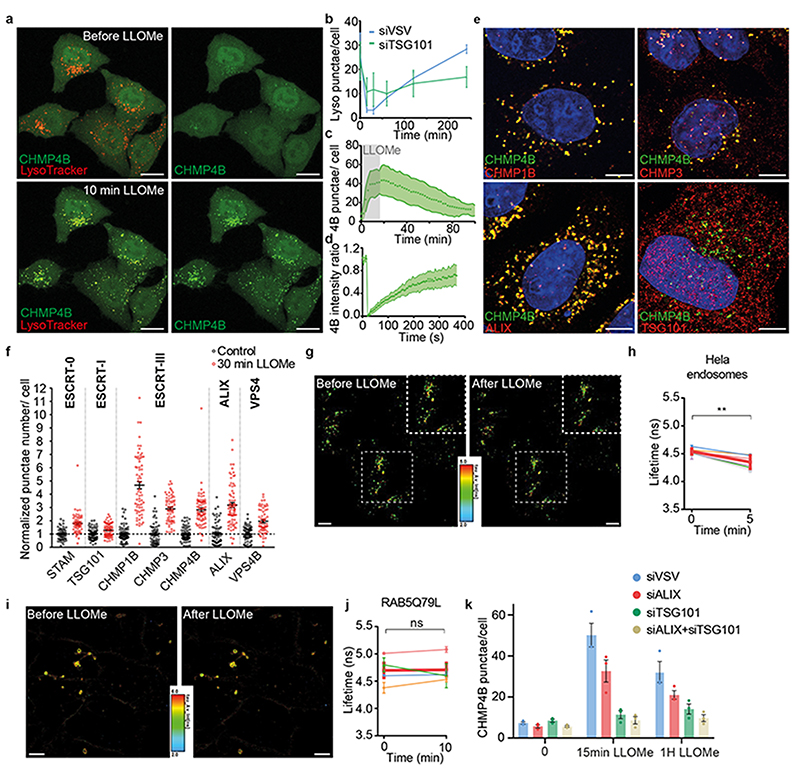
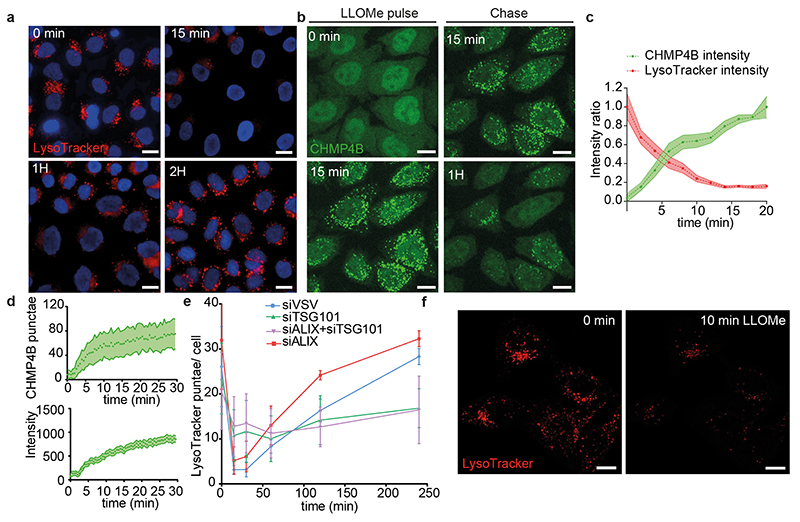
We reasoned that tension may also decrease upon membrane damage. To this end, we used the small peptide LLOMe (L-Leucyl-L-Leucine methyl ester), which transiently permeabilizes late endosomes and lysosomes40 as illustrated by the rapid neutralization of the endo-lysosomal pH followed by a slower recovery, almost complete after 2h (Fig 4a-b, Extended Data Fig.5a, f, Movie S3). Treatment with LLOMe caused fast recruitment of CHMP4B-GFP (Fig 4a, c-e, Extended Data Fig.5b-d, Movie S3–S4) onto late endocytic compartments — much like hypertonic conditions (compare Fig 1f with Fig 4c). The effects of LLOMe were transient and followed by re-acidification (Fig 4b, c and Extended Data Fig.5a-e) in good agreement with reports13,31 that ESCRT-III-mediated lysosome repair precedes lysophagy and promotes cell survival31.
Figure 4. LLOMe-induced endosomal damages decreases membrane tension and triggers ESCRT recruitment for reparation.
a-b) Maximum projection of confocal images of live HeLa-CHMP4B-GFP cells labelled with LysoTracker before and after a 10min incubation with 0.5mM LLOMe. Image representative of 2 experiments. Bars: 10 μm. In (b) cells were pre-treated with control siRNAs (VSV, blue) or siRNAs against TSG101 (green). Average number of LysoTracker punctae per cell. N= 3 independent replicates, mean±SD. Analysis by automated microscopy with a total of 56 fields per condition and 10-40 cells per field. c) Average number of CHMP4B-GFP punctae per cell with time, during and after LLOMe treatment. Shaded area: SEM (N=51 cells from 3 independent replicates). d) Recovery after photobleaching of individual CHMP4B-GFP punctae induced by LLOMe treatment. Shaded area: SEM. (N=18 endosomes from 3 independent replicates). e) Confocal images of immuno-fluorescence against several markers after 10min incubation with LLOMe treatment. Image representative of 3 experiments. Bars: 4 μm. f) Number of punctae per cell for different ESCRT subunits before (black) and after LLOMe treatment (red). Each dot represents the mean number of ESCRT punctae/cell in one field of view. Bars are mean±SEM (N values for 3 independent experiments are respectively: STAM, STAM LLOMe and VPS4B: 60 fields; VPS4B LLOMe: 61 fields; CHMP1B LLOMe: 68 fields; TSG101 LLOMe: 70 fields; CHMP4B and CHMP3: 71 fields; others: 72 fields. In all cases: 10-40 cells per field. g) FLIM images of endosomes in Hela MZ cells stained by Lyso Flipper before and after 0.5 mM LLOMe treatment. Image representative of 6 experiments. Bars: 10 μm. h) Lyso Flipper lifetime measurements before and 5min after LLOMe addition (quantification as in Figure 3f). Thin coloured lines: 6 independent experiments; thick red line: mean with SEM (two-tailed paired t-test: P=0.00454651). For each experiment, average fluorescent lifetimes were calculated from >500 endosomes taken from at least 3 different cells. i) FLIM images of RAB5Q79L endosomes in Hela MZ cells stained after a 2h incubation with FliptR before and after 0.5 mM LLOMe treatment. Images representative of 4 experiments. Bars: 10 μm. j) FliptR lifetime measurements of RAB5Q79L endosomes before and 10min after LLOMe treatment (lifetime was measured as in Figure 3f). Thin coloured lines: 4 independents experiments; thick red line: mean with SEM (two-tailed paired t-test: P=0.89443). k) Average number of CHMP4B-GFP punctae per cell before (control) and after treatment with LLOMe in cells transfected with control siRNAs (siVSV) or siRNAs against ALIX, TSG101 or both ALIX and TSG101. Error bars are SEM. N=3 independent replicates represented by dots on the graph with mean±SEM. Analysis by automated microscopy with a total of 72 fields per condition, with 10-40 cells per field.
As observed under hypertonic conditions, CHMP1B, ALIX and VPS4B were recruited onto endosomal membranes by LLOMe, but other subunits of ESCRT-0, ESCRT-I or ESCRT-III (CHMP3) were also recruited to varying extents (Fig 4e-f vs Fig 2a-b and Extended Data Fig.2c, Extended Data Fig.3). Much like after hypertonic shock, Lyso Flipper lifetime decreased after LLOMe treatment, indicating that endosomal membrane tension decreased (Fig 4g-h). By contrast, the membrane tension of RAB5Q79L early endosomes was not affected by LLOMe (Fig 4h-j), consistent with the fact that LLOMe selectively targets late and acidic endo-lysosomes40.
Depletion of TSG101 by RNAi prevented both CHMP4B recruitment (Fig 4k, Extended Data Fig.4) and re-acidification (Fig 4b, Extended Data Fig.5e) in LLOMe-treated cells, confirming that ESCRT-III recruitment is required to repair membrane damage. Altogether, these data indicate that ESCRT-III is recruited onto late endosomes, presumably because membrane tension was relaxed after damage. However, it is also possible that the membrane pores generated by LLOMe directly recruit ESCRT-III rather than decreased tension. We thus searched for a direct approach to show that a decrease in membrane tension promotes ESCRT-III assembly.
In vitro reconstitution of tension-dependent, CHMP4B membrane recruitment
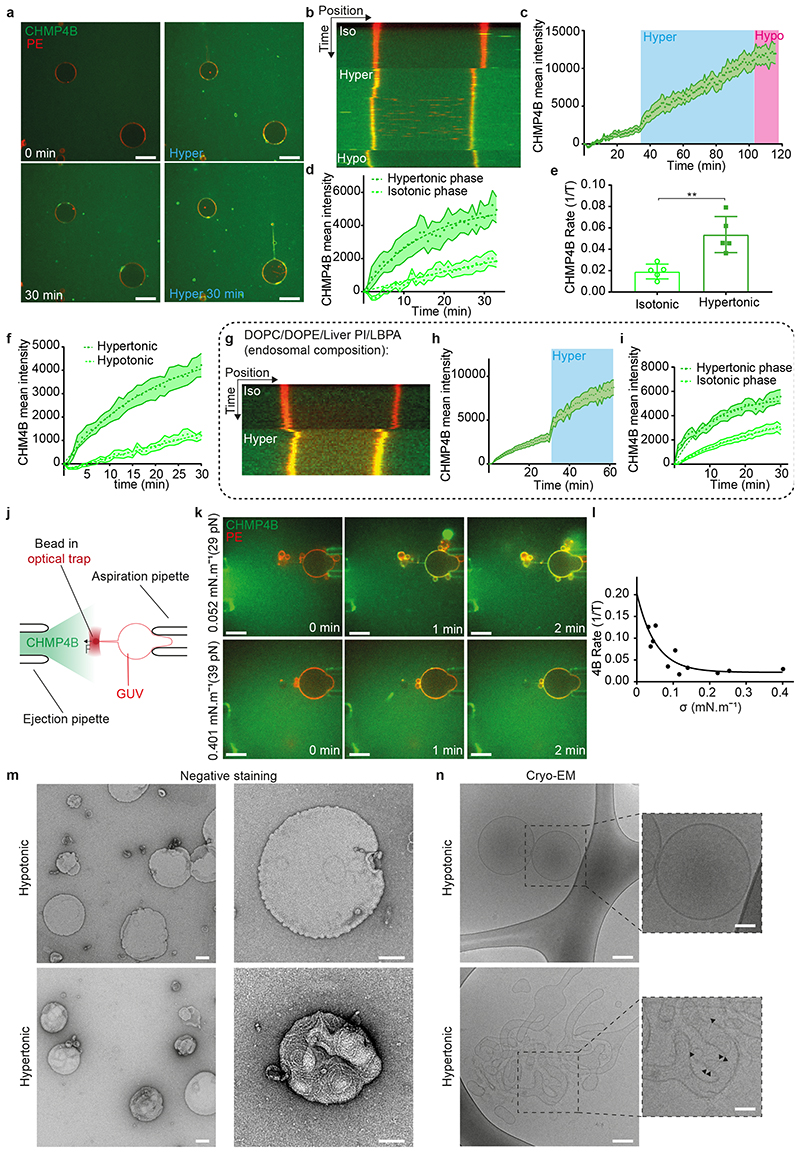
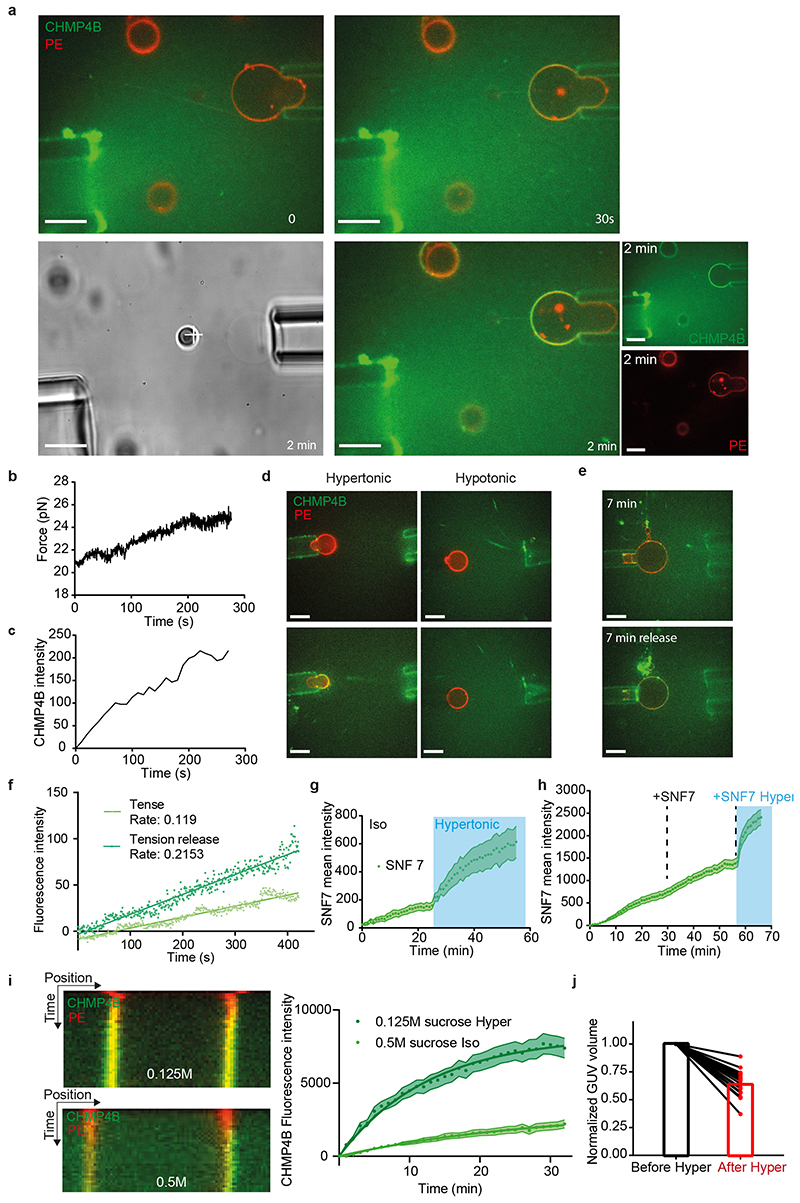
To this end, we used a simplified system that by-passes the need for some regulatory factors and nucleators, and is amenable to direct bio-physical manipulations and measurements, namely purified, recombinant human CHMP4B labelled with Alexa 488 and giant unilamellar vesicles (GUVs), as model membranes. The GUV lipid composition was dioleoyl-phosphatidylcholine (DOPC):dioleoyl-phosphatidylserine (DOPS) [60:40 Mol%] — the negatively charged lipid DOPS being required for CHMP4B association to the bilayer16. Upon incubation with 1μM CHMP4B under isotonic conditions (250mOsm), CHMP4B was detected on the bilayer after 30min, consistent with the relatively slow kinetics of nucleation and filament growth16 (Fig 5a-c). Replacement of isotonic with hypertonic solution (500mOsm) caused a 35% decrease of GUV volume (Extended Data Fig.6j) and a three-fold increase in the rates of CHMP4B association to the GUV (Fig 5a-e, Movie S5) — these rates can be extracted from exponential fits (Fig 5e). This increase in the binding and polymerisation rate was not due to some side effects of sucrose addition and was only caused by a change in osmotic pressure (Extended Data Fig.6i). Rapid and efficient association of CHMP4B to the bilayer was also observed when using GUVs prepared with the phospholipid composition of late endosomes enriched in LBPA (DOPC:DOPE:PI:LBPA - 5:2:1:2: molar ratio)41 (Fig 5g-i), in agreement with our recent in vitro observations that ALIX recruits CHMP4B onto LBPA-containing membranes with the late endosome lipid composition32. By contrast, almost no CHMP4B binding was observed under hypotonic conditions (Fig 5f, Extended Data Fig.6d). Moreover, following the hypertonic treatment, a hypotonic solution significantly reduced CHMP4B binding (Fig 5b-c), further demonstrating the role of osmotic pressure in the recruitment process. Similar results were obtained with Snf7, the yeast CHMP4 homologue (Extended Data Fig.6g-h). These data show that hyperosmotic conditions stimulate membrane binding of CHMP4B in vitro, much like on endosomes in vivo.
Figure 5. A decrease in membrane tension increases CHMP4B polymerisation rate in vitro.
a) Time-lapse confocal images rhodamine-PE labelled GUVs (red) were mixed (0min) with 1 μM CHMP4B-Alexa488 (green), and incubated first in isotonic (250mOsm, 0-30min, white captions) and then in hypertonic (500 mOsm, 0-30min, blue captions) solutions. Image representative of 5 experiments. Bars: 20 μm. b-c) Following experiment shown in (a), GUVs were switched to a hypotonic solution (200 mOsm) for 15min. b) shows a kymograph (representative of 5 experiments) and c) the mean intensity of CHMP4B on the bilayer over time; shaded area: SEM (N=13 GUVs). d) CHMP4B-Alexa488 mean intensity with time on the GUV and their exponential fit during isotonic and hypertonic phases extracted from (c). e) Binding rates extracted from single exponential fits to data as shown in d) (N=5). Each point represents a single experiment, for which 3-13 GUVs were analysed. (two-tailed paired t-test: P=0.0021). f) CHMP4B-Alexa488 mean intensity on GUVs under hypotonic (N=10 GUVs) and hypertonic conditions (N=8 GUVs) ; shaded area: SEM. Binding rates are: hypotonic, 1/τ=0.0053 (±0.009150) s-1; hypertonic, 1/τ=0.05067 (±0.004313) s-1. g) Kymograph (representative of 4 experiments) of the same experiments as in (a) but with the indicated lipid composition (DOPC:DOPE:LiverPI:LBPA, [5:2:1:2]). h) Mean intensity of CHMP4B-Alexa488 on the bilayer over time; shaded area: SEM (N=44 GUVs in 4 experiments). i) CHMP4B-Alexa488 mean intensity with time on the GUV and their exponential fit during isotonic and hypertonic phases extracted from (h). Binding rates are: Isotonic, 1/τ=0.03111 (±0.002583) s-1; hypertonic, 1/τ=0.1014 (±0.009605) s-1. Shaded area: SEM (N=44 GUVs in 4 experiments) j) Schematic representation of the tube pulling setup used in this study. k) The membrane tension of Rhod-PE GUVs (red) was adjusted using a micropipette, and measured by pulling a membrane tube with optical tweezers, while an isotonic solution containing CHMP4B (green) was injected (see also Extended Data Fig.6). Time-lapse confocal images show CHMP4B membrane association at low (upper panel), and high membrane tension (lower panel). Image representative of 10 experiments. Bars: 10 μm l) CHMP4B binding rates (1/τ) plotted against membrane tension, as obtained from several GUVs (one per dot). A single exponential decay (black curve) was fitted (R2=0.76). m) Negative stain electron micrographs of LUVs incubated with 1μM CHMP4B for 2h in a hypotonic (upper panels) or hypertonic solution (lower panels) at low (left panels) and high (right panels) magnification (Bars: 100 nm). Image representative of 2 experiments. Bars: 100 nm. n) Cryo-electron micrographs of LUVs in hypotonic and hypertonic conditions: CHMP4B filaments can be observed under hypertonic conditions (black arrowheads). Bars: left panels, 50 nm; right panels: 25 nm. Image representative of 2 experiments.
To change membrane tension without changing osmolarity, we controlled tension by aspirating GUVs with micropipettes and monitored CHMP4B membrane binding rates (see outline in Fig 5j), while an isotonic solution containing CHMP4B was injected. Then, the aspiration pressure was decreased in order to decrease membrane tension (see Extended Data Fig.6e). The decrease in membrane tension nicely correlated with an almost two-fold increase in CHMP4B binding rate (Extended Data Fig.6f). Finally, the dependence of CHMP4B binding rate on tension was quantified directly. Membrane tension was measured by pulling membrane tubes from GUVs16 using optical tweezers4 (Fig 5j-k). The relationships between CHMP4B binding and the force exerted on the bead confirm what was previously shown with SNF716 (Extended Data Fig.6a-c). The rate of CHMP4B polymerisation inversely correlated with membrane tension. An exponential-fit revealed that above a threshold tension of 0.1 mN.m-1, the rate of CHMP4B polymerization onto the bilayer was severely reduced (Fig 5k-l). Presumably, membrane tension is brought below this threshold value after hypertonic shock in vivo, since the fluorescence life-time of the probes drops by 0.3-0.5 ns (Fig 3f and Fig 4g), reaching values corresponding to tensions below 0.1 mN/m when using the lifetime/tension calibration curve established previously with FliptR28. Interestingly, this threshold value of ~0.1 mN.m-1 is similar to Chmp4B/Snf7 polymerization energy16, suggesting that tension could directly compete with CHMP4B polymerization27.
Coupling of CHMP4B polymerization with membrane deformation upon membrane tension reduction in vitro
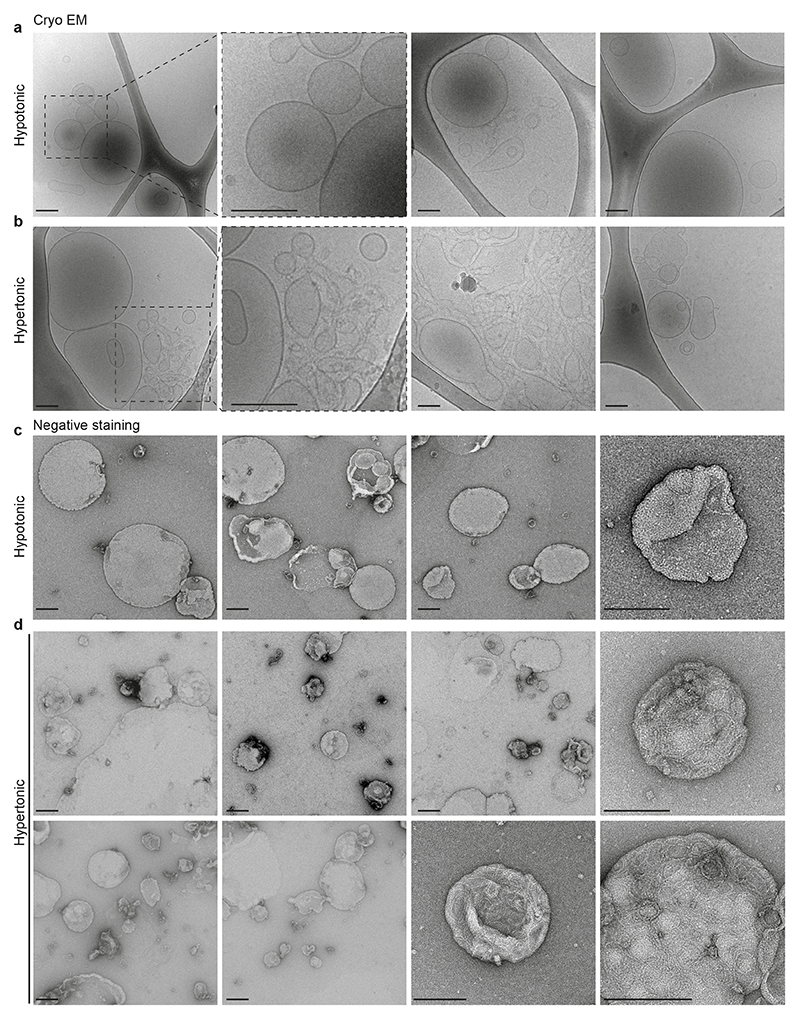
To visualize CHMP4B oligomers onto the membrane under varying osmotic conditions, large unilamellar vesicles (LUVs) were incubated with 1μM CHMP4B, and analysed by electron microscopy after negative staining. Under hypertonic conditions, CHMP4B formed spirals (Fig 5m; Extended Data Fig.7d), resembling the spirals formed by Snf7 in vitro16, and observed with CHMP4B in vivo19. Such spirals were rarely observed under isotonic conditions and almost never under hypotonic conditions (Fig 5m; Extended Data Fig.7c). These data further confirmed that CHMP4B membrane polymerization is facilitated by a decrease in membrane tension. We hypothesized that membrane deformation coupled to ESCRT-III polymerization is energetically more favourable when membrane tension is low16. In this case, one would expect CHMP4B polymerization to cause membrane deformation.
When analysed by cryo-electron microscopy, CHMP4B-decorated LUVs showed regularly spaced filaments on the bilayer after incubation under hypertonic conditions, but almost never observed under hypotonic conditions (Fig 5n). Importantly, tubular and vesicular deformations, covered with CHMP4B filaments could be observed in hypertonic solutions, while essentially absent under hypotonic conditions (Fig 5n, Extended Data Fig.7a-b). Furthermore, LUVs that were not decorated by filaments – even in hypertonic conditions – were not deformed (Fig 5n, Extended Data Fig.7a-b). This strongly supports the view that a decrease in membrane tension facilitates membrane deformation by ESCRT-III polymerization.
Tension-induced CHMP4B recruitment triggers ILV formation in vivo
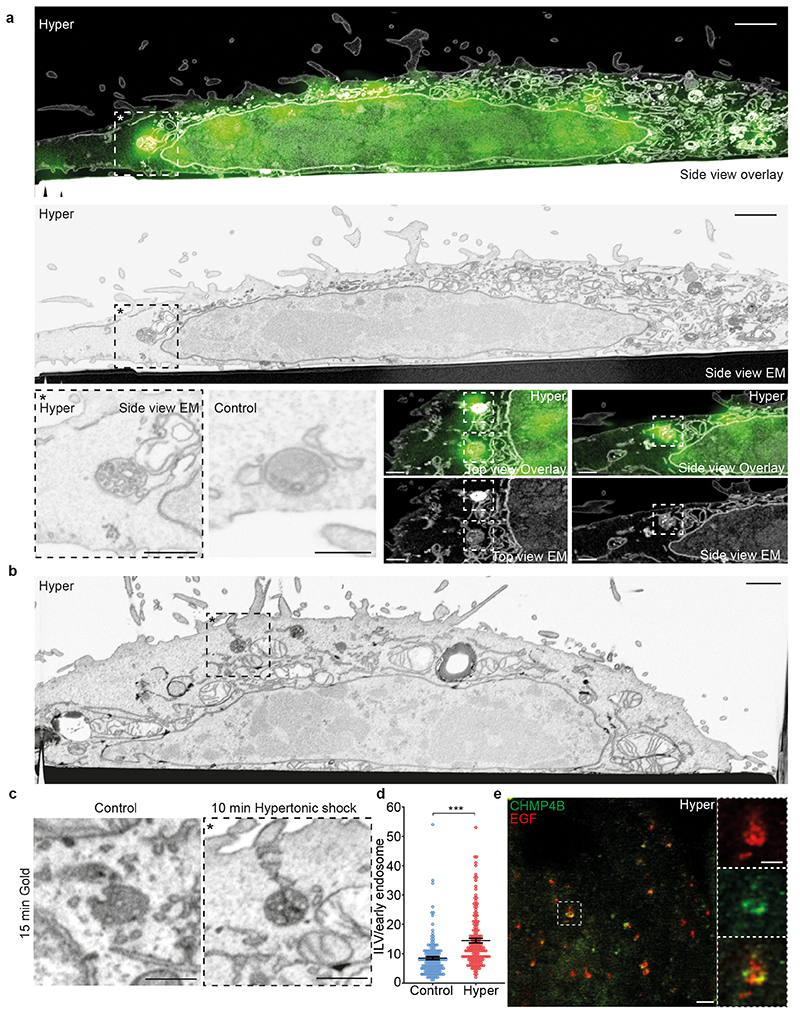
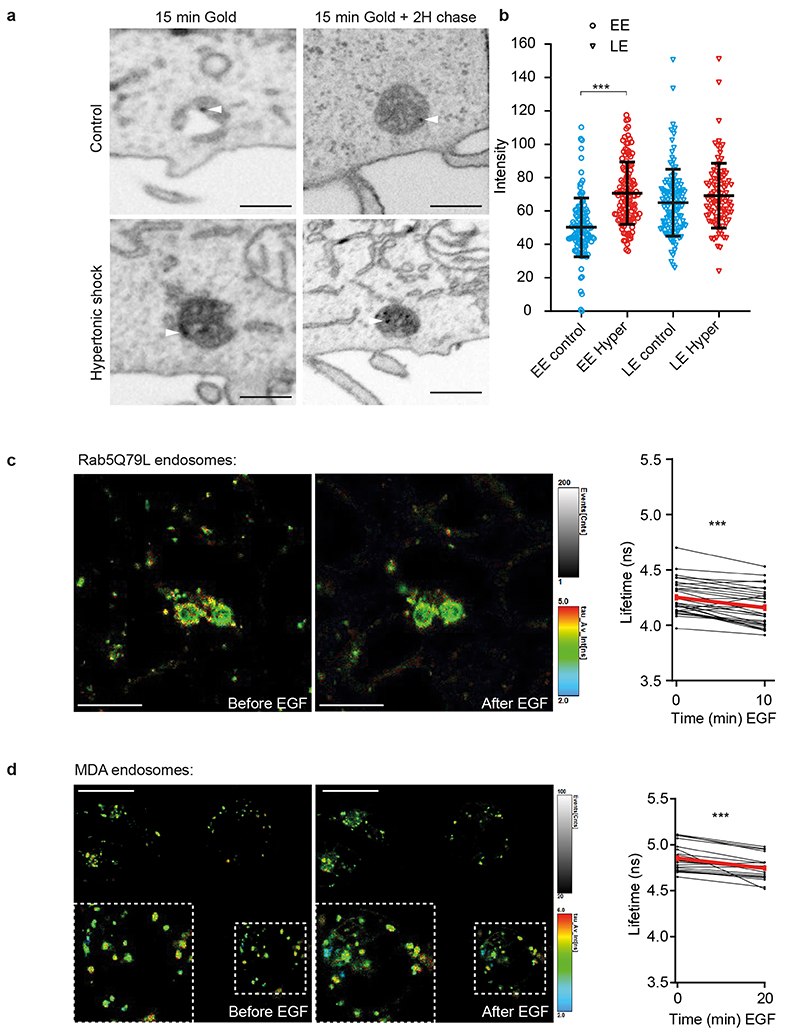
Given the role of ESCRT-III in ILV formation, we wondered whether decreased endosomal membrane tension triggers ILV formation. An analysis of endosome ultrastructure after hypertonic shock by Correlative Light-Focused Ion Beam-Scanning Electron Microscopy (FIB-CLEM) showed that CHMP4B-GFP-labeled punctae observed by fluorescence microscopy correlated with multivesicular endosomes observed by electron microscopy (Fig 6a). Moreover, this analysis revealed that CHMP4B-labeled endosomes (Fig 6a) appeared more electron-dense after hypertonic shock when compared to controls. In fact, the density of endosomes containing BSA-gold endocytosed for 15min (early endosomes) was increased after hypertonic shock when compared to controls (Extended Data Fig.8a-b). Late endosomes containing endocytosed BSA-gold chased for 2h were more electron-dense than early endosomes even without treatment, and yet the treatment also increased their density (Extended Data Fig.8a-b). While this increase may be due to volume reduction (Fig 3a-d), we reasoned that it may also result from an increased number of ILVs formed upon hypertonic shock.
Figure 6. Tension-induced CHMP4B recruitment on endosomes triggers ILV formation.
a) Cells expressing CHMP4B-GFP were treated with hypertonic medium (800 mOsm) for 10min and then analysed by CLEM-FIB-SEM. The micrographs in the two upper panels show the same view across one cell by EM and fluorescence microscopy (overlay top panel) or by EM only (lower panel); bar: 1 μm. The boxed area* shown in higher magnification in the left lower panel, illustrates a CHMP4B-GFP decorated endosome by EM, next to a typical endosome observed in cells prepared under isotonic condition (control), bars are 500 nm. The four right lower panels show other examples of fluorescent positives endosomes in top view or side view with the corresponding EM micrographs; bars: 500 nm). Images from a single CLEM experiment. (b-d) Endosomes were labeled after BSA-gold endocytosis for 15min. Cells were treated or not under hypertonic conditions and processed for FIB-SEM as in (a). Panel (b) shows the overview of a typical cell treated under hypertonic conditions for 10min, and the boxed area with a BSA-labeled endosome is shown in (c), next to a BSA-labeled endosome from a control cell. Images are representative of 3 experiments. The ILV number per BSA-gold labelled endosomes was quantified before (blue) and after (red) the 10min hypertonic shock (d). Error bar is SEM (Control: 152, Hyper: 156 endosomes from 3 independent replicates, two-tailed Mann-Whitney test: P<0.0000000001). In b, bars: 1 μm, in (c), bars: 500 nm. e) STED microscopy images of cells expressing CHMP4B-GFP (green), incubated 10 minutes with far red EGF (red) and then subjected to 10min hypertonic shock. Bar: 2 μm High magnification (right panels) bar: 500 nm. Images from a single STED experiment.
In FIB-SEM samples, the absolute number of ILVs per endosome could be quantified and this number indeed increased by almost 40% in early endosomes after hypertonic shock (Fig 6b-d), supporting the view that, under hypertonic conditions, ESCRT-III recruitment triggers ILV formation. Furthermore, CHMP4B co-clustered with EGF on endosomes – presumably ILV buds, as seen by Stimulated Emission Depletion (STED) microscopy (Fig 6e).
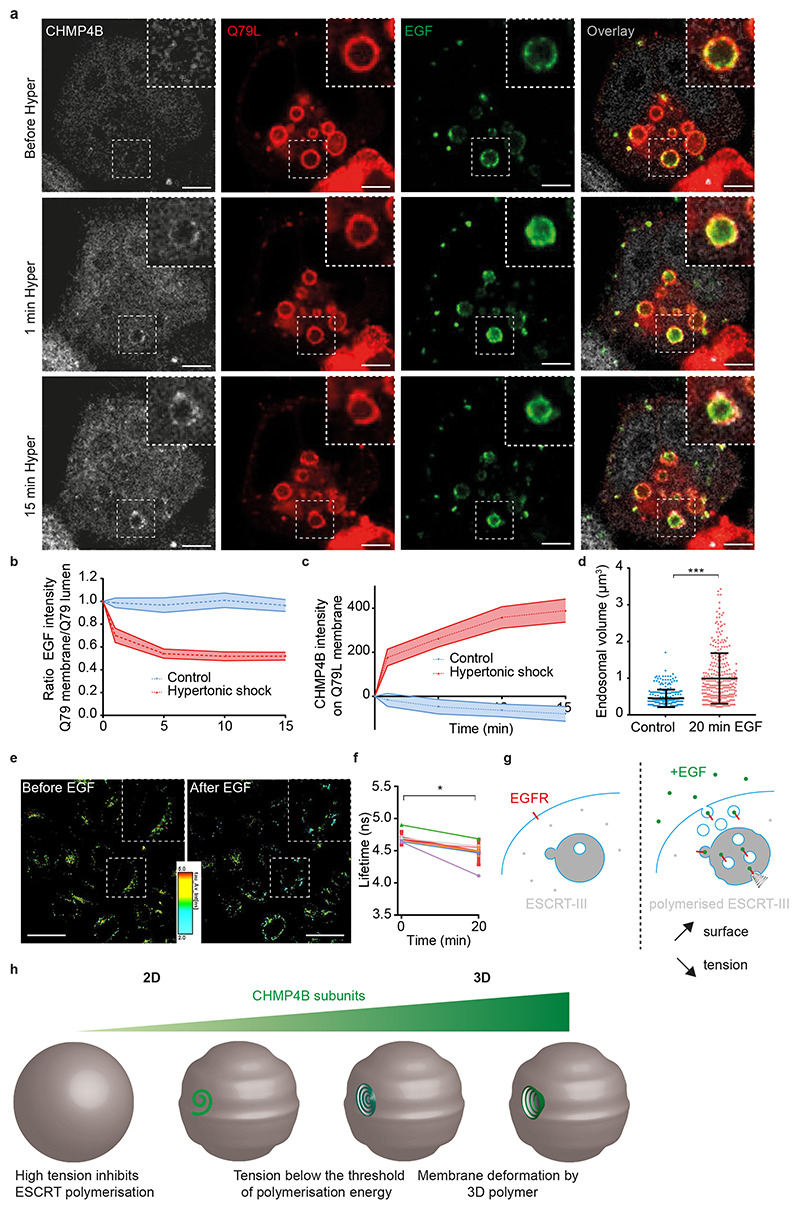
To test whether ILVs formed upon hypertonic shock, we monitored EGF receptor sorting into enlarged RAB5Q79L endosomes35,36. Cells were incubated with fluorescent EGF for 10min, and then EGF fluorescence intensity on the limiting membrane was measured before and after hypertonic shock. Upon shock, CHMP4B fluorescence intensity increased (Fig 7a-c), as expected (Fig 3a), concomitant with an increase of the EGF signal in the endosomal lumen (Fig 7a-b), presumably reflecting EGFR sorting into ILVs. To limit the danger that the increased lumenal EGF signal may reflect an increase in concentration due to the decreased endosome volume (Fig 3b-d), we normalized the EGF signal on the limiting membrane to the lumenal content. Then, the observed decrease in EGF signal on the limiting membrane (Fig 7b) can presumably be accounted for only by ILV formation — membrane traffic being inhibited under hypertonic conditions. These observations further support the notion that ILV formation can be uncoupled from endosome maturation and transport35,36,42. They also show that a decrease in membrane tension causes the recruitment of CHMP4B on endosomal membranes, which in turn drives the formation of intralumenal vesicles containing the EGF receptor.
Figure 7. Hypertonic shock induced ESCRT recruitment leads to EGF incorporation into ILVs.
a) Time-lapse confocal images of Hela-CHMP4B-GFP cells overexpressing RAB5Q79L-mcherry incubated 10 minutes with EGF-Alexa647, and subjected to hypertonic shock (a median filter was applied to all those images). Bars: 5 μm; high magnification bars: 2 μm. Images representative of 3 experiments. b) Ratio of EGF fluorescence colocalizing with RAB5Q79L membrane over luminal EGF signal, normalized by the initial value. c) Intensity of CHMP4B-GFP on Rab5Q79L membrane. For b) and c), shaded areas are SEM. N=21 endosomes from 3 independent replicates (hypertonic shock) and N=16 endosomes from 3 independent replicates (control condition, isotonic). d) Volumes of endosomes stained with Lyso Flipper before and 20min after 200 ng/ml EGF treatment. Dots correspond to single endosomes. Black line: Mean±SD. N=266 endosomes (control) and N=308 (20min EGF) from 2 independent replicates (Two-tailed Mann-Whitney: P<10-15). e) FLIM images of Hela MZ endosomes stained with Lyso-Flipper before and after 20min 200 ng/ml EGF treatment. Bars: 20 μm. Images representative of 6 experiments. f) Lyso Flipper lifetime measurements before and 20min after 200 ng/ml EGF treatment. Thin lines: 6 independent replicates (a few hundreds of endosomes from more than 3 cells each); thick red line: mean±SEM, two-tailed paired t-test P=0.025138. Bars: 20 μm. g) Schematic of a putative mechanism for membrane tension dependent ILV formation by ESCRT-III machinery (see text). h) The model illustrates how tension controls ESCRT-III polymerization and membrane deformation. Below the threshold of polymerization energy, tension inhibits ESCRT-III polymerization, and above the threshold ESCRT-III polymerization can drive the membrane deformation process.
These results suggested that membrane tension regulation may be at play during physiological trafficking of the EGF receptor. Indeed, EGF induces massive endocytosis of EGF receptor and stimulates ESCRT-dependent ILV formation in endosomes43. Therefore, we measured membrane tension of endosomes using Lyso Flipper after EGF treatment. Interestingly, 20min after 200ng/ml EGF addition, the endosomal volume increased almost two-fold (Fig 7d), as previously shown44. More importantly, endosomal membrane tension was significantly reduced in Hela MZ (Fig 7e-f), or in MDA cells (Extended Data Fig.8c). Consistently, a 10min EGF treatment was sufficient to cause a small but very reproducible decrease in the membrane tension of early endosomes enlarged by RAB5Q79L expression — much like hypertonic shock albeit not surprisingly to a lesser extent (Extended Data Fig.8d). Altogether these results show that membrane tension is negatively regulated upon EGF-dependent ILV formation under physiological conditions. We propose that the fusion of endocytic vesicles containing the EGF receptor with endosomes increases the endosome membrane surface area, which in turn decreases membrane tension and promotes ILV formation by the ESCRT machinery (Fig 7g).
Discussion
In this study, we investigated how the tension of organelle membranes may affect theirs functions. We find that the formation of ILVs in multivesicular endosomes is promoted by lowering the membrane tension of the compartment. This process is concomitant with the recruitment of ESCRT-III subunits at the surface of endosomes, which in turn drive the formation of ILVs. A direct quantification of endosome membrane tension reveals that, when EGFR downregulation is triggered by EGF, the incorporation of internalized EGFR into ILVs is correlated with a decrease of endosome membrane tension. Hence, the membrane tension of endosome is relaxed when ILVs need to be formed to accommodate a wave of incoming receptors under physiological conditions.
Our in vitro data unambiguously demonstrate that CHMP4B polymerizes on the membrane when membrane tension is lowered, triggering membrane deformation. This view is consistent with observations by others45 and confirms that ESCRT-III polymerization drives membrane deformation, as previously shown in vitro15–17. As CHMP4B uses membranes as a substrate to polymerize, a lower tension likely facilitates ESCRT polymerisation in its preferred curvature radius. Conversely, high tension may inhibit CHMP4B membrane association because CHMP4 polymerisation energy will not be sufficient to allow membrane deformation (Fig 7h). Our findings also provide a rational explanation for previous observations that endo-lysosomes after sucrose endocytosis become inflated electron-lucent vacuoles deprived of internal membranes (coined sucrosomes)46–48 presumably because membrane tension has been increased above CHMP4B polymerization threshold. It seems attractive to propose that this mechanism is shared by all ESCRT-III mediated reactions, and that membrane tension regulates all ESCRT-III dependent processes.
The precise role of lipid organization and packing in CHMP4B membrane association remains unclear. However, it is tempting to speculate that decreased tension, which influences lipid packing and lateral mobility49, may also help regulate membrane interactions with CHMP4B. However, the relationships between membrane tension and molecular forces between lipids (hydrophobic forces, electrostatic forces) and lipid packing defects are not easily assessed quantitatively and in a rigorous manner. Indeed, the molecular forces (used in molecular dynamics) are defined using a microscopic description, the integration of which does not provide relevant tension values at the macroscopic scale. Conversely, it is difficult to assess the effect of changing membrane tension on molecular forces, since these are usually difficult to separate experimentally. In any case, it can be expected that in vivo CHMP4B-membrane interactions are stabilized by the coincident detection of multiple binding partners50 and protein-protein interactions. Indeed, we find that both ALIX and TSG101, which interact physically with each other51, act as ESCRT-III nucleator in vivo. Our data indicate that CHMP4B recruitment under hypertonic conditions and LLOMe treatment exhibit some preference for ALIX and TSG101, respectively, perhaps reflecting subtle changes in membrane organization — hence in the capacity to interact with ALIX or TSG101 — after either treatment.
Altogether, we provide here an example where the function of an organelle is regulated by the tension of its membrane. As specific organelle functions together with many steps of membrane traffic and organelle-organelle interactions via contact sites occur at the organelle limiting membrane, future work will likely reveal the importance of membrane tension in organellar functions.
Materials and Methods
Cell culture
HeLa-MZ cells (Lucas Pelkmans, University of Zurich), HeLa Kyoto cells stably expressing GFP-CHMP4B-GFP (Anthony Hyman, MPI‐CBG, Dresden), MDA MB 431 cells were maintained as described1.HeLa and MDA MB 431 cells are not on the list of commonly misidentified cell lines maintained by the International Cell Line Authentication Committee. Our HeLa-MZ, HeLa Kyoto and MDA MB 431 cells were authenticated by Microsynth (Balgach, Switzerland), and are mycoplasma-negative as tested by GATC Biotech (Konstanz, Germany).
Antibodies
Mouse monoclonal antibody against LBPA (clone 6C4, dilution 1/50) was produced and used as previously described2. Mouse monoclonal antibody against Rab5 (clone 621.3, dilution 1/500) was produced and purified as previously described3. Rabbit monoclonal antibodies against Lamp1 (D2D11, 9091 lot 6, dilution 1/1000 for IF, and 1/5000 for WB) were from Cell Signaling (Danvers, MA USA). The mouse monoclonal antibody against EEA1 (610457, lot 5023919, dilution 1/100) is from BD biosciences (Franklin Lakes, NJ USA), and the anti-tubulin antibody (T9026, lot 078M4796V, dilution 1/5000) from Sigma-Aldrich (St. Louis, MO). Antibodies against CHMP1A (15761-1-AP), CHMP2A (10477-1-AP), CHMP1B (14639-1-AP), CHMP2B (12527-1-AP), CHMP4B (13683-1-AP), Alix (12422-1-AP), VPS4B (17673-1-AP), VPS25 (15669-1-AP), STAM1 (12434-1-AP), TSG101 (14497-1-AP), CHMP6 (16278-1-AP) and CHMP3 (15472-1-AP) were from all Proteintech (Rosemont, IL, USA) and used with the following dilutions: 1/300 (IF), 1/1000 (WB) and 1/40 (Immunogold).
Reagents
We obtained FM4-64, LysoTracker, Alexa 647-EGF, Alexa-555 EGF and TRITC-dextran (T13320, L7528, E35351, E35350 and D1817, respectively) from Thermo Fisher Scientific (Waltham, MA), as well as EZ-Link Sulfo-NHS-SS-Biotin, Alexa Fluor 488 TFP ester, Ni-NTA Agarose, 7 kDa MWCO Zeba Spin Desalting Columns and Hoechst 33342. Peroxidase-conjugated secondary antibodies were from Bio-Rad Laboratories (Hercules, CA), MBPTrap HD 5mL columns, Glutathione Sepharose 4B and Dextrin Sepharose High Performance from GE Healthcare (Anaheim, CA), and the cOmplete Protease Inhibitor Cocktail from Roche (Basel, Switzerland). We obtained DOPC, DSPE-PEG-Biotin, DOPE, DOPS and lissamine rhodamine B sulfonyl (18:1) Rhod PE from Avanti Polar Lipids (Alabaster, AL, and the lysosomotropic reagent L-leucyl-L-leucine methyl ester (LLOMe) from Sigma-Aldrich (St. Louis, MO). Other reagents and chemicals were obtained from Sigma-Aldrich (St. Louis, MO)
siRNA treatment
siRNA sequences against Alix (NCBI gene ID: 10015, siTOOLs siRNA reference: 10015-1-001) and TSG101 (NCBI gene ID: 7251, siTOOLs siRNA reference: 7251-1-002) were from siTOOLs Biotech (Planegg, Germany). For each gene, a pool of 30 different siRNA sequences was designed. A siRNA sequence against VSV-G (Qiagen, reference:1027020, target sequence: 5’-AAAAAGGAAACTGGAAAAATG-3’), which does not interact with any human genes, was used as a negative control. Each pool was used at a low 3nM (20 nM for anti-VSV-G siRNA) concentration in order to reduce the danger of off-target effects. Efficiency of siRNA was tested by western blot analysis4. DNA and siRNA were transfected in cells according to the manufacturer’s instructions using FuGENE HD (Promega Corporation, Madison, WI) and Lipofectamine RNAiMAX (Thermo Fisher Scientific, Waltham, MA), respectively. Unless indicated otherwise, experiments were performed after transfection with DNA for 7h and siRNA for 72 h.
Live-cell imaging and Immunofluorescence
For live-cell imaging, cells were seeded into 35mm MatTek glass bottom microwell dishes (MatTek Corporation) or in Ibidi multi-wells chambers (Ibidi) with 24x60mm glass coverslips (Menzel-Glaser). For immunofluorescence studies, cells were seeded at 4.104 cells per 35 mm dish and grown on 1.5 round glass coverslips (Electron Microscopy Sciences, Hatfield, PA, USA) at 37°C or 5.103 cells per well in Ibidi p96 wells plate (or 2. 103 cells per well for siRNA experiment). For live imaging, cells were rinsed 3 fold with 1ml Leibovitz’s live imaging medium (Life Technologies, Thermofisher so that cells could be incubated without CO2 equilibration at room temperature. Long (>30 min) acquisitions were at 37°C in Leibovitz’s medium. For EEA1, LBPA and Lamp1, immunofluorescence staining was performed as described5.
For ESCRT staining, cells were fixed with methanol during 10min at -20°C and blocked using 1% p/v BSA in PBS. ESCRT were then immunolabeled in this blocking solution for 1h at room temperature with antibodies against the following proteins:, CHMP1B, CHMP3, CHMP4B, Alix, VPS4B, TSG101, STAM (All were rabbit polyclonal antibodies obtained from ProteinTech Group, Rosemont, IL, USA, with the following reference numbers, respectively: 14639-1-AP, 15472-1-AP, 13683-1-AP, 12422-1-AP, 17673-1-AP, 14497-1-AP, 12434-1-AP) all at a 300-fold dilution. Otherwise, the labelling protocol was as described5.
Cells were analysed by confocal microscopy (Leica SP8, Nikon A1), STED microscopy (Leica SP 8) or confocal automated microscope (Molecular Device) for P96 wells plates. Analysis of automated microscopy images was done via the MetaXpress Custom Module editor software Images were segmented in order to generate relevant masks, which were then applied on the fluorescent images to extract relevant measurements. To facilitate segmentation of ESCRT or LysoTracker endosomes, we applied the top hat deconvolution method, when necessary, to reduce the background noise and highlight bright granules.
Giant unilamellar vesicles (GUVs) and large unilamellar vesicles (LUVs) preparation
GUVs were produced as described6 in water containing 250mM sucrose, 125mM sucrose or 500mM sucrose for controls. Here, the lipid composition was DOPC:DOPS at 60:40 Mol%, containing 0.1% N-rhodamine PE and 0.003% DSPE-PEG(2000) Biotin or DOPC:DOPE:LiverPI:LBPA at 50:20:10:20 Mol% containing 0.1% N-rhodamine PE and 0.003% DSPE-PEG(2000) Biotin. To prepare LUVs, 500 μl of the same lipid mix than for GUVs (2mg/ml) were evaporated in round bottom glass tubes under gentle CO2 flow. Then, 500 μl water containing 250mM sucrose were added onto the lipid film and the mixture was vortexed during 5min. The solution was size-extruded using 400nM filter to form LUVs.
CHMP4B binding on GUVs
A channel of ibidi flow chamber was coated with 0.1 mg/ml avidin in water for 10min, and rinsed 3X with water and 2X with buffer 1 (100mM NaCl, 20mM HEPES, 2mM MgCl2, 250mOsm). 2μl GUVs were added in 50μl buffer 1 during 5min to facilitate avidin-biotin interactions, and then the solution was replaced by 40μl of 0.1mg/ml albumin-biotin in buffer 1 in order to saturate free avidin sites. For analysis, ROIs were selected by focusing on the GUV equatorial plane at 1 frame/1-2min, and acquisition started before CHMP4B-Alexa 488 addition. In the experiment, CHMP4B-Alexa 488 was diluted 1:1 with buffer 2 (200mM NaCl, 20mM HEPES, 4mM MgCl2). The mixture was adjusted to 1μM CHMP4B with buffer 1 (CHMP4B Iso), and 80μl were added to GUVs with a pump at a rate = 60μl/min to avoid GUV damages. For hyperosmotic CHMP4B incubation, protein was mixed with buffer 1 and 2 supplemented with 250mM sucrose (CHMP4B Hyper, final osmolarity ~500mOsm) or GUVs with low sucrose (0.125mM sucrose) were incubated with CHMP4B with buffer 1 (CHMP4B Iso) as a control. Another control was to incubate GUVs with high sucrose (0.5mM sucrose) with CHMP4B with buffer 2 (CHMP4B Hyper). For hypotonic shock, the hypertonic solution was replaced by 1μM CHMP4B in buffer 1 supplemented with water to reach ~230mOsm (instead of ≈250mOsm for isotonic solution). For quantification, the red channel (membrane) was threshold and used as a mask for the green (CHMP4B) signal over time. Background was subtracted and curves were fitted using one phase association exponential (formula: y = y0+(plateau-y0)(1-e−Kx)) in order to extract binding rates.
Tube pulling experiments
The experimental setup used to aspirate GUV with a micropipette and pull a membrane tube was the same than6, and is combining brightfield imaging, spinning disc confocal microscopy and optical tweezers on an inverted Nikon Eclipse Ti microscope. The force F exerted on the bead by the membrane tube was calculated from Hooke’s law: F = k.Δx, where k is the stiffness of the trap (k = 60 pN.μm−1) and Δx the displacement of the bead from its equilibrium position in the optical trap. CHMP4B Alexa 488 was injected with a micropipette connected to a motorized micromanipulator and to the Fluigent pressure control system (MFCS-VAC −69 mbar, Fluigent, Villejuif, France).
Binding rates of CHMP4B on GUVs membrane were extracted using one phase association exponential (formula: y = y0+(plateau-y0)(1-e−Kx)). Finally, we plotted the binding rates of CHMP4B as a function of membrane tension (extracted from equation: F=2π✓2κσ) and we fitted this curve with one phase exponential decay (y=(y0 – plateau)).e−Kx + Plateau; R2=0.77).
Cryo-electron microscopy and negative-staining transmission electron microscopy
In cryo-electron microscopy studies, LUVs were adsorbed for 1min onto EM grids with 300 mesh Lacey carbon films, blotted with Whatman filter paper, and then plunged in liquid ethane using FEI vitrobot cryoplunger (FEI, Eindhoven, the Netherlands). Cryo-electron micrographs were recorded using a field emission gun transmission electron microscope Tecnai F 20 (FEI, Eindhoven, the Netherlands) equipped with a cryo-specimen grid holder Gatan 626 (Warrendale, Pennsylvania, USA). Images were acquired at 200kV and at a nominal magnification of 50,000 using an Eagle camera (4,096 pixels×4,096 pixels). Samples were negatively stained with uranyl acetate and analysed by transmission electron microscopy, as described6.
Endosomes purification
Subcellular fractionation was carried out by flotation in sucrose gradients as described7. Whole cell lysates were prepared in 50 mM Tris, pH 7.4, 1% NP-40, 0.25% sodium deoxycholate, 150 mM NaCl, 1mM EDTA, 1mM PMSF, 1 μg/mL aprotinin, 1 μg/mL leupeptin, 1 μg/mL pepstatin.
Fluorescence Lifetime Imaging Microscopy (FLIM)
FliptR and Lyso Flipper were synthesized following reported procedures8,9 and FLIM with these probes was adapted from8,9. Cells were incubated with 1μM FliptR (for RAB5Q79L endosome staining) during 2h before imaging or with 1μM Lyso Flipper during 15min before imaging. Imaging was performed as in9. For analysis, SymPhoTime 64 software (PicoQuant) was used to fit fluorescence decay data (from full images for Lyso Flipper or regions of interest for FliptR) to a dual exponential reconvolution model whereby the lifetime τ1 was extracted. Data are expressed as means ± SD.
FRAP experiments
Endosomes were imaged using a 100x 1.4 NA oil DIC Plan-Apochromat VC objective (Nikon) with a Nikon A1 scanning confocal microscope. Photobleaching were performed in circular regions with 4 iterations of 488nm at 100% laser intensity. For the analysis, the fluorescence background was subtracted from ROIs intensity values. Those values were subsequently normalized by a non-bleached area and the value of intensity of the first frame after bleaching was subtracted. Finally, FRAP curves were normalized with the pre-bleach fluorescence intensity value. To determine FRAP recovery kinetics, we fitted with the following double exponential function f(t)=α(1-et-t0/τ1)+(1-α)(1-et-t0/τ2).
STED nanoscopy
Hela-CHMP4B-GFP cells were growth on 1.5cm 170μm thick glass coverslip (Hecht-Assistant), incubated 10min with EGF-A647 in medium at 37°C then rinsed and further incubated for 10min in medium containing 0.5M sucrose at 37°C. Cells were then fixed for 15min at room temperature with 3%PFA in PBS, rinsed 3X with PBS then 1X with water and mounted using Prolong gold mounting medium (ThermoFisher) and sealed using nail polish (Electron Microscopy Sciences).
Image acquisition was performed using SP8 confocal microscope (Leica) equipped with 2 depletion laser lines one at 592nm and the other at 775nm and 93X glycerol PL Apo objective with 1.3 NA. Prior to image the samples, depletion lasers were aligned using gold beads. Then, imaging CHMP4-GFP signal was depleted using 40% power of the 592nm line and EGF-A647 was depleted using 35% of 775 nm laser line. No gating was used for both of them. Images were post processed automatically via the lightning mode of Las X software (Leica) which basically consist of a deconvolution process using the estimated PSF depending on imaging parameters.
Endosomal volume measurements
Z-sections were acquired on living cells before and after hypertonic shock using 100X objective with 1.4 numerical aperture on Nikon Ti scanning confocal inverted microscope or Nikon Ti spinning disk inverted microscope. Images were processed with Icy software where endosomes were manually threshold and exported as ROIs. Those ROIs were then convexified and the volumes of ROIs were extracted using the 3D measurement plugin.
Fluorescent EGF in RabQ79L membrane measurements
The analysis of EGF receptor distribution on endosomes enlarged after expression of RAB5Q79L, EGF-A647 was endocytosed 10min at 37°C in Hela CHMP4B-GFP expressing RAB5Q79L cherry and z slices were acquired using Nikon A1 microscope before and at indicated times of hypertonic shock. For analysis, EGF signal was measured using Icy software on the limiting membrane of enlarged endosomes and normalized with the cytosolic signal of CHMP4B-GFP and finally expressed as a ratio of signal before hypertonic shock. The CHMP4B-GFP signal was also measured using the same procedure.
FIB-SEM sample preparation and CLEM
Briefly, for early endosome staining, Hela cells grown in 35mm plastic dishes were incubated with 6nm BSA-gold particles for 10min at 37 °C, washed extensively with medium and then either fixed immediately or treated for 10min at 37°C with hypertonic medium (0.5M sucrose) before fixation with fixative containing sucrose to have the same osmolarity. For late endosome staining, BSA-gold was endocytosed as above for 10min, and then cells were washed extensively with medium, and further incubated at 37 °C for 2h. Cells were then fixed immediately or treated for 10min at 37°C with hypertonic medium (0.5 M sucrose). Cells were rinsed once with PBS and fixed for 3h on ice using 2.5% glutaraldehyde, 2% paraformaldehyde in buffer A containing 0.15M cacodylate and 2mM CaCl2. After this step, cells were processed for FIB-SEM as described10. At the end of sample preparation, a small bloc was cut with an electric saw and incubated for ≈30min in 100% xylene in order to remove plastic leftovers. Finally, the ROI was processed using HELIOS 660 Nanolab DualBeam SEM/FIB (FEI Company, Eindhoven, Netherlands). The ROI size was ≈15-20μm wide and the thickness of the FIB slice was either 5 or 10nm depending on the experiment.
For endosomal density quantification, gold containing endosomes were identified. The image intensity inverted and the mean intensity of endosome were measured. Finally, the intensity of the cytoplasm for each slice was subtracted. Results were analysed using GraphPad Prism. The Gaussian distribution of the data were tested using Kolmogorov–Smirnov test (with Dallal–Wilkinson–Lillie for P value).
For CLEM, 5.104 Hela CHMP4B cells were grown on 35mm dishes with plastic coverslips bottom labelled with grids (Ibidi) for 24h. One dish was left untreated and the other was treated with medium containing 0.5M sucrose during 10min at 37°C. Cells were then fixed with 3% PFA and Z-stacks were acquired using Leica SP8 confocal microscope. Cells were then stained and embedded in Epoxy resin for FIB-SEM acquisition as described above. Using the grid, cells imaged by confocal were found back and imaged using Helios nanolab microscope. Both optical and electronic images were processed using Big Warp plugin on ImageJ and Icy software.
Cryo-sectioning and immuno-electron microscopy
Cells were incubated 15 min at 37°C with 6 nm BSA-Gold washed and directly fixed (control) or incubated further for 10 minutes at 37°C in sucrose containing hypertonic medium (830 mOsm) before fixation (10 min hyper). Fixation was carried out fo 2h at room temperature in 0.125M phosphate buffer (PB) containing 2% PFA and 0.2% glutaraldehyde. After fixation, cells were washed 3 times with PB and once with PB containing 50 mM glycine, embedded in 10% (wt/vol) gelatin and infused with 2.3 M sucrose. Small pieces of the cell pellet were then cut and incubated overnight in 2.3 M sucrose. Gelatin blocks were frozen in liquid nitrogen and ultrathin cryo sections were cut (35 nm) at −120°C using an Ultracut FCS ultracryomicrotome (Leica-Reichert). Sections were retrieved in a 1:1 solution of 2.3 M sucrose and 2% methyl cellulose. For labelling, cryosections were first blocked in PBS containing 1% BSA and incubated with primary anti-CHMP4B antibody (Protein tech, 13683-1-AP) diluted 30 times in the same solution. Cryosections were then washed 4 times in PBS and incubated with a solution of 10 nm gold-conjugated protein A (AURION) at OD = 1 in 1% BSA PBS. Finally, cryosections were stained with 1% uranyl acetate in 2% methylcellulose. The sections were viewed at 120 kV in a Technai G2 Sphera electron microscope.
Other methods
Western blot analysis was performed as5, and blot exposure times were always within the linear range of detection. Human CHMP4B was purified as described11. The analysis of EGF receptor endocytosis was described12 and endocytosis of BSA-gold was described5.
Quantification, Statistics and Reproducibility
In all automated microscopy experiments, a minimum of 1000 cells per biological replicate have been imaged and analyzed using our high-throughput microscopy set-up. No statistical methods were used to predetermine the sample sizes. All replicates successfully reproduced the presented findings. Results shown are means, and error bars represent standard errors of the mean (SEM) or standard deviation (SD) as specified in figure legends. Except where otherwise stated, experiments were repeated at least 3 times. Statistical analyses were performed using Prism 7 (GraphPad Software). The Gaussian distributions of the data were tested using Kolmogorov–Smirnov test (with Dallal–Wilkinson–Lillie for P value). In case of non-Gaussian distribution, the following non-parametric tests were used: two-tailed Mann–Whitney U test to compare two conditions, or one-way ANOVA (Kruskal–Wallis test) with a Dunn’s test to compare more than two data groups. In case of Gaussian distribution, two-tailed Student’s t-test was used for the comparison of the means in case of comparison between two conditions and parametric one-way ANOVA with a Tukey HSD or Dunnett’s multiple comparison tests in case of comparisons between more than two data groups. When appropriate, correlation coefficients were calculated using either Pearson or Spearman. Significance of mean comparison is represented on the graphs by asterisks: *<0.05; **<0.01; ***<0.001.
Extended Data
Extended Data Fig. 1. Hypertonic shock causes relocalization of ESCRT III to early endosomes (related to Fig 1).
a) Western blot analysis for several ESCRT and endosomal markers of light-membrane (LM), heavy-membrane (HM) and cytosol (CYTO) fractions in control or hypertonic treated cells (830 mOsm). Full blots are available as source data. b-c) Representative confocal images of Hela cells expressing CHMP4B-GFP before and 10min after incubation with medium containing 0.25M NaCl (b) or hypotonic medium (c). Images representative of 2 experiments. d) Fluorescence recovery after photobleaching curves of CHMP4B-GFP fluorescence on endosomes under control and hypertonic conditions (830 mOsm), in Hela CHMP4B-GFP cells transfected or not the dominant-negative mutant of VPS4B (DN VPS4B) were incubated with an isotonic (330 mOsm) or hypertonic (830 mOsm) solution for 5min. Shaded areas correspond to the SEM. (N values are: CHMP4B= 15; CHMP4B hyper=17; CHMP4B+DN VPS4=8; CHMP4B+DN VPS4 hyper=13). e) Immunofluorescence confocal images of Hela MZ cells stained for endogenous CHMP4B after incubated 10min incubation in isotonic or hypertonic (~830 mOsm). f) Mean intensity of CHMP4B-GFP punctae over time. Shaded areas: mean ± SD (N=722 punctae from 3 independent replicates). g) Confocal images of Hela CHMP4B-GFP loaded with EGF-Alexa 647 for 15min (blue, EE) and for 15min followed by a 2h chase with EGF-Alexa 594 (red, LE) under control condition (upper panel) or after 10min hypertonic shock (bottom panel). Images are representative of 3 experiments. h) Confocal images of Hela-CHMP4B-GFP cells after a 10min-hypertonic shock labelled with antibodies against the indicated markers (arrows indicate colocalization). Bar: 5 μm. Images are representative of 3 experiments. i) Quantification of CHMP4B-GFP fluorescence intensity within the Transferrin-A594 mask in the experiment shown in Fig 1k. Mean±SD: shaded area (N=100 Transferrin -positives endosomes) j) Number of CHMP4B-GFP punctae with time during a 15 min hypertonic shock (~830 mOsm), followed by a 15min isotonic recovery (~330 mOsm). Shaded areas: mean ± SD (N=38 cells from 3 independent replicates).
Extended Data Fig. 2. Hypertonic shock or LLOMe treatment leads to ESCRT proteins relocalization (related to Fig 1–2 & 4).
a) Hela-CHMP4B-GFP cells were incubated for 15min with 6nm BSA-Gold and subjected to a hypertonic shock for 10min. and cells were processed for immune-electron microscopy, as in Fig 1k. The gallery shows representatives micrographs of endosomes after immuno-gold labelling of cryo-sections with anti-CHMP4B antibodies followed by 10 nm Gold-Protein A. Please note that the size of endosomes treated or not under hypertonic conditions cannot be compared in these micrographs. Indeed, we were unable to obtain nice thin cryo-sections after fixation in a paraformaldehyde-glutaraldehyde mixture containing sucrose (in order to keep osmolarity constant). Thus, we had to use normal fixative to obtain appropriate sections, but some endosome swelling occurred. Images from a single immuno-gold labelling experiment. b-c) Representatives automated confocal images of Hela MZ cells after immunostaining of the indicated ESCRT subunits under the following conditions: (b) untreated and 30min hypertonic shock, (c) 30min treatment with LLOMe. Quantifications in Fig 1l and Fig 2n were obtained from similar images. Images representative of 3 experiments. Scale bars: 10μm
Extended Data Fig. 3. ESCRT protein relocalization after hypertonic or LLOMe treatments. (related to Fig 2 & 4).
Automated confocal images of Hela cells expressing CHMP4B-GFP (green) after hypertonic shock for 30min (a) or LLOMe treatment for 30min (b). Cells were labelled with antibodies against the indicated ESCRT subunits (red). Images representative of 3 experiments. Scale bars: 10 μm.
Extended Data Fig. 4. Role of ALIX and TSG101 in the redistribution of CHMP4B after hypertonic shock or LLOMe treatment (related to Fig 2 & 4).
Cells expressing CHMP4B-GFP were transfected with control siRNAs (siVSV) or with siRNAs against ALIX or TSG101, treated with hypertonic medium (0.5 M sucrose) or with 0.5mM LLOMe for the indicated time, and then imaged by automated confocal microscopy. The micrographs represent CHMP4B-GFP distribution and correspond to the quantification shown in Fig 2q and Extended Data Fig. 6f. Images are representative of 3 experiments. Bar: 20 μm
Extended Data Fig. 5. ESCRT are recruited to late endosomes after membrane injury and are necessary for repair. (related to Fig 4).
a) Hela cells were treated for the indicated time with 0.5mM LLOMe, stained with LysoTracker and imaged by automated confocal microscopy. Images representative of 3 experiments. Scale bars: 10 μm. b) Confocal images of CHMP4B-GFP distribution during a pulse-chase experiment with 0.5 mM LLOMe. Images representative of 3 experiments. Scale bars: 10μm. c) The graph shows the normalized mean fluorescence intensity of LysoTracker and CHMP4B-GFP that illustrates the effect of the treatment of HeLa cells with 0.5mM LLOMe (See also Movie 3). Shaded areas correspond to SEM from (N= 26 ROIs in 10 cells from 2 independents movies). d) The graphs show the number of CHMP4B-GFP punctae per cell in cells treated with 0.5 mM LLOMe (upper graph, shaded area represents SD, N= 8 cells), as well as the mean intensity of the punctae (shaded area represents SEM, N=43 ROIs in 8 cells). e) Hela MZ were transfected with control siRNA (siVSV) or siRNAs against ALIX, TSG101 or both ALIX and TSG101, and treated with 0.5 mM LLOMe for the indicated time. Acidic compartments were revealed using LysoTracker and imaged by automated confocal microscopy. The graph shows the mean number of LysoTracker punctae per cell. (N=3 independent replicates represented by dots on the graph with mean±SEM. Analysis by automated microscopy with a total of 72 fields per condition, with 10-40 cells per field.). f) Confocal images of LysoTracker staining before and 10min after 0.5 mM LLOMe treatment. The data correspond to Fig 2. Images representative of 4 experiments. Bars: 10 μm
Extended Data Fig. 6. Low membrane tension facilitates CHMP4B association with GUVs (related to Fig 5).
a) Images of a GUV held in the aspiration pipette while purified CHMP4B-A488 is released from the ejection pipette. Binding is clearly visible 2min after CHMP4B ejection. Bars: 10μm. Images representative of 5 experiments. b-c) This example shows that the force exerted on the bead (measured with optical tweezers) increases with time (b), as does CHMP4B binding on the GUV (c), and thus that the force increase is correlated with CHMP4B binding. d) Images of CHMP4B-A488 binding on the GUV surface when the buffer containing CHMP4B is hypertonic or hypotonic. Bars: 10μm. Images representative of 2 experiments. e-f) Tension was released by a decrease in the aspiration of the tongue with the aspiration pipette. In (e), the upper image shows the CHMP4B fluorescence on the GUV 7min after the beginning of protein ejection, and the bottom image 7min after the release of membrane tension (note the disappearance of the tongue). Bars: 10 μm. Images representative of 3 experiments. (f) Quantification of the experiment shown in (e); lines are linear fits. g) Same experiments than in Fig 5c but with Snf7 instead of CHMP4B (at the same concentration). Mean±SEM (N=13 GUVs). h) GUVs were incubated for 30min with 1μm Snf7 in isotonic buffer, and then the solution was replaced with exactly the same solution (+SNF7). Then, at 56min, the solution was replaced again but with hypertonic buffer also containing 1μm Snf7 (+SNF7 Hyper, blue part of the graph). Mean±SEM (N=20 GUVs). i) The upper kymograph shows GUVs containing low (125mM) sucrose, which were then incubated with CHMP4B under hypertonic conditions in the presence of 250 mOsm sucrose; N=44 GUVs. The lower kymograph shows GUVs containing high (500 mM) sucrose, which were incubated with CHMP4B under isotonic conditions in the same buffer (500 mM sucrose); N=54 GUVs. The mean intensity of CHMP4B-Alexa488 on the bilayer over time is shown in the right panel; binding rate is 1/τ= 0.07837 for 125mM sucrose, and 1/τ= 0.03522 for high sucrose, as indicated. Mean±SEM. j) Volumes of single GUV before (black) and after a 10min hypertonic shock (red) (N=20 GUVs, bars represent the mean)
Extended Data Fig. 7. Low membrane tension promotes CHMP4B polymerization on LUV membranes (related to Fig 5).
a, b) Cryo-electron micrographs of LUVs incubated for 2h with 1μM CHMP4B-GFP in hypotonic (a) or hypertonic (b) solution. Bars: 100 nm. Images are representative of 2 experiments. c, d) Electron micrographs after negative staining of LUVs incubated for 2h with 1μM CHMP4B-GFP in hypotonic (c) or hypertonic (d) solution. Bars: 100 nm. Images are representative of 2 experiments.
Extended Data Fig. 8. EGF triggers endosomal membrane tension decrease in vivo (related to Fig 6).
a-b) As in Fig 4, the panel (a) shows FIB-SEM micrographs of cells loaded with BSA-gold. The electron density of early endosomes (EE) or late endosomes (LE) labeled with BSA-gold was measured before (blue) and after (red) a 10min hypertonic shock (b). Mean±SD (N are respectively EE control:121; EE Hyper: 124; LE control:120; LE Hyper:98 from 2 independent replicates, Kruskal-Wallis test: P<1.10-15). c) Lyso Flipper lifetime measurements on RAB5Q79L endosomes before and 10min after 200 ng/ml EGF treatment. Thin lines: independent images from 4 experiments, thick red line: mean±SEM, two-tailed paired t-test P= 0.0000025902. d) Lyso Flipper lifetime measurements in MDA cells before and 20min after 200 ng/ml EGF treatment. Thin lines: independent images from 5 experiments, thick red line: mean±SEM, two-tailed paired t-test P=0.0000496474.
Supplementary Material
Confocal time-lapse movie recorded at speed of 1 frame/10sec of CHMP4B-GFP during hypertonic treatment. Images are representative of 5 experiments. (related to Fig 1)
Confocal time-lapse movie recorded at speed of 1 frame/5 minutes of CHMP4B-GFP during hypertonic treatment. This movie corresponds to the time series shown in Fig. 1A. Images are representative of 3 experiments. (related to Fig 1)
Confocal time-lapse movie recorded at speed of 1 frame/30sec of CHMP4B-GFP during 0.5 mM LLOMe treatment. Images are representative of 5 experiments. (related to Fig 4)
Confocal time-lapse movie recorded at speed of 1 frame/2min of CHMP4B-GFP cells stained with LysoTracker during 0.5 mM LLOMe treatment. Images are representative of 2 experiments. (related to Fig 4)
Confocal time-lapse movie recorded at speed of 1 frame/min of CHMP4B-A488 on GUVs during isotonic followed by hypertonic incubation. Images are representative of 6 experiments. (related to Fig 5)
Confocal time-lapse movie recorded at speed of 1 frame/min of CHMP4B-A488 on DOPC:DOPE:LiverPI:LBPA GUVs during isotonic followed by hypertonic incubation. Images are representative of 4 experiments. (related to Fig 5)
One Sentence Summary.
Membrane tension decrease facilitates membrane remodeling by ESCRT-III polymerization during intra-lumenal vesicle formation.
Acknowledgements
The authors want to thank the ACCESS automated microscopy, high-content and high-throughput screening facility and in particular Dimitri Moreau, the Bioimaging platforms, bioimaging core facility and the electron microscopy core facility of University of Geneva for constant support. JG acknowledges support from the Swiss National Science Foundation Grant No 31003A_159479, and LipidX from the Swiss SystemsX.ch Initiative. AR acknowledges funding from Human Frontier Science Program Young Investigator Grant RGY0076/2009-C, the Swiss National Fund for Research Grants N°31003A_130520, N°31003A_149975 and N°31003A_173087, and the European Research Council Consolidator Grant N° 311536.
Footnotes
Author Contributions
The project was designed by VM, JG and AR based on the first observation made by GM. VM carried out all experiments and analyses. JL performed some experiments with VM, in particular CHMP4B purification. AG and SM designed and synthesised the Lyso Flipper and FliptR molecules. VM, JG and AR wrote the paper, with corrections from all co-authors.
Declaration of Interests
The authors declare no competing interests.
Data Availability
Source images of the figures are available here: 10.5281/zenodo.3833867. Others data that support the findings of this study are available from the corresponding authors upon reasonable request.
Data and Software Availability
The data that support the findings of this study are available from the corresponding authors upon reasonable request.
References
- 1.Pontes B, Monzo P, Gauthier NC. Membrane tension: A challenging but universal physical parameter in cell biology. Seminars in Cell & Developmental Biology. 2017;71:30–41. doi: 10.1016/j.semcdb.2017.08.030. [DOI] [PubMed] [Google Scholar]
- 2.Boulant S, Kural C, Zeeh J-C, Ubelmann F, Kirchhausen T. Actin dynamics counteract membrane tension during clathrin-mediated endocytosis. Nature cell biology. 2011;13:1124–1131. doi: 10.1038/ncb2307. [DOI] [PMC free article] [PubMed] [Google Scholar]
- 3.Saleem M, et al. A balance between membrane elasticity and polymerization energy sets the shape of spherical clathrin coats. Nature Communications. 2015;6:6249. doi: 10.1038/ncomms7249. https://www.nature.com/articles/ncomms7249#supplementary-information. [DOI] [PMC free article] [PubMed] [Google Scholar]
- 4.Morlot S, et al. Membrane shape at the edge of the dynamin helix sets location and duration of the fission reaction. Cell. 2012;151:619–629. doi: 10.1016/j.cell.2012.09.017. [DOI] [PMC free article] [PubMed] [Google Scholar]
- 5.Alonso YAM, Migliano SM, Teis D. ESCRT-III and Vps4: a dynamic multipurpose tool for membrane budding and scission. FEBS J. 2016;283:3288–3302. doi: 10.1111/febs.13688. [DOI] [PubMed] [Google Scholar]
- 6.Raiborg C, Stenmark H. The ESCRT machinery in endosomal sorting of ubiquitylated membrane proteins. Nature. 2009;458:445. doi: 10.1038/nature07961. [DOI] [PubMed] [Google Scholar]
- 7.Gatta AT, Carlton JG. The ESCRT-machinery: closing holes and expanding roles. Current Opinion in Cell Biology. 2019;59:121–132. doi: 10.1016/j.ceb.2019.04.005. [DOI] [PubMed] [Google Scholar]
- 8.Vietri M, et al. Spastin and ESCRT-III coordinate mitotic spindle disassembly and nuclear envelope sealing. Nature. 2015;522:231–235. doi: 10.1038/nature14408. [DOI] [PubMed] [Google Scholar]
- 9.Olmos Y, Hodgson L, Mantell J, Verkade P, Carlton JG. ESCRT-III controls nuclear envelope reformation. Nature. 2015;522:236–239. doi: 10.1038/nature14503. [DOI] [PMC free article] [PubMed] [Google Scholar]
- 10.Denais CM, et al. Nuclear envelope rupture and repair during cancer cell migration. Science. 2016;352:353. doi: 10.1126/science.aad7297. [DOI] [PMC free article] [PubMed] [Google Scholar]
- 11.Raab M, et al. ESCRT III repairs nuclear envelope ruptures during cell migration to limit DNA damage and cell death. Science. 2016;352:359. doi: 10.1126/science.aad7611. [DOI] [PubMed] [Google Scholar]
- 12.Jimenez AJ, et al. ESCRT machinery is required for plasma membrane repair. Science. 2014;343 doi: 10.1126/science.1247136. 1247136. [DOI] [PubMed] [Google Scholar]
- 13.Skowyra ML, Schlesinger PH, Naismith TV, Hanson PI. Triggered recruitment of ESCRT machinery promotes endolysosomal repair. Science. 2018;360 doi: 10.1126/science.aar5078. [DOI] [PMC free article] [PubMed] [Google Scholar]
- 14.Shen QT, et al. Structural analysis and modeling reveals new mechanisms governing ESCRT-III spiral filament assembly. J Cell Biol. 2014;206:763–777. doi: 10.1083/jcb.201403108. [DOI] [PMC free article] [PubMed] [Google Scholar]
- 15.Henne WM, Buchkovich NJ, Zhao Y, Emr SD. The endosomal sorting complex ESCRT-II mediates the assembly and architecture of ESCRT-III helices. Cell. 2012;151:356–371. doi: 10.1016/j.cell.2012.08.039. [DOI] [PubMed] [Google Scholar]
- 16.Chiaruttini N, et al. Relaxation of Loaded ESCRT-III Spiral Springs Drives Membrane Deformation. Cell. 2015;163:866–879. doi: 10.1016/j.cell.2015.10.017. [DOI] [PMC free article] [PubMed] [Google Scholar]
- 17.Lata S, et al. Helical structures of ESCRT-III are disassembled by VPS4. Science. 2008;321:1354–1357. doi: 10.1126/science.1161070. [DOI] [PMC free article] [PubMed] [Google Scholar]
- 18.McCullough J, et al. Structure and membrane remodeling activity of ESCRT-III helical polymers. Science. 2015 doi: 10.1126/science.aad8305. [DOI] [PMC free article] [PubMed] [Google Scholar]
- 19.Hanson PI, Roth R, Lin Y, Heuser JE. Plasma membrane deformation by circular arrays of ESCRT-III protein filaments. J Cell Biol. 2008;180:389–402. doi: 10.1083/jcb.200707031. [DOI] [PMC free article] [PubMed] [Google Scholar]
- 20.Cashikar AG, et al. Structure of cellular ESCRT-III spirals and their relationship to HIV budding. Elife. 2014;3 doi: 10.7554/eLife.02184. [DOI] [PMC free article] [PubMed] [Google Scholar]
- 21.Guizetti J, et al. Cortical constriction during abscission involves helices of ESCRT-III-dependent filaments. Science. 2011;331:1616–1620. doi: 10.1126/science.1201847. [DOI] [PubMed] [Google Scholar]
- 22.Goliand I, et al. Resolving ESCRT-III Spirals at the Intercellular Bridge of Dividing Cells Using 3D STORM. Cell Reports. 2018;24:1756–1764. doi: 10.1016/j.celrep.2018.07.051. [DOI] [PubMed] [Google Scholar]
- 23.Teis D, Saksena S, Emr SD. Ordered assembly of the ESCRT-III complex on endosomes is required to sequester cargo during MVB formation. Dev Cell. 2008;15:578–589. doi: 10.1016/j.devcel.2008.08.013. S1534-5807(08)00337-7 [pii] [DOI] [PubMed] [Google Scholar]
- 24.Saksena S, Wahlman J, Teis D, Johnson AE, Emr SD. Functional reconstitution of ESCRT-III assembly and disassembly. Cell. 2009;136:97–109. doi: 10.1016/j.cell.2008.11.013. [DOI] [PMC free article] [PubMed] [Google Scholar]
- 25.McCullough J, Frost A, Sundquist WI. Structures, Functions, and Dynamics of ESCRT-III/Vps4 Membrane Remodeling and Fission Complexes. Annual review of cell and developmental biology. 2018;34:85–109. doi: 10.1146/annurev-cellbio-100616-060600. [DOI] [PMC free article] [PubMed] [Google Scholar]
- 26.Chiaruttini N, Roux A. Dynamic and elastic shape transitions in curved ESCRT-III filaments. Curr Opin Cell Biol. 2017;47:126–135. doi: 10.1016/j.ceb.2017.07.002. [DOI] [PubMed] [Google Scholar]
- 27.Lenz M, Crow DJ, Joanny JF. Membrane buckling induced by curved filaments. Phys Rev Lett. 2009;103 doi: 10.1103/PhysRevLett.103.038101. 038101. [DOI] [PubMed] [Google Scholar]
- 28.Colom A, et al. A fluorescent membrane tension probe. Nature Chemistry. 2018;10:1118–1125. doi: 10.1038/s41557-018-0127-3. [DOI] [PMC free article] [PubMed] [Google Scholar]
- 29.Poser I, et al. BAC TransgeneOmics: a high-throughput method for exploration of protein function in mammals. Nature Methods. 2008;5:409. doi: 10.1038/nmeth.1199. https://www.nature.com/articles/nmeth.1199#supplementary-information. [DOI] [PMC free article] [PubMed] [Google Scholar]
- 30.Mierzwa BE, et al. Dynamic subunit turnover in ESCRT-III assemblies is regulated by Vps4 to mediate membrane remodelling during cytokinesis. Nat Cell Biol. 2017;19:787–798. doi: 10.1038/ncb3559. [DOI] [PMC free article] [PubMed] [Google Scholar]
- 31.Radulovic M, et al. ESCRT‐mediated lysosome repair precedes lysophagy and promotes cell survival. The EMBO Journal. 2018;37 doi: 10.15252/embj.201899753. [DOI] [PMC free article] [PubMed] [Google Scholar]
- 32.Larios J, Mercier V, Roux A, Gruenberg J. ALIX- and ESCRT-III-dependent sorting of tetraspanins to exosomes. J Cell Biol. 2020;219 doi: 10.1083/jcb.201904113. [DOI] [PMC free article] [PubMed] [Google Scholar]
- 33.Bissig C, Gruenberg J. ALIX and the multivesicular endosome: ALIX in Wonderland. Trends Cell Biol. 2014;24:19–25. doi: 10.1016/j.tcb.2013.10.009. [DOI] [PubMed] [Google Scholar]
- 34.Vietri M, Radulovic M, Stenmark H. The many functions of ESCRTs. Nature Reviews Molecular Cell Biology. 2020;21:25–42. doi: 10.1038/s41580-019-0177-4. [DOI] [PubMed] [Google Scholar]
- 35.Raiborg C, et al. Hrs sorts ubiquitinated proteins into clathrin-coated microdomains of early endosomes. Nat Cell Biol. 2002;4:394–398. doi: 10.1038/ncb791. [DOI] [PubMed] [Google Scholar]
- 36.Pons V, et al. Hrs and SNX3 Functions in Sorting and Membrane Invagination within Multivesicular Bodies. PLOS Biology. 2008;6:e214. doi: 10.1371/journal.pbio.0060214. [DOI] [PMC free article] [PubMed] [Google Scholar]
- 37.Heuser JE, Anderson RG. Hypertonic media inhibit receptor-mediated endocytosis by blocking clathrin-coated pit formation. The Journal of cell biology. 1989;108:389–400. doi: 10.1083/jcb.108.2.389. [DOI] [PMC free article] [PubMed] [Google Scholar]
- 38.Nunes P, et al. Ionic imbalance, in addition to molecular crowding, abates cytoskeletal dynamics and vesicle motility during hypertonic stress. Proceedings of the National Academy of Sciences; 2015. p. E3104. [DOI] [PMC free article] [PubMed] [Google Scholar]
- 39.Goujon A, et al. Mechanosensitive Fluorescent Probes to Image Membrane Tension in Mitochondria, Endoplasmic Reticulum, and Lysosomes. Journal of the American Chemical Society. 2019 doi: 10.1021/jacs.8b13189. [DOI] [PubMed] [Google Scholar]
- 40.Repnik U, et al. LLOMe does not release cysteine cathepsins to the cytosol but inactivates them in transiently permeabilized lysosomes. Journal of Cell Science. 2017 doi: 10.1242/jcs.204529. [DOI] [PubMed] [Google Scholar]
- 41.Kobayashi T, et al. A lipid associated with the antiphospholipid syndrome regulates endosome structure and function. Nature. 1998;392:193–197. doi: 10.1038/32440. [DOI] [PubMed] [Google Scholar]
- 42.Mayran N, Parton RG, Gruenberg J. Annexin II regulates multivesicular endosome biogenesis in the degradation pathway of animal cells. The EMBO journal. 2003;22:3242–3253. doi: 10.1093/emboj/cdg321. [DOI] [PMC free article] [PubMed] [Google Scholar]
- 43.Wenzel EM, et al. Concerted ESCRT and clathrin recruitment waves define the timing and morphology of intraluminal vesicle formation. Nature communications. 2018;9:2932–2932. doi: 10.1038/s41467-018-05345-8. [DOI] [PMC free article] [PubMed] [Google Scholar]
- 44.White IJ, Bailey LM, Aghakhani MR, Moss SE, Futter CE. EGF stimulates annexin 1-dependent inward vesiculation in a multivesicular endosome subpopulation. The EMBO journal. 2006;25:1–12. doi: 10.1038/sj.emboj.7600759. [DOI] [PMC free article] [PubMed] [Google Scholar]
- 45.Booth A, Marklew CJ, Ciani B, Beales PA. In Vitro Membrane Remodeling by ESCRT is Regulated by Negative Feedback from Membrane Tension. iScience. 2019;15:173–184. doi: 10.1016/j.isci.2019.04.021. [DOI] [PMC free article] [PubMed] [Google Scholar]
- 46.Cohn ZA, Ehrenreich BA. The uptake, storage, and intracellular hydrolysis of carbohydrates by macrophages. J Exp Med. 1969;129:201–225. doi: 10.1084/jem.129.1.201. [DOI] [PMC free article] [PubMed] [Google Scholar]
- 47.Bright NA, Reaves BJ, Mullock BM, Luzio JP. Dense core lysosomes can fuse with late endosomes and are re-formed from the resultant hybrid organelles. Journal of Cell Science. 1997;110:2027. doi: 10.1242/jcs.110.17.2027. [DOI] [PubMed] [Google Scholar]
- 48.Bright NA, Davis LJ, Luzio JP. Endolysosomes Are the Principal Intracellular Sites of Acid Hydrolase Activity. Current biology : CB. 2016;26:2233–2245. doi: 10.1016/j.cub.2016.06.046. [DOI] [PMC free article] [PubMed] [Google Scholar]
- 49.Barelli H, Antonny B. Lipid unsaturation and organelle dynamics. Current Opinion in Cell Biology. 2016;41:25–32. doi: 10.1016/j.ceb.2016.03.012. [DOI] [PubMed] [Google Scholar]
- 50.Carlton JG, Cullen PJ. Coincidence detection in phosphoinositide signaling. Trends in cell biology. 2005;15:540–547. doi: 10.1016/j.tcb.2005.08.005. [DOI] [PMC free article] [PubMed] [Google Scholar]
- 51.von Schwedler UK, et al. The Protein Network of HIV Budding. Cell. 2003;114:701–713. doi: 10.1016/S0092-8674(03)00714-1. [DOI] [PubMed] [Google Scholar]
References
- 1.Scott CC, Vossio S, Rougemont J, Gruenberg J. TFAP2 transcription factors are regulators of lipid droplet biogenesis. eLife. 2018;7 doi: 10.7554/eLife.36330. e36330. [DOI] [PMC free article] [PubMed] [Google Scholar]
- 2.Kobayashi T, et al. A lipid associated with the antiphospholipid syndrome regulates endosome structure and function. Nature. 1998;392:193–197. doi: 10.1038/32440. [DOI] [PubMed] [Google Scholar]
- 3.Cavalli V, et al. The Stress-Induced MAP Kinase p38 Regulates Endocytic Trafficking via the GDI:Rab5 Complex. Molecular Cell. 2001;7:421–432. doi: 10.1016/S1097-2765(01)00189-7. [DOI] [PubMed] [Google Scholar]
- 4.Larios J, Mercier V, Roux A, Gruenberg J. ALIX- and ESCRT-III–dependent sorting of tetraspanins to exosomes. Journal of Cell Biology. 2020;219 doi: 10.1083/jcb.201904113. [DOI] [PMC free article] [PubMed] [Google Scholar]
- 5.Mercier V, et al. ALG-2 interacting protein-X (Alix) is essential for clathrin-independent endocytosis and signaling. Sci Rep. 2016;6 doi: 10.1038/srep26986. 26986. [DOI] [PMC free article] [PubMed] [Google Scholar]
- 6.Chiaruttini N, et al. Relaxation of Loaded ESCRT-III Spiral Springs Drives Membrane Deformation. Cell. 2015;163:866–879. doi: 10.1016/j.cell.2015.10.017. [DOI] [PMC free article] [PubMed] [Google Scholar]
- 7.Gorvel J-P, Chavrier P, Zerial M, Gruenberg J. rab5 controls early endosome fusion in vitro. Cell. 1991;64:915–925. doi: 10.1016/0092-8674(91)90316-Q. [DOI] [PubMed] [Google Scholar]
- 8.Goujon A, et al. Mechanosensitive Fluorescent Probes to Image Membrane Tension in Mitochondria, Endoplasmic Reticulum, and Lysosomes. Journal of the American Chemical Society. 2019 doi: 10.1021/jacs.8b13189. [DOI] [PubMed] [Google Scholar]
- 9.Colom A, et al. A fluorescent membrane tension probe. Nature Chemistry. 2018;10:1118–1125. doi: 10.1038/s41557-018-0127-3. [DOI] [PMC free article] [PubMed] [Google Scholar]
- 10.Nunes-Hasler P, et al. STIM1 promotes migration, phagosomal maturation and antigen cross-presentation in dendritic cells. Nature communications. 2017;8:1852–1852. doi: 10.1038/s41467-017-01600-6. [DOI] [PMC free article] [PubMed] [Google Scholar]
- 11.Mierzwa BE, et al. Dynamic subunit turnover in ESCRT-III assemblies is regulated by Vps4 to mediate membrane remodelling during cytokinesis. Nat Cell Biol. 2017;19:787–798. doi: 10.1038/ncb3559. [DOI] [PMC free article] [PubMed] [Google Scholar]
- 12.Brankatschk B, et al. Regulation of the EGF Transcriptional Response by Endocytic Sorting. Science Signaling. 2012;5:ra21. doi: 10.1126/scisignal.2002351. [DOI] [PubMed] [Google Scholar]
Associated Data
This section collects any data citations, data availability statements, or supplementary materials included in this article.
Supplementary Materials
Confocal time-lapse movie recorded at speed of 1 frame/10sec of CHMP4B-GFP during hypertonic treatment. Images are representative of 5 experiments. (related to Fig 1)
Confocal time-lapse movie recorded at speed of 1 frame/5 minutes of CHMP4B-GFP during hypertonic treatment. This movie corresponds to the time series shown in Fig. 1A. Images are representative of 3 experiments. (related to Fig 1)
Confocal time-lapse movie recorded at speed of 1 frame/30sec of CHMP4B-GFP during 0.5 mM LLOMe treatment. Images are representative of 5 experiments. (related to Fig 4)
Confocal time-lapse movie recorded at speed of 1 frame/2min of CHMP4B-GFP cells stained with LysoTracker during 0.5 mM LLOMe treatment. Images are representative of 2 experiments. (related to Fig 4)
Confocal time-lapse movie recorded at speed of 1 frame/min of CHMP4B-A488 on GUVs during isotonic followed by hypertonic incubation. Images are representative of 6 experiments. (related to Fig 5)
Confocal time-lapse movie recorded at speed of 1 frame/min of CHMP4B-A488 on DOPC:DOPE:LiverPI:LBPA GUVs during isotonic followed by hypertonic incubation. Images are representative of 4 experiments. (related to Fig 5)
Data Availability Statement
Source images of the figures are available here: 10.5281/zenodo.3833867. Others data that support the findings of this study are available from the corresponding authors upon reasonable request.
The data that support the findings of this study are available from the corresponding authors upon reasonable request.


