Abstract
Social interactions are motivated behaviors that in many species facilitate learning. However, how the brain encodes the reinforcing properties of social interactions remains elusive. Here, using in vivo recording in freely moving mice, we show that dopamine (DA) neurons of the ventral tegmental area (VTA) increase their activity during interactions with an unfamiliar conspecific and display heterogeneous responses. Using a social instrumental task (SIT), we then show that VTA DA neuron activity encodes social prediction error and drives social reinforcement learning. Thus, our findings suggest that VTA DA neurons are a neural substrate for a social learning signal that drives motivated behavior.
Introduction
A broad range of species display social interactions, which include various modalities of communication between two or more conspecifics1. By increasing animal’s fitness, social behaviors are motivated through their adaptive benefits, and many social interactions are considered to be rewarding experiences both for animals and humans. Although several studies investigated the brain mechanisms underlying reward processes associated with food and drug consumption2,3, the mechanisms of social reward remain largely unknown. Clinical and pre-clinical evidence accumulated over the past decade suggests that social interactions are rewarding experiences reinforced by social cues4–8.
The reward system involves dopamine (DA) neurons of the ventral tegmental area (VTA) that mainly project to the nucleus accumbens (NAc, part of the ventral striatum) and the prefrontal cortex and are involved in motivated non-social and social behaviors. Functional magnetic resonance data showed that social visual stimuli activate the ventral striatum in humans9, and in rodents social interaction increases population activity of VTA DA neurons projecting to the NAc 6. Furthermore, we have previously shown that chemogenetic inhibition of VTA DA neurons decreases interactions with an unfamiliar conspecific10. Although these experiments implicate the VTA in social behavior, which aspects of social interactions are rewarding and how DA neurons encode specific features of social behaviors remains elusive. Here, we used in vivo recordings in freely moving mice to investigate how VTA DA neurons encode active and passive social interactions and found that they are largely activated by active (reciprocal and unilateral) interactions with unfamiliar conspecifics. Despite an overall adaptation of DA neuron activity after repeated exposure to the same conspecific, we observed a high neuronal heterogeneity, with subpopulations of neurons tuned to specific types of active or passive social interactions.
Historically, it has been shown the activity of VTA DA neurons encodes the reward prediction error (RPE), which computes the difference between the received and the expected reward, updates reward expectations and facilitates learning11–14. Positive RPE arises when reward is better than expected and leads to approach and consummatory behaviors, while negative RPE occurs when the reward is less than predicted and leads to avoidance or renouncing to consumption15. Leveraging on complex behavioral tasks, several recent studies have demonstrated heterogeneity in DA neuron responses during learning and suggested that DA transients are also sufficient and necessary for the formation of associative learning independently of value 16,17. Furthermore, in addition to encoding reward, subpopulations of DA neurons also transmit information about various behavioral variables18,19. However, whether social interaction promotes reinforcement via prediction error remains unknown.
One of the most commonly used experimental approaches to study social reward in rodents is social conditioned place preference (sCPP), which uses a range of social stimuli to induce place preference4,5,20. Although sCPP protocols have been useful tasks, they pose some limitations to the investigation of whether and how DA neurons encode a social prediction error. Among these is the inability to record time-locked neuronal activity during sCPP. To overcome these limitations, and considering that social interactions are highly complex and dynamic, we implemented an instrumental lever-pressing task that enabled us to perform in vivo electrophysiology recordings while animals press a lever to obtain social interaction. Using this behavioral paradigm, we demonstrate that mice learn to seek and interact with a conspecific, and show that VTA DA neurons signal social prediction error. Together, these findings provide novel insights into the neuronal dynamics underlying social interaction and motivation and further demonstrate that VTA DA neurons might be the neural substrate for social learning.
Results
VTA DA neuron activity increases during free social interaction
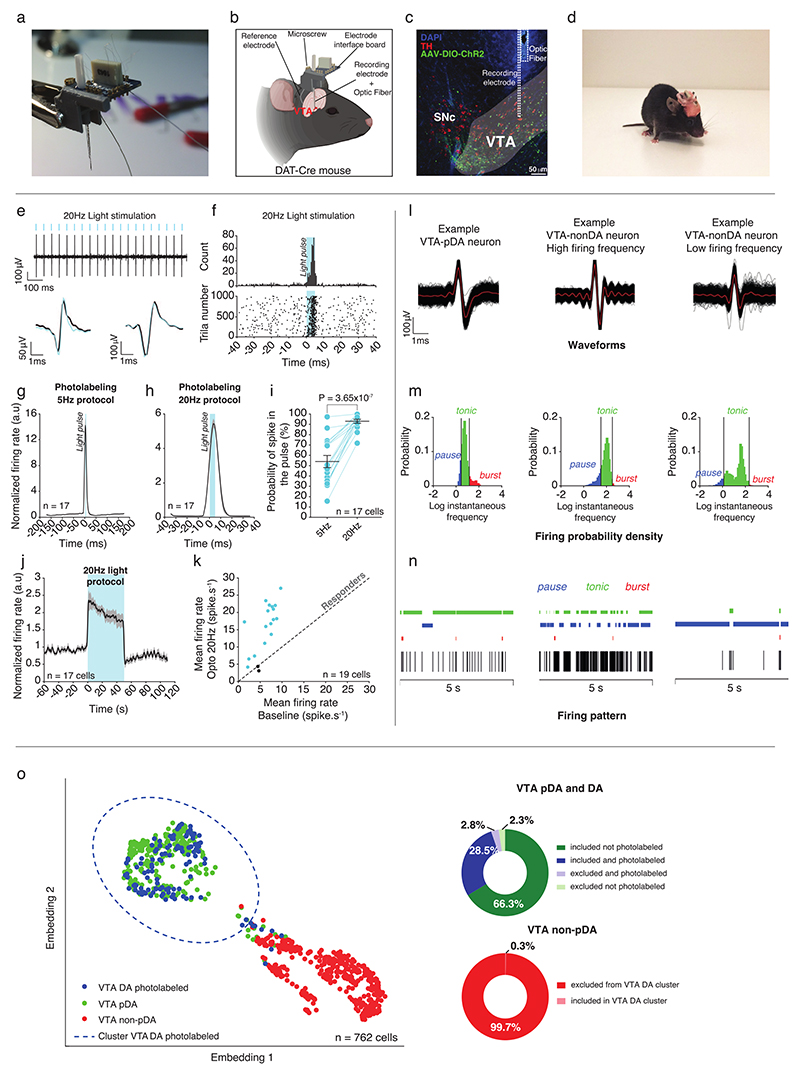
Using in vivo recordings in mice (Suppl. Fig. 1a-d), we recorded the activity of VTA DA neurons during free and direct interaction with a sex-matched unfamiliar conspecific (here defined as social stimulus; Fig. 1a). To record and optogenetically identify VTA DA neurons, AAV-DIO-ChR2 virus was first injected in experimental DAT-Cre mice, then optic fiber and recording electrodes were implanted in the VTA (Fig. 1b and Extended Data Fig. 1e-k)21. Based on waveform and firing pattern (Extended Data Fig. 1l-n), we performed an unsupervised cluster analysis and we identified two spatially distinct groups of neurons: non-putative DA and putative DA/photolabeled DA. To strengthen our clustering analysis we added 97 VTA DA neurons optogenetically identified by the Uchida laboratory (raw data associated with 22; Extended Data Fig. 1o) and 23 from the present study for a total of 120 photolabeled DA neurons. While it is possible to observe two distinct clusters, an EMGM was used to define a confidence interval of 95% based on the photolabeled DA neurons (Extended Data Fig. 1o). It should be noted that we cannot evaluate precisely the extent to which non-DA neurons are included in the putative DA cluster. Some, but not all, results were confirmed by photolabeled DA neurons. However, while such a method does not prevent the possibility to include false positive neurons in the cluster, it helps to characterize VTA DA neurons. Only putative DA neurons inside the confidence interval of the photolabeled DA neurons were used in the subsequent analyses (See Supplementary Tables 1-2).
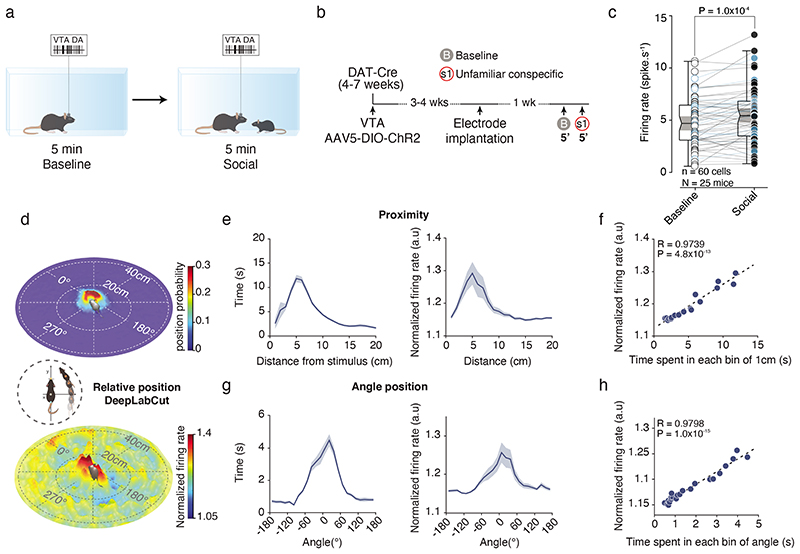
Figure 1. VTA DA neurons activity increases in social context.
(a) Schema of the free social interaction task. VTA DA neurons are recorded 5 mins during baseline and 5 mins during interaction with a conspecific. (b) Experimental time-course of the procedures. (c) VTA DA firing rate during baseline and social context. Blue dots represent photolabeled VTA DA neurons (n = 17). Paired t-test two-sided (t(16) = 4.163). (d) Middle: Schema of the analyses to obtain the relative position of the social stimulus using DeepLabCut. Top: 3D heatmap of the relative position probability of the social stimulus, mainly in proximity and on the front of the experimental mouse. Down: 3D heatmap of the normalized VTA DA firing rate depending on the relative position of the social stimulus showing increase on the front of the experimental animal. (e) Left: Time spent depending on the proximity of the social stimulus from the experimental mouse (mean = 7.7634cm, s.e.m = 0.7172cm). Right: Normalized VTA DA firing rate depending on the distance of the social stimulus (mean = 9.9282cm, s.e.m = 0.7033cm). (f) Normalized VTA DA firing rate depending on the time spent for each bin of 1cm from 0 to 20 cm of distance from the social stimulus. VTA DA activity and proximity with the social stimulus are highly correlated. Pearson’s correlation coefficient twosided (R = 0.9739, P = 4.8x10⁻¹³). (g) Left: Time spent depending on the angle position of the social stimulus (mean = 5.5443°, s.e.m = 19.7146°). Right: Normalized VTA DA firing rate depending on the angle position of the social stimulus (mean = -6.3002°, SEM = 14.1823°). (h) Normalized VTA DA firing rate depending on the time spent for each bin (10°) of angle position of the social stimulus. VTA DA activity and angle between the social stimulus and the experimental mouse are highly correlated. Pearson’s correlation coefficient two-sided (R = 0.9798, P = 1.0x10⁻¹⁵).
N, n indicate the number of mice and cells respectively. For box plots: the center line represents the median, the bounds of the box the 25 th to 75 th percentile interval and the whiskers the minima and maxima. Dots represent individual data points. All the data, except box plots, are shown as the mean +/-s.e.m. as error bars.
During 5 mins of free/direct social interaction test, we observed an overall increase in VTA DA firing rate compared to baseline (Fig. 1c), corroborating previous evidence6. However, a thorough understanding of the neuronal correlates of social interaction requires an accurate dissection of animal’s behavior. We used DeepLabCut23 and analyzed the relative position of the social stimulus toward the experimental mouse (Fig.1d) We observed that the stimulus mouse spends longer time in the visual field and in the proximity of the experimental mouse (average proximity of 8.3 cm; Fig. 1e,g). Furthermore, both the time spent by the stimulus mouse in the proximity (<5cm) and in the field of view of the experimental mouse were positively correlated with normalized VTA DA activity (Fig. 1f, h), suggesting that VTA DA firing is associated with the orientation and the contact with the social stimulus.
VTA DA neurons encode different modes of social interaction
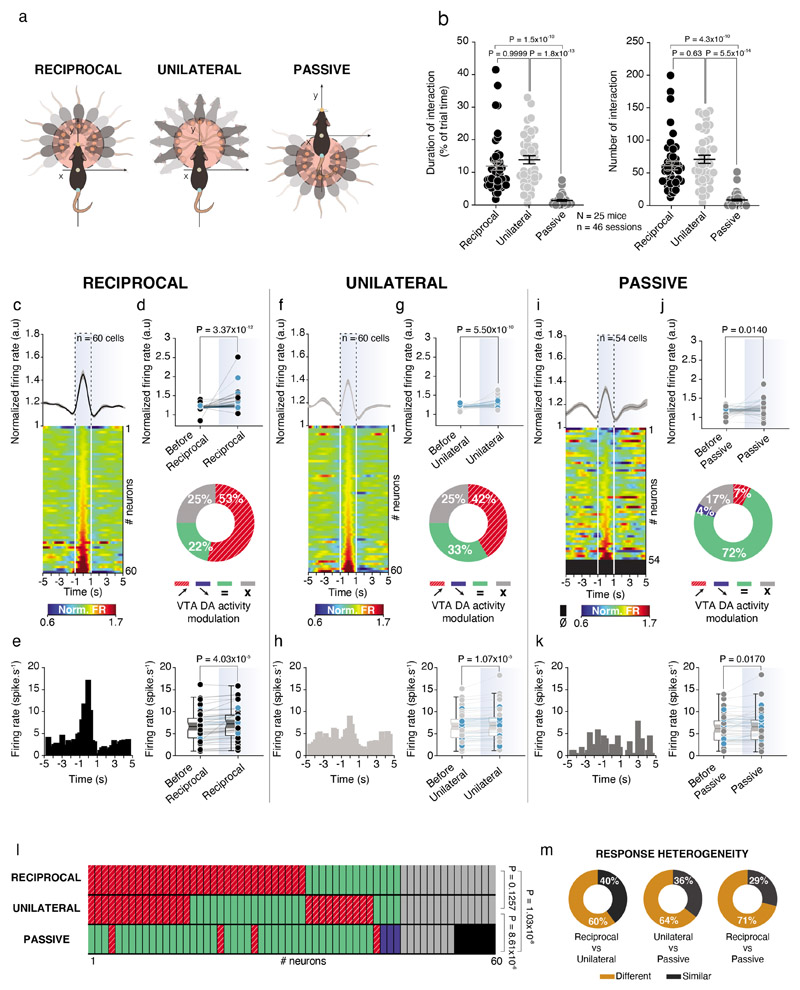
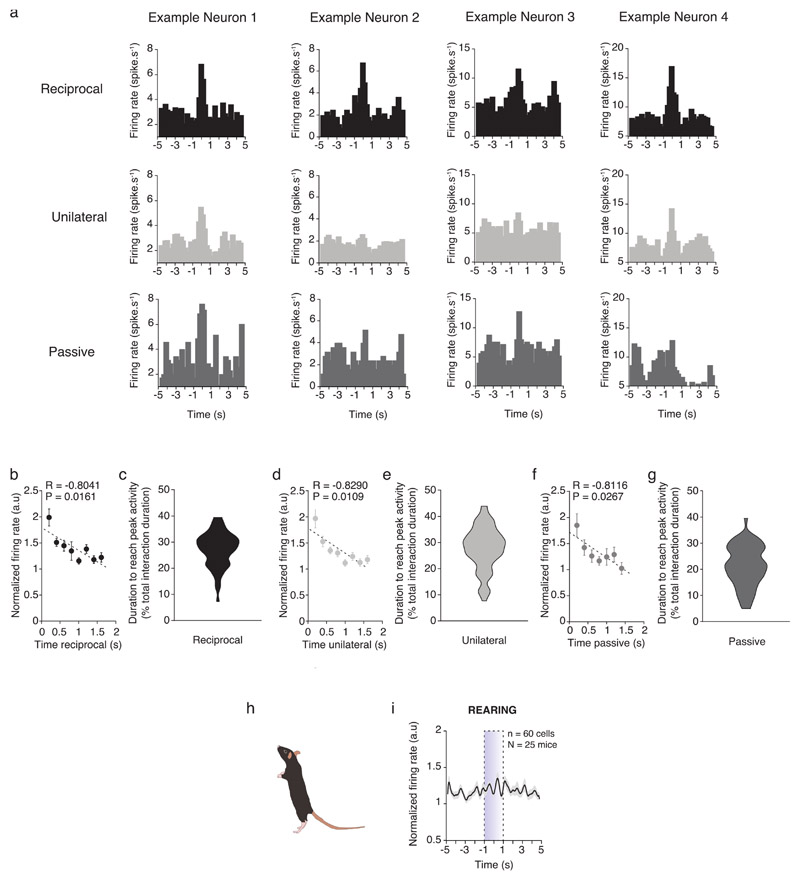
To analyze VTA DA neuron activity during specific modes of conspecific interaction, we first quantified and subdivided social contacts in either active (comprising both reciprocal and unilateral) or passive (Fig. 2a; See Materials and Methods). Experimental mice engaged for a longer time and had a higher number of reciprocal and unilateral contacts than passive contacts (Fig. 2b). When we looked at population level, all types of social contacts induced a fast and transient increase of VTA DA neuron firing rate (Fig. 2c-k). We observed heterogeneity in the responses to conspecific interaction at single neuron level. Indeed, while 53% and 42% of neurons were activated by reciprocal and unilateral active interaction, only 7% of neurons were activated by passive contacts, as represented in the pie charts (Fig. 2d, g, j). We observed that there were aslo heterogeneous responses at the level of individual neurons: while some neurons increased or decreased their activity in response to reciprocal, unilateral or passive interactions only, others were similarly modulated by multiple modes of interaction (Fig. 2l, m; Extended Data Fig. 2a). As a control, we considered behavior not related to conspecific interactions and we observed that rearing did not increase VTA DA neuron activity (Extended Data Fig. 2h, i). Altogether, these data suggest that VTA DA neuron subpopulations could encode specific modes of social contact.
Figure 2. VTA DA neurons activity increases during social interactions with high heterogeneity response.
(a) Schema of the analyses to obtain reciprocal (Left), unilateral (Middle) and passive (Right) interactions. (b) Left: Time spent in reciprocal, unilateral and passive interactions for the experimental mouse. Friedman test two-sided (χ2 (46) = 66.91, P = 3x10-15), followed by Dunn’s test. Right: Number of contacts in reciprocal, unilateral and passive interactions for the experimental mouse. Friedman test two-sided (χ2 (46) = 67.97, P = 2x10-15), followed by Dunn’s test. (c) Top: Normalized VTA DA firing rate during reciprocal interaction with the Peri-Event Time Histogram (PETH) centered on the reciprocal contacts 5s before and after. Down: Associated heatmap of each neuron recorded classify in ascending order. (d) Top: Normalized VTA DA firing rate before and during reciprocal interaction. Blue dots represent photolabeled neurons (n = 17). Wilcoxon test twosided (W = 1652). Down: Proportion of the different VTA DA neurons activity responses during reciprocal events (red/stripes, increasing; blue, decreasing; green, no activity changes for a given interaction; grey, no activity changes independently the type of interaction). (e) Left: PETH of one example neuron during reciprocal interaction showing an increase. Right: Firing rate of VTA DA neurons before and during reciprocal interaction. Blue dots represent photolabeled neurons (n = 17). Paired t-test two-sided (t(59) = 4.438). (f) Top: Normalized VTA DA firing rate during unilateral interaction with the PETH centered on the unilateral contacts 5s before and after. Down: Associated heatmap of each neuron recorded classify in ascending order. (g) Top: Normalized VTA DA firing rate before and during unilateral interaction. Blue dots represent photolabeled neurons (n = 17). Wilcoxon test two-sided (W = 1524). Down: Proportion of the different VTA DA neurons activity responses during unilateral events. (h) Left: PETH of the same example neuron than in (e) during unilateral interaction showing small increase. Right: Firing rate of VTA DA neurons before and during unilateral interaction. Blue dots represent photolabeled neurons (n = 17). Paired t-test two-sided (t(59) = 4.812). (i) Top: Normalized VTA DA firing rate during passive interaction with the PETH centered on the passive contact 5s before and after. Down: Associated heatmap of each neuron classify in ascending order. (j) Top: Normalized VTA DA activity before and during passive interaction. Blue dots represent photolabeled neurons (n = 17). Wilcoxon test two-sided (W = 567). Down: Proportion of the different VTA DA neurons activity responses in passive interaction. (k) Left: PETH of the same neuron than in (e) and (h) during passive interaction not showing any changes in activity. Right: Firing rate of VTA DA neurons before and during passive interaction. Blue dots represent photolabeled neurons (n = 17). Wilcoxon test two-sided (W = 551). (l) Activity changes of the same VTA DA neurons depending on the type of interaction between reciprocal, unilateral and passive. Chi-square test two-sided between ratio of responses type for each interaction (Overall: χ2 (4) = 39.97, P = 4.39x10⁻⁸; Reciprocal vs unilateral: χ2 (1) = 2.344; Reciprocal vs passive: χ2 (2) = 36.78; Unilateral vs passive: χ2 (2) = 23.33). (m) Response heterogeneity of VTA DA neurons between reciprocal, unilateral and passive interactions in the neurons responding to at least one type of interaction. The neurons show either different or similar responses to the different contacts.
N, n indicate the number of mice and cells respectively (except for (b) where n indicates sessions). For box plots: the center line represents the median, the bounds of the box the 25th to 75th percentile interval and the whiskers the minima and maxima. Dots represent individual data points. All the data, except box plots, are shown as the mean +/- s.e.m. as error bars.
We next asked whether VTA DA neuron activation was transient or sustained during the entirety of social interaction bouts. The analysis revealed that higher VTA DA activity was associated with a shorter time of interaction (Extended Data Fig. 2b, d, f). Furthermore, analysis of VTA DA neuron activity throughout the total duration of interaction bouts indicated that DA activation was not sustained and that the activation peak always occurred during the first half of each bout for all modes of social contacts (Extended Data Fig. 2c, e, g). These experiments suggest that VTA DA neurons are tuned to the initiation of social interaction rather than to ongoing social interaction.
VTA DA neuron subpopulations respond differently through exposure to a familiar conspecific
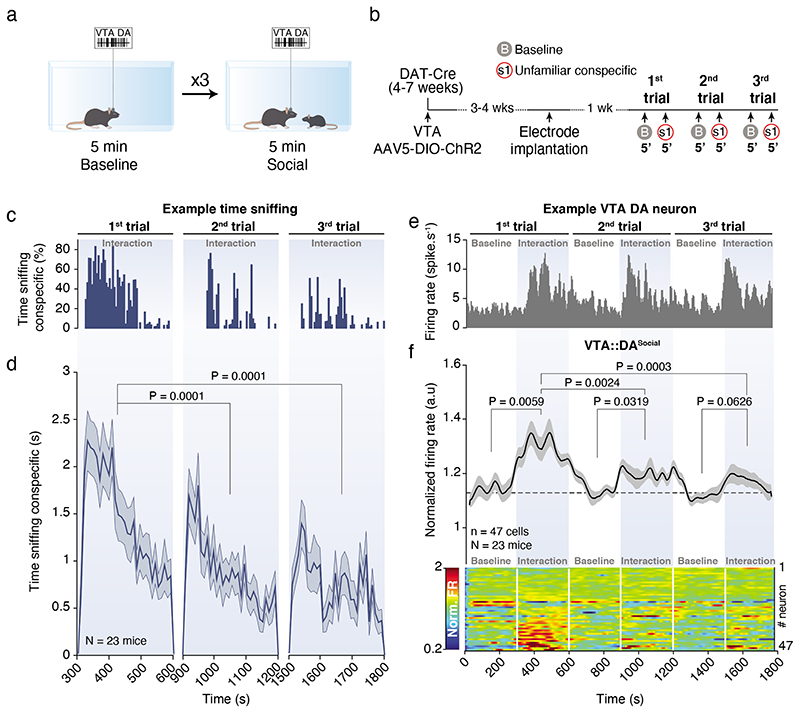
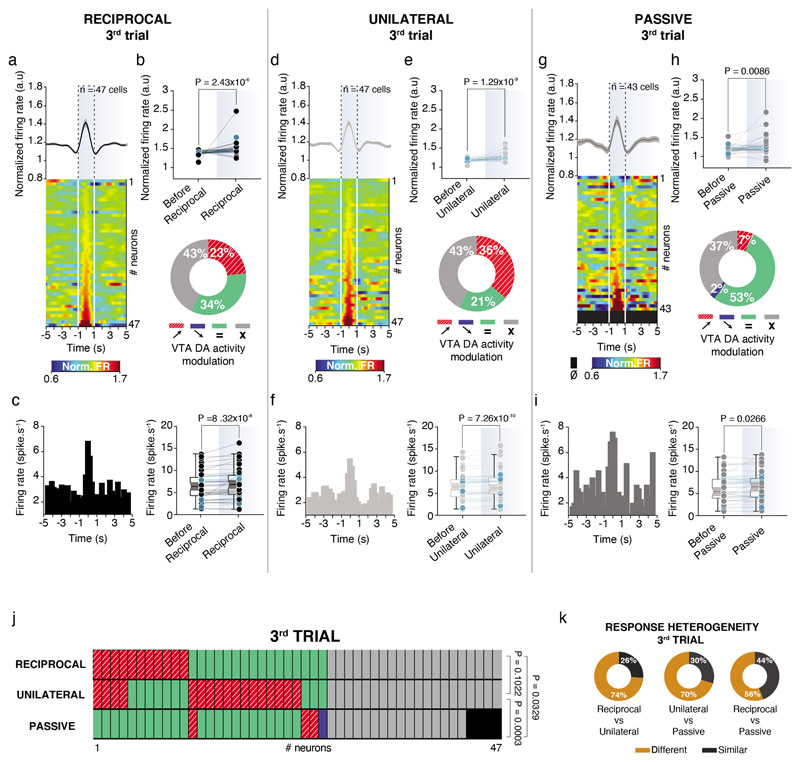
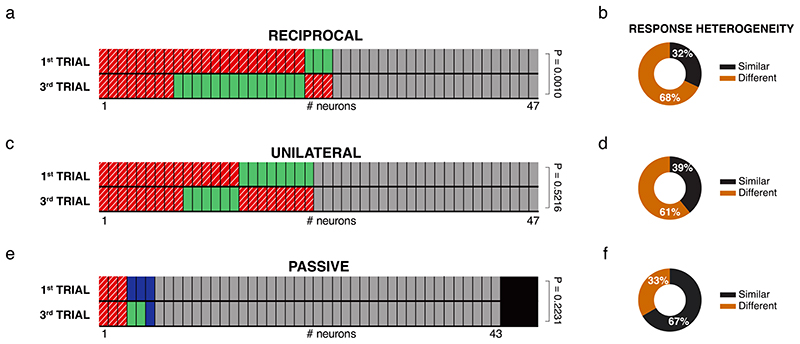
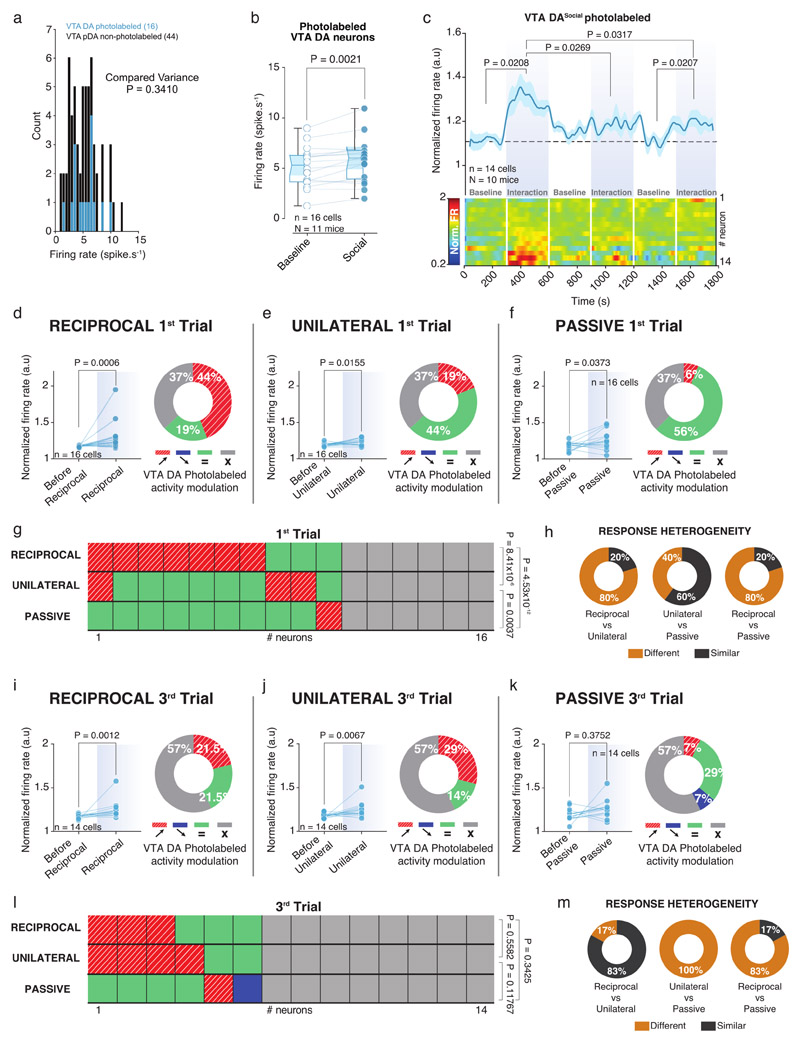
Within the VTA, different subsets of DA neurons are biased towards saliency or novelty rather than reward value 24,25,26. Therefore, we asked whether VTA DA neurons show different responses depending on the type of social contacts across multiple exposures to the same conspecific. In the free and direct interaction task, we repeatedly exposed the experimental mouse to the same social stimulus during 3 trials of 5 min interspaced by 5 min without social interaction (Fig. 3a, b). As previously shown10, time sniffing the social stimulus habituated within and between the 3 trials (Fig. 3c, d). We observed the same pattern of habituation for VTA DA activity (Fig. 3e, f), suggesting that also neuronal activity adapted to the social context. However, when we time-locked DA neuronal activity to the interaction bouts of either active or passive interactions, we observed that, as in the 1st trial, the firing rate still significantly increased during interactions in the 3rd trial (Fig. 4a-i). We revealed a high degree of heterogeneity between different modes of interaction (Fig. 4j, k) not only during the 3rd trial, but also when we compared the responses between the 1st and the 3rd trials for individual neurons (Extended Data Fig. 3a-f). The same analyses were performed only in VTA DA photolabeled neurons, with similar results (Extended Data Fig. 4). Altogether, these data suggest that different VTA DA subpopulations may respond differently to social contacts during repeated exposures to a familiar stimulus.
Figure 3. VTA DA neuron activity adapts to social context through free repeated conspecific exposure.
(a) Schema of the repeated free social interaction task. VTA DA neurons are recorded 5 mins during baseline and 5 mins during interaction with the same conspecific repeated three times. (b) Experimental time-course of the procedures with injections, implantations and behaviors. (c) Example of time sniffing the social stimulus across the 3 trials for one mouse. (d) Time sniffing the social stimulus during the 3 trials showing a habituation in the time interacting with the conspecific. Friedman test two-sided (χ2 (23) = 22.80, P = 1x10-15) followed by Bonferroni-Holm correction. (e) Example of the time course of a VTA DA neuron firing rate during repeated free social interaction. (f) Time course of the normalized VTA DA neuron firing rate during baselines and social sessions (top) with the associated heatmap of each neuron recorded (down). VTA DA activity increases during social interaction and habituates through exposures. 14 neurons are photolabeled. Repeated Measure (RM) one-way ANOVA (Time main effect: F(5,46) = 7.55, P = 1.39x10⁻⁶) followed by Bonferroni-Holm correction.
N, n indicate the number of mice and cells respectively. The data are shown as the mean +/- s.e.m. as error bars.
Figure 4. VTA DA neuron activity encodes active interaction value.
(a) Top: Normalized VTA DA firing rate during reciprocal interaction in the 3rd trial with the Peri-Event Time Histogram (PETH) centered on the reciprocal contacts 5s before and after. Down: Associated heatmap of each neuron recorded classify in ascending order. (b) Top: Normalized VTA DA firing rate before and during reciprocal interaction. Blue dots represent photolabeled neurons (n = 14). Wilcoxon test two-sided (W = 834). Down: Proportion of the different VTA DA neurons activity responses during reciprocal events (red/stripes, increasing; blue, decreasing; green, no activity changes for a given interaction; grey, no activity changes independently the type of interaction). (c) Left: PETH of one example neuron during reciprocal interaction showing an increase. Right: Firing rate of VTA DA neurons before and during reciprocal interaction. Blue dots represent photolabeled neurons (n = 14). Paired t-test two-sided (t(46) = 3.657). (d) Top: Normalized VTA DA firing rate during unilateral interaction in the 3rd trial with the Peri-Event Time Histogram (PETH) centered on the unilateral contacts 5s before and after. Down: Associated heatmap of each neuron recorded classify in ascending order. (e) Top: Normalized VTA DA firing rate before and during unilateral interaction. Blue dots represent photolabeled neurons (n = 14). Wilcoxon test two-sided (W = 1010). Down: Proportion of the different VTA DA neurons activity responses during unilateral events. (f) Left: PETH of one example neuron during unilateral interaction showing an increase. Right: Firing rate of VTA DA neurons before and during unilateral interaction. Blue dots represent photolabeled neurons (n = 14). Wilcoxon test two-sided (W = 1020). (g) Top: Normalized VTA DA firing rate during passive interaction in the 3rd trial with the Peri-Event Time Histogram (PETH) centered on the passive contacts 5s before and after. Down: Associated heatmap of each neuron recorded classify in ascending order. (h) Top: Normalized VTA DA firing rate before and during passive interaction. Blue dots represent photolabeled neurons (n = 14). Wilcoxon test two-sided (W = 430). Down: Proportion of the different VTA DA neurons activity responses during passive events. (i) Left: PETH of one example neuron during passive interaction showing an increase. Right: Firing rate of VTA DA neurons before and during passive interaction. Blue dots represent photolabeled neurons (n = 14). Paired t-test two-sided (t(42) = 2.298). (j) Activity changes of the same VTA DA neurons depending on the type of interaction between reciprocal, unilateral and passive. Chi-square test two-sided between ratio of responses type for each interaction (Overall: χ2 (4) = 16.73, P = 0.0022; Reciprocal vs unilateral: χ2 (1) = 2.670; Reciprocal vs passive: χ2 (2) = 6.828; Unilateral vs passive: χ2 (2) = 15.92). (k) Response heterogeneity of VTA DA neurons between reciprocal, unilateral and passive interactions in the neurons responding to at least one type of interaction. The neurons show either different or similar responses to the different contacts.
n indicates the number of cells. For box plots: the center line represents the median, the bounds of the box the 25th to 75th percentile interval and the whiskers the minima and maxima. Dots represent individual data points. All the data, except box plots, are shown as the mean +/-s.e.m. as error bars.
Reinforcing properties of social interaction through the social instrumental task (SIT)
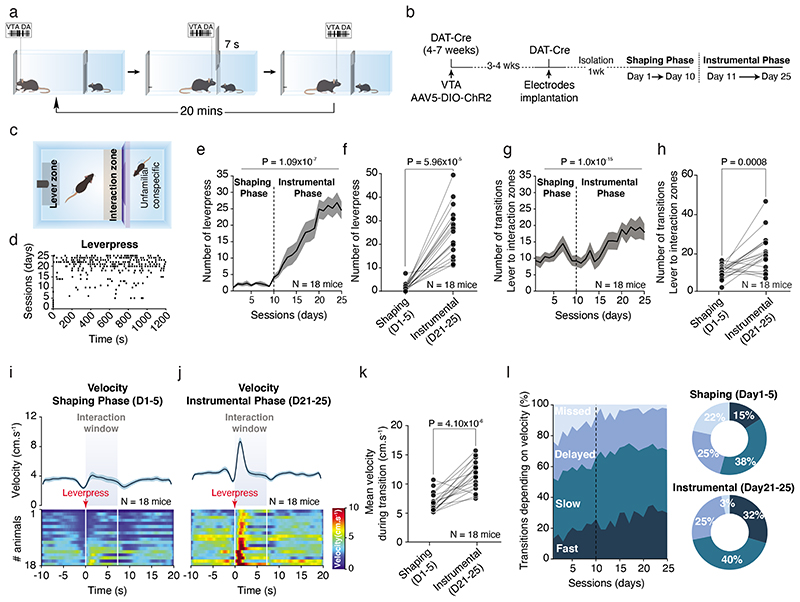
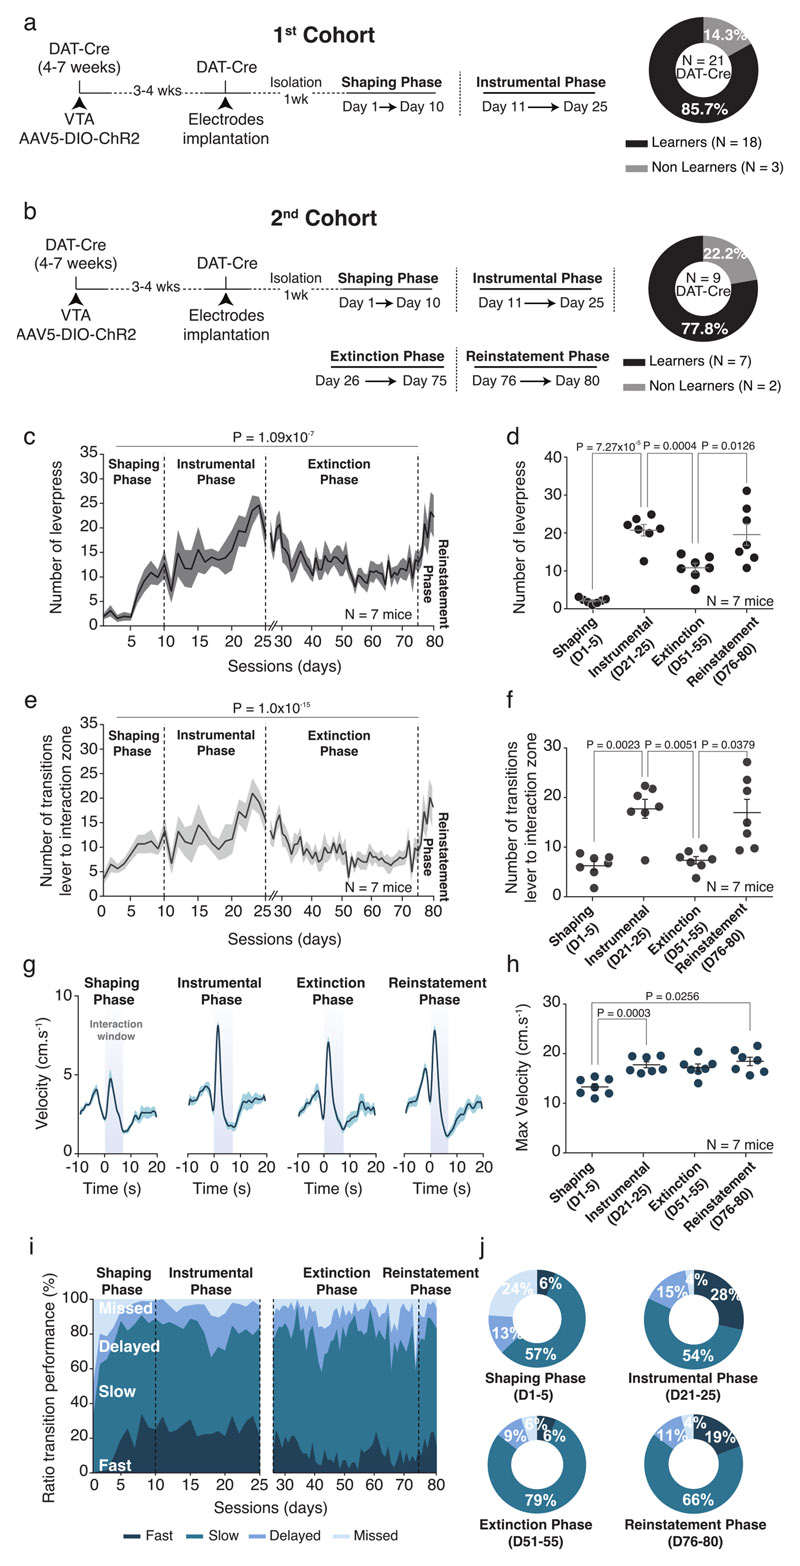
The increase in VTA DA neuron activity during active contacts indicates that social interaction recruits the reward system and suggests that this system might play a role in social reinforcement learning. To investigate the reinforcing properties of social interaction, we implemented a social instrumental task (SIT) using two-chambered shuttle boxes divided by a gridded auto-guillotine door. The lever in one chamber controlled the opening of the door, allowing interaction between two conspecifics (Fig. 5a). We trained the experimental mice to associate the lever press with the door opening to gain access to a social stimulus, in a daily 20-minute session. After 10 days of training (shaping phase), experimental mice were tested for 15 days (instrumental phase; Fig. 5b, c). Between the shaping and the instrumental phases, the increased number of lever presses (Fig. 5d-f) and transitions of the mouse from the lever to the interaction zone (Fig. 5g, h) indicated that the majority of the mice learned the task (Extended Data Fig. 5a). During the instrumental phase, we observed an increase in the locomotion peak velocity at the lever press (Fig. 5i-k). This occurred together with an increase in fast transitions (< 2sec) and a decrease of missed trials compared to the shaping phase, while the number of slow and delayed transitions did not change (Fig. 5l). To further characterize the task, we confirmed the ability of a different cohort of mice to extinguish and subsequently reinstate operant responses (Extended Data Fig. 5b). The number of lever presses (Extended Data Fig. 5c, d) and transitions (Extended Data Fig. 5e, f) decreased during the extinction, and increased again during the reinstatement phase. While the peak velocity during the transitions between lever and interaction zones increased in the instrumental and reinstatement phases, we did not notice a significant decrease during the extinction phase (Extended Data Fig. 5g, h). However, the proportion of fast transitions (< 2sec) between the lever and the interaction zones increased during instrumental and reinstatement phases compared to shaping and extinction phases (Extended Data Fig. 5i-j). These data suggest that the interaction with social stimulus sustains social reinforcement learning.
Figure 5. Social Instrumental Task (SIT).
(a) Schema of the SIT for one session. The mice can press the lever to open a gridded auto-guillotine door and interact with a conspecific. The door stays open during 7s before to close. One session is lasting 20 mins and the animals can press the lever all whenever during the session. (b) Experimental time-course of the procedures and the different phases of the task across days. (c) Schema of the operant chamber defining the different zones around the lever (lever zone) and the door (interaction zone). (d) Raster plot example of lever presses of one mouse across the different sessions in shaping and instrumental phases illustrating increase in the number of lever presses through the days. (e) Number of lever presses across the different phases. The mice increase the number of lever presses. RM one-way ANOVA (Time main effect: F(24,17) = 30.18, P = 1.09x10⁻⁷). (f) Number of lever-press between the shaping (D1-D5) and the instrumental (D21-D25) phases for each animal. Wilcoxon test two-sided (W = 0). (g) Number of transitions between the lever and the interaction zones. Friedman test two-sided (χ2 (18) = 83.95, P = 1.0x10⁻¹⁵). (h) Number of transitions between the shaping and the instrumental phases. The mice increase the number of transitions between the lever and the interaction zones. Paired t-test two-sided (t(17) = 4.074). (i) Top: PETH of the velocity for the shaping phase centered on the lever presses 10s before and 20s after. Down: Associated heatmap of each animal. (j) Top: PETH of the velocity for the instrumental phase centered on the lever presses 10s before and 20s after. A peak of velocity appears right after the lever press. Down: Associated velocity heatmap of each animal. (k) Averaged velocity during the transition from the lever to the interaction zones, between the shaping and the instrumental phases for each animal. The mice increase their velocity during the transitions. Paired t-test two-sided (t(17) = 6.650). (l) Left: % of the different transitions between lever and interaction zones depending on the velocity across the sessions: fast (< 2s), slow (between 2s and 7s), delayed (between 7s and 12s) and missed (> 12s). Right: Proportion of the different transitions during the shaping and the instrumental phases. There are higher fast transitions and lower missed trials in instrumental phase compared to shaping phase. N indicates the number of mice. Error bars report s.e.m. All the data are shown as the mean +/-s.e.m. as error bars.
Prediction encoded by VTA DA neurons emerges through the SIT
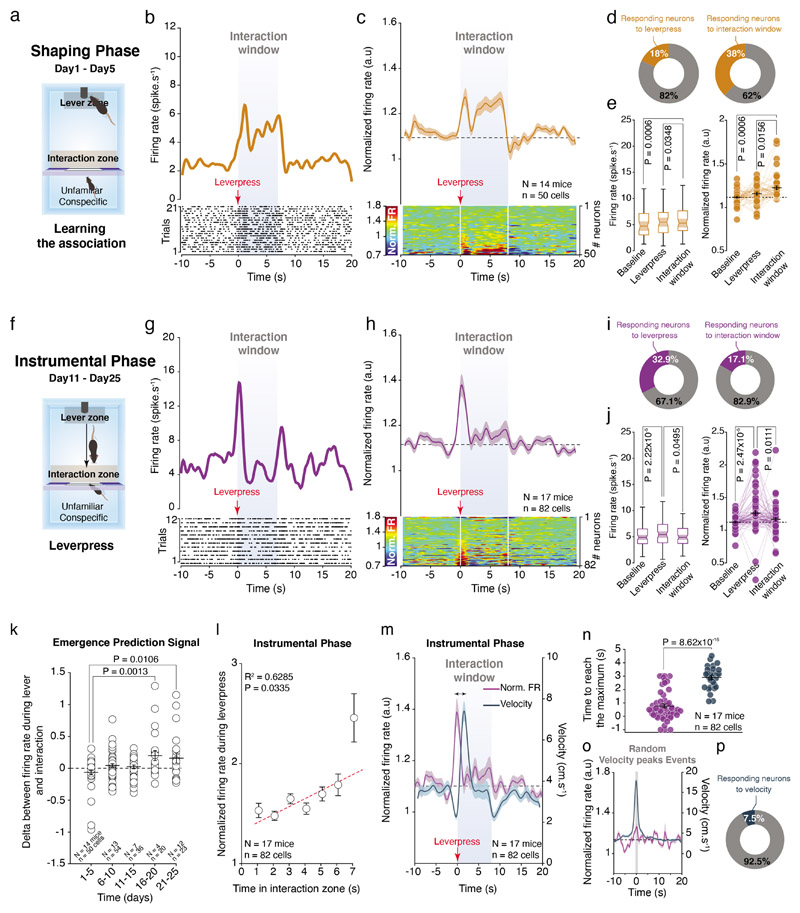
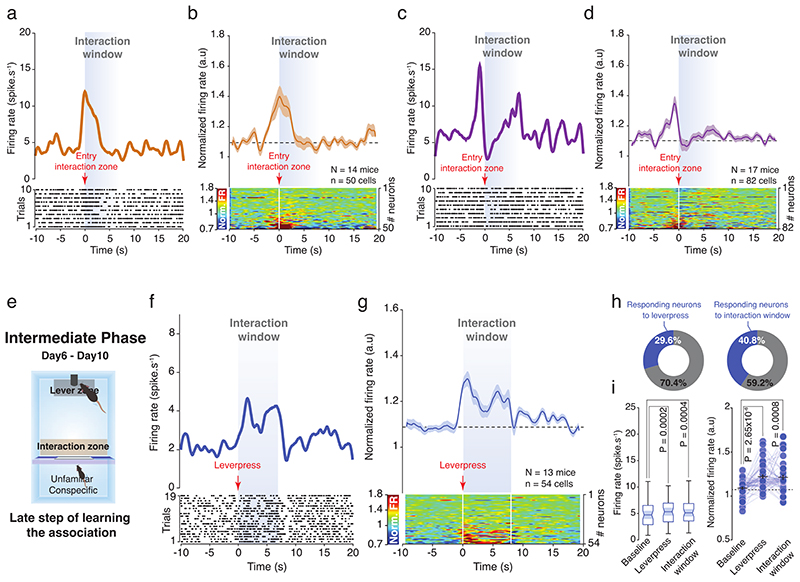
We then recorded VTA DA neuron activity across the SIT. During the shaping phase, by averaging the trials across the recorded VTA DA neurons, we observed an overall increase in the firing rate and in the normalized firing frequency when the social stimulus was accessible (i.e. during interaction window). This increase was observed when neuronal activity was aligned to either the entry in the interaction zone (Extended Data Fig. 6a, b) or to the lever press event (Fig. 6a-d). During the shaping phase, we also noted that more neurons increased their activity during the interaction window (38%) than at the lever press (18%, Fig. 6d, e). However, during the instrumental phase, the increased activity shifted to the onset of the lever press (Fig. 6f-j) and right before the entry to the interaction zone (Extended Data Fig 6c, d). This was associated with a higher proportion of neurons responding to the lever press (32.9%) compared to interaction (17.1%, Fig. 6i). Of note, during an intermediate phase (between the shaping and instrumental phases (day6 – day10), Extended Data Fig 6e) we observed the emergence of the VTA DA activity at the onset of the lever press (Extended Data Fig 6f-g) and a high proportion of VTA DA neurons that increase their activity during interaction window (Extended Data Fig 6h, i). These data suggest the progressive shift in the VTA DA activity occurs during the SIT.
Figure 6. VTA DA neuron activity encodes the positive value of social interaction during the SIT.
(a) Schema of the operant chamber during the shaping phase (D1-D5). The VTA DA neurons are recorded while animals learn the task. (b) Top: PETH of one VTA DA neuron responding during interaction window 10s before and 20s after. Down: Associated raster plot of the neuron during a session of the shaping phase. (c) Top: PETH of the normalized VTA DA firing rate during the shaping phase centered on the lever presses. VTA DA neurons increase their activity during the interaction window. Down: Associated heatmap of each neuron recorded and classify in ascending order. (d) Proportion of all recorded VTA DA neurons that increases their activity during the lever press (left) and the interaction window (right). (e) Left: Firing rate (spike.s-1) of VTA DA neurons during baseline, the lever press and the interaction window. RM one-way ANOVA (Events main effect: F(2,49) = 7.07, P = 0.0014) followed by Bonferroni-Holm correction. Right: Normalized VTA DA firing rate during baseline, the lever press and the interaction window. Friedman test (χ2 (50) = 19.24, P = 6.64x10⁻⁵) followed by Bonferroni-Holm correction. (f) Schema of the operant chamber during the instrumental phase (D11-D25). The VTA DA neurons are recorded after animals learn the task. (g) Top: PETH of one VTA DA neuron responding during lever press 10s before and 20s after. Down: Associated raster plot of the neuron during a session of the instrumental phase. (h) Top: PETH of the normalized VTA DA firing rate during the instrumental phase, centered on the lever presses. VTA DA neurons increase their activity during the lever press. Down: Associated heatmap of each neuron recorded and classify in ascending order. (i) Proportion of all recorded VTA DA neurons increasing their activity during the lever press (Left) and the interaction window (Right). (j) Left: Firing rate (spike.s-1) of VTA DA neurons during baseline, the lever press and the interaction window. Friedman test two-sided (χ2 (82) = 44.22, P = 9.77x10⁻⁴) followed by Bonferroni-Holm correction. Right: Normalized VTA DA activity during baseline, the lever press and the interaction window. Friedman test (χ2 (82) = 31.20, P = 4.08x10⁻⁵) followed by Bonferroni-Holm correction. (k) Difference between the firing rate during the lever press and during the interaction window to see the emergence of the prediction across the days. The prediction starts from D15 when the animals learned the task. One-way ANOVA (Time main effect: F(4,179) = 4.976, P = 0.0008) followed by Bonferroni-Holm correction. (l) Normalized VTA DA firing rate during the lever press in function of the consecutive time spent in the interaction zone. The predictive VTA DA activity is correlated with time spent interacting with conspecific. Pearson’s correlation coefficient (Adjusted R2 = 0.6285, P = 0.0335). (m) PETH of the normalized VTA DA firing rate (same data than in panel h) and the velocity of the mice during the instrumental phase (D11-D25). The double arrow represents the delay between the VTA DA activity and the velocity peaks. The peak of velocity occurs after the peak of VTA DA activity, at the action initiation. (n) Time to reach the maximum VTA DA activity and the maximum velocity one second around the lever press. Mann-Whitney U test two-sided (U = 1814). (o) PETH centered to similar velocity peaks events outside trials during the instrumental phase with the corresponding normalized VTA DA firing rate. At population level, VTA DA neurons are not modulated by velocity. (p) Proportion of the VTA DA neurons responding to the random peaks of velocity during the instrumental phase by increasing their activity. Only a small proportion of neurons is modulated by velocity.
N, n indicate the number of mice and cells respectively. For box plots: the center line represents the median, the bounds of the box the 25 th to 75 th percentile interval and the whiskers the minima and maxima. Dots represent individual data points. All the data, except box plots, are shown as the mean +/- s.e.m. as error bars.
Further analysis showed the emergence of a prediction error signal through the SIT (Fig. 6k) and a significant correlation between normalized VTA DA activity at the moment of lever press and the time spent in the interaction zone (Fig. 6l). These results suggest that the VTA DA activity during the lever press progressively emerges and predicts the time spent interacting. Overall, we did not find that VTA DA firing rate correlated with locomotor activity. Indeed, the peak of VTA DA activity occurred at the action initiation, before the peak of velocity (Fig. 6m, n). Moreover, similar peaks of velocity outside trials (i.e. when the mice are not lever-pressing) are not preceded by a significant peak in neuronal activity (Fig. 6o). Although we also observed that some neurons respond to changes in the mouse’s velocity (Fig. 6p), these neurons are not sufficient to change the overall VTA DA activity. Together, these results indicate that the activity of VTA DA neurons encodes mainly the time spent interacting with the conspecific, through a phasic signal that emerges progressively during learning.
VTA DA neurons encode a social prediction error during the SIT
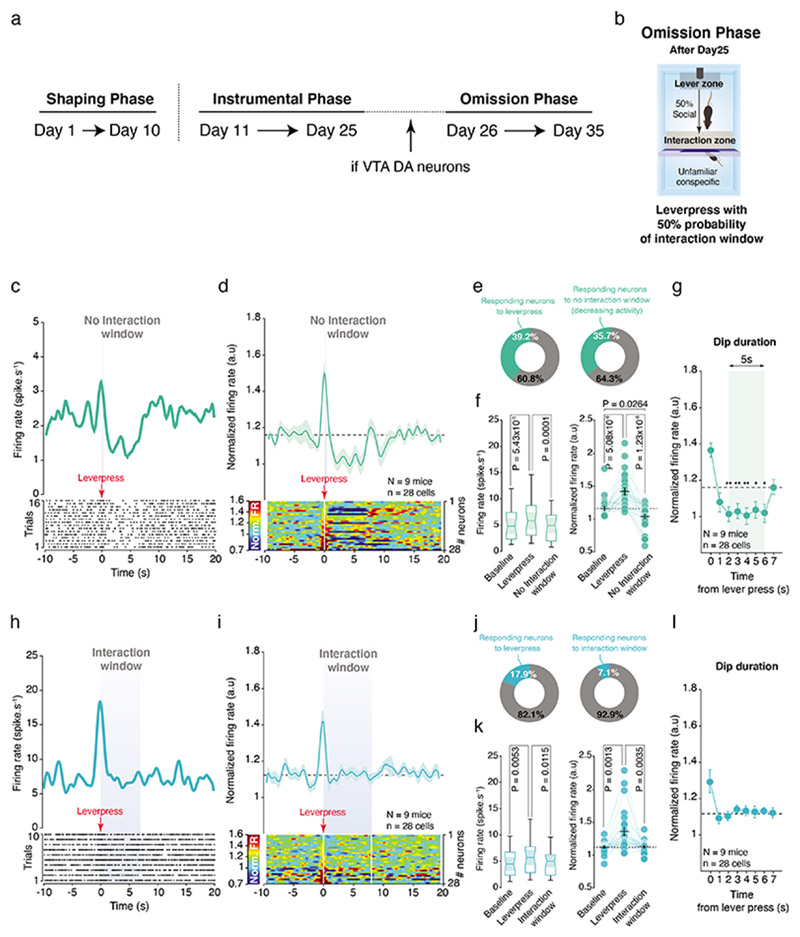
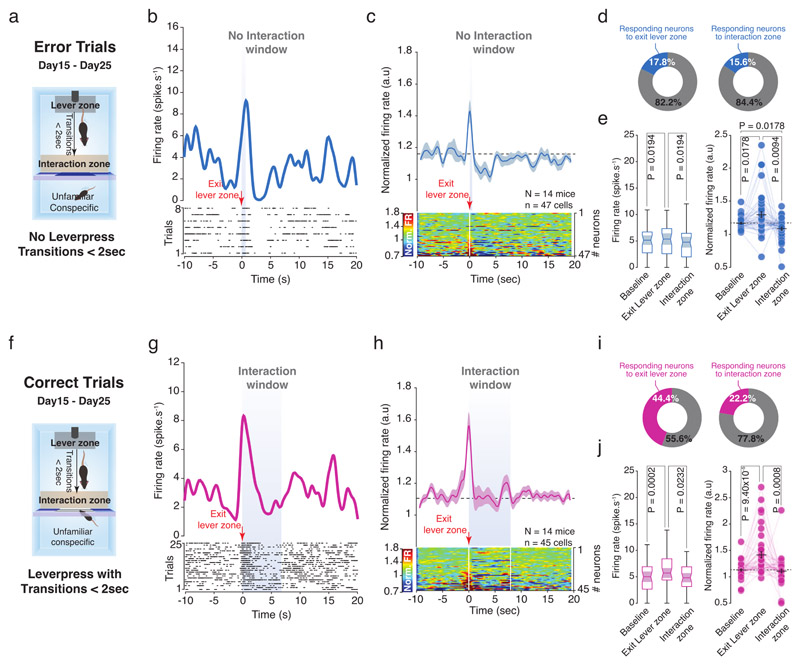
Of note, in some trials the experimental mice transited from the lever to the interaction zones in less than 2 seconds without pressing the lever. We considered those trials as error trials (Extended Data Fig. 7a). Here, the increased neuronal activity recorded when the mice were leaving the lever zone was followed by a decrease in normalized VTA DA firing when the mice expected to interact with the social stimulus (Extended Data Fig. 7b-e). As control, we looked at the transitions made in less than 2 seconds occurring after a lever press (correct trials; Extended Data Fig. 7f). On these trials, when the activity was aligned on the exit from the lever zone, we still observed the increased activity of VTA DA neurons without decrease during the interaction window (Extended Data Fig. 7g-j). After the instrumental phase, some mice underwent an omission phase, consisting of trials characterized by unpredictable access to the social stimulus after the lever press (Fig. 7a, b). When the social stimulus was unexpectedly not accessible during some trials, the phasic increase was still observed at the lever press, but there was a strong decrease in the normalized VTA DA activity during the expected social interaction window (Fig. 7c-f). This dip in the normalized VTA DA activity started to appear 2 seconds after the lever press until 6 seconds (Fig. 7g). Notably, during the trials with access to the social stimulus, we still observed an increase in VTA DA neurons phasic activity at the lever press but no decrease in neuronal activity during the interaction window (Fig7 h-l).
Figure 7. VTA DA neurons encode a social prediction error: Omission Phase.
(a) Time course of the experimental design with the shaping, instrumental and omission phases. If VTA DA neurons were still present at the end of the instrumental phase, the animals performed an omission paradigm. (b) Schema of the operant chamber during the omission phase. The mice have 50% of chance to obtain social interaction after lever press and cannot predict if the door will open or not. (c) Top: PETH of one VTA DA neuron responding during lever press and interaction window when the door stays closed. Down: Associated raster plot of the neuron during a session of the omission phase. (d) Top: PETH of the normalized VTA DA firing rate during the omission phase, centered on the lever presses when the door stays closed. While there is still an increase of VTA DA activity during the lever press, there is an inhibition when the interaction window should have occurred. Down: Associated heatmap of each neuron recorded. (e) Proportion of all recorded VTA DA neurons increasing their activity during the lever press (Left) and decreasing activity when the door stays closed (Right). (f) Left: Firing rate (spike.s-1) of VTA DA neurons during baseline, the lever press and the expected interaction window. RM one-way ANOVA (Events main effect: F(2,27) = 18.40, P = 8.08x10⁻⁷) followed by Bonferroni-Holm correction. Right: Normalized VTA DA activity during baseline, the lever press and the expected interaction window. Friedman test (χ2 (28) = 29.79, P = 3.40x10⁻⁷) followed by Bonferroni-Holm correction. (g) Normalized VTA DA firing rate binned in 1s from the lever press to the end of the interaction window to calculate the dip duration (5s) during social omission. RM one-way ANOVA (Time main effect: F(7,27) = 15.47, P = 5.55x10⁻¹⁶) followed by Dunn’s test. (h) Top: PETH of one VTA DA neuron responding during lever press when the door is open. Down: Associated raster plot of the neuron during a session of the omission phase. (i) Top: PETH of the normalized VTA DA activity during the omission phase, centered on the lever presses when the door opens. There is an increase of activity at the lever press as shown during the instrumental phase. Down: Associated heatmap of each neuron recorded. (j) Proportion of all recorded VTA DA neurons increasing their activity during the lever press (Left) and increasing activity when the door is open (Right). (k) Left: Firing rate (spike.s-1) of VTA DA neurons during baseline, the lever press and the interaction window when the door is open. RM one-way ANOVA (Events main effect: F(2,27) = 9.60, P = 0.0003) followed by Bonferroni-Holm correction. Right: Normalized VTA DA activity during baseline, the lever press and the interaction window. Friedman test (χ2 (28) = 19.79, P = 5.05x10⁻⁵) followed by Bonferroni-Holm correction. (l) Normalized VTA DA firing rate binned in 1s from the lever press to the end of the interaction window to calculate the dip duration (0s) during social omission. There is no significant dip when the door is open. RM one-way ANOVA (Time main effect: F(7,27) = 4.13, P = 2.98x10⁻⁴) followed by Dunn’s test.
N, n indicate the number of mice and cells respectively. For box plots: the center line represents the median, the bounds of the box the 25 th to 75 th percentile interval and the whiskers the minima and maxima. Dots represent individual data points. All the data, except box plots, are shown as the mean +/- s.e.m. as error bars.
Altogether, these data suggest that social interaction has motivational value and that VTA DA neurons encode social prediction error (SPE) to support social reinforcement learning.
Optogenetic inhibition of VTA DA neurons affects social reinforcement learning
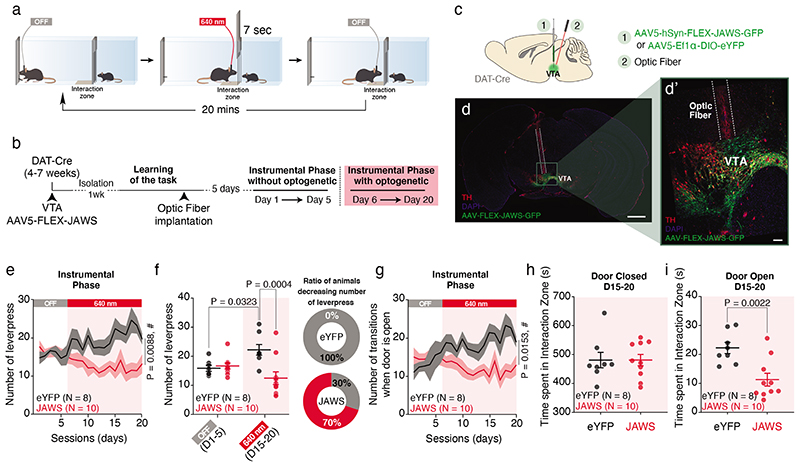
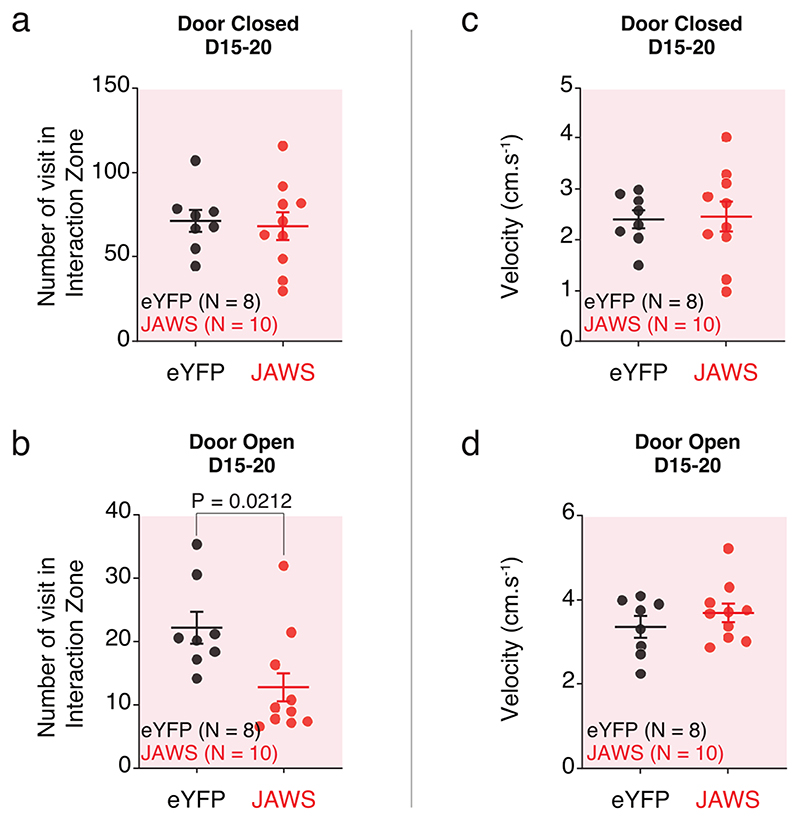
Finally, to test that VTA DA activity is causally involved in social reinforcement learning, we injected red shifted AAV-FLEX-Jaws opsin or control AAV-DIO-eYFP in the VTA of DAT-Cre mice to optogenetically inhibit VTA DA neurons during the SIT (Fig. 8a-d). Once mice reached the learning criterion (see Material and Methods), we started the task. During 5 days the mice underwent the classical SIT without optogenetic manipulation. From day 6 to day 20 we optogenetically inhibited VTA DA neurons at the time the mouse entered the interaction zone after pressing the lever (Fig. 8a, b). While the number of lever presses and the number of transitions increased in control eYFP mice between off and light conditions, on average we did not observe significant changes in JAWS injected mice (Fig. 8e-g). When we considered individual mice, we observed that 70% of JAWS-injected mice reduced the number of lever presses as a consequence of the inhibition (Fig. 8f). Finally, to exclude the possibility that VTA DA neuron inhibition induced a conditioned place aversion during the task, we calculated the time spent in the interaction zone when the door was closed and by this way the interaction not accessible, between D15 and D20. We found no difference between eYFP control and JAWS injected mice (Fig. 8h, i), indicating that the interaction zone per se was not aversive (Extended Data Fig. 8a-b). The velocity of the mice was not affected by the optogenetic inhibition, regardless of whether the door was open or closed (Extended Data Fig. 8c, d). Together, these results indicate that inhibition of VTA DA neuron activity is sufficient to impair social reinforcement learning.
Figure 8. Optogenetic inhibition of VTA DA neurons decreases subsequent social affiliation.
(a) Schema of the SIT for one session during optogenetic inhibition of the VTA DA neurons. The laser is shined for 7s when the mice are in the interaction zone only after a lever press. (b) Time course of the experimental design with the procedures. After injection of the opsin virus in DAT-Cre mice, the animals are trained to learn the task. Once at mid-learning (around 15 lever presses) and after optic fiber implantation, the animals undergo an instrumental phase (D1 to D5) then an instrumental phase with optogenetic manipulation (D6 to D20). (c) Schema of viral infection of the AAV-hSyn-FLEX-JAWS-GFP or AAV-EF1α-DIO-eYFP in the VTA DA neurons and the subsequent optic fiber implantation above the VTA. (d) Picture of a brain slice with immunostaining against the Tyrosine Hydroxylase (TH) in red, the viral infection with the AAV-hSyn-FLEX-JAWS-GFP in green and the optic fiber track. (d’) Higher magnification of the VTA from the picture in (d). (e) Time course of the number of lever presses under OFF and light conditions for JAWS and eYFP mice. RM two-way ANOVA (Time main effect: F(19,16) = 0.8519, P = 0.6434; Virus main effect: F(1,16) = 8.878, P = 0.0088; Interaction: F(19,16) = 3.99, P = 1.10x10⁻⁷). (f) Left: Comparisons of the number of lever presses between OFF and light conditions for both eYFP and JAWS groups. RM two-way ANOVA (Time main effect: F(19,16) = 0.4644, P = 0.5053; Virus main effect: F(1,16) = 7.151, P = 0.0166; Interaction: F(19,16) = 11.06, P = 0.0043). Right: Proportion of eYFP and JAWS mice decreasing the number of lever press between OFF (D1-5) and light (D15-20) conditions. (g) Time course of the transitions when the door is open under OFF and light conditions for JAWS and eYFP mice. RM two-way ANOVA (Time main effect: F(19,16) = 1.308, P = 0.1763; Virus main effect: F(1,16) = 6.932, P = 0.0181; Interaction: F(19,16) = 3.668, P = 8.25x10⁻⁷). (h) Time spent in the interaction zone when the door is closed between D15 and D20. Unpaired t-test two-sided (t16) = 0.0037, P = 0.9971). (i) Time spent in the interaction zone when the door is open between D15 and D20. Unpaired t-test two-sided (t(16) = 3.632).
N indicates the number of mice. Dots represent individual data points. All the data are shown as the mean +/-s.e.m. as error bars.
Discussion
Here, we used in vivo recordings in freely moving mice to directly measure VTA DA neuron activity during social interaction and to test the hypothesis that VTA DA neurons signal prediction error in social context.
Humans and animals are greatly motivated to interact with conspecific. Indeed, social interactions provide adaptive benefits such as safety from predators, access to mates and cooperation. However, what are the basic neuronal building blocks that form social interaction and drive an individual to interact with a conspecific? While social behaviors are mainly considered through global social context or manual scoring of chosen social events, the recent advances in markerless pose estimation of animals enable researchers to investigate accurately specific types of social interactions. Here, we initially parsed out complex social behavior to simple direct interactions between conspecifics. This allowed us to identify that the initiation of active contacts is one of the basic social elements that activates the reward system possibly to drive social interaction. Although previous studies have shown that DA neurons in the reward system are recruited in social contexts and are essential for expressing social behaviors adapted to different contexts6,10, the data presented here reveal that these neurons may encode specific modes of interaction. The reward system has been described as a circuit that reinforces behaviors associated with natural reward. In particular, the VTA is a structure that functionally encodes motivation for palatable food27,28. Whether social interaction and palatable food share overlapping circuits and neuronal mechanisms within the reward system is still an open question. Although our results suggest the recruitment of different DA neuron subpopulations regarding exposure to a same conspecific and contact mode such as active and passive interactions, future experiments are needed to show whether a subset of DA neurons is selectively and uniquely activated by social interaction.
Within the VTA, a subset of DA neurons responds to novel stimuli29. Indeed, an increase in DA neuron firing in response to novel stimuli and a rapid habituation when a stimulus became familiar has been previously shown30. In the context of social behavior, fiber photometry experiments showed that the strongest activation of DA neurons occurs during the earlier bouts of interaction with the novel conspecific and then rapidly habituates through repeated interaction6. Furthermore, we have previously shown that chemogenetic inhibition of DA neuron activity decreases the behavioural response to social novelty10. In the current study, using in vivo recordings in freely moving mice, we observed an overall habituation of VTA DA neuron activity during repeated exposure to the same conspecific. We observed a high heterogeneity in the individual neuronal responses. Indeed, while some neurons only responded to the novelty, others were activated even when the stimulus became familiar. Our data show that different VTA DA neurons are recruited to encode the novelty and the value of different social contacts. Overall, the large heterogeneity of VTA DA neuron responses depending on whether the contacts are passive, unilateral or reciprocal, through exposure to a conspecific, reflect the high complexity of social behavior. It suggests that individual neuronal populations within the VTA may contribute to the different building blocks that shape social interaction.
The canonical function of VTA DA neurons is to signal RPE defined as the discrepancy between the received and predicted reward15. RPE provides a learning and motivational signal that is needed to estimate future reward and to ultimately make decisions31. Here, we observed that while VTA DA neurons are activated during the social-interaction window of the shaping phase of the SIT, the increase in firing rate shifted to the lever press once the learning had stabilized. We also demonstrated that if the mice unexpectedly did not have access to the social stimulus, the activity of VTA DA neurons decreased. Furthermore, devaluation of the social stimulus using optogenetic inhibition leads to a decrease in lever presses. Together, our findings provide strong support for the hypothesis that VTA DA neurons drive social learning through social prediction error (SPE). Moreover, our data suggest that the initiation of the interaction toward the conspecific works as a learning signal. In future experiments, replicating the results of the SIT using photolabeled DA neurons would definitively confirm all these findings.
We presented an unfamiliar conspecific every day during the learning and instrumental phases. The mice still extinguished the task once it was learned, although it took a long time through the extinction phase, while the reinstatement shows a fast learning of the task again. This finding supports the hypothesis that the learning was supported by the rewarding properties of the conspecific more than the saliency of the task per se. Since DA neurons, in certain situations, support associative rather than model-free learning32, we cannot exclude that within the heterogeneous DA neuron population, some neurons support associative learning independent of the value in the social context.
Since deficits in reinforcement learning may be associated with psychiatric disorders33,34, deficits in prediction error during social context might affect social aspects of psychiatric disorders35–37. It has been suggested that impaired RPE relates to clinical phenotypes of psychiatric disorders and in particular of Autism Spectrum Disorders (ASD)35. Indeed, individuals with ASD display abnormal brain activation during RPE in social contexts, suggesting that the processing of social reward could be more challenging than processing other natural rewards38. These findings support the ‘social motivation’ hypothesis elaborated by Chevallier, which proposes that deficits in social-reward processing may underlie some of the social deficits in ASD37. Understanding the neuronal mechanisms by which social reward modulates learning and motivation will help to highlight how deficits in prediction error in social contexts may lead to social deficits related to ASD35.
Methods
Animals
The study was conducted using wild type (WT) and transgenic mice with C57BL/6J background. WT mice (C57BL/6J; N = 169) were obtained from Charles River and used as stimuli mice (4-6 weeks of age). For DA neuron-specific manipulations and recordings, DAT-iresCre (Slc6a3tm1.1(cre)Bkmn/J, called DAT-Cre in the rest of manuscript; N = 53), breeded in Charles River, were employed (8-20 weeks of age). Only male animals were used for all the experiments conducted. Mice were housed in groups (weaning at P21 – P23) and isolated prior the experiments, under a 12 hours light – dark cycle (7:00 a.m.–7:00 p.m.) at 22.5°C and controlled humidity (around 55%). All physiology and behavior experiments were performed during the light cycle. For WT and DAT-Cre mice, multiple behavioral tests were performed with the same group of animals, and were assigned randomly to the different behavioural assays and groups. For optogenetic manipulation experiments, the experimenters were blind to which group belong the animals. All the procedures performed at UNIGE complied with the Swiss National Institutional Guidelines on Animal Experimentation and were approved by the respective Swiss Cantonal Veterinary Office Committees for Animal Experimentation.
Multi-unit recording system – Microdrive
The VTA DA neurons recording was realized thanks to 2 octrodes, each constituted of 8 Nickel-Chrome (NiCr) coated wires of 15 μm diameter, and a reference electrode for each octrode, constituted of stainless steel wires (110 μm). The octrodes are inserted in a homemade microdrive composed of a central piece containing a cannula as guide and a connector (Electrode interface board EIB, Neuralynx) where the recording and amplifier cable are plugged. After implantation, depth modulation is controlled by moving the central piece with a micro-screw. The 2 octrodes and an optic fiber are glued together through the cannula and implanted at the same time with a difference of 200 – 500 μm between the tips of the octrodes and the optic fiber. Once the ensemble mounted, the impedance is uniformed (≈ 300 kOhms) at the octrodes tips with a diluted gold plating solution.
The neuronal activity was recorded using Digital Lynx 4SX acquisition system, with 32kHz sampling rate (Neuralynx). A high band-pass filter (600Hz – 6000Hz) was applied during the recording to extract the fast electrical impulsions (the spikes).
Surgery
Injection of rAAV5-Ef1α-DIO-hChR2(H134R)-eYFP (Titer ≥ 4.2×10¹² vg.mL-1, UNC Vector Core) was performed in DAT-Cre mice at 4 – 7 weeks. Mice were anesthetized with a mixture of oxygen (1 L/min) and isoflurane 3% (Baxter AG, Vienna, Austria) and placed in a stereotactic frame (Angle One; Leica, Germany). The skin was shaved, locally anesthetized with 40 – 50 μL lidocaine 0.5% and disinfected. Unilateral craniotomy (1 mm in diameter) was then performed over the VTA at following stereotactic coordinates: ML ± 0.5 mm, AP – 3.2 mm, DV – 4.20 ± 0.05 mm from Bregma. The virus was injected via a glass micropipette (Drummond Scientific Company, Broomall, PA) into the VTA at the rate of 100 nl/min for a total volume of 500 nL. The implantation of the homemade Microdrive (see previous part) was then performed 2 weeks later using the same coordinates. Unilateral craniotomy was made above the VTA and bilateral craniotomy above the cerebellum to implant reference wires. The Microdrive was then fixed on the skull using dental acrylic.
For optogenetic inhibition: rAAV5-hSyn-FLEX-Jaws-KGC-GFP-ER2 (Titer ≥ 3.8×I012 vg.mL-1, UNC Vector Core) or rAAV5-EF1α-DIO-eYFP (Titer ≥ 4.2×10¹² vg.mL-1, UNC Vector Core) were injected in DAT-Cre mice at 4 – 7 weeks. Mice were anesthetized and disinfected as previously described. The animals were placed in a stereotactic frame and bilateral injections were performed in the VTA (ML ± 0.5 mm, AP – 3.2 mm, DV – 4.20 ± 0.05 mm from Bregma, 500 nL per side) using a glass micropipette. The virus was incubated for at least 3 weeks. An optic fiber was then implanted above the VTA, unilaterally with a 10° angle at the following coordinates: ML ± 0.9 mm, AP – 3.2 mm, DV – 3.95 mm from Bregma above the VTA and fixed to the skull with dental acrylic.
Injections and implantations sites were confirmed post hoc.
Optogenetic photolabeling of VTA DA neurons
DAT-cre mice injected with rAAV5-Ef1α-DIO-hChR2(H134R)-eYFP and implanted with the microdrive underwent the optogenetic protocol to validate the dopaminergic nature of the neuron. When the recorded neuron was suspected to be DA, based on the electrophysiological criteria (Firing < 12Hz, half-width spike > 1.5ms, regular spiking activity with typical bursting activity), mice were placed alone in a cage with bedding (20 × 30 × 15 cm). An optic fiber (homemade, materials from ThorLabs) was plugged and baseline neuronal activity was recorded during 90s without stimulation. Then a 5Hz optical stimulation of blue laser (BioRay 488 nm 20 mW Elliptical Dot Laser, Coherent) protocol with a light-pulse duration of 5msec was applied with an expected power at the optic fiber tip of 8 – 12 mW (Master-8). After 1000 light-pulses the protocol was stopped, and the neuronal activity was still recorded during 1 min at baseline condition. Using the same procedure, a protocol of 20Hz light stimulation was then applied. The protocols were always applied after the different social experiments, at the end of the day, to avoid any influence of the light stimulation onto the tasks.
Free social interaction task
DAT-Cre male mice, implanted with a Microdrive to record VTA DA neurons, performed a free interaction task. All the animals were isolated 1 week prior to the task. The mice were first placed in a cage-like homecage (20 × 40 × 10 cm) with bedding and VTA DA neuron activity was recorded. After 5 mins of neuronal activity recording, constituting the baseline activity, a social stimulus (unfamiliar conspecific sex-matched juvenile mouse) was introduced in the cage for 5 mins of free social interaction with the experimental mice. For the repeated exposure in free social interaction, the baseline and social conditions were repeated 3 times to obtain 3 different trials for a total duration of 30 mins. The same conspecific was used during the 3 different trials to study how the VTA DA neuron could adapt to a repeated social stimulus. At the end of each session of the task, the cage was cleaned using 70% ethanol.
The animals were tracked post-hoc using DeepLabCut23 in python. Two models were built (experimental mice with implanted microdrive and stimuli mice) to detect nose, body and tail of each tracked subject. Distance error between train and test dataset were 0.0034cm for the two models. The rearing behavior was manually scored.
Social Instrumental Task
The operant chamber (MedAssociates) is composed of 2 different compartments divided by a gridded auto-guillotine door: 1 chamber of 28 × 16 × 21 cm with the experimental DAT-Cre mouse with ad libitum access to a lever press on the wall opposing the door, and 1 chamber of 14 × 16 × 21 cm containing the social stimulus (unfamiliar sex-matched juvenile conspecific mouse C57BL/6J, 3 – 6 weeks). By pressing the lever, the gridded auto-guillotine door is immediately opened without delay for 7 seconds allowing the interaction between the experimental mouse and the social stimulus. The grid prevents the passage between chambers. After 7 seconds the door is closing. During the whole session, the experimental animals have the possibility to press without limit the lever to interact. The apparatus was cleaned using 70% ethanol after each session.
All the mice were isolated 1 week prior to the first session of the experiment to promote motivation to interact. The experimental mouse was placed in the corresponding chamber while neuronal recording was performed. To keep the same experimental conditions, the animals were always plugged even though neurons were not detected during the recording.
The task is performed with 1 daily session of 20 min and divided in several phases across the days:
-
-
Shaping phase (from Day 1 to Day 10): The animals were trained to associate the lever press with the opening of the door, and consequently, the social interaction. Every time the animals were in proximity of the lever, the experimenter, through the MedAssociates software, was opening the door. Every day the area around the lever was decreased and the last day of the shaping phase, the door was opened only when the mice were touching the lever.
-
-
Instrumental Phase (from Day 11 to Day 25): The animals had to perform the task by themselves. Pressing only once on the lever was opening the door to interact with the conspecific.
Exclusively for behavior:
-
-
Extinction Phase (from Day 26 to Day 75): During this phase, the experimental mice were still able to press the lever and open the door, but no conspecific was present in the other chamber.
-
-
Reinstatement Phase (from Day 76 to Day 80): An unfamiliar conspecific was reintroduced in the other chamber of the apparatus, and the experimental were able to interact with the stimulus by pressing the lever.
Exclusively for electrophysiology:
-
-
Intermediate Phase (from Day 6 to Day 10): Subdivision of the Shaping Phase to have a better characterization of the VTA DA activity during the SIT.
-
-
Omission Phase (from Day 26 to Day 35): After instrumental phase, if VTA DA neurons were still present, some animals underwent a paradigm where a lever press was opening randomly the door with a 50% probability. Thereby the mice were not able to predict accurately the future social interaction with the unfamiliar conspecific.
The conspecific was changed every day to avoid experimental animals to interact twice with the same social stimulus during the different sessions of the task. During the instrumental phase, a mouse was considered as learner if it pressed at least 10 times the lever for 3 consecutives days. Otherwise the animal was considered as non-learner. The videos and neuronal recording were monitored and acquired using Neuralynx system. The animals were tracked and zones delimited using Ethovision software (Noldus).
At the end of the task, the animals were sacrificed. The viral infection and the recording electrode placement were verified. If the placement of the recording electrode was outside the VTA, the mice were excluded from the analyses.
Optogenetic inhibition of VTA DA neurons in the Social Instrumental Task
DAT-Cre mice were injected with either the AAV5-FLEX-Jaws-GFP or AAV5-DIO-eYFP as control (see surgery part for details). After 1 week of recovery, the animals started to learn the SIT as described above in the shaping phase. To reinforce and accelerate the learning process, at the end of the shaping phase, we performed 2 sessions where the mice stayed in the operant chamber for the whole night (7 p.m.–10 a.m.). During this overnight session the experimental mice were able to press the lever to access the social stimulus. After criteria of an average of 15 lever presses for at least 3 days after the overnight sessions, the mice underwent optic fiber implantations (see surgery part for details). After 5 days of recovery, the animals started the test in the SIT. During the 5 first days (from Day 1 to Day 5) the animals performed the task as usual without any optogenetic light stimulation. From Day 6 to Day 20, the mice performed the task with conditional optogenetic inhibition: constant red laser (wavelength 640nm, Coherent Bioray) was emitted for 7 seconds when the mice were in the interaction zone (close to the grid) only after pressing the lever (door open). If the mice did not went in the interaction zone within the 7 seconds following the lever press, light emission was not applied. The apparatus was cleaned using 70% ethanol after each session.
The animals were tracked and zones delimited using Ethovision software (Noldus). At the end of the task, the animals were sacrificed. The viral infection and the optic fiber placement were verified. If the placement of the optic fiber was outside the VTA, the mice were excluded from the analyses.
Immunohistochemistry
DAT-Cre mice injected with rAAV5-Ef1α-DIO-hChR2(H134R)-eYFP were anesthetized with pentobarbital (Streuli Pharma) and sacrificed by intra-cardiac perfusion of 0.9% saline followed by 4% PFA (Biochemica). Brains were post-fixed overnight in 4% PFA at 4 °C. 24 hours later, they were washed with phosphate buffered saline (PBS) and then 50 μm thick sliced with a vibratome (Leica VT1200S).
Previously prepared slices were washed three times with PBS 0.1M. Brain slices were pre-incubated with PBS-BSA-TX buffer (10% BSA, 0.3% Triton X-100, 0.1% NaN3) for 60 minutes at room temperature in the dark. Subsequently, cells were incubated with primary antibodies diluted in PBS-BSA-TX (3% BSA, 0.3% Triton X-100, 0.1% NaN3) overnight at 4°C in the dark. The following day cells were washed three times with PBS 0.1M and incubated for 60 minutes at room temperature in the dark with the secondary antibodies diluted in PBS-Tween buffer (0.25% Tween-20). Finally, slices were mounted using Fluoroshield mounting medium with DAPI (abcam). In this study, the following primary antibody was used: rabbit polyclonal anti-Tyrosine Hydroxylase (1/500 dilution, abcam, ab6211). The following secondary antibody was used at 1/500 dilution: donkey anti-rabbit 555 (Alexa Fluor). Immunostained slices were imaged using the confocal laser scanning microscopes Zeiss LSM700 and LSM800. Larger scale images were taken with the widefield Axioscan.Z1 scanner.
Analyses for in vivo recording
Recording
All the in vivo data acquired using Neuralynx system were extracted and analyzed offline using MatLab (The MathWorks). The spike-sorting was done using a custom MatLab code based on principal component analysis (PCA) and expectation-maximization of Gaussian mixture (EMGM). After spike-sorting procedure all the timestamps of the spikes as well as the voltage associated to each spike point were saved. Putative dopaminergic neurons (pDA) were first visually determined by wider waveform, slow firing pattern between 1 and 12Hz and typical triphasic bursting. Non-DAergic neurons (non-pDA) were determined by narrower waveform, high firing pattern or low firing pattern with burst event at high frequency (> 15Hz).
VTA neurons classification
Multiple electrophysiological features were analyzed based on firing pattern from recording of VTA neurons obtained in our lab and from a public dataset (CRCNS.org vta-1)22. To check the possibility to classify VTA neurons based on electrophysiological properties, a cluster analysis was used based on 55 features extracted. To obtain these features, the probability distribution from the log of the instantaneous frequency of defined event (tonic, bursting, pause, spikes within tonic, spikes within burst, spikes within pause) were computed and the following properties of each distribution were extracted: mean, median, coefficient of variation, skewness and kurtosis. Burst and pause interspike interval (ISI) thresholds were determined and burst and pause strings were identified based on the Robust Gaussian Surprise (RGS) method39. Finally, the frequency peak in the power spectrum was also extracted by using the Welch method to calculate power spectrum by averaging Fast Fourier Transforms of overlapping window divisions.
The features were first normalized by using z-score and by rescaling the values and then the dimensionality was reduced by using UMAP technique. While the observation of two distinct clusters was evident, an EMGM was used to define a confidence interval of 95% based on the photolabeled DA neurons. Only neurons inside this confidence interval were considered as pDA neurons.
VTA DA activity and behavior analysis
The construction of Peri-event time histogram (PETH) was made by aligning and centering specific events. These events were obtained by coupling the Neuralynx digital acquisition system with others data acquisitions systems (such as Master-8 or MedAssociates operant chamber) that sent Time-to-Live (TTL) at specific times to link neuronal activity with events/stimuli or with events detected by synchronized video analysis of specific behaviors.
The neuronal recordings were binned depending on the analysis time-window taken. For large time-scales (time-window > 600 sec), 1 sec bin was taken to average the spiking frequency. For low time-scale (time-window < 30 sec, such as PETH), 100 msec bin was taken to average the spiking frequency. Subsequent analysis were performed on non-normalized and normalized activity. Non normalized firing rate corresponds to the number of spikes per sec. To get normalized spiking activity, the normalization was computed as following: ; where m Freq is the averaged frequency of a given bin and μFreq is the mean frequency of all the sessions. After normalization, a convolution using a Kernel-Gaussian sliding window of 16 bins was applied on the data (gausswin MatLab function).
Free Interaction
All the coordinates of the tracked position by DeepLabCut were corrected by using the body of the experimental mice as the origin coordinates and the nose of the experimental mice aligned to the y-axis. All the tracked positions of the social stimulus were then plotted relatively to the position of the experimental mice. Coordinates with a likelihood lower than 95%, defined by DeepLabCut, were replaced by the last coordinates higher than 95% of likelihood. The distance and the angle between the experimental and the stimulus position were reported for each frame (40 ms) and time distribution probability was computed. The neuronal activity was normalized as previously described when stimuli were present, then, for each frame, when the stimuli were closer than 20 cm, the corresponding neuronal activity was reported and analyzed depending on the proximity and the angle in the same way than the time distribution of the stimuli position.
To extract interaction events, a proximity threshold of 5cm, an angle threshold from –110° to +110° (corresponding to the visual field of the experimental mice40) and a duration threshold from 0.2 to 2 seconds were applied regarding the position of the stimuli nose (active reciprocal interaction), the base of the stimuli tail (active unilateral interaction) or the base of the experimental mice tail (passive interaction). PETH analyses were then performed and neuronal activity was aligned on the center of the defined interaction events and normalized as previously described using 10 seconds around each interaction event. To quantify the neuronal response, baseline activity was measured by the mean of the activity between 2 and 5 seconds before and after the event. The activity during the interaction was measured by the mean of activity 1 second before and 1 second after the interaction.
To determine responders and non-responders neurons, we calculated the p-values from t-tests for each neuron by comparing the baseline and interaction activity distributions from each trial. Every significant t-test determined if a neuron was responder or not. The average activity of the neuron during interaction (below or above the baseline) determined the positive or negative response. Neurons without response in any interaction were considered as non-responders and neurons with response in only a subset of interactions were considered as neutral for the interaction without response.
Social Instrumental Task (SIT)
Data of position coordinates, velocity and transition events from lever to interaction zone of experimental mice were obtained directly from Ethovision software after the tracking. Lever-press timestamps event was obtained by TTL sent by MedAssociates apparatus. To analyze behavior and neuronal activity, further analyzes were performed to obtain different events. Transition performances during the interaction window were defined as follows: fast (transitions < 2s), slow (2s < transitions < 7s), delayed (7s < transitions < 12s) and missed (transitions > 12s). Error trials events were defined by fast transitions not preceded by a lever-press and correct trials events by fast transitions preceded by a lever-press.
Velocity control events were defined by peak of velocity outside the trials (when door is closed) and higher than 20cm.s-1 (corresponding to the mean velocity of fast transitions when the door is open).
PETH analysis previously described was then performed. Velocity and/or neuronal activity were aligned:
-
-
On lever presses events, or entry in the interaction zone, during shaping phase between day 1 and day 5, during intermediate phase between day 6 and day 10 and during instrumental phase between day 11 and day 25.
-
-
For the omission phase, on the lever presses of the trials when the door was opening or not.
-
-
For the error and correct trials, on the exit of the lever zone during fast transitions (< 2s) of the instrumental phase between day 15 and day 25. As the exit of the lever zone is not reaching the same temporal precision than a lever press, the neuronal activity was then realigned to the peak of VTA DA activity found 500 ms before or after the exit of the lever zone. For proper control, this readjustment was made in the same conditions for error and correct trials.
-
-
For control of the velocity, on the initiation of the action followed by a peak of velocity outside trials during instrumental phase between day 11 and day 25.
To analyze the prediction value, the mean of neuronal activity at the moment of the lever press (between -1s before and 1s after) during the instrumental phase, between day 11 and day 25, was correlated with the time spent in the interaction zone.
By using the same approach than in the free interaction task, to determine responders and non-responders neurons, the neuronal activity of each trial of each neuron was compared between its own baseline (from 10s before the lever press to 1s before) and during the interaction window (from 1s to 7s after lever press) or lever presses events (1s before and 1s after). We calculated the p-values from paired t-tests for each neuron by comparing the baseline and interaction window distributions. Every significant t-test determined if a neuron was responder or not.
Viruses
rAAV5-Eflα-DIO-hChR2(H134R)-eYFP (Titer ≥ 4.2×10¹² vg.mL-1, UNC Vector Core), rAAV5-Eflα-DIO-eYFP (Titer ≥ 4.2×10¹² vg.mL-1, UNC Vector Core), rAAV5-hSyn-FLEX-JAWS-KGC-GFP-ER2 (Titer ≥ 4.2×10¹² vg.mL”-1, UNC Vector Core).
Statistical analysis
No statistical methods were used to predetermine the number of animals and cells, but suitable sample sizes were estimated based on previous experience and are similar to those generally employed in the field41, 42. The animals were randomly assigned to each group at the moment of viral infections or behavioral tests. Statistical analysis was conducted with MatLab (The Mathwork) and GraphPad Prism 7 (San Diego, CA, USA). Statistical outliers were identified by using the criterion mean ± 3 × s. e. m. and excluded from the analysis. The normality of sample distributions was assessed with the Shapiro–Wilk criterion and when violated non-parametric tests were used. When normally distributed, the data were analyzed with independent t test or paired t test, while for multiple comparisons one-way ANOVA and repeated measures (RM) ANOVA were used. When normality was violated, the data were analyzed with Mann-Whitney test, Wilcoxon matched-pairs signed rank test, while for multiple comparisons, Kruskal–Wallis or Friedman tests were applied followed by Dunn’s test or Bonferroni-Holm correction. For the analysis of variance with two factors (two-way ANOVA or RM two-way ANOVA), normality of sample distribution was assumed, and followed by Bonferroni-Holm correction test or Bonferroni post-hoc test. To compare two variances, the two-sample F-test was used and to compare ratios, Chi-Square test was applied. All the statistical tests adopted were two-sided. Data are represented as the mean ± s. e. m. and the significance was set at P < 0.05.
Extended Data
Extended Data Fig. 1. Recording, photolabeling and classification of the VTA DA neurons.
(a) Picture of the microdrive implanted in DAT-Cre mice with recording electrodes and optic fiber. (b) Schema of the implantation of the microdrive in the VTA. (c) Representative coronal image of immuno-staining experiments against Tyrosine Hydroxylase (TH) enzyme (red) performed on midbrain slices of DAT-Cre adult mice infected with AAV5-Ef1α-DIO-ChR2-eYFP (green) in the VTA. (d) Picture of an implanted mouse for freely behaving recording. (e) Top: Example trace of a VTA DA neuron following optogenetic light stimulation protocol at 20Hz. Down: Example of waveforms similarity between light stimulation and no-light stimulation of a photolabeled VTA DA neuron. (f) Example PETH centered to the light pulse (top), of a VTA DA neuron responding to the 20Hz protocol stimulation with the corresponding raster plot for all the trials (down). (g) Averaged PETH, centered to the light pulse, for all the VTA DA neurons following the optogenetic protocol at 5Hz stimulation. (h) Averaged PETH, centered to the light pulse, for all the VTA DA neurons following the optogenetic protocol at 20Hz Stimulation. (i) Probability to have a spike in the 10ms following the beginning of the light pulse for 5Hz and 20Hz protocols. Paired t-test two-sided (t(16) = -8.2603). (j) Time course of all the photolabeled VTA DA neurons before, during and after the 20Hz protocol stimulation. (k) Mean firing rate of the VTA DA neurons at baseline (without optogenetic stimulation) and during optogenetic stimulation at 20Hz. Responders are represented in blue while non-responders to the light stimulation are in black (example of 2 neurons). (l) Waveforms examples of different neurons after spike-sorting for VTA-pDA (Left), VTA-nonDA high firing (Middle) and VTA-nonDA low-firing (Right) neurons. The red line represents the average of all the waveforms recorded during a session for one neuron. (m) Firing probability density for 3 different neurons (VTA-pDA, VTA-nonDA high firing and VTA-nonDA low-firing). This probability is the Log10 of the instantaneous frequency for a given neuron, and allows to extract general features such as tonic and bursting activity by using Robust Gaussian Surprise method. (n) Examples of traces for the 3 different neurons types with the tonic, bursting and pause activity. (o) Left: Dimensionality reduction with UMAP (Uniform Manifold Approximation and Projection) based on features extracted from firing pattern (see methods) followed by EMGM (Expectation Maximization of Gaussian Mixture) clustering based on VTA-DA photolabeled neurons. The neurons can be dopaminergic (VTA DA photolabeled), putative dopaminergic (VTA pDA) or putative non-dopaminergic (VTA non-pDA). Right: pie charts show inclusion or exclusion of previously identified neurons in the VTA DA cluster.
n indicates the number of cells. Dots represent individual data points. All the data are shown as the mean +/-s.e.m. as error bars.
Extended Data Fig. 2. The VTA DA activity increases at the initiation of interaction events and rearing behavior does not induce VTA DA changes.
(a) Examples of neurons responding to reciprocal, unilateral and passive contacts. Neurons 1 and 2 are from the same animal while Neuron 3 and 4 are from another same animal. In these examples we can see the heterogeneity of neuronal activity depending on contacts for a same neuron or animal. (b) Normalized VTA DA activity in function of the duration of bouts of reciprocal interaction with a bin of 200ms. The initiation of the interaction seems to induce the highest increase of VTA DA activity. Pearson’s coefficient correlation twosided. (c) Distribution of the duration to reach the peak of VTA DA activity during interactions (normalized in percentage of bouts duration). Mean = 27.25%, s.e.m = 0.853%. (d) Normalized VTA DA activity in function of the duration of bouts of unilateral interaction with a bin of 200ms. Pearson’s coefficient correlation two-sided. (e) Distribution of the duration to reach the peak of VTA DA activity during interactions (normalized in percentage of bouts duration). Mean = 27.63%, s.e.m = 1.057%. (f) Normalized VTA DA activity in function of the duration of bouts of passive interaction with a bin of 200ms. Pearson’s coefficient correlation two-sided. (g) Distribution of the duration to reach the peak of VTA DA activity during interactions (normalized in percentage of bouts duration). Mean = 21.47%, s.e.m = 0.995%. (h) Schema of rearing behavior. (i) PETH of the normalized VTA DA activity centered on the rearing behavior 5 seconds before and after the rearing. The rearing behavior does not induce changes at VTA DA activity population level.
N, n indicate the number of mice and cells respectively. All the data are shown as the mean +/-s.e.m. as error bars.
Extended Data Fig. 3. Heterogeneity of VTA DA activity depending on the type of interaction and the trials.
a) Activity changes of the same VTA DA depending on the trials of interaction for reciprocal contacts (red/stripes: increasing; blue: decreasing; green: no activity changes for a given interaction; grey: no activity changes independently the type of interaction). Chi-square test between ratio of responses type of 1st and 3rd trials (χ2(1) = 10.78). (b) Response heterogeneity of the VTA DA neurons during reciprocal interactions in the neurons responding to at least one trial between the 1st and 3rd trials. (c) Activity changes of the same VTA DA depending on the trials of interaction for unilateral contacts. Chi-square test between ratio of responses type of 1st and 3rd trials (χ2(1) = 0.4107). (d) Response heterogeneity of the VTA DA neurons during unilateral interactions in the neurons responding to at least one trial between the 1st and 3rd trials. (e) Activity changes of the same VTA DA depending on the trials of interaction for passive contacts. Chi-square test between ratio of responses type of 1st and 3 rd trials (χ2(2) = 3.000). (f) Response heterogeneity of the VTA DA neurons during passive interactions in the neurons responding to at least one trial between the 1st and 3rd trials.
Extended Data Fig. 4. Photolabeled VTA DA neurons activity increases during social interactions with high heterogeneity response.
(a) Difference of variance of firing rate between VTA DA neurons non-photolabeled and photolabeled. Two sample F-test (F(i5,43) = 0.6348). (b) VTA DA firing rate during baseline and social context. Paired t-test two-sided (t((16)) = -3.8210). (c) Time course of the normalized VTA DA neuron firing rate during baselines and social sessions (top) with the associated heatmap of each neuron recorded (down). VTA DA activity increases during social interaction and habituates through exposures. Repeated Measure (RM) one-way ANOVA (Time main effect: F(5,i3) = 5.2503, P = 0.0004) followed by Bonferroni-Holm correction. (d) Left: Normalized VTA DA firing rate before and during reciprocal interaction during 1st trial. Wilcoxon test two-sided (W = 122). Right: Proportion of the different VTA DA neurons activity responses during reciprocal events (red, increasing; blue, decreasing; green, no activity changes for a given interaction; grey, no activity changes independently the type of interaction). (e) Left: Normalized VTA DA firing rate before and during unilateral interaction during 1st trial. Paired ttest two-sided (t(16) = 2.729). Right: Proportion of the different VTA DA neurons activity responses during unilateral events. (f) Left: Normalized VTA DA activity before and during passive interaction during 1st trial. Wilcoxon test. Paired t-test two-sided (t(i6) = 2.301). Right: Proportion of the different VTA DA neurons activity responses in passive interaction. (g) Activity changes of the same VTA DA neurons depending on the type of interaction between reciprocal, unilateral and passive. Chi-square test two-sided between ratio of responses type for each interaction (Overall: χ2(2) = 55.93, P = 8.07x10⁻¹²; Reciprocal vs unilateral: χ2(1) = 24.42; Reciprocal vs passive: χ2(1) = 52.17; Unilateral vs passive: χ2(1) = 7.636). The ratio of activity responses is not different between all the VTA DA neurons (Figure 2) and only the photolabeled. Chi-square test two-sided between ratio of responses type between all VTA DA neurons (from Fig. 2i) and photolabeled VTA DA neurons only for each interaction (Reciprocal: χ2(2) = 2.298, P = 0.6091; Unilateral: χ2(2) = 3.399, P = 0.2345; Passive: χ2(3) = 5.484, P = 0.3112). (h) Response heterogeneity of VTA DA neurons between reciprocal, unilateral and passive interactions in the neurons responding to at least one type of interaction. The neurons show either different or similar responses to the different contacts. (i) Left: Normalized VTA DA firing rate before and during reciprocal interaction during 3rd trial. Wilcoxon test two-sided (W = 95). Right: Proportion of the different VTA DA neurons activity responses during unilateral events. (j) Left: Normalized VTA DA firing rate before and during unilateral interaction during 3rd trial. Wilcoxon test twosided (W = 83). Right: Proportion of the different VTA DA neurons activity responses during unilateral events. (k) Left: Normalized VTA DA firing rate before and during passive interaction during 3rd trial. Paired t-test two-sided (t(13) = 0.9183, P = 0.3752). Right: Proportion of the different VTA DA neurons activity responses during passive events. (l) Activity changes of the same VTA DA neurons depending on the type of interaction between reciprocal, unilateral and passive. Chi-square test two-sided between ratio of responses type for each interaction (Overall: χ2(4) = 4.250, P = 0.3525; Reciprocal vs unilateral: χ2(1) = 0.2857; Reciprocal vs passive: χ2(2) = 2.111; Unilateral vs passive: χ2(2) = 3.300). The ratio of activity responses is not different between all the VTA DA neurons (Figure 4) and only the photolabeled. Chi-square test between ratio of responses type between all VTA DA neurons (from Fig. 4j) and photolabeled VTA DA neurons only for each interaction (Reciprocal: χ2(2) = 0.2520, P = 0.0559; Unilateral: χ2(2) = 0.3162, P = 0.1497; Passive: χ2(3) = 1.806, P = 0.3795). (m) Response heterogeneity of VTA DA neurons between reciprocal, unilateral and passive interactions in the neurons responding to at least one type of interaction. The neurons show either different or similar responses to the different contacts.
N, n indicate the number of mice and cells respectively. For box plots: the center line represents the median, the bounds of the box the 25th to 75th percentile interval and the whiskers the minima and maxima. Dots represent individual data points. All the data, except box plots, are shown as the mean +/-s.e.m. as error bars.
Extended Data Fig. 5. Extinction and reinstatement in the SIT.
(a) Left: Experimental time-course of the procedures for the 1st cohort (same cohort than in figure 1). The DAT-Cre mice are first injected with an AAV5-DIO-ChR2 and implanted with recordings electrodes in the VTA prior to perform the shaping and instrumental phases. Right: Proportion of learners and nonlearners in the task for the 1st cohort. (b) Left: Experimental time-course of the procedures for the 2nd cohort. The DAT-Cre mice are first injected with an AAV5-DIO-ChR2 and implanted with recordings electrodes in the VTA prior to perform the shaping, instrumental, extinction and reinstatement phases of the SIT. Right: Proportion of learners and nonlearners in the task for the 2nd cohort. (c) Number of leverpresses across the days and the 4 different phases (shaping, instrumental, extinction and reinstatement) for the 2nd cohort. RM one-way ANOVA (Time main effect: F(79,6) = 4.72, P = 1.09x10⁻⁷). (d) Comparison of the number of lever-press between the shaping (D1-D5), instrumental (D21-D25), extinction (D51-D55) and reinstatement (D76-D80) phases. RM one-way ANOVA (Phases main effect: F(3,6) = 34.67, P = 3.51x10⁻⁵) followed by Bonferroni-Holm correction. (e) Number of transitions between the lever and social zones for the 2nd cohort. Friedman test two-sided (χ2(7) = 176.5, P = 1.0x10⁻¹⁵). (f) Comparison of the number of transitions between the shaping (day1-day5), instrumental (D21-D25), extinction (D51-D55) and reinstatement (D76-D80) phases. RM one-way ANOVA (Phases main effect: F(3,6) = 18.69, P = 0.0001) followed by Bonferroni-Holm correction. (g) Perievent time histogram (PETH) of the velocity for the shaping (D1-D5), instrumental (D21-D25), extinction (D51-D55) and reinstatement (D76-D80) phases. (h) Comparison of the maximum velocity during the transitions for all the different phases of the SIT. RM one-way ANOVA (Phases main effect: F(3,6) = 6.557, P = 0.0106) followed by Bonferroni-Holm correction. (i) Ratio of the different transitions depending the velocity across the sessions of the different phases: fast (transitions < 2 sec), slow (2sec < transitions < 7 sec), delayed (7sec < transitions < 12 sec) and missed (transitions > 12 sec). (j) Proportion of the different transitions between shaping (D1D5), instrumental (D21-D25), extinction (D51-D55) and reinstatement (D76-D80) phases.
N indicates the number of mice. Dots represent individual data points. All the data are shown as the mean +/-s.e.m. as error bars.
Extended Data Fig. 6. VTA DA neurons activity centered to the entry in the interaction zone and the intermediate phase of the SIT.
(a) Top: PETH of one VTA DA neuron responding to the entry in the interaction zone during the shaping phase. Down: Associated raster plot of the neuron during a session of the shaping phase. (b) Top: PETH of the normalized VTA DA activity during the shaping phase, centered on the entry in the interaction zone. Down: Associated heatmap of each neuron recorded. (c) PETH of one VTA DA neuron responding before the entry in the interaction zone during the instrumental phase. Down: Associated raster plot of the neuron during a session of the instrumental phase. (d) Top: PETH of the normalized VTA DA activity during the instrumental phase, centered on the entry in the interaction zone. Down: Associated heatmap of each neuron recorded. (e) Schema of the operant chamber during the intermediate phase. (f) Top: PETH of one VTA DA neuron responding during interaction window and lever press. Down: Associated raster plot of the neuron during a session of the intermediate phase. (g) Top: PETH of the normalized VTA DA activity during the intermediate phase centered on the lever presses. Down: Associated heatmap of each neuron recorded. (h) Proportion of the VTA DA neurons increasing their activity during the lever press (Left) and the interaction window (Right). (i) Left: Firing rate of VTA DA neurons during baseline, the lever press and the interaction window. Friedman test two-sided (χ2(54) = 26.04, P = 2.22x10⁻⁶) followed by Bonferroni-Holm correction. Right: Normalized VTA DA activity during baseline, the lever press and the interaction window. Friedman test two-sided (χ2(54) = 23.37, P = 8.42x10⁻⁶) followed by Bonferroni-Holm correction.
N, n indicate the number of mice and cells respectively. For box plots: the center line represents the median, the bounds of the box the 25th to 75th percentile interval and the whiskers the minima and maxima. Dots represent individual data points. All the data, except box plots, are shown as the mean +/-s.e.m. as error bars.
Extended Data Fig. 7. VTA DA neurons activity encodes social prediction error during the SIT: Error and correct trials.
(a) Schema of the operant chamber during error trials of the instrumental phase. (b) Top: PETH of one VTA DA neuron decreasing activity during interaction window and increasing during exit of the lever zone. Down: Associated raster plot of the neuron during a session of the error trial. (c) Top: PETH of the normalized VTA DA activity during the error trials, centered on the exit of the lever zone. Down: Associated heatmap of each neuron recorded. (d) Top: Proportion of the VTA DA neurons increasing their activity during the exit of the lever zone (Left) and decreasing activity following the transitions when the door is closed (Right). (e) Left: Firing rate of VTA DA neurons during baseline, the exit of the lever zone and in the interaction zone. Friedman test two-sided (χ2(47) = 21.07, P = 2.66x10⁻⁵) followed by Bonferroni-Holm correction. Right: Normalized VTA DA activity during baseline, the exit of the lever zone and in the interaction zone. Friedman test two-sided (χ2(47) = 14.28, P = 0.0008) followed by Bonferroni-Holm correction. (f) Schema of the operant chamber during correct trials of the instrumental phase. (g) Top: PETH of one VTA DA neuron increasing during exit of the lever zone. Down: Associated raster plot of the neuron during a session of the correct trial. (h) Top: PETH of the normalized VTA DA activity during the correct trials, centered on the exit of the lever zone. Down: Associated heatmap of each neuron recorded. (i) Proportion of the VTA DA neurons increasing their activity during the exit of the lever zone (Left) and decreasing activity following the transitions when the door is closed (Right). (j) Left: Firing rate of VTA DA neurons during baseline, the exit of the lever zone and in the interaction zone. Friedman test two-sided (χ2(45) = 28.77, P = 5.65x10⁻⁷) followed by Bonferroni-Holm correction. Right: Normalized VTA DA activity during baseline, the exit of the lever zone and in the interaction zone. Friedman test (χ2(45) = 21.32, P = 2.35x10⁻⁵) followed by Bonferroni-Holm correction.
N, n indicate the number of mice and cells respectively. For box plots: the center line represents the median, the bounds of the box the 25th to 75th percentile interval and the whiskers the minima and maxima. Dots represent individual data points. All the data, except box plots, are shown as the mean +/-s.e.m. as error bars.
Extended Data Fig. 8. Optogenetic inhibition of VTA DA neurons decreases time in the interaction zone.
(a) Number of visits in the interaction zone when the door is closed between D15 and D20. Unpaired t-test two-sided (t(16) = 0.2808, P = 0.7824). (b) Number of visits in the interaction zone when the door is open between D15 and D20. Mann-Whitney U test two-sided (U = 14). (c) Velocity in the operant chamber when the door is closed between D15 and D20. Unpaired t-test two-sided (t(16) = 0.1528, P = 0.8804). (d) Velocity in the operant chamber when the door is open between D15 and D20. Unpaired t-test two-sided (t(16) = 1.018, P = 0.3237).
N indicates the number of mice. Dots represent individual data points. All the data are shown as the mean +/-s.e.m. as error bars.
Supplementary Material
Acknowledgements
We would like to thank Christian Lüscher, Manuel Mameli, Philippe Faure, Jérémie Naudé and Sebastiano Bariselli for the comments on the manuscript. We would also like to thank Sebastien Pellat and Lorena Jourdain for the technical support.
Funding
This work is supported by the Swiss National Science Foundation (31003A_182326) and the NCCR Synapsy from the Swiss National Science Foundation. Camilla Bellone is also supported by the ERC Consolidator Grant (864552).
Footnotes
Author contributions: C.S. and C.B. conceived the project. C.B., C.S., and B.G wrote the manuscript. C.S., B.G. performed the electrophysiological recordings and the behavioral experiments with the help of B.R. and M.T. C.S., B.G. performed all the analyzes and statistics.
Competing interests: The authors declare no competing interests.
Data availability
Original data used in the present study are available in the following link: https://doi.org/10.5281/zenodo.5564893. Dataset contains spiking activity of VTA DA neurons in mice and events timing during social free interaction and social instrumental task corresponding to Figures 1, 2, 3, 4, 6 and 7 and Extended Data Figures 1, 2, 3, 4, 6 and 7. Further data supporting the findings are available upon request.
Code availability
Innovative code used in the present study are available in the following link: https://doi.org/10.5281/zenodo.5564893. Further code supporting the findings are available upon request.
References
- 1.Chen P, Hong W. Neural Circuit Mechanisms of Social Behavior. Neuron. 2018;98:16–30. doi: 10.1016/j.neuron.2018.02.026. [DOI] [PMC free article] [PubMed] [Google Scholar]
- 2.Berridge KC, Kringelbach ML. Affective neuroscience of pleasure: reward in humans and animals. Psychopharmacology. 2008;199:457–480. doi: 10.1007/s00213-008-1099-6. [DOI] [PMC free article] [PubMed] [Google Scholar]
- 3.Alhadeff AL, et al. Natural and Drug Rewards Engage Distinct Pathways that Converge on Coordinated Hypothalamic and Reward Circuits. Neuron. 2019;103:891–908.:e6. doi: 10.1016/j.neuron.2019.05.050. [DOI] [PMC free article] [PubMed] [Google Scholar]
- 4.Panksepp JB, Lahvis GP. Social reward among juvenile mice. Genes Brain Behav. 2007;6:661–671. doi: 10.1111/j.1601-183X.2006.00295.x. [DOI] [PMC free article] [PubMed] [Google Scholar]
- 5.Dölen G, Darvishzadeh A, Huang KW, Malenka RC. Social reward requires coordinated activity of nucleus accumbens oxytocin and serotonin. Nature. 2013;501:179–184. doi: 10.1038/nature12518. [DOI] [PMC free article] [PubMed] [Google Scholar]
- 6.Gunaydin LA, et al. Natural Neural Projection Dynamics Underlying Social Behavior. Cell. 2014;157:1535–1551. doi: 10.1016/j.cell.2014.05.017. [DOI] [PMC free article] [PubMed] [Google Scholar]
- 7.Tamir DI, Hughes BL. Social Rewards: From Basic Social Building Blocks to Complex Social Behavior. Perspect Psychol Sci. 2018;13:700–717. doi: 10.1177/1745691618776263. [DOI] [PubMed] [Google Scholar]
- 8.Hu RK, et al. An amygdala-to-hypothalamus circuit for social reward. Nat Neurosci. 2021:1–12. doi: 10.1038/s41593-021-00828-2. [DOI] [PMC free article] [PubMed] [Google Scholar]
- 9.Izuma K, Saito DN, Sadato N. Processing of Social and Monetary Rewards in the Human Striatum. Neuron. 2008;58:284–294. doi: 10.1016/j.neuron.2008.03.020. [DOI] [PubMed] [Google Scholar]
- 10.Bariselli S, et al. Role of VTA dopamine neurons and neuroligin 3 in sociability traits related to nonfamiliar conspecific interaction. Nat Commun. 2018;9:3173. doi: 10.1038/s41467-018-05382-3. [DOI] [PMC free article] [PubMed] [Google Scholar]
- 11.Schultz W, Dayan P, Montague PR. A Neural Substrate of Prediction and Reward. Science. 1997;275:1593–1599. doi: 10.1126/science.275.5306.1593. [DOI] [PubMed] [Google Scholar]
- 12.Eshel N, et al. Arithmetic and local circuitry underlying dopamine prediction errors. Nature. 2015;525:243–246. doi: 10.1038/nature14855. [DOI] [PMC free article] [PubMed] [Google Scholar]
- 13.Roesch MR, Calu DJ, Schoenbaum G. Dopamine neurons encode the better option in rats deciding between differently delayed or sized rewards. Nat Neurosci. 2007;10:1615–1624. doi: 10.1038/nn2013. [DOI] [PMC free article] [PubMed] [Google Scholar]
- 14.Waelti P, Dickinson A, Schultz W. Dopamine responses comply with basic assumptions of formal learning theory. Nature. 2001;412:43–48. doi: 10.1038/35083500. [DOI] [PubMed] [Google Scholar]
- 15.Schultz W. Reward prediction error. Curr Biol. 2017;27:R369–R371. doi: 10.1016/j.cub.2017.02.064. [DOI] [PubMed] [Google Scholar]
- 16.Sharpe MJ, et al. Lateral Hypothalamic GABAergic Neurons Encode Reward Predictions that Are Relayed to the Ventral Tegmental Area to Regulate Learning. Curr Biol. 2017;27:2089–2100.:e5. doi: 10.1016/j.cub.2017.06.024. [DOI] [PMC free article] [PubMed] [Google Scholar]
- 17.Takahashi YK, et al. Dopamine Neurons Respond to Errors in the Prediction of Sensory Features of Expected Rewards. Neuron. 2017;95:1395–1405.:e3. doi: 10.1016/j.neuron.2017.08.025. [DOI] [PMC free article] [PubMed] [Google Scholar]
- 18.Engelhard B, et al. Specialized coding of sensory, motor and cognitive variables in VTA dopamine neurons. Nature. 2019;570:509–513. doi: 10.1038/s41586-019-1261-9. [DOI] [PMC free article] [PubMed] [Google Scholar]
- 19.Kremer Y, Flakowski J, Rohner C, Lüscher C. Context-dependent multiplexing by individual VTA dopamine neurons. J Neurosci. 2020;40:JN-RM-0502-20. doi: 10.1523/JNEUROSCI.0502-20.2020. [DOI] [PMC free article] [PubMed] [Google Scholar]
- 20.Bariselli S, Contestabile A, Tzanoulinou S, Musardo S, Bellone C. SHANK3 Downregulation in the Ventral Tegmental Area Accelerates the Extinction of Contextual Associations Induced by Juvenile Non-familiar Conspecific Interaction. Front Mol Neurosci. 2018;11:360. doi: 10.3389/fnmol.2018.00360. [DOI] [PMC free article] [PubMed] [Google Scholar]
- 21.Cohen JY, Haesler S, Vong L, Lowell BB, Uchida N. Neuron-type-specific signals for reward and punishment in the ventral tegmental area. Nature. 2012;482:85–88. doi: 10.1038/nature10754. [DOI] [PMC free article] [PubMed] [Google Scholar]
- 22.Starkweather CK, Gershman SJ, Uchida N. The Medial Prefrontal Cortex Shapes Dopamine Reward Prediction Errors under State Uncertainty. Neuron. 2018;98:616–629.:e6. doi: 10.1016/j.neuron.2018.03.036. [DOI] [PMC free article] [PubMed] [Google Scholar]
- 23.Mathis A, et al. DeepLabCut: markerless pose estimation of user-defined body parts with deep learning. Nat Neurosci. 2018;21:1281–1289. doi: 10.1038/s41593-018-0209-y. [DOI] [PubMed] [Google Scholar]
- 24.Lisman JE, Grace AA. The Hippocampal-VTA Loop: Controlling the Entry of Information into Long-Term Memory. Neuron. 2005;46:703–713. doi: 10.1016/j.neuron.2005.05.002. [DOI] [PubMed] [Google Scholar]
- 25.Bromberg-Martin ES, Matsumoto M, Hikosaka O. Dopamine in Motivational Control: Rewarding, Aversive, and Alerting. Neuron. 2010;68:815–834. doi: 10.1016/j.neuron.2010.11.022. [DOI] [PMC free article] [PubMed] [Google Scholar]
- 26.Tapper AR, Molas S. Midbrain circuits of novelty processing. Neurobiol Learn Mem. 2020;176:107323. doi: 10.1016/j.nlm.2020.107323. [DOI] [PMC free article] [PubMed] [Google Scholar]
- 27.Berridge KC. ‘Liking’ and ‘wanting’ food rewards: Brain substrates and roles in eating disorders. Physiol Behav. 2009;97:537–550. doi: 10.1016/j.physbeh.2009.02.044. [DOI] [PMC free article] [PubMed] [Google Scholar]
- 28.Meye FJ, Adan RAH. Feelings about food: the ventral tegmental area in food reward and emotional eating. Trends Pharmacol Sci. 2014;35:31–40. doi: 10.1016/j.tips.2013.11.003. [DOI] [PubMed] [Google Scholar]
- 29.Menegas W, Akiti K, Amo R, Uchida N, Watabe-Uchida M. Dopamine neurons projecting to the posterior striatum reinforce avoidance of threatening stimuli. Nat Neurosci. 2018;21:1421–1430. doi: 10.1038/s41593-018-0222-1. [DOI] [PMC free article] [PubMed] [Google Scholar]
- 30.Ljungberg T, Apicella P, Schultz W. Responses of monkey dopamine neurons during learning of behavioral reactions. J Neurophysiol. 1992;67:145–163. doi: 10.1152/jn.1992.67.1.145. [DOI] [PubMed] [Google Scholar]
- 31.Berke JD. What does dopamine mean? Nat Neurosci. 2018;21:787–793. doi: 10.1038/s41593-018-0152-y. [DOI] [PMC free article] [PubMed] [Google Scholar]
- 32.Sharpe MJ, et al. Dopamine transients do not act as model-free prediction errors during associative learning. Nat Commun. 2020;11:106. doi: 10.1038/s41467-019-13953-1. [DOI] [PMC free article] [PubMed] [Google Scholar]
- 33.Geugies H, et al. Impaired reward-related learning signals in remitted unmedicated patients with recurrent depression. Brain. 2019;142:2510–2522. doi: 10.1093/brain/awz167. [DOI] [PMC free article] [PubMed] [Google Scholar]
- 34.Chevrier A, et al. Disrupted reinforcement learning during post-error slowing in ADHD. Biorxiv. 2018:449975. doi: 10.1101/449975. [DOI] [PMC free article] [PubMed] [Google Scholar]
- 35.Sinha P, et al. Autism as a disorder of prediction. Proc National Acad Sci. 2014;111:15220–15225. doi: 10.1073/pnas.1416797111. [DOI] [PMC free article] [PubMed] [Google Scholar]
- 36.Mosner MG, et al. Neural Mechanisms of Reward Prediction Error in Autism Spectrum Disorder. Autism Res Treat. 2019;2019:5469191. doi: 10.1155/2019/5469191. [DOI] [PMC free article] [PubMed] [Google Scholar]
- 37.Chevallier C, Kohls G, Troiani V, Brodkin ES, Schultz RT. The social motivation theory of autism. Trends Cogn Sci. 2012;16:231–239. doi: 10.1016/j.tics.2012.02.007. [DOI] [PMC free article] [PubMed] [Google Scholar]
- 38.Kinard JL, et al. Neural Mechanisms of Social and Nonsocial Reward Prediction Errors in Adolescents with Autism Spectrum Disorder. Autism Res. 2020;13:715–728. doi: 10.1002/aur.2273. [DOI] [PMC free article] [PubMed] [Google Scholar]
- 39.Storey GP, et al. Nicotine Modifies Corticostriatal Plasticity and Amphetamine Rewarding Behaviors in Mice. Eneuro. 2016;3:ENEURO.0095-15.2015. doi: 10.1523/ENEURO.0095-15.2015. [DOI] [PMC free article] [PubMed] [Google Scholar]
- 40.Prusky GT, Alam NM, Douglas RM. Enhancement of Vision by Monocular Deprivation in Adult Mice. J Neurosci. 2006;26:11554–11561. doi: 10.1523/JNEUROSCI.3396-06.2006. [DOI] [PMC free article] [PubMed] [Google Scholar]
- 41.Matsumoto H, Tian J, Uchida N, Watabe-Uchida M. Midbrain dopamine neurons signal aversion in a reward-context-dependent manner. ELife. 2016;5:e1728. doi: 10.7554/eLife.17328. [DOI] [PMC free article] [PubMed] [Google Scholar]
- 42.Tian J, Uchida N. Habenula lesions reveal that multiple mechanisms underlie dopamine prediction errors. Neuron. 2015;87:1304–1316. doi: 10.1016/j.neuron.2015.08.028. [DOI] [PMC free article] [PubMed] [Google Scholar]
Associated Data
This section collects any data citations, data availability statements, or supplementary materials included in this article.
Supplementary Materials
Data Availability Statement
Original data used in the present study are available in the following link: https://doi.org/10.5281/zenodo.5564893. Dataset contains spiking activity of VTA DA neurons in mice and events timing during social free interaction and social instrumental task corresponding to Figures 1, 2, 3, 4, 6 and 7 and Extended Data Figures 1, 2, 3, 4, 6 and 7. Further data supporting the findings are available upon request.
Innovative code used in the present study are available in the following link: https://doi.org/10.5281/zenodo.5564893. Further code supporting the findings are available upon request.


