Abstract
In mammals, the acquisition of the germline from the soma provides the germline with an essential challenge, the necessity to erase and reset genomic methylation 1 . In the male germline RNA-directed DNA methylation silences young active transposable elements (TEs) 2–4 . The PIWI protein MIWI2 (PIWIL4) and its associated PIWI-interacting RNAs (piRNAs) instruct TE DNA methylation 3,5 . PiRNAs are proposed to tether MIWI2 to nascent TE transcripts, however the mechanism by which MIWI2 directs de novo TE methylation is poorly understood but central to the immortality of the germline. Here, we define the interactome of MIWI2 in foetal gonocytes that are undergoing de novo genome methylation and identify a novel MIWI2-associated factor, SPOCD1, that is essential for young TE methylation and silencing. The loss of Spocd1 in mice results in male-specific infertility but impacts neither piRNA biogenesis nor localization of MIWI2 to the nucleus. SPOCD1 is a nuclear protein and its expression is restricted to the period of de novo genome methylation. We found SPOCD1 co-purified in vivo with DNMT3L and DNMT3A, components of the de novo methylation machinery as well as constituents of the NURD and BAF chromatin remodelling complexes. We propose a model whereby tethering of MIWI2 to a nascent TE transcript recruits repressive chromatin remodelling activities and the de novo methylation apparatus through SPOCD1. In summary, we have identified a novel and essential executor of mammalian piRNA-directed DNA methylation.
The germline gives rise to the sperm and egg cells that are the basis of reproduction and heredity. One of the biggest threats to the integrity of the germline are TEs that have the ability to cause mutation through transposition. In mammals, DNA methylation is an important determinant of TEs silencing 6 . The mammalian germline is derived from somatic cells early during development 7 and this acquisition from the soma necessitates the process of germline reprogramming and de novo genome methylation to reset genomic DNA methylation patterns 1 . In the mouse male germline, the process of de novo DNA methylation occurs in gonocytes mostly during embryonic development 4,6 . DNMT3L is the key mediator of genome methylation that interacts with and stimulates the DNMT3 (DNMT3A, DNMT3B and DNMT3C) de novo DNA methyltransferases 8–13 . DNMT3A and DNMT3B may act redundantly on TEs during de novo genome methylation whereas the rodent-specific DNMT3C has a specialized function in TE methylation 12–15 . The first wave of de novo methylation is indiscriminate leading to the bulk genomic methylation 4 . Many active long interspersed nuclear element-1 (LINE1) and intracisternal A-particle (IAP) copies escape the first round of methylation and remain expressed, threatening the genomic integrity of the germline 4 . The PIWI proteins and their associated small non-coding PIWI-interacting RNA (piRNAs) eliminate this threat through post-transcriptional and transcriptional silencing mechanisms 16 . The PIWI protein MILI (PIWIL2) destroys cytoplasmic TE transcripts by piRNA-guided endonucleolytic cleavage that leads to the initiation of effector piRNA production 17 . The resulting effector piRNAs are proposed to guide the nuclear PIWI protein MIWI2 to active TE loci by tethering the ribonucleoprotein particle to the nascent transcript and instructing DNA methylation by an unknown mechanism 16 .
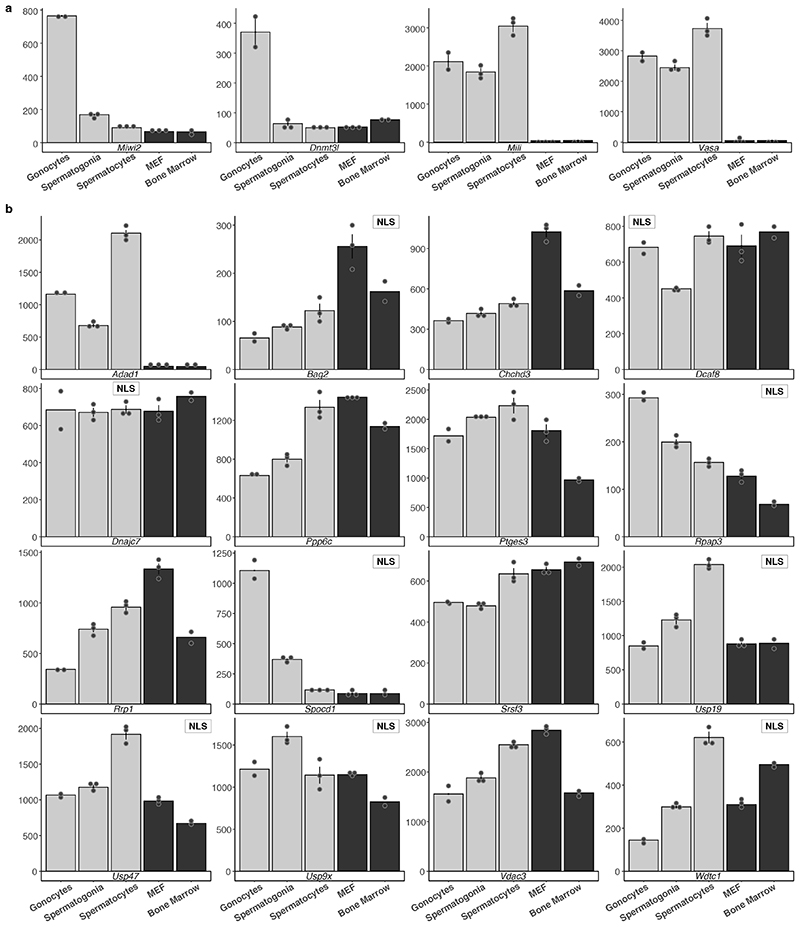
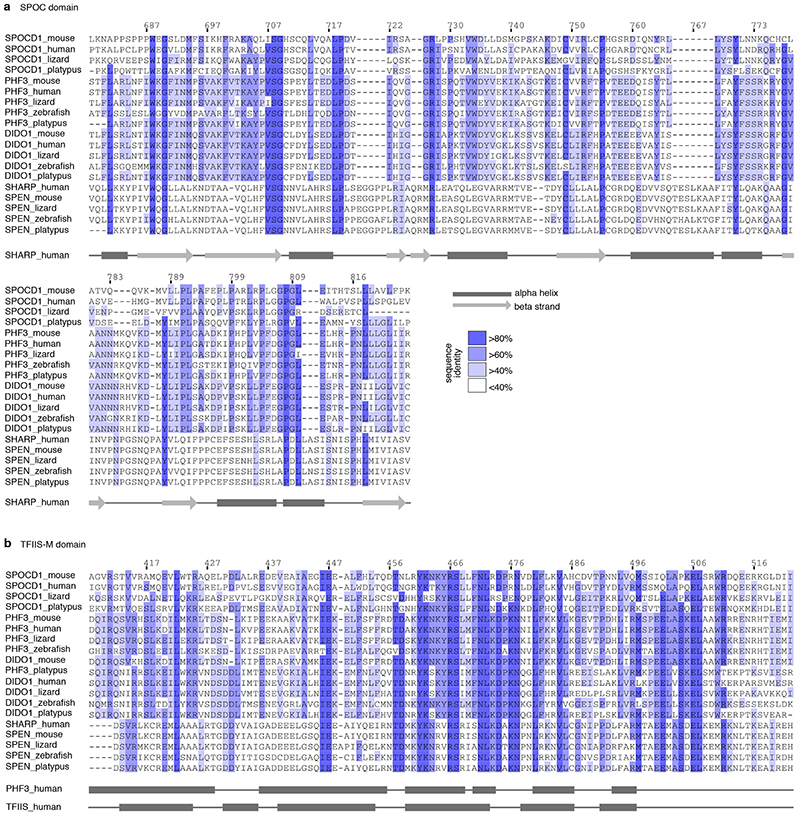
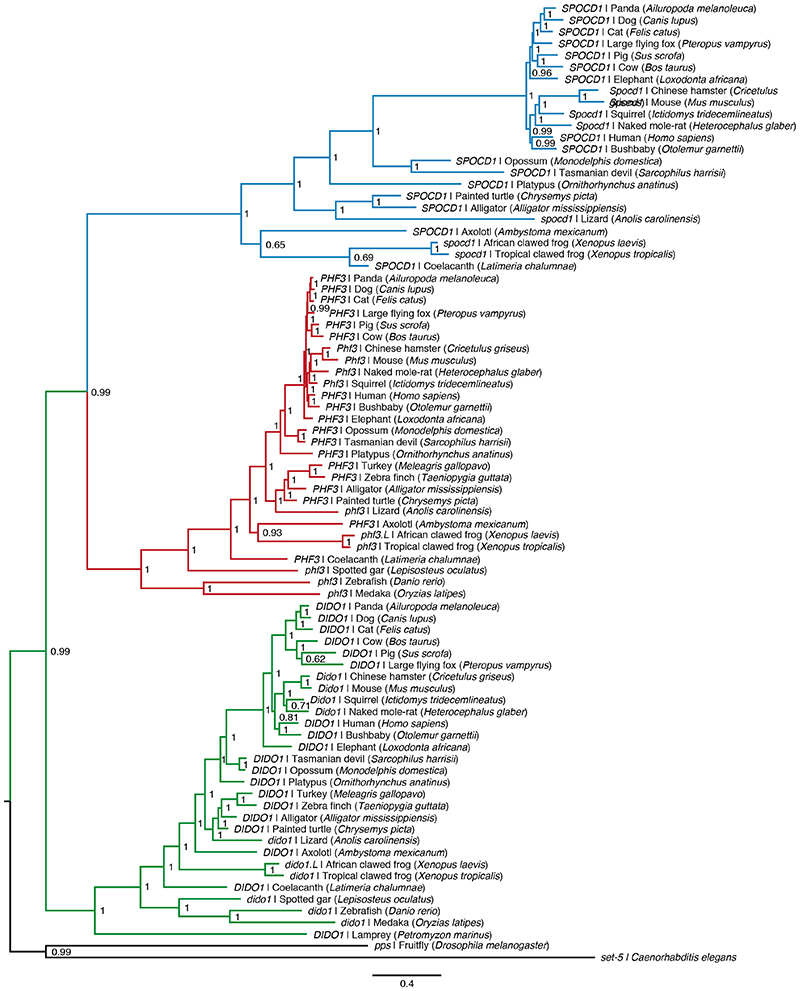
To explore the mechanism of piRNA-instructed de novo DNA methylation, we employed a proteomics approach using our Miwi2HA allele 18 that encodes an endogenously expressed fully functional N-terminal epitope-tagged HA-MIWI2 and performed anti-HA immunoprecipitation coupled with quantitative mass spectrometry (IP-MS) from extracts of Miwi2+/+ (negative control) and Miwi2HA/HA embryonic day 16.5 (E16.5) foetal testes (Fig. 1a, Supplementary Data Table 1). This approach identified 28 MIWI2-associated proteins (enrichment >4-fold, P<0.05). Encouragingly, 12 of these have been implicated in piRNA biogenesis 16 with 5 being novel MIWI2 interactors (Fig. 1b). We also identified 16 additional (14 novel) interacting proteins (Fig. 1b) that could either participate in piRNA biogenesis (cytoplasmic) or nuclear MIWI2 functions. To identify nuclear factors required for the execution of MIWI2 function, we applied the following criteria. First, the expression of the gene should be restricted to the period of de novo genome methylation as is the case for Miwi2 and Dnmt3l (Fig. 1c and Extended Data Fig. 1a). This criterion would likely exclude novel piRNA biogenesis factors as they would be expected to be expressed also in adult spermatogenic populations, as exemplified by Mili (Piwil2) and Vasa (Ddx4) (Fig. 1c and Extended Data Fig. 1a). Second, the gene should encode a protein with a nuclear localization signal (NLS). Applying these criteria, we found a single gene Spocd1 (Fig. 1c and Extended Data Fig. 1b) of unknown function that encodes for a 1015 amino acid protein with a TFIIS-M domain and a SPOC domain (Fig. 1d). Intriguingly, a SPOC domain previously described in SHARP (SPEN, MINT) has been shown to recruit the transcriptional co-repressor NCoR/SMRT 19,20 . The SPOC domain of SPOCD1 is closely related to the one found in PHF3 and DIDO1; and both of these proteins also contain a TFIIS-M domain (Extended Data Fig. 2a-b). Indeed, phylogenetic analysis supports that Spocd1 originated from a duplication of Phf3 in the common ancestor of lobe-finned fishes and tetrapods (Extended Data Fig. 3). In summary, we have identified SPOCD1 as a MIWI2 interactor that is a strong candidate for a facilitator of nuclear MIWI2 function.
Figure 1. Definition of the MIWI2 interactome and identification of SPOCD1 from gonocytes undergoing de novo genome methylation.
a, Volcano plot showing enrichment (log2(mean LFQ ratio of HA-MIWI2 IP/control IP from Miwi2+/+ foetal testis) and confidence (-log10(P-value of two-sided Student’s t-test)) of proteins co-purifying with HA-MIWI2 from E16.5 testis lysates (n=3). Dotted line indicates factors with enrichment >4-fold and significance P<0.05. Red: Known piRNA pathway members, blue: SPOCD1. b, List of known piRNA biogenesis factors and non-piRNA pathway-associated proteins co-purifying with HA-MIWI2. Novel identified MIWI2 interactors are underlined. c, Relative expression of indicated transcripts as measured by Affymetrix microarray in E16.5 gonocytes (n=2), adult spermatogonia (n=3) and spermatocytes (n=3). Data are mean and s.e.m., normalized to peak expression of each transcript. d, Schematic representation of SPOCD1 domain structure.
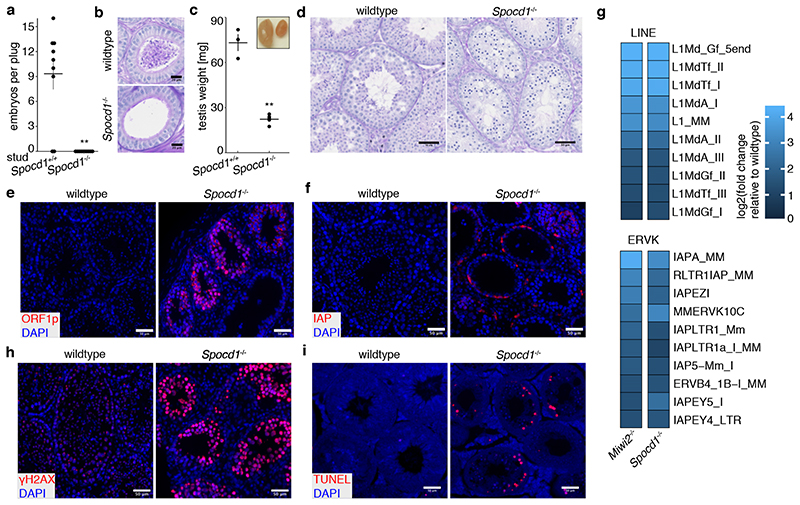
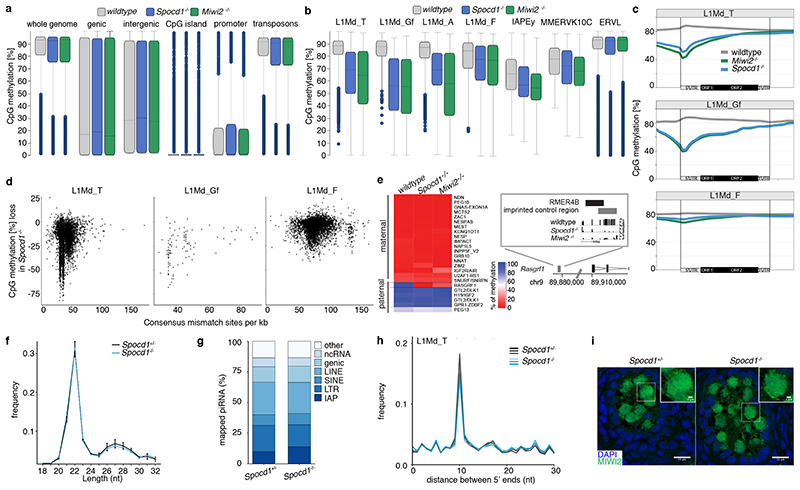
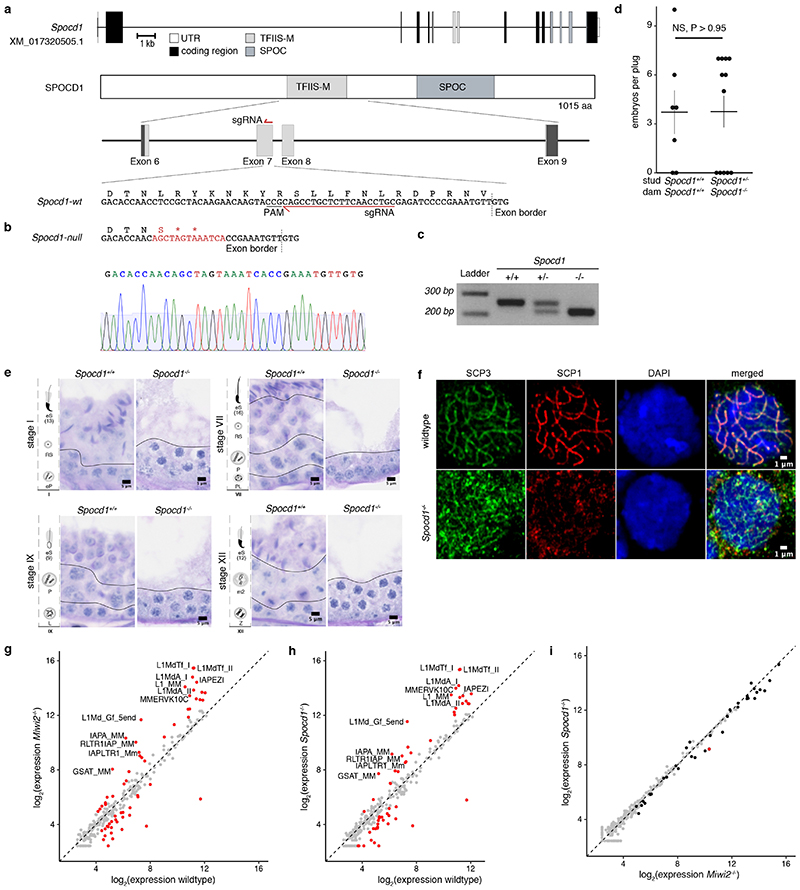
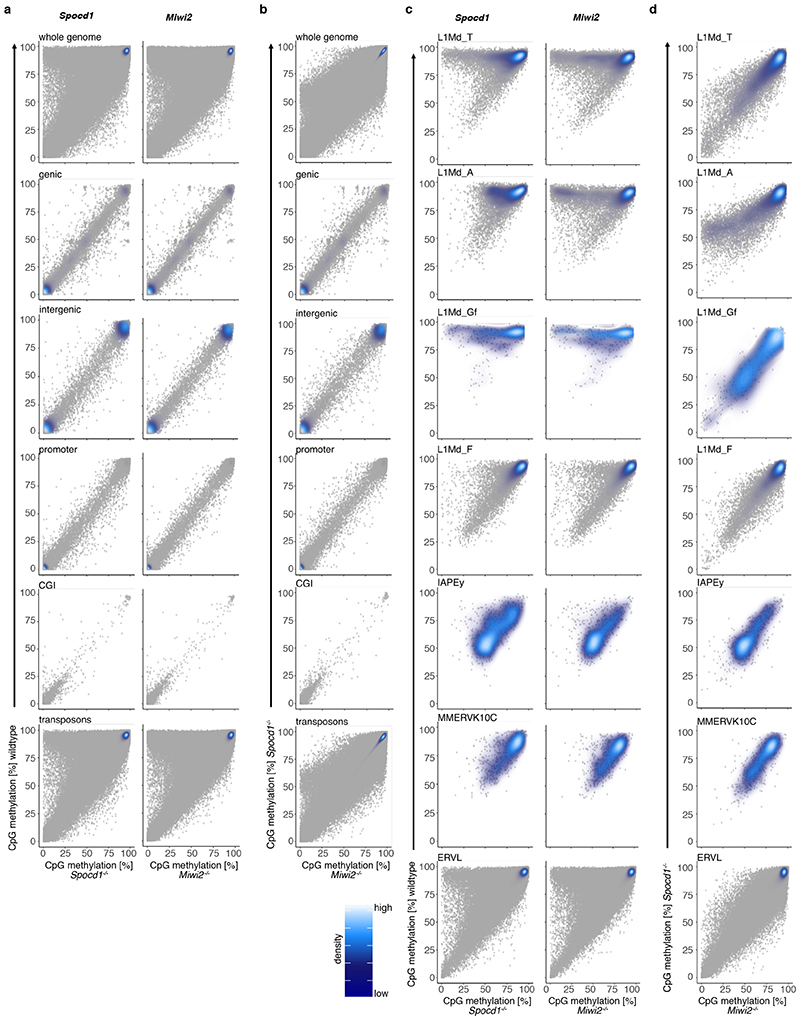
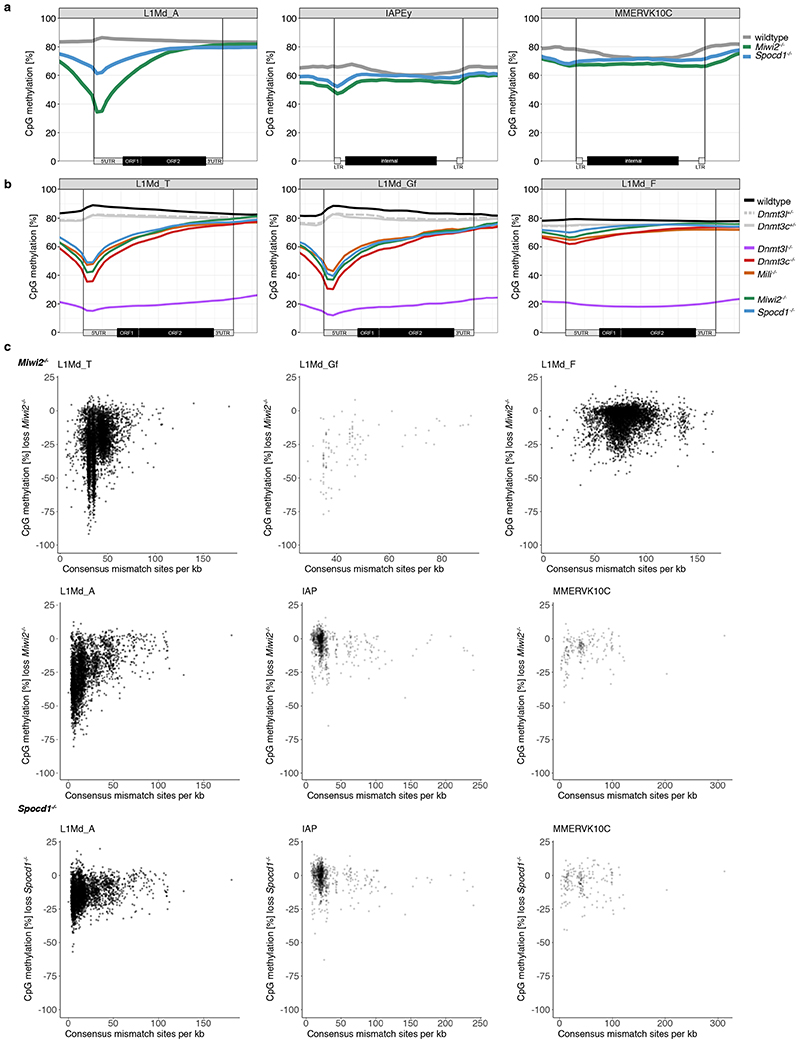
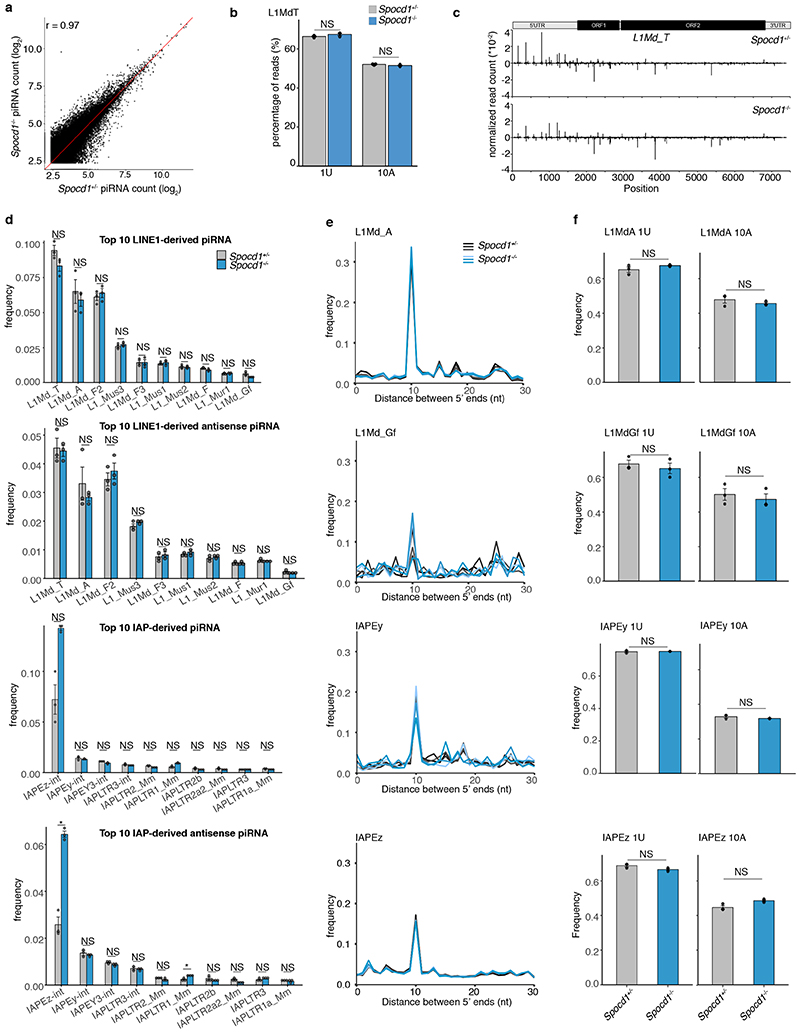
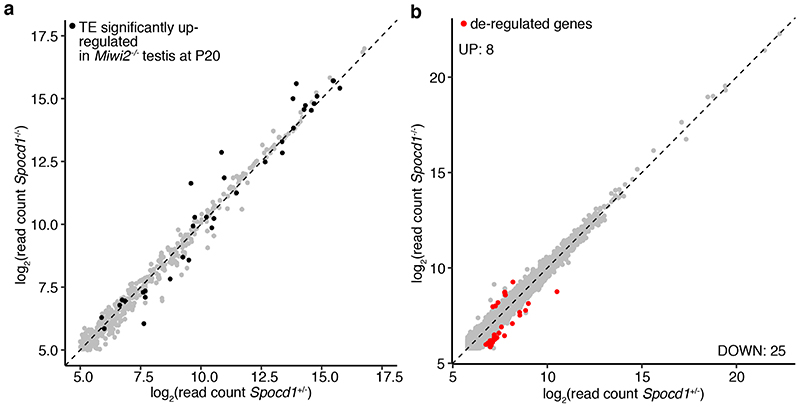
The loss of piRNA-pathway factors or the de novo DNA methylation machinery results in male infertility, arrested spermatogenesis in meiosis and deregulation of LINE1 and IAP elements in mice 2,3,5,9,12,13,17,21 . To explore a potential role for SPOCD1 in the piRNA pathway, we generated a mutant allele (Spocd1-) in the mouse (Extended Data Fig. 4a-c). Spocd1-deficiency resulted in male-specific infertility with the complete absence of spermatozoa in the epididymis (Fig. 2a, b and Extended Data Fig. 4d). The testes of Spocd1-/- mice were atrophic (Fig. 2c); histological analyses of Spocd1-/- testis revealed aberrant seminiferous tubules that lacked spermatids and presented a meiotic arrest at the early pachytene stage (Fig. 2d and Extended Data Fig. 4e). In addition, chromosome pairing is defective in Spocd1-/- meiotic cells (Extended Data Fig. 4f), a hallmark of mutations that result in LINE1 derepression 9 . The expression of LINE1 and IAP were both detected in the seminiferous tubules of adult Spocd1-/- testis (Fig. 2e, f). To explore the full repertoire of deregulated TEs, we performed RNA-seq that revealed that the same families of TEs are deregulated in post-natal day 20 (P20) testis of Miwi2-/- or Spocd1-/- mice (Fig. 2g and Extended Data Fig. 4g-i). Phosphorylation of the histone variant H2AX (gH2AX) is a marker of double stranded breaks 22 ; staining of testis sections revealed the characteristic foci observed in meiotic cells in Spocd1+/+ mice whereas a strong gH2AX stain indicative of extensive DNA damage was observed in Spocd1-/- meiocytes (Fig. 2h). Indeed, widespread apoptosis of meiotic cells was observed in Spocd1-/- testes (Fig. 2i). In summary, SPOCD1 is essential for spermatogenesis and is required for transposon repression. The piRNA pathway is required for de novo DNA methylation of IAP elements and several sub-families of LINE1 2–5 . We next sought to determine if SPOCD1 is required for piRNA-directed de novo DNA methylation. We thus isolated genomic DNA from wildtype, Spocd1-/- and Miwi2-/- P14 spermatogonia and performed whole genome methylation sequencing (Methyl-seq). We choose this time point as it is after completion of de novo genome methylation, prior to the onset of Spocd1-/- phenotypic defects with SPOCD1. Indeed, no major changes in methylation in Spocd1-/- spermatogonia were observed in genic, intergenic, CpG island or promoter regions (Fig. 3a and Extended Data Fig. 5a,b). Globally, Spocd1-deficiency did not affect collective transposon (all TEs grouped) methylation levels (Fig. 3a and Extended Data Fig. 5a,b). Consistent with Miwi2-deficiency, IAPEy and MMERVK10C as well as the young LINE1 families L1Md_A, L1Md_T and L1Md_Gf failed to be fully methylated in Spocd1-/- spermatogonia (Fig. 3b and Extended Data Fig. 5c,d). Metaplot analysis demonstrated defective de novo methylation specifically at TE promotor elements in Spocd1-/- spermatogonia (Fig. 3c and Extended Data Fig. 6a), which is a hallmark of piRNA- and DNMT3C-directed methylation (Extended Data Fig. 6b) 12,23 . The loss of methylation was particularly evident in young LINE1 families and elements such as L1Md_T and L1Md_Gf compared to the older L1Md_F (Fig. 3c–d and Extended Data Fig. 6c). MIWI2 is required specifically for the methylation of one imprinted locus, Rasgrf1 24 . Consistently, among imprinted loci, only Rasgrf1 methylation is dependent upon SPOCD1 function (Fig. 3e). In summary, SPOCD1 is required for de novo DNA methylation of the TEs that are regulated by the piRNA pathway. The dependency of piRNA-mediated silencing of TEs on SPOCD1 may indicate a role for SPOCD1 as a downstream effector of nuclear MIWI2 function or alternatively in piRNA biogenesis, amplification or loading; as mutations that disrupt these processes will lead to the same phenotypic outcome. We therefore sequenced small RNA from Spocd1+/- and Spocd1-/- E16.5 foetal testes to analyse piRNA biogenesis. We found no major impact of Spocd1-deficiency on length distribution (Fig. 3f), annotation of mapped piRNAs (Fig. 3g and Extended Data Fig. 7a), relative piRNA counts (Extended Data Fig. 7b), piRNA amplification (Fig. 3h Extended Data Fig. 7c-e) or piRNAs mapping to TEs (Extended Data Fig. 7f). piRNA binding to MIWI2 licences its entry to the nucleus, thus disruption of piRNA biogenesis, amplification or loading results in the dramatic reduction of MIWI2’s nuclear localization 17,18,25 . The fact that MIWI2 exhibits normal localization in the absence of Spocd1 (Fig. 3i) confirms that SPOCD1 is not required for piRNA processing but suggests its involvement in the execution of MIWI2’s nuclear function. A possible alternative nuclear function could be that SPOCD1 acts as transcription factor required for either transposon or gene expression. However, RNA-seq from E16.5 foetal gonocytes revealed Spocd1-deficiency had a minimal impact on gene expression and normal expression for the majority of TEs but, importantly, the piRNA-regulated TEs were mostly expressed at or above normal levels in Spocd1-/- E16.5 foetal gonocytes (Extended Data Fig. 8a-b, Supplementary Data Table 2 and 3). Collectively, these data are not supportive of a role for SPOCD1 as a transcription or a piRNA biogenesis factor.
Figure 2. SPOCD1 is required for spermatogenesis and LINE1/IAP silencing.
a, Number of E16.5 embryos per plug of studs with the indicated Spocd1 genotype mated to wildtype females are presented. Data are mean and s.e.m. from n=3 Spocd1+/+ studs (9 plugs total) and n=4 Spocd1-/- studs (10 plugs total). **P~0.001, two-sided Student’s t-test. b, Representative images of PAS & Haematoxylin stained epididymis sections from (n=3) adult mice with the indicated genotype are shown. Scale bars, 20 μm. c, Average testicular weight in mg from adult mice with the indicated Spocd1 genotype is plotted. Insert shows a representative image of wildtype (left) and Spocd1-/- testes. Data are mean and s.e.m. from n=3 wildtype and n=5 Spocd1-/- mice. **P~0.01, two-sided Student’s t-test. d, Representative PAS & Haematoxylin stained testis sections of (n=3) adult mice of the indicated Spocd1 genotype is shown. Scale bars, 50 μm. e, f, Representative images of testis sections from (n=3) adult wildtype and Spocd1-/- mice stained for LINE1 ORF1p (e) or IAP-GAG protein (f) (red) are shown. DNA was stained with DAPI (blue). Scale bars, 50 μm. g, RNA-seq derived heat maps depicting fold-change of expression relative to wildtype for the 10 most up-regulated LINE and ERVK TEs in (n=3) Miwi2-/- and Spocd1-/- P20 testis. h, i, Representative images of testis sections of (n=3) adult wildtype and Spocd1-/- mice stained for the DNA damage response marker γH2AX (h) and TUNEL staining revealing apoptotic cells (i) (red). DNA was stained with DAPI (blue). Scale bars, 50 μm.
Figure 3. SPOCD1 is required for de novo TE DNA methylation loci but not piRNA expression.
a-e, Analyses of genomic CpG methylation of undifferentiated P14 spermatogonia from (n=3) wildtype, Spocd1 -/- and Miwi2 -/- mice are presented. a, b, Percentages of CpG methylation levels of the indicated genomic features (with genic, promoter and CpG islands non-overlapping TEs and intergenic non-overlapping TEs or genes) or TEs (non-overlapping genes) for (n=3) biological replicates per genotype is shown as box plots. Boxes represent interquantile range from 25th to 75th percentile, the horizontal line the median, whiskers denote the data range of median ± 2x interquantile range and dots datapoints outside of this data range. c, Metaplots of mean CpG methylation over LINE1 elements and adjacent 2 kb are shown. d, Correlation analysis of mean CpG methylation loss relative to wildtype for individual TEs of the indicated LINE1 family in relation to their divergence from the consensus sequence is shown for Spocd1-/- spermatogonia. e, Heatmap of mean CpG methylation level of indicated maternal and paternal imprinted regions is shown. Rasgrf1 imprinted control region is shown in detail. f-h, piRNA analysis of small RNAs sequenced from E16.5 testes from (n=3) Spocd1+/- and Spocd1-/- mice is presented. f, Nucleotide (nt) length distribution of small RNAs is shown. Data represent the mean and s.e.m. No significant differences were observed (P=1.0, Bonferroni adjusted two-tailed Student’s t-tests). g, Annotation of piRNAs from merged replicates. h, Ping-pong analysis of piRNAs: Relative frequency of the distance between 5’ ends of complementary piRNAs mapping to the LINE1 L1Md_T family is shown. i, Representative images (of n=3 wildtype and Spocd1-/- mice) of MIWI2 localization in E16.5 Spocd1+/- and Spocd1-/- gonocytes. Scale bars, 15 μm. Insert shows a zoom in of the indicated cell. Scale bars, 2 μm.
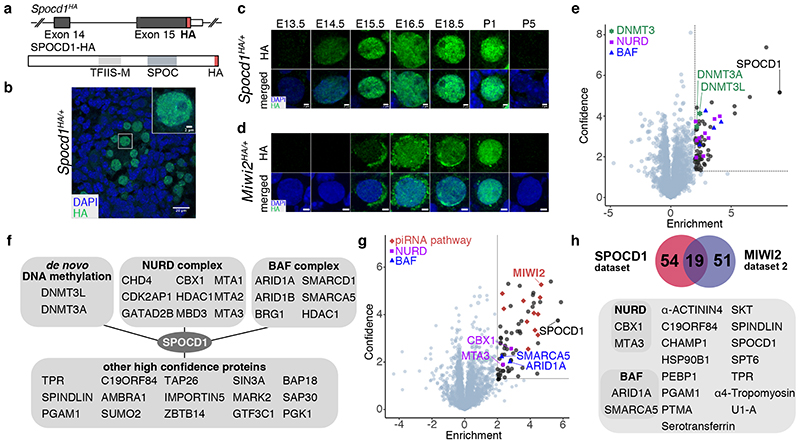
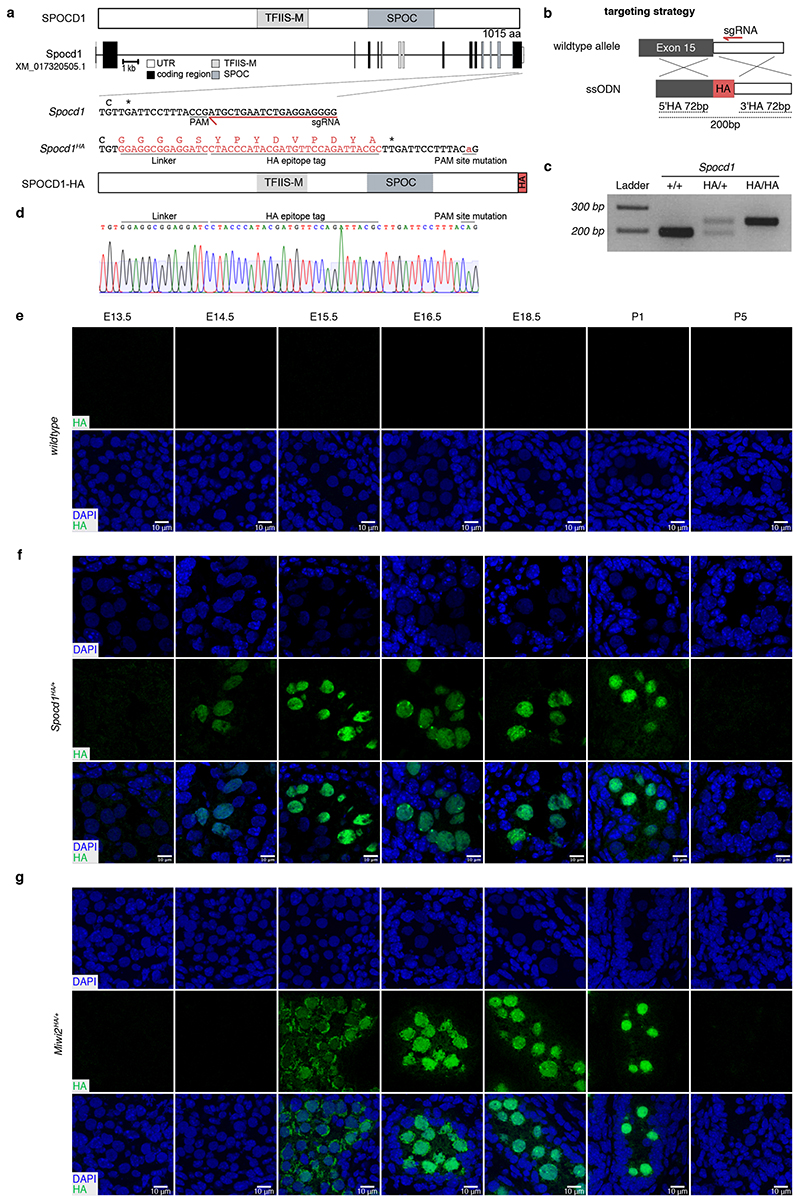
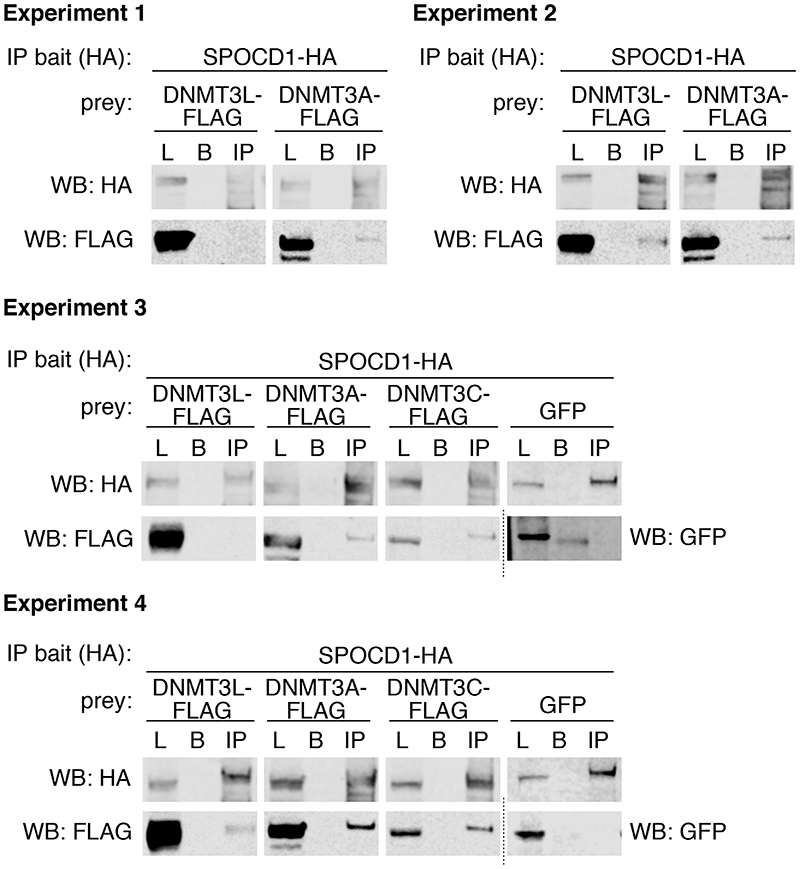
We next sought to explore how SPOCD1 contributes to de novo TE methylation. We thus engineered the Spocd1HA allele where the sequence encoding the HA epitope tag has been inserted into the Spocd1 locus to generate an endogenously expressed, fully functional C-terminal epitope-tagged SPOCD1-HA (Fig. 4a and Extended Data Fig. 9a-d). Confocal immunolocalization of SPOCD1-HA on E16.5 foetal testis sections revealed that SPOCD1 is restricted to foetal gonocytes and predominantly nuclear (Fig. 4b). Furthermore, SPOCD1 expression is restricted to the period of de novo DNA methylation (Fig. 4c and Extended Data Fig. 9e-f). Expression of SPOCD1 commenced at E14.5 preceding MIWI2 expression by a day with expression of both proteins extinguished by P5 (Fig. 4c, d and Extended Data Fig. 9e-g). To explore how SPOCD1 might mediate de novo DNA methylation we performed anti-HA IP-MS from extracts of Spocd1 +/+ (negative control) and Spocd1 HA/+ E16.5 foetal testes (Fig 4e, f, Supplementary Data Table 4). We identified 72 proteins (enrichment >4-fold, P<0.05) that associate with SPOCD1-HA, amongst which were DNMT3L and DNMT3A, components of the de novo methylation machinery (Fig 4e, f, Supplementary Data Table 4). A few peptides corresponding to DNMT3C were detected in the SPOCD1 precipitates, but their abundance was insufficient to meet our stringent co-purification criteria. We confirmed the co-precipitation of SPOCD1 with components of the de novo methylation machinery using HEK cells as an orthologous system (Extended Data Fig. 10). Several components of the repressive chromatin remodelling NURD and BAF complexes co-purified with SPOCD1 (Fig 4e, f, Supplementary Data Table 4). At least one paralogue of all components of the core NURD complex bar one 26 and several of the BAF complex 27 were enriched in SPOCD1 IPs (Fig 4e, f, Supplementary Data Table 4). We also found MIWI2 significantly enriched in the SPOCD1 IP but less than the stringent 4-fold cut off (P<0.011, 1.9-fold enriched). We noted a poor overlap between the factors co-precipitated by MIWI2 and SPOCD1, which could arise from different extraction procedures between the respective IPs. We re-performed MIWI2 IP-MS but included Benzonase to aid chromatin solubilization, as was done in the SPOCD1 IP-MS experiment. This revealed a major overlap in co-precipitated proteins between MIWI2 and SPOCD1 (Fig 4g, h, Supplementary Data Table 5). Importantly, the interaction with SPOCD1 was confirmed and we now found NURD (MTA3) and BAF (ARID1A and SMARCA5) components in the MIWI2 IP using the same stringent association criteria (enrichment >4-fold, P<0.05). Moreover, we also found DNMT3L as well as additional BAF and NURD components significantly enriched (<4-fold) in the MIWI2 IP (Supplementary Data Table 6). In summary, we have shown that SPOCD1 is a nuclear protein, specifically expressed during the period of de novo DNA methylation and co-precipitates the de novo DNA methylation machinery as well as several chromatin remodelling complexes.
Figure 4. SPOCD1 is a nuclear protein that associates with the de novo DNA methylation machinery and repressive chromatin remodelling complexes.
a, Schematic representation of the Spocd1HA allele and the C-terminal HA-tagged SPOCD1 protein. b, Representative image of SPOCD1-HA localization in gonocytes at E16.5 from (n=3) Spocd1HA/+ mice. Scale bar, 20 μm. Insert shows a zoom in of the indicated foetal gonocyte. Scale bar, 2 μm. c, d, Representative images of expression of SPOCD1-HA (c) and HA-MIWI2 (d) in gonocytes at the indicated time points from (n=3) Spocd1HA/+ and Miwi2 HA/+ mice, respectively, are shown. Scale bars, 2 μm. e, Volcano plot showing enrichment (log2(mean LFQ ratio of SPOCD1-HA IP/control IP from Spocd1+/+ foetal testis) and statistical confidence (-log10(P-value of two-sided Student’s t-test)) of proteins co-purifying with SPOCD1-HA from E16.5 testis lysates (n=4). Dotted line indicates enrichment >4-fold and significance P<0.05. DNMT3L and DNMT3A (green), members of the NURD (violet) and BAF (blue) complexes are highlighted. f, Schematic representation of selected proteins co-purifying with SPOCD1. g, Volcano plot as presented in panel e of proteins co-purifying with MIWI2-HA from E16.5 testis Benzonase-solubilized extracts (n=4). h, Schematic representation of overlap of proteins co-purifying with both SPOCD1 and MIWI2.
Here we have defined MIWI2-associated factors in E16.5 foetal gonocytes; among these we have identified SPOCD1 and shown its requirement for piRNA-directed TE methylation. While SPOCD1 robustly co-purified with MIWI2, we did not observe MIWI2 in SPOCD1 immunoprecipitates within the stringent high enrichment and confidence interactors. We interpret this observation as indicating that only a fraction of SPOCD1 is bound either directly or indirectly to MIWI2. This fraction likely merits the portion of MIWI2 that has identified an active TE and engaged in silencing. Indeed, it may be important to uncouple MIWI2 from the effector machinery until a bona fide target has been identified to avoid precocious aberrant methylation and possible epimutations that would be transmitted to the next generation. We propose a tentative model of MIWI2-piRNA directed DNA methylation whereby high complementarity base pairing of the piRNA to a nascent TE transcript licences MIWI2 to engage SPOCD1 and the associated chromatin remodelling and DNA methylation machinery. In conclusion, we have identified SPOCD1 as an essential nuclear effector of MIWI2 function and provide the first mechanistic insights into mammalian piRNA-directed methylation.
Methods summary
Full Methods and any associated references are available in the online version of the paper at www.nature.com/nature.
Methods
Mouse strains and experimentation
The Miwi2HA and Miwi2tdTomato (Miwi2tdTom) mouse alleles have been previously produced in the O’Carroll laboratory 18,28 . These lines were kept on a C57BL/6N genetic background. The Miwi2tdTom mouse allele generates a null allele and was used as a Miwi2null allele in this study 28 . The Spocd1null and Spocd1HA alleles were created using CRISPR-Cas9 gene editing technology using B6CBAF1/Crl genetic background fertilized 1-cell zygotes as previously described 29,30 . For Spocd1null , we injected a single sgRNA (GCAGGTTGAAGAGCAGGCTG) together with CAS9 mRNA and F0 offspring screened by PCR and Sanger sequencing for frame-shift mutations. The Spocd1HA allele was generated by injection of a single sgRNA (CCCCTCCTCAGATTCAGCAT) together with CAS9 mRNA and a single stranded DNA oligo containing a GGGGS linker, HA-epitope tag and a PAM site mutation flanked by 72 nucleotides of homology arms (AAACAGACTGCAGAACAGATACAAACTAGGCAGGTGTGGGAGAGCTCACTCGC CCCTCCTCAGATTCAGCATCtGTAAAGGAATCAAGCGTAATCTGGAACATCGTAT GGGTAGGATCCTCCGCCTCCACACTCATGTTCTGGTGGCTCTAAAGGGTCTGACC CCTCTGGTGGGGGACAGTTAGAGCCACCTCCATCCA). F0 offspring were then screened by PCR and Sanger sequencing for the correct allele. Both lines were established from one founder animal and back-crossed several times to a C57BL/6N genetic background. Thus, the mice analysed were on a mixed B6CBAF1/Crl; C57BL/6N genetic background. Mice were genotyped by PCR using the following primer pairs, Spocd1null (F: GAAGATGAGGTAGAGGCCATCG, R: TGAGCCACTTTGAGAAACAGGT) and Spocd1HA (F: CCCCATCCACTGTAGTATCTGC, R: ATACAAACTAGGCAGGTGTGGG). For foetal testes collection for IP-MS, the Miwi2HA line was additionally back-crossed twice to an Hsd:ICR (CD1) outbred genetic background, which shows a characteristic large litter size (Miwi2HA .CD1). Mice were mated for 4 days and females checked for plugs daily. Plugged females were separated from studs and the day of the plug counted as E0.5. Foetal testes for the immuno-precipitation and mass-spectrometry experiments were collected from matings of Miwi2HA/HA studs to Miwi2HA/HA females or Spocd1HA/HA studs to Hsd:ICR (CD1) wildtype females. Male fertility was assessed by mating studs to Hsd:ICR (CD1) wildtype females counting the number of embryos at E16.5 for each plugged female. Female fertility was assessed by mating Spocd1-/- females to Spocd1+/- studs and comparing number of embryos at E16.5 for each plugged female to matings of C57BL/6N wildtype mice.
Animals were maintained at the University of Edinburgh, UK in accordance with the regulation of the UK Home Office. Ethical approval for the mouse experimentation has been given by the University of Edinburgh’s Animal Welfare and Ethical Review Body and the work done under licence from the United Kingdom’s Home Office.
Immuno-precipitation and mass-spectrometry (IP-MS)
Foetal testes were isolated from E16.5 embryos and snap frozen in liquid nitrogen. 50 testes per replicate were lysed and homogenized in 1 ml of hypotonic lysis buffer (10 mM Tris-HCl pH 8, 10 mM KCl, 5 mM MgCl2, 0.1 % IGEPAL CA-630, complete protease inhibitor EDTA-free (Roche)) with 20 strokes in a glass douncer. For the IP-MS experiments presented in figure 4, lysates of Spocd1HA/+ or Miwi2HA/+ testes and corresponding wildtype controls were further incubated for 30 min at 4 °C after addition of 50 U/ml Benzonase (Millipore). Lysates were cleared by centrifugation for 10 min at 21,000 × g. 50 μl anti-HA magnetic beads (Pierce) (additionally cross-linked with 20 mM dimethyl-pimelidate in borate buffer pH 9) were resuspended in 600 μl hypotonic lysis buffer. 900 μl of cleared lysate was then added to the resuspended beads and incubated for 30 min at 4 °C. Beads were washed four times with wash buffer (50 mM Tris-HCl pH 8, 100 mM KCl, 5 mM MgCl2, 0.1 % IGEPAL CA-630) and bound proteins were eluted with 0.1 % Rapigest (Waters) in 50 mM Tris-HCl pH 8 for 15 min at 50 °C.
Eluted proteins were trypsin digested as described 31 , desalted using STAGE tips 32 , resuspended in 0.1 % trifluoroacetic acid (v/v) and subjected to LC-MS. Peptides were separated on an ultra-high resolution nano-flow liquid chromatography nanoLC Ultimate 3000 unit fitted with an Easyspray (50 cm, 2 μm particles) column coupled to the high resolution/accurate-mass masss-pectrometer Orbitrap Fusion Lumos operated in DDA(data-dependent-acquisition)-mode (Thermo Fisher Scientific). Samples we separated using a 2 % - 40 % - 95 % 190 min gradient (Mobile phase A - 0.1 % aqueous formic acid, B – 80 % acetonitrile in 0.1 % formic acid). The MS acquisition parameters were as follows – cycle time was set to 3 s, the MS1 scan Orbitrap resolution was set to 120,000, RF lens to 30 %, AGC target to 4.0e5, and maximum injection time to 50 ms, detected intensity threshold was 5.0e3. The MS2 scan was performed with the Ion Trap using rapid scan setting. The AGC target was set to 2.0e4, and maximum injection time was 50ms. This set-up achieves a detection limit in the low attomole (10-18)-range and has been used in large proteome and interactome screens 33,34 . Raw data were processed using MaxQuant version 1.6.1.0. Label-free quantitation (LFQ) was performed using the MaxQuant LFQ algorithm 35 . Peptides were searched against the mouse UniProt database (date 21.07.2017) with commonly observed contaminants (e.g. trypsin, keratins, etc.) removed during Perseus analysis 35–37 . For visualization, LFQ intensities were imported into Perseus version 1.6.0.2 37 and processed as described 38 .
Nuclear localization signal (NLS) prediction
The presence of an NLS was predicted by cNLS mapper 39 , searching the entire protein for bipartite NLSs and a cut-off score of 5.0.
Affymetrix microarray datasets
The Affymetrix microarray datasets of spermatogonia, spermatocytes, mouse embryonic fibroblasts (MEFs) and bone marrow (ArrayExpress: E-MTAB-4828, E-MTAB-7067, E-MTAB-5056) have been previously described 28,40,41 . The new microarray data for gonocytes was generated as previously described 40 from gonocytes purified by FACS from E16.5 foetal testes using the Miwi2tdTom reporter allele 28 .
Domain alignment
Alignments of SPOCD1 domains to homologous proteins were generated using ClustalW 42 . Alignment of the SPOC domain was adjusted based on SPOCD1 models generated by PHYRE2 43 superimposed on human SHARP (PDBid 1OW1 19 ) and A. thaliana FPA SPOC (PDBid 5KXF 44 ) domains. Alignments are presented using Jalview 45 with secondary structure elements from human SHARP (PDBid 1OW1 19 ), PHF3 (PDBid 2DME) and human TFIIS (PDBid 3NDQ). The following sequence identifiers of homologues were used in the alignment of the SPOCD1 SPOC domain: Q6ZMY3, H9GUJ8, F7FFW6, B2RQG2, Q92576, H9GF02, B8A483, XP_028916420.1, Q8C9B9, Q9BTC0, G1KE55, F1QQA3, F7DIQ2, Q62504, Q96T58, H9GKA7, F1QMN6, XP_028921280.1. The SPOCD1 TFIIS-M domain was aligned based on primary sequence to the following sequences: Q6ZMY3, H9GUJ8, F7FFW6, B2RQG2, Q92576, H9GF02, B8A483, XP_028916420.1, Q8C9B9, Q9BTC0, G1KE55, F1QQA3, F7DIQ2, P10711, P23193, H9GPX5, Q7T3C1, F7BX76.
Phylogenetic analyses
Spocd1, Phf3 and Dido1 sequences were searched via tblastn 46 using the mouse and alligator protein sequences as queries and the non-redundant nucleotide collection as database. Transcript sequences with significant alignments were downloaded and processed to keep only cDNA sequences. Additional cDNA sequences were included based on described orthologous relationships from Ensembl 90 47 and Ensembl 91 48 . Axolotl and western clawed frog sequences were extracted from the UCSC genome browser 49 . Dido1 orthologous sequences from Drosophila and C. elegans were identified by the ortholog annotations of Flybase 50 (release FB2017_05). For phylogeny reconstruction including only Spocd1 orthologs, cDNA sequences were aligned using the RevTrans 2.0b webserver 51 with T-COFFEE (v.11.0) as alignment method. For the phylogeny including Spocd1 and its paralogs, cDNA sequences were first virtually translated with the Virtual Ribosome tool version 2.0 52 and aligned using Clustal Omega 42,53 with default parameters. Protein alignments were saved and used as scaffolds to align cDNA sequences using the RevTrans 2.0b webserver. Nucleotide alignments generated by RevTrans were formatted into NEXUS interleave files that were used for phylogenetic reconstruction with MrBayes v3.2.6 54,55 through the CIPRES Science Gateway V. 3.3 56 . The selected evolutionary model for MrBayes was GTR + I + Γ (nst=6 rates=invgamma) and priors on state frequencies were left with default values. Two analyses (nruns=2) were run with four MCMC chains for each one (nchains=4) and a heating parameter of 0.2. Sample and diagnostic frequencies were set to 1,000 and 5,000, respectively. Analyses were stopped after 2 × 10⁶ generations and the consensus trees were obtained using a burnin fraction of 0.25. Tree appearance was edited with FigTree v1.4.2 (http//tree.bio.ed.ac.uk/software/figtree).
Histology
Isolated testes and epididymis were fixed overnight in Bouin’s fluid, washed three times in 70 % ethanol and embedded in paraffin. 6 μm sections were cut on a microtome (Leica) and deparaffinised in a graded alcohol series according to standard laboratory procedures. The rehydrated sections were then stained with the periodic-acid-Schiff (PAS) staining kit (TCS Biosciences) according to the manufacturer’s recommendations. The stained sections were subsequently de-hydrated in a reverse alcohol series and mounted on coverslips with Pertex mounting media (Pioneer Research Chemicals) according to standard laboratory procedures. Slides were imaged on a Zeiss AxioScan scanning microscope using the 40x objective. Cropped images of the scan were exported using the Zeiss Zen software and further processed in ImageJ.
Immuno-fluorescence
Immuno-fluorescence was performed on freshly cut 6 μm sections of OCT embedded testes as previously described 18 Primary antibodies were incubated overnight in blocking buffer (dilutions: anti-HA (C29F4, Cell Signaling Technologies) 1:200 (for SPOCD1-HA) or 1:500 (for HA-MIWI2); anti-HA (6E2, Cell Signaling Technologies) 1:200; anti-LINE1-ORF1P 57 1:500; anti-IAP-GAG (a kind gift from B. Cullen, Duke University, Durham, NC, USA) 1:500; anti-γH2AX (IHC-00059, Bethyl Laboratories) 1:500), anti-SCP1 (ab15090, abcam) 1:300 and anti-SCP3 (D1, sc74569, Santa Cruz Biotechnology) 1:300. Sections were then stained with DAPI and the appropriate donkey anti-rabbit or donkey anti-mouse labelled with an Alexa Fluor (488, 568 or 647) dye and mounted on coverslips with Prolong Gold (Invitrogen). Images were acquired on a Zeiss Observer, Leica SP8 confocal microscope or Zeiss LSM880 with Airyscan module. Images acquired using the Airy scan module were deconvoluted with the Zeiss Zen software “Airyscan processing” on settings “3D” and a strength of 6. Images were processed and analysed with ImageJ and Zeiss Zen software.
Terminal deoxynucleotidyl transferase dUTP nick end labelling (TUNEL assay)
Paraffin embedded testes were sectioned and re-hydrated as described above. Sections were pre-treated with proteinase K (10 μg/ml in 10 mM Tris pH 8; Thermo Scientific) and labelled using the Click-iT TUNEL assay, Alexa Fluor 647 dye (Invitrogen) according to the manufacturer’s instructions. Sections were counter-stained with DAPI (1 μg/ml), embedded with Prolong Gold (Invitrogen) and imaged on a Zeiss Observer microscope. Images were processed as above.
RNA sequencing and analysis
Total RNA was extracted from sorted Miwi2tdTOM -positive E16.5 gonocytes using QIAzol reagent (Qiagen). Libraries for low input RNA-seq were then prepared with RiboGone and the SMARTer Stranded RNA-seq kit from Clontech and sequenced on an Illumina HiSeq 4000 in 75 bp paired-end mode. For RNA-seq of P20 testis, total RNA was extracted from 1 testis using QIAGEN RNeasy Mini kit, following the manufacturer’s protocol including on-column DNase treatment. Total RNA was used for library preparation with NEBNext Ultra II Directional RNA Library Prep Kit for Illumina and 8 cycles of PCR was performed. These libraries were sequenced on an Illumina NextSeq 500 in 150 bp single-end read mode.
For analysis of differentially expressed genes, reads were mapped to GRCm38 genome_tran (release 84) with HISAT2(2.1.0) 58 using following options: --no-mixed --no-discordant --qc-filter --trim5 3. Mapped reads per gene were counted with htseq-count (HTSeq 0.11.1) 59 providing a GTF file and differentially expressed genes were analysed using DESeq2(1.26.0) 60 . For analysis of differentially expressed retrotransposons, adapter sequences were removed from reads using cutadapt(1.8.1) 61 with default settings. Processed reads were mapped to consensus sequence of rodent retrotransposons retrieved from Repbase(24.01) 62 using bowtie2 63 (2.3.4.3) with default settings. Mapped reads per retrotransposon were counted and significantly de-regulated species were analysed using DESeq2.
Fluorescence activated cell sorting (FACS)
CD9+ spermatogonia were sorted from P14 testes as previously described 18 with minor alterations: 100 μg/ml DNase I (Sigma-Aldrich) was added together with foetal calf serum to stop the trypsin digest and the cell suspension was further incubated for 3 min at 32 °C to facilitate complete degradation of released DNA. Cells were blocked with Fc block (anti-CD16/32, clone 93, eBioscience, 1:50), followed by labelling with anti-CD45 (clone 30-F11, eBioscience, 1:200) and anti-CD51 (clone RMV-7, Biolegend, 1:50) biotin conjugated antibodies. Cells were then stained with anti-CD9APC (clone eBioKMC8, eBioscience, 1:200), anti-cKitPE-Cy7 (clone 2B8, eBioscience, 1:1600), streptavidinV450 (BD bioscience, 1:250) and 1 μg/ml DAPI and sorted into medium on a BD Aria II sorter (gating strategy shown in Supplementary Figure 2a). Sorted cells were pelleted for 5 min at 500 g and snap frozen in liquid nitrogen.
E16.5 gonocytes were FACS purified from Miwi2tdTom/+ foetal testes by dissecting the testes in a drop of goni-mem (DMEM (Life Technologies) supplemented with penicillin-streptomycin (Life Technologies), NEAA (Life Technologies), sodium pyruvate (Life Technologies) and sodium lactate (Sigma-Aldrich) and digestion in 0.25 % Trypsin-EDTA (Gibco) at 37 °C for 10 minutes. Digestion was stopped by addition of 20 % foetal calf serum (FCS) and cells pelleted for 5 min at 100 × g. The pellet was treated with 10 μl 5 mg/ml DNase I (Sigma-Aldrich) for 2 min and cells rigorously resuspended in PBS containing 2 % FCS by pipetting 50 times. tdTomato-positive cells were sorted on a BD Aria Fusion sorter into PBS, lysed in Qiazol (Qiagen) and snap frozen in liquid nitrogen (gating strategy shown in Supplementary Figure 2b).
Whole genome methylation sequencing (Methyl-seq) and analysis
DNA from FACS-isolated P14 spermatogonial stem cells was isolated by proteinase K digest (10 mM Tris-HCl pH 8, 5 mM EDTA, 1 % SDS, 0.3 M Na-acetate, 0.2 mg/ml proteinase K) overnight, followed by two rounds of phenol/chloroform/isoamylalcohol (25:24:1, Sigma-Aldrich) extraction and one round of chloroform extraction. The DNA was precipitated at -20 °C after addition of 1/10 volume 3 M Na-acetate, 10 μg linear acrylamide (Invitrogen) and 1 volume of isopropanol, washed two times and solubilized in 5 mM Tris-HCl pH 8. Methyl-seq libraries were prepared using the NEBnext Enzymatic Methyl-seq kit (NEB) according to the manufacturer’s instructions and sequenced by Illumina NextSeq and HiSeq sequencing in 150 bp paired-end read mode. Whole genome bisulfite sequencing (WGBS) datasets of adult Mili-/- spermatocytes 4 and P10 Dnmt3c+/- , Dnmt3c-/- , Dnmt3l+/- , Dnmt3l-/- germ cells 12 were obtained from public repositories (accession numbers SRP037785 and GSE84140, respectively).
Raw sequence reads were trimmed to remove both poor-quality calls and adapters using Trim Galore (v0.4.1, www.bioinformatics.babraham.ac.uk/projects/trim_galore/, Cutadapt 61 version 1.8.1, parameters: --paired --length 25 --trim-n --clip_R2 5). Trimmed reads were aligned to the mouse genome in paired-end mode to be able to use overlapping parts of the reads only once. Alignments were carried out with Bismark v0.22.1 64 with the following set of parameters: bismark --score_min L,0,-0.4 --paired. CpG methylation calls were extracted from the deduplicated mapping output using the Bismark methylation extractor (v0.22.1). The mapping statistics were calculated using the SeqMonk (www.bioinformatics.babraham.ac.uk/projects/seqmonk/) datastore summary report of aligned deduplicated bam files. The methylation conversion rate was calculated by mapping all reads to the spiked-in CpG unmethylated lambda and CpG methylated pUC19 DNA using the Bismark pipeline as outlined above (Supplementary Table 7).
50 adjacent CpG running window probes were generated for probes containing at least 10 reads and mean percentage methylation of the 3 replicates was calculated for each probe. For analysis of specific genome features these were defined as follows: Genic regions were defined as probes overlapping genes and promoter as probes overlapping 2000 bp upstream of annotated transcripts, as annotated by Ensembl (GRCm38.p6). CpG islands (CGIs) probes overlapping the Ensembl (GRCm38.p6) CGI annotation. For genic, promoters and CGIs genome features reads overlapping transposons were filtered out. For transposons, UCSC repeat masker annotations were downloaded from the table browser (https://genome.ucsc.edu/cgi-bin/hgTables, 02/2019). The transposon annotation, which includes retro- and DNA transposons, was sorted to exclude simple repeats as well as any small non-coding RNA annotations. Analysis of TEs in our data was performed by unique mapping in the genome and excluding any repeats overlapping gene bodies. Transposon families were assessed by mapping only to full length elements defined as > 5 kb for LINE1 elements, > 6 kb for IAP families and > 4.5 kb for MMERVK10C. Intergenic regions were defined as regions non-overlapping genes or transposons. The methylation level was expressed as the mean percentage of individual CG sites. The metaplots, scatterplots and correlation analysis were performed by extracting the reads overlapping the respective genomic regions from SeqMonk and plotting in RStudio. The methylation difference analysis was performed using the divergence (milliDiv) from the consensus sequences. We extracted the imprinted control regions (ICR) from (https://atlas.genetics.kcl.ac.uk/). For CpG methylation of the Rasgrf1 imprinted region we quantified individual CpGs with a minimum of 1 read mapping. Graphing and statistics were performed using SeqMonk and RStudio.
Small RNA sequencing (sRNA-seq) and analysis
For each replicate, 6 foetal testes were pooled and RNA was isolated using the QIAzol reagent following the manufacturer’s instructions. Total RNA was size selected for 15–40 nucleotides (nt) using a 15 % TBE-Urea gel (Invitrogen) and a small RNA marker (Abnova) with 2x Gel loading Buffer II (Ambion). RNA was purified from the gel by addition of nuclease-free water and two successive 1 hour incubation steps at 37 °C, 1000 rpm with a freeze/thaw step in between. Samples were then transferred onto spin columns (Corning) plugged with filter paper (Whatman) and centrifuged at max speed for 1 min. RNA was precipitated overnight at -20 °C in 2.5 volumes ethanol 100 % and 1 μl GlycoBlue (Life Technologies), washed with 80 % ethanol and dissolved in 10 μl nuclease-free water. For generation of the library the NEBnext Multiplex Small RNA Library Prep Set for Illumina (NEB) was used following the manufacturer’s instructions with 4 μl size-selected RNA per reaction, adaptors diluted 1:2 and 16 cycles of PCR amplification. Concentration was measured with the Qubit high sensitivity dsDNA kit on a Qubit fluorometer (Life Technologies) and quality of the library was checked using a HSD1000 tape on a Tapestation 2200 instrument (Agilent). 4 ng of each sample were used for the final library pool and sequenced on a HiSeq2500 sequencer (Illumina) in 50 bases single-end read mode.
Adapter sequences were removed from 3’ end of the raw fastq file using cutadapt 61 with default settings. Annotation of processed reads of 18–32 nt for each sample were retrieved as described 65 using bowtie 1.2.1.1 66 . Up to 3 mismatches were allowed when reads were mapped to genomic TE sequences retrieved from RepeatMasker(mm10, October 2015). Mapped piRNA reads (25–30 nt) were categorized according to annotations with reads not mapping to any recorded genomic element included in ‘other’. To compare expression of individual piRNAs, only mapped reads of 25–30 nt with more than 10 counts were considered and visualised as scatter plot. The piRNA amplification analysis and mapping of LINE1 and IAP was performed as described 17 . The consensus sequence of L1MdTfI, L1MdGfI, IAPEYI and IAPEZI were retrieved from Repbase 62 .
Cell culture, transfection and IP-Western blot
HEK 293T cells (sourced from the O’Carroll laboratory stock, University of Edinburgh; not additionally authenticated and regularly tested for mycoplasma contamination) were cultured at 37 °C, 5 % CO2 in Glasgow minimum essential medium (Sigma Aldrich) supplemented with 10 % foetal calf serum (Gibco), 2 mM L-glutamine and 1 mM Na-pyruvate (Invitrogen). For transfection 4*105 cells were seeded per well on a 6-well plate on day 0 followed by transfection of 1 μg of each plasmid (pcDNA3.1-DNMT3A-FLAG: GenScript clone ID OMu22132D; pcDNA3.1-DNMT3L-FLAG: GenScript clone ID OMu18257D; pcDNA3.1-DNMT3C-FLAG: encoding the long isoform as defined by Barau et al. 2016 12 , synthesised by GenScript; pcDNA3.1-SPOCD1-HA: encoding XP_017175994.1, synthesised by GenScript) by Jetprime transfection (Polyplus) according to the manufacturer’s instructions on day 1. 65 hours later cells were washed twice with ice-cold PBS, scrapped of the plate in 1 ml lysis buffer (IP buffer: 150 mM KCl, 2.5 mM MgCl2, 0.5 % Triton X-100, 50 mM Tris pH 8, supplemented with 1x protease inhibitors (cOmplete ULTRA EDTA-free, Roche) and 37 U/ml Benzonase (Millipore)) and lysed for 30 minutes at 4 °C on a rotating wheel. Lysates were cleared for 5 minutes at 21,000 g and 400 μl each was incubated for 2 hours at 4 °C with 20 μl of anti-HA beads (Pierce) and 20 μl control Protein G Dynabeads (Life Technologies), which had been washed twice in PBS, 0.5 % Triton X-100 and resuspended in 500 μl lysis buffer. Immuno-precipitates were eluted for 10 minutes at 50 °C in 35 μl 0.1 % SDS (sodium dodecyl sulfate), 50 mM Tris pH 8. Lysates and eluates were separated on a 4-12 % bis-tris acrylamide gel (Invitrogen) and blotted onto nitrocellulose membrane (Amersham Protran 0.45 NC) according to standard laboratory procedures. The membrane was stained for protein with 0.1 % (w/v) Ponceau S in 5 % (v/v) acetic acid solution for 5 minutes, blocked with blocking buffer (4 % (w/v) skimmed milk powder (Sigma-Aldrich) in TBS-T (tris buffered saline, 0.1 % Tween-20)), incubated with primary antibodies for 1 hour (anti-HA (6E2, Cell Signaling Technologies) 1:1000; anti-FLAG (M2, Sigma-Aldrich) 1:1000) in blocking buffer, washed 4 times for 5 minutes in TBS-T, incubated with secondary antibodies (IRDye 680RD donkey anti-rabbit & IRDye 800CW donkey anti-mouse, LI-COR, 1:10,000) in Immobilon® Block – PO blocking solution (Millipore), washed 4 times for 5 minutes in TBS-T and imaged on a LI-COR Odyssey Fc system. Exposure of the entire images was adjusted in Image Studio Lite (LI-COR) and regions of interest cropped for presentation.
Statistical information
Statistical testing was performed with R(3.3.1) using the R Studio software and with Perseus for the mass-spectrometry data. Unpaired, two-tailed Student’s t-tests were used to compare differences between groups and adjusted for multiple testing using Bonferroni correction where indicated, except for RNA-seq data analysis where Wald’s tests and Benjamini-Hochberg correction were used. Averaged data are presented as mean ± s.e.m. (standard error of the mean), unless otherwise indicated. No statistical methods were used to predetermine sample size. The experiments were not randomized and the investigators were not blinded to allocation during experiments and outcome assessment.
Extended Data
Extended Data Figure 1. Expression pattern and presence of nuclear localization signals for novel MIWI2 interactors.
a, b, Relative expression of indicated transcripts as measured by Affymetrix microarray in E16.5 gonocytes (n=2), adult spermatogonia (n=3), spermatocytes (n=3), MEFs (n=3) and bone marrow (n=2). Data are mean and s.e.m. NLS indicates presence of a nuclear localization signal as predicted by cNLS mapper.
Extended Data Figure 2. Homology alignment of SPOCD1 SPOC and TFIIS-M domains.
a, Multiple sequence alignment of the SPOC domain from SPOCD1 with representative vertebrate sequences from PHF3, DIDO1 and SPEN orthologues. The numbering for mouse SPOCD1 is shown above. Secondary structure elements for the human SHARP SPOC domain (PDBid 1OW1, SHARP is the human SPEN orthologue) are shown below the sequence, with dark rectangles for alpha helices and lighter arrows for beta strands. b, Multiple sequence alignment of TFIIS-M domain of SPOCD1 with equivalent sequences from TFIIS, PHF3 and DIDO1. Secondary structure elements from human PHF3 (PDBid 2DME) and human TFIIS (PDBid 3NDQ) are shown below, using the same annotation as in (a). Sequences are coloured according to sequence identity.
Extended Data Figure 3. Phylogeny of SPOCD1.
Bayesian phylogeny of Spocd1 (blue) and its vertebrate paralogs Phf3 (red) and Dido1 (green) inferred from cDNA sequences. Posterior probabilities of splits are shown as node labels. Branch lengths measure the expected substitutions per site as indicated in the scale bar.
Extended Data Figure 4. Generation and characterisation of the Spocd1null mouse allele.
a, Schematic representation of the Spocd1 locus and the encoded 1015 amino acids (aa) protein (transcript XM_017320505.1) as well as design of the sgRNA targeting Spocd1 exon 7, which harbours part of the TFIIS-M domain. b, Schematic representation and sequencing trace (lower) of the part of Spocd1null exon 7 harbouring the mutation site. The mutated site, highlighted in red, contains 2 premature stop codons and causes a frame-shift. Sequencing was repeated with identical results on n=3 animals. c, Representative image of genotyping results for Spocd1+/+ , Spocd1+/- and Spocd1-/- animals. Similar results were obtained for all animals of the Spocd1- line. d, Number of E16.5 embryos per plug from matings of mice with the indicated Spocd1 genotypes are presented. Mean and s.e.m. from n=7 Spocd1+/+ dams mated to n=3 Spocd1+/+ studs and n=12 Spocd1-/- dams mated to n=5 Spocd1+/- studs is plotted. NS, non-significant difference (P~0.98), two-tailed Student’s t-test. e, Representative PAS and haematoxylin stained histological testis sections of different stages of the seminiferous cycle are shown of (n=3) Spocd1+/+ and Spocd1-/- animals, indicating a germ cell differentiation arrest at the early pachytene stage. Scale bar, 5 μm. eP, early pachytene; RS, round spermatids, eS(13) elongating spermatids (step 13); PL, pre-leptotene; P, pachytene; L, leptotene; Z, zygotene; m2, secondary meiocytes. f, Representative images of zygotene spermatocytes in wildtype and Spocd1-/- adult testis sections stained for the synaptonemal complex proteins SCP1 (red) and SCP3 (green). DNA stained with DAPI (blue). Scale bar, 1 μm. The representative images presented in panels e and f are from n=3 mice per genotype. g, h Analysis of TE expression in P20 testes from n=3 wildtype, Spocd1-/- and Miwi2-/- mice by RNA-seq. g, Comparison of TE expression in Miwi2-/- and wildtype testes is shown. TEs with a significantly different (P<0.01, Benjamini-Hochberg adjusted two-sided Wald’s test) change in expression (>2-fold) are highlighted in red and the top 12 most up-regulated TEs in Miwi2-/- testes are labelled. h, Comparison of TE expression in Spocd1-/- and wildtype testes is shown. TEs with a significantly different (P<0.01, Benjamini-Hochberg adjusted two-sided Wald’s test) change in expression (>2-fold) are highlighted in red and same TEs as in (a) are labelled. i, Comparison of TE expression in Spocd1-/- and Miwi2-/- testes is shown. TEs with a significantly different (P<0.01, Benjamini-Hochberg adjusted two-sided Wald’s test) change in expression (>2-fold) are highlighted in red. TEs which are significantly up-regulated in Miwi2-/- relative to wildtype are highlighted in black.
Extended Data Figure 5. CpG Methylation analysis of different genomic features and TE families.
Analysis of genomic CpG methylation of undifferentiated P14 spermatogonia from (n=3) wildtype, Spocd1 -/- and Miwi2 -/- mice is presented. a, b, Scatter plots comparing CpG methylation levels for the respective genomic features between wildtype and Spocd1-/- or Miwi2-/- (a) and between Spocd1-/- or Miwi2-/- spermatogonia (b) are shown. c, d, Scatter plots comparing CpG methylation levels for the respective TE families between wildtype and Spocd1-/- or Miwi2-/- (c) and between Spocd1-/- or Miwi2-/- spermatogonia (d) are shown. Data is mean from n=3 biological replicates per genotype and shown as individual data points (grey) overlayed by a density map.
Extended Data Figure 6. Methylation analysis of TE families.
Analysis of genomic CpG methylation of undifferentiated P14 spermatogonia from (n=3) wildtype, Spocd1 -/- and Miwi2 -/- mice is presented. a, Metaplots of CpG methylation over L1Md_A, IAPEy and MMERVK10C elements and adjacent 2 kb are shown. Schematic representation of the element is shown below. b, Metaplots of mean CpG methylation over LINE1 elements and adjacent 1 kb are shown. The Methyl-seq datasets of P14 wildtype, Miwi2-/- and Spocd1-/- spermatogonia are compared to WGBS datasets of adult Mili-/- spermatocytes (Molaro et al. 2014 4 ) and P10 Dnmt3c+/-, Dnmt3c-/-, Dnmt3l+/-, Dnmt3l-/- germ cells (Barau et al. 2016 12 ). Schematic representation of LINE1 is shown below. c, Correlation analysis of mean CpG methylation loss relative to wildtype over individual elements of the indicated TE family in relation to their divergence from the consensus sequence is shown for Miwi2-/- and Spocd1-/- spermatogonia.
Extended Data Figure 7. piRNA analysis.
piRNA analyses of small RNAs sequenced from E16.5 testis from (n=3) Spocd1+/- and Spocd1-/- mice are presented. a, Relative frequency of piRNAs mapping to LINE1 and IAP families from Spocd1+/- and Spocd1-/- E16.5 testes. Plots are shown for all piRNA or anti-sense piRNAs. Data are mean and s.e.m. Adjusted P-values are listed, P=1.0 values are denoted as NS (Bonferroni adjusted two-sided Student’s t-test). b, Scatter plots showing mean expression of all (n=124411) piRNAs. The identity line is shown in red. r, Pearson’s correlation coefficient. c, Nucleotide features of piRNA from Spocd1+/- and Spocd1-/- E16.5 testes. Frequency of mapped piRNAs with a U at position 1 (1U) and with an A at position 10 (10A) are shown for L1Md_T elements. Data represent the mean and s.e.m. Adjusted P-values are shown (Bonferroni adjusted two-sided Student’s t-test) d, Ping-pong analysis of piRNAs from Spocd1+/- and Spocd1-/- E16.5 testis. Relative frequencies of the distances between 5’ ends of complementary piRNAs are shown for the indicated LINE1 and IAP families. e, Nucleotide features of piRNA from Spocd1+/- and Spocd1-/- E16.5 testis. Relative frequencies of piRNAs with a U at position 1 (1U) and with an A at position 10 (10A) are shown for respective elements shown in (d). Data are mean and s.e.m. Adjusted P-values are listed, P=1.0 values denoted as NS (Bonferroni adjusted two-sided Student’s t-test) f, Positions of piRNAs mapped to the consensus sequence of L1Md_T. Positive and negative values indicate sense and antisense piRNAs, respectively. Schematic representation of L1Md_T is shown above.
Extended Data Figure 8. TE and gene expression in Spocd1-/- gonocytes.
Analysis of TE and gene expression in E16.5 Spocd1+/- and Spocd1-/- gonocytes by RNA-seq from n=3 mice per genotype. a, Comparison of TE expression in Spocd1+/- and Spocd1-/- gonocytes is shown. TEs up-regulated in Miwi2-/- testes at P20 are highlighted in black. b, Comparison of gene expression in Spocd1+/- and Spocd1-/- gonocytes is shown. Significantly expressed genes (P<0.01, Benjamini-Hochberg adjusted two-sided Wald’s test, >2-fold change) are highlighted in red.
Extended Data Figure 9. Generation of the Spocd1HA mouse allele.
a, Schematic representation of the SPOCD1 protein and Spocd1 locus as well as design of the sgRNA targeting the 3’ UTR near the translation termination site on Spocd1 exon 15. The Spocd1HA allele encodes for a carboxy-terminal GGGGS linker followed by the HA epitope tag. The protospacer adjacent motif (PAM) site was mutated to inhibit re-targeting of the Spocd1HA allele by the sgRNA-CAS9 complex. All inserted nucleotides and corresponding encoded amino acids are highlighted in red. The SPOCD1-HA protein is shown as a schematic representation. b, Schematic representation of the targeting strategy to generate the Spocd1HA allele with a short single stranded DNA oligo donor (ssODN) of 200 nucleotides containing 5’ and 3’ homology arms (5’HA and 3’HA) of 72 nucleotides. c, Representative image of genotyping results for Spocd1+/+ , Spocd1HA/+ and Spocd1HA/HA animals. Similar results were obtained for all animals of the Spocd1HA line. d, Sequencing trace of part of a PCR amplicon of the HA epitope tag insertion site from a Spocd1HA/HA animal. The experiment was repeated with identical results on n=2 animals. e, f, g, Representative images of wildtype (e), Spocd1HA/+ (f) and Miwi2HA/+ (g) testis sections at the indicated developmental time point probed with anti-HA antibody in green. DNA stained with DAPI in blue. Scale bars, 10 μm. The representative images presented in panels e to g are from experiments done n=3 mice as biological replicates with similar results.
Extended Data Figure 10. Co-immunoprecipitation experiments of SPOCD1 and DNMT3A/L/C in HEK cells.
Western blot analysis of co-immunoprecipitation of SPOCD1-HA with DNMT3L-FLAG, DNMT3A-FLAG, DNMT3C-FLAG or GFP in HEK cells. Shown are lysate sample (L), control IP (protein G beads) (B) and anti-HA IP (IP) for 4 experiments. For uncropped source data, see Supplementary Figure 1.
Supplementary Material
Supplementary Information is linked to the online version of the paper at www.nature.com/nature.
Acknowledgements
This research was supported by the Welcome Trust funding to DOC (106144), R.B. (213612), JR (103139), RCA (095021, 200885), the Wellcome Centre for Cell Biology (203149) and a multi-user equipment grant (108504). DOC’s laboratory is also supported by the European Union H2020 program grant GermAge. A.Z. was funded by a German Research Foundation fellowship (DFG, award ZO 376/1-1). We acknowledge the EMBL GeneCore facility in Heidelberg, Germany for preparing the microarray dataset, RNA-seq dataset of E16.5 gonocytes and sequencing all next-generation sequencing libraries and namely Ferris Jung at GeneCore for preparation of the Methyl-seq libraries.
Footnotes
Author contributions
A.Z. contributed to the design, execution and analysis of most experiments. T.A. helped established the IP conditions and performed the mass-spectrometry analysis under the guidance of J.R. and R.C.A. R.B. and Y.K. performed the bioinformatic analysis of the Methyl-seq data or sRNA-seq as well as RNA-seq data, respectively. T.S. prepared the sRNA-seq libraries and together with Y.K. the RNA-seq libraries of P20 testes. M.H and A.C. performed the homology alignment of the SPOC and TFIIS-M domains. L.V. performed the IF staining of HA-MIWI2 and generated the gonocytes microarray dataset. Y.R.P. performed the phylogenetic analysis under guidance of A.S. D.O’C. conceived and supervised this study. D.O’C. and A.Z wrote the final version of the manuscript.
Author information
Reprints and permissions information is available at www.nature.com/reprints.
The authors declare no competing financial interests.
Data availability
All mRNA expression data that support the findings of this study have been deposited at Array Express under accession numbers E-MTAB-7985. The Methyl-seq data generated in this study have been deposited at ArrayExpress under the accession number E-MTAB-7997. The sRNA-seq and RNA-seq data generated in this study have been deposited at Gene Expression Omnibus under the accession number GSE131377. Data for the IP-MS experiments were deposited at ProteomeXchange under the accession number PXD016701.
Code availability
Scripts used for the Methyl-seq, RNA-seq and sRNA-seq analysis are available on github (https://github.com/rberrens/SPOCD1-piRNA_directed_DNA_met).
References
- 1.Tang WW, Kobayashi T, Irie N, Dietmann S, Surani MA. Specification and epigenetic programming of the human germ line. Nat Rev Genet. 2016;17:585–600. doi: 10.1038/nrg.2016.88. [DOI] [PubMed] [Google Scholar]
- 2.Aravin AA, Sachidanandam R, Girard A, Fejes-Toth K, Hannon GJ. Developmentally regulated piRNA clusters implicate MILI in transposon control. Science. 2007;316:744–747. doi: 10.1126/science.1142612. [DOI] [PubMed] [Google Scholar]
- 3.Carmell MA, et al. MIWI2 is essential for spermatogenesis and repression of transposons in the mouse male germline. Dev Cell. 2007;12:503–514. doi: 10.1016/j.devcel.2007.03.001. [DOI] [PubMed] [Google Scholar]
- 4.Molaro A, et al. Two waves of de novo methylation during mouse germ cell development. Genes Dev. 2014;28:1544–1549. doi: 10.1101/gad.244350.114. [DOI] [PMC free article] [PubMed] [Google Scholar]
- 5.Kuramochi-Miyagawa S, et al. DNA methylation of retrotransposon genes is regulated by Piwi family members MILI and MIWI2 in murine fetal testes. Genes Dev. 2008;22:908–917. doi: 10.1101/gad.1640708. [DOI] [PMC free article] [PubMed] [Google Scholar]
- 6.Walsh CP, Chaillet JR, Bestor TH. Transcription of IAP endogenous retroviruses is constrained by cytosine methylation. Nat Genet. 1998;20:116–117. doi: 10.1038/2413. [DOI] [PubMed] [Google Scholar]
- 7.Ohinata Y, et al. Blimp1 is a critical determinant of the germ cell lineage in mice. Nature. 2005;436:207–213. doi: 10.1038/nature03813. [DOI] [PubMed] [Google Scholar]
- 8.Chedin F, Lieber MR, Hsieh CL. The DNA methyltransferase-like protein DNMT3L stimulates de novo methylation by Dnmt3a. Proc Natl Acad Sci U S A. 2002;99:16916–16921. doi: 10.1073/pnas.262443999. [DOI] [PMC free article] [PubMed] [Google Scholar]
- 9.Bourc’his D, Bestor TH. Meiotic catastrophe and retrotransposon reactivation in male germ cells lacking Dnmt3L. Nature. 2004;431:96–99. doi: 10.1038/nature02886. [DOI] [PubMed] [Google Scholar]
- 10.Suetake I, Shinozaki F, Miyagawa J, Takeshima H, Tajima S. DNMT3L stimulates the DNA methylation activity of Dnmt3a and Dnmt3b through a direct interaction. J Biol Chem. 2004;279:27816–27823. doi: 10.1074/jbc.M400181200. [DOI] [PubMed] [Google Scholar]
- 11.Webster KE, et al. Meiotic and epigenetic defects in Dnmt3L-knockout mouse spermatogenesis. Proc Natl Acad Sci U S A. 2005;102:4068–4073. doi: 10.1073/pnas.0500702102. [DOI] [PMC free article] [PubMed] [Google Scholar]
- 12.Barau J, et al. The DNA methyltransferase DNMT3C protects male germ cells from transposon activity. Science. 2016;354:909–912. doi: 10.1126/science.aah5143. [DOI] [PubMed] [Google Scholar]
- 13.Jain D, et al. rahu is a mutant allele of Dnmt3c, encoding a DNA methyltransferase homolog required for meiosis and transposon repression in the mouse male germline. PLoS Genet. 2017;13:e1006964. doi: 10.1371/journal.pgen.1006964. [DOI] [PMC free article] [PubMed] [Google Scholar]
- 14.Kaneda M, et al. Essential role for de novo DNA methyltransferase Dnmt3a in paternal and maternal imprinting. Nature. 2004;429:900–903. doi: 10.1038/nature02633. [DOI] [PubMed] [Google Scholar]
- 15.Kato Y, et al. Role of the Dnmt3 family in de novo methylation of imprinted and repetitive sequences during male germ cell development in the mouse. Hum Mol Genet. 2007;16:2272–2280. doi: 10.1093/hmg/ddm179. [DOI] [PubMed] [Google Scholar]
- 16.Ozata DM, Gainetdinov I, Zoch A, O’Carroll D, Zamore PD. PIWI-interacting RNAs: small RNAs with big functions. Nat Rev Genet. 2019;20:89–108. doi: 10.1038/s41576-018-0073-3. [DOI] [PubMed] [Google Scholar]
- 17.De Fazio S, et al. The endonuclease activity of Mili fuels piRNA amplification that silences LINE1 elements. Nature. 2011;480:259–263. doi: 10.1038/nature10547. [DOI] [PubMed] [Google Scholar]
- 18.Vasiliauskaitė L, et al. A MILI-independent piRNA biogenesis pathway empowers partial germline reprogramming. Nat Struct Mol Biol. 2017;24:604–606. doi: 10.1038/nsmb.3413. [DOI] [PMC free article] [PubMed] [Google Scholar]
- 19.Ariyoshi M, Schwabe JW. A conserved structural motif reveals the essential transcriptional repression function of Spen proteins and their role in developmental signaling. Genes Dev. 2003;17:1909–1920. doi: 10.1101/gad.266203. [DOI] [PMC free article] [PubMed] [Google Scholar]
- 20.Mikami S, et al. Structural insights into the recruitment of SMRT by the corepressor SHARP under phosphorylative regulation. Structure. 2014;22:35–46. doi: 10.1016/j.str.2013.10.007. [DOI] [PubMed] [Google Scholar]
- 21.Hata K, Kusumi M, Yokomine T, Li E, Sasaki H. Meiotic and epigenetic aberrations in Dnmt3L-deficient male germ cells. Mol Reprod Dev. 2006;73:116–122. doi: 10.1002/mrd.20387. [DOI] [PubMed] [Google Scholar]
- 22.Rogakou EP, Pilch DR, Orr AH, Ivanova VS, Bonner WM. DNA double-stranded breaks induce histone H2AX phosphorylation on serine 139. J Biol Chem. 1998;273:5858–5868. doi: 10.1074/jbc.273.10.5858. [DOI] [PubMed] [Google Scholar]
- 23.Manakov SA, et al. MIWI2 and MILI Have Differential Effects on piRNA Biogenesis and DNA Methylation. Cell Rep. 2015;12:1234–1243. doi: 10.1016/j.celrep.2015.07.036. [DOI] [PMC free article] [PubMed] [Google Scholar]
- 24.Watanabe T, et al. Role for piRNAs and noncoding RNA in de novo DNA methylation of the imprinted mouse Rasgrf1 locus. Science. 2011;332:848–852. doi: 10.1126/science.1203919. [DOI] [PMC free article] [PubMed] [Google Scholar]
- 25.Aravin AA, et al. A piRNA pathway primed by individual transposons is linked to de novo DNA methylation in mice. Mol Cell. 2008;31:785–799. doi: 10.1016/j.molcel.2008.09.003. [DOI] [PMC free article] [PubMed] [Google Scholar]
- 26.Kloet SL, et al. Towards elucidating the stability, dynamics and architecture of the nucleosome remodeling and deacetylase complex by using quantitative interaction proteomics. FEBS J. 2015;282:1774–1785. doi: 10.1111/febs.12972. [DOI] [PubMed] [Google Scholar]
- 27.Mashtalir N, et al. Modular Organization and Assembly of SWI/SNF Family Chromatin Remodeling Complexes. Cell. 2018;175:1272–1288.:e1220. doi: 10.1016/j.cell.2018.09.032. [DOI] [PMC free article] [PubMed] [Google Scholar]
- 28.Carrieri C, et al. A transit-amplifying population underpins the efficient regenerative capacity of the testis. J Exp Med. 2017;214:1631–1641. doi: 10.1084/jem.20161371. [DOI] [PMC free article] [PubMed] [Google Scholar]
- 29.Wang H, et al. One-step generation of mice carrying mutations in multiple genes by CRISPR/Cas-mediated genome engineering. Cell. 2013;153:910–918. doi: 10.1016/j.cell.2013.04.025. [DOI] [PMC free article] [PubMed] [Google Scholar]
- 30.Yang H, et al. One-step generation of mice carrying reporter and conditional alleles by CRISPR/Cas-mediated genome engineering. Cell. 2013;154:1370–1379. doi: 10.1016/j.cell.2013.08.022. [DOI] [PMC free article] [PubMed] [Google Scholar]
- 31.Wiśniewski JR, Zougman A, Nagaraj N, Mann M. Universal sample preparation method for proteome analysis. Nat Methods. 2009;6:359–362. doi: 10.1038/nmeth.1322. [DOI] [PubMed] [Google Scholar]
- 32.Rappsilber J, Ishihama Y, Mann M. Stop and go extraction tips for matrix-assisted laser desorption/ionization, nanoelectrospray, and LC/MS sample pretreatment in proteomics. Anal Chem. 2003;75:663–670. doi: 10.1021/ac026117i. [DOI] [PubMed] [Google Scholar]
- 33.Hein MY, et al. A human interactome in three quantitative dimensions organized by stoichiometries and abundances. Cell. 2015;163:712–723. doi: 10.1016/j.cell.2015.09.053. [DOI] [PubMed] [Google Scholar]
- 34.Richards AL, et al. One-hour proteome analysis in yeast. Nat Protoc. 2015;10:701–714. doi: 10.1038/nprot.2015.040. [DOI] [PMC free article] [PubMed] [Google Scholar]
- 35.Cox J, et al. Accurate proteome-wide label-free quantification by delayed normalization and maximal peptide ratio extraction, termed MaxLFQ. Mol Cell Proteomics. 2014;13:2513–2526. doi: 10.1074/mcp.M113.031591. [DOI] [PMC free article] [PubMed] [Google Scholar]
- 36.The UniProt Consortium. UniProt: the universal protein knowledgebase. Nucleic Acids Res. 2017;45:D158–D169. doi: 10.1093/nar/gkw1099. [DOI] [PMC free article] [PubMed] [Google Scholar]
- 37.Tyanova S, et al. The Perseus computational platform for comprehensive analysis of (prote)omics data. Nat Methods. 2016;13:731–740. doi: 10.1038/nmeth.3901. [DOI] [PubMed] [Google Scholar]
- 38.Hubner NC, Mann M. Extracting gene function from protein-protein interactions using Quantitative BAC InteraCtomics (QUBIC) Methods. 2011;53:453–459. doi: 10.1016/j.ymeth.2010.12.016. [DOI] [PubMed] [Google Scholar]
- 39.Kosugi S, Hasebe M, Tomita M, Yanagawa H. Systematic identification of cell cycle-dependent yeast nucleocytoplasmic shuttling proteins by prediction of composite motifs. Proc Natl Acad Sci U S A. 2009;106:10171–10176. doi: 10.1073/pnas.0900604106. [DOI] [PMC free article] [PubMed] [Google Scholar]
- 40.Morgan M, et al. mRNA 3’ uridylation and poly(A) tail length sculpt the mammalian maternal transcriptome. Nature. 2017;548:347–351. doi: 10.1038/nature23318. [DOI] [PMC free article] [PubMed] [Google Scholar]
- 41.Morgan M, et al. A programmed wave of uridylation-primed mRNA degradation is essential for meiotic progression and mammalian spermatogenesis. Cell Res. 2019;29:221–232. doi: 10.1038/s41422-018-0128-1. [DOI] [PMC free article] [PubMed] [Google Scholar]
- 42.Sievers F, et al. Fast, scalable generation of high-quality protein multiple sequence alignments using Clustal Omega. Mol Syst Biol. 2011;7:539. doi: 10.1038/msb.2011.75. [DOI] [PMC free article] [PubMed] [Google Scholar]
- 43.Kelley LA, Mezulis S, Yates CM, Wass MN, Sternberg MJ. The Phyre2 web portal for protein modeling, prediction and analysis. Nat Protoc. 2015;10:845–858. doi: 10.1038/nprot.2015.053. [DOI] [PMC free article] [PubMed] [Google Scholar]
- 44.Zhang Y, Rataj K, Simpson GG, Tong L. Crystal Structure of the SPOC Domain of the Arabidopsis Flowering Regulator FPA. PLoS One. 2016;11:e0160694. doi: 10.1371/journal.pone.0160694. [DOI] [PMC free article] [PubMed] [Google Scholar]
- 45.Waterhouse AM, Procter JB, Martin DM, Clamp M, Barton GJ. Jalview Version 2--a multiple sequence alignment editor and analysis workbench. Bioinformatics. 2009;25:1189–1191. doi: 10.1093/bioinformatics/btp033. [DOI] [PMC free article] [PubMed] [Google Scholar]
- 46.Altschul SF, et al. Gapped BLAST and PSI-BLAST: a new generation of protein database search programs. Nucleic Acids Res. 1997;25:3389–3402. doi: 10.1093/nar/25.17.3389. [DOI] [PMC free article] [PubMed] [Google Scholar]
- 47.Aken BL, et al. Ensembl 2017. Nucleic Acids Res. 2017;45:D635–D642. doi: 10.1093/nar/gkw1104. [DOI] [PMC free article] [PubMed] [Google Scholar]
- 48.Zerbino DR, et al. Ensembl 2018. Nucleic Acids Res. 2018;46:D754–D761. doi: 10.1093/nar/gkx1098. [DOI] [PMC free article] [PubMed] [Google Scholar]
- 49.Karolchik D, et al. The UCSC Table Browser data retrieval tool. Nucleic Acids Res. 2004;32:D493–496. doi: 10.1093/nar/gkh103. [DOI] [PMC free article] [PubMed] [Google Scholar]
- 50.Gramates LS, et al. FlyBase at 25: looking to the future. Nucleic Acids Res. 2017;45:D663–D671. doi: 10.1093/nar/gkw1016. [DOI] [PMC free article] [PubMed] [Google Scholar]
- 51.Wernersson R, Pedersen AG. RevTrans: Multiple alignment of coding DNA from aligned amino acid sequences. Nucleic Acids Res. 2003;31:3537–3539. doi: 10.1093/nar/gkg609. [DOI] [PMC free article] [PubMed] [Google Scholar]
- 52.Wernersson R. Virtual Ribosome--a comprehensive DNA translation tool with support for integration of sequence feature annotation. Nucleic Acids Res. 2006;34:W385–388. doi: 10.1093/nar/gk1252. [DOI] [PMC free article] [PubMed] [Google Scholar]
- 53.Goujon M, et al. A new bioinformatics analysis tools framework at EMBL-EBI. Nucleic Acids Res. 2010;38:W695–699. doi: 10.1093/nar/gkq313. [DOI] [PMC free article] [PubMed] [Google Scholar]
- 54.Ronquist F, Huelsenbeck JP. MrBayes 3: Bayesian phylogenetic inference under mixed models. Bioinformatics. 2003;19:1572–1574. doi: 10.1093/bioinformatics/btg180. [DOI] [PubMed] [Google Scholar]
- 55.Altekar G, Dwarkadas S, Huelsenbeck JP, Ronquist F. Parallel Metropolis coupled Markov chain Monte Carlo for Bayesian phylogenetic inference. Bioinformatics. 2004;20:407–415. doi: 10.1093/bioinformatics/btg427. [DOI] [PubMed] [Google Scholar]
- 56.Miller MA, Pfeiffer W, Schwartz T. Creating the CIPRES Science Gateway for inference of large phylogenetic trees; 2010 Gateway Computing Environments Workshop (GCE); 2010. [Google Scholar]
- 57.Di Giacomo M, Comazzetto S, Sampath SC, O’Carroll D. G9a co-suppresses LINE1 elements in spermatogonia. Epigenetics Chromatin. 2014;7:24. doi: 10.1186/1756-8935-7-24. [DOI] [PMC free article] [PubMed] [Google Scholar]
- 58.Kim D, Langmead B, Salzberg SL. HISAT: a fast spliced aligner with low memory requirements. Nat Methods. 2015;12:357–360. doi: 10.1038/nmeth.3317. [DOI] [PMC free article] [PubMed] [Google Scholar]
- 59.Anders S, Pyl PT, Huber W. HTSeq--a Python framework to work with high-throughput sequencing data. Bioinformatics. 2015;31:166–169. doi: 10.1093/bioinformatics/btu638. [DOI] [PMC free article] [PubMed] [Google Scholar]
- 60.Love MI, Huber W, Anders S. Moderated estimation of fold change and dispersion for RNA-seq data with DESeq2. Genome Biol. 2014;15:550. doi: 10.1186/s13059-014-0550-8. [DOI] [PMC free article] [PubMed] [Google Scholar]
- 61.Martin M. Cutadapt removes adapter sequences from high-throughput sequencing reads. 2011. 2011;17:3. doi: 10.14806/ej.17.1.200. [DOI] [Google Scholar]
- 62.Bao W, Kojima KK, Kohany O. Repbase Update, a database of repetitive elements in eukaryotic genomes. Mob DNA. 2015;6:11. doi: 10.1186/s13100-015-0041-9. [DOI] [PMC free article] [PubMed] [Google Scholar]
- 63.Langmead B, Salzberg SL. Fast gapped-read alignment with Bowtie 2. Nat Methods. 2012;9:357–359. doi: 10.1038/nmeth.1923. [DOI] [PMC free article] [PubMed] [Google Scholar]
- 64.Krueger F, Andrews SR. Bismark: a flexible aligner and methylation caller for Bisulfite-Seq applications. Bioinformatics. 2011;27:1571–1572. doi: 10.1093/bioinformatics/btr167. [DOI] [PMC free article] [PubMed] [Google Scholar]
- 65.Kabayama Y, et al. Roles of MIWI, MILI and PLD6 in small RNA regulation in mouse growing oocytes. Nucleic Acids Res. 2017;45:5387–5398. doi: 10.1093/nar/gkx027. [DOI] [PMC free article] [PubMed] [Google Scholar]
- 66.Langmead B, Trapnell C, Pop M, Salzberg SL. Ultrafast and memory-efficient alignment of short DNA sequences to the human genome. Genome Biol. 2009;10:R25. doi: 10.1186/gb-2009-10-3-r25. [DOI] [PMC free article] [PubMed] [Google Scholar]
Associated Data
This section collects any data citations, data availability statements, or supplementary materials included in this article.
Supplementary Materials
Supplementary Information is linked to the online version of the paper at www.nature.com/nature.
Data Availability Statement
All mRNA expression data that support the findings of this study have been deposited at Array Express under accession numbers E-MTAB-7985. The Methyl-seq data generated in this study have been deposited at ArrayExpress under the accession number E-MTAB-7997. The sRNA-seq and RNA-seq data generated in this study have been deposited at Gene Expression Omnibus under the accession number GSE131377. Data for the IP-MS experiments were deposited at ProteomeXchange under the accession number PXD016701.
Scripts used for the Methyl-seq, RNA-seq and sRNA-seq analysis are available on github (https://github.com/rberrens/SPOCD1-piRNA_directed_DNA_met).


