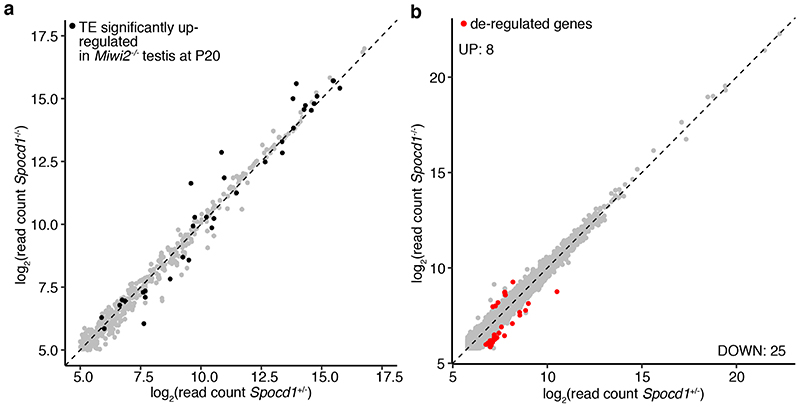
Extended Data Figure 8. TE and gene expression in Spocd1-/- gonocytes.
Analysis of TE and gene expression in E16.5 Spocd1+/- and Spocd1-/- gonocytes by RNA-seq from n=3 mice per genotype. a, Comparison of TE expression in Spocd1+/- and Spocd1-/- gonocytes is shown. TEs up-regulated in Miwi2-/- testes at P20 are highlighted in black. b, Comparison of gene expression in Spocd1+/- and Spocd1-/- gonocytes is shown. Significantly expressed genes (P<0.01, Benjamini-Hochberg adjusted two-sided Wald’s test, >2-fold change) are highlighted in red.

