Abstract
Vascular mural cells (vMC) play an essential role in the development and maturation of the vasculature by promoting vessel stabilization through their interactions with endothelial cells (EC). Whether endothelial metabolism influences mural cell recruitment and differentiation is unknown. Here, we show that the oxidative Pentose Phosphate Pathway (oxPPP) in EC is required for establishing vMC coverage of the dorsal aorta (DA) during early vertebrate development in zebrafish and mice. We demonstrate that laminar shear stress (LSS) and blood flow maintain oxPPP activity, which, in turn, promotes Elastin (Eln) expression in blood vessels through production of ribose-5-phosphate (R5P). Eln is both necessary and sufficient to drive vMC recruitment and maintenance when the oxPPP is active. In summary, our work demonstrates that endothelial cell metabolism regulates blood vessel maturation by controlling vascular matrix composition and vMC recruitment.
Introduction
The formation of new blood vessels is a crucial step during early development. Endothelial cells (EC) are the primary building blocks of blood vessels and can form vascular structures autonomously 1–3 . However, EC are unable to form functional vasculature, nor can they maintain organs homeostasis without the support of the vascular extracellular matrix (ECM) and vascular mural cells (vMC) 4,5 . The crosstalk between EC and vMC through ECM is vital in regulating angiogenesis and vascular maturation 6. Indeed, after the formation of the first vascular tube, EC steer a series of signaling events that lead to ECM deposition and vMC recruitment and differentiations. Such process, also known as vascular maturation, is essential for the normal development and homeostasis of blood vessels 2 . EC drive several signaling pathways and are responsible for vMC coverage and differentiation, including Notch, PDGF and TGFβ/Alk as the most significant 7–9 . Recent evidence illustrates an instrumental role of cellular metabolism in EC to regulate vessels sprouting and homeostasis during development and in adulthood 10,11 . Determine if and how EC metabolism influences ECM deposition, vMC recruitment, and differentiation remains unknown.
The Pentose Phosphate Pathway (PPP), also known as the pentose phosphate shunt, represents an alternate route for glucose oxidation. Although the major route for glucose oxidation in many tissues is via glycolysis, 10-20% of glucose can be catabolized in physiological conditions via the PPP. This metabolic pathway consists of an oxidative and a non-oxidative phase. The oxidative phase (also called oxidative PPP or oxPPP) consists of a series of two irreversible reactions that are catalyzed by G6PD and PGD, respectively 12 .
Results
Oxidative Pentose Phosphate Pathway (oxPPP) is required for vascular maturation in developing zebrafish embryos
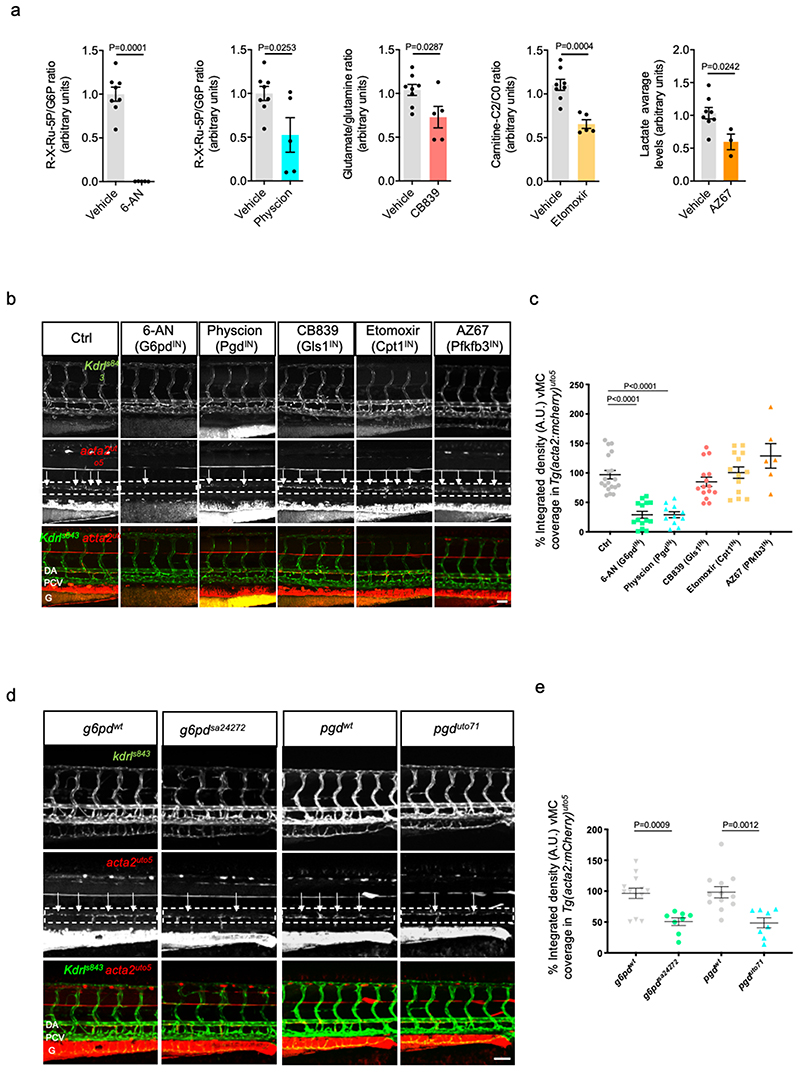
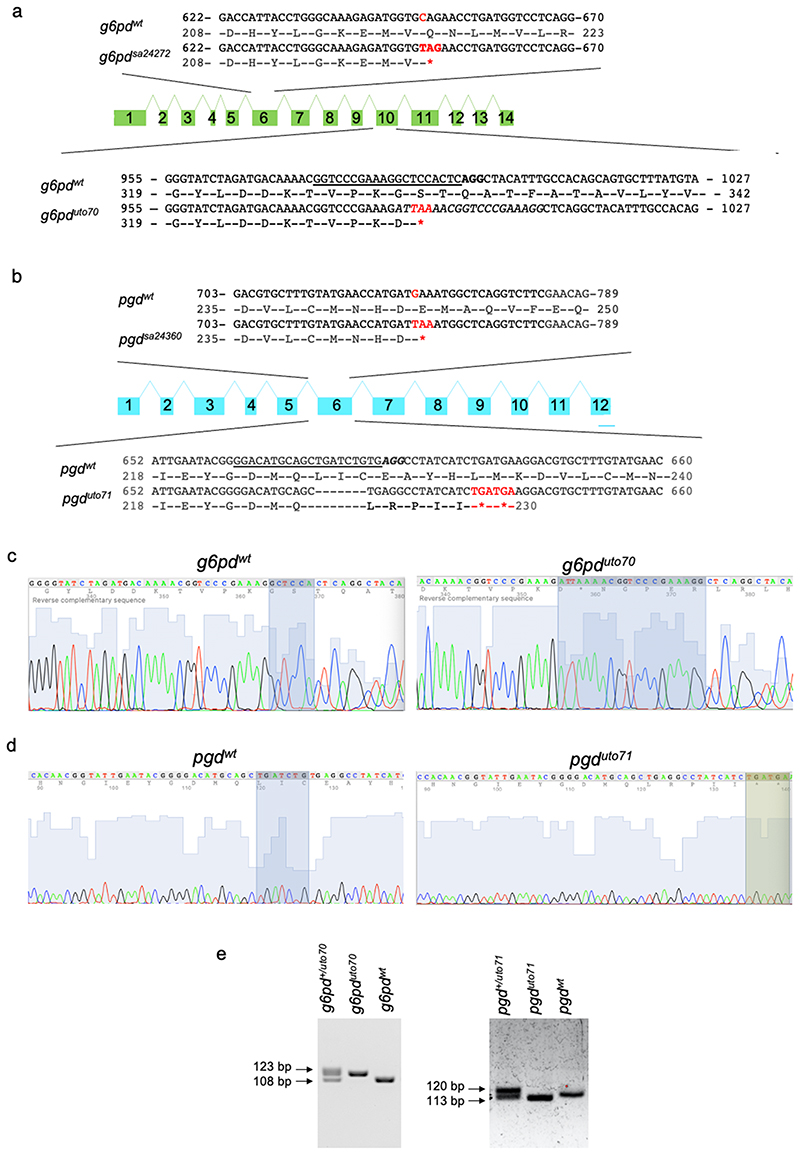
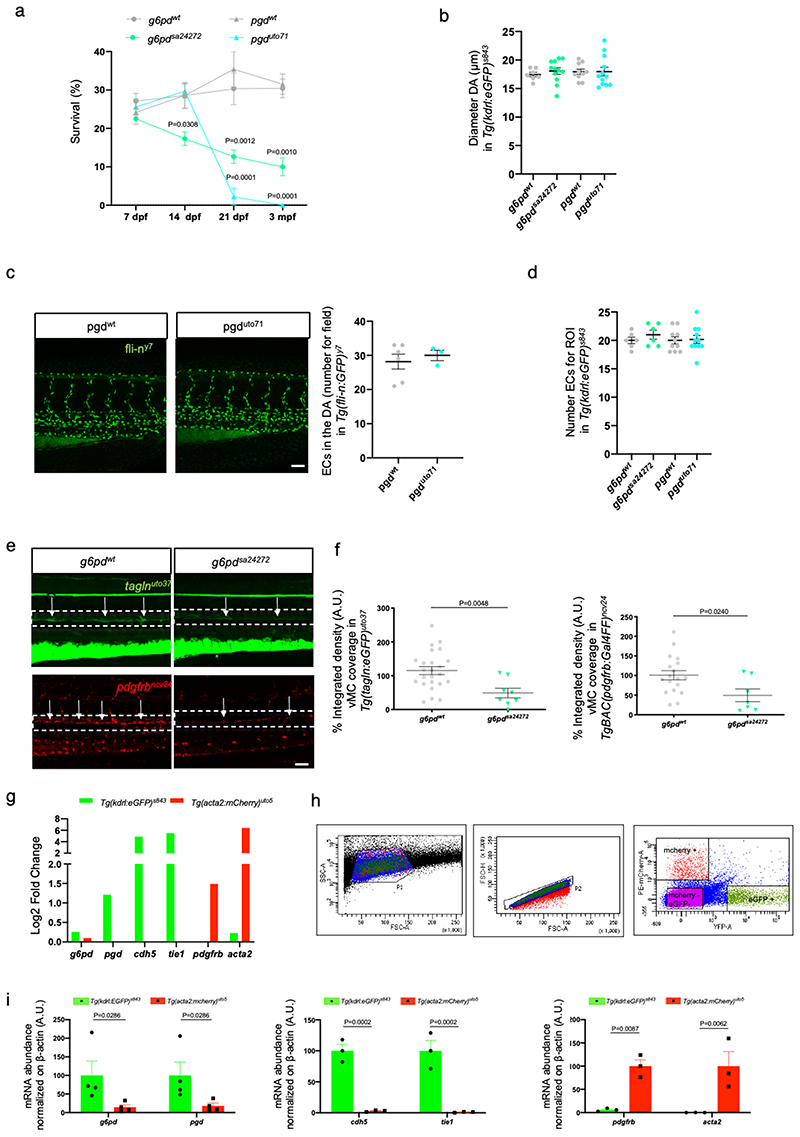
Vascular mural cells (vMC) are an essential component of the vascular system and control vascular maturation 13 . It has been shown that zebrafish vMC share many of the morphological, molecular, and functional characteristics of mammalian vMCs, making the zebrafish a useful model to study the mechanisms of vMC recruitment and differentiation 9,14–16 . To study the role of metabolism during vMC recruitment and differentiation, we performed a small-scale drug screening with proven selective inhibitors blocking critical metabolic pathways previously known to have a functional role in EC 10 . Developing zebrafish embryos represent an ideal vertebrate model to study metabolism and vascular homeostasis through the use of pharmacological inhibitors 17–19 . Tg(kdrl:eGFP)s843 ;(acta2:mCherry)uto5 zebrafish embryos 20 were treated with 6-AN (an inhibitor of G6PD and oxPPP) 21 , Physcion (an inhibitor of PGD and oxPPP) 22 , Etomoxir (an inhibitor of CPT1 and fatty acid oxidation) 23 , CB839 (an inhibitor of GLS1 and glutaminolysis) 24 and AZ67 (an inhibitor of PFKFB3 and glycolysis) 25 and validated for their specific metabolic inhibition in vivo (Fig. 1a). While most of these compounds have little or no impact on vascular development, patterning, and integrity, the embryos treated with two independent inhibitors of the oxidative phase of PPP showed a significant reduction of vMC coverage (arrows) around the dorsal aorta (DA) of the zebrafish embryos at 4dpf (days post-fertilization). We found that pharmacological blockade of both G6pd and Pgd in zebrafish embryos leads to 3-fold decrease of the DA coverage by vMC compared to control (Fig. 1b,c). To confirm the role of oxPPP during zebrafish vascular development we examined both g6pd and pgd mutant zebrafish embryos. We obtained nonsense mutant lines for g6pd and pgd through the Zebrafish Mutation Project (ZMP, Wellcome Trust Sanger Institute). These lines carry a premature stop codon in exon 6 for both g6pd (g6pdsa24272 ; Extended data Fig. 1a) and pgd (pgdsa24360 ; Extended data Fig. 1b). In addition, we also independently generated a CRISPR/Cas9 zebrafish null mutants of g6pd and pgd targeting exon 10 and 6, respectively (g6pduto70 and pgduto71 ; Extended data Fig. 1a,b). The presence of mutations in g6pd and pgd homozygous mutant embryos was confirmed by genotyping and sequencing (Extended data Fig. 1c-e). We then investigated the survival rate for g6pd and pgd null zebrafish mutants (Extended data Fig. 2a). G6pd zebrafish mutants began to die between 7 and 21dpf, but approximately 10% of them reached adulthood and showed body weight loss and slim morphology. Pgd zebrafish mutants all died between 14 and 21dpf without gross morphological defects. To confirm our pharmacological experiments, we crossed both mutant lines with the Tg (acta2:mCherry)uto5 line and analysed vMC coverage 20 . Indeed, both g6pd and pgd mutant embryos showed a significant reduction of vMC recruitment to the DA at 4dpf without any significant alteration in blood vessels morphology or DA diameter and number of EC (Fig. 1d,e and Extended Fig. 2b-d). We obtained the same results using different zebrafish transgenic lines such as Tg(tagln:eGFP)uto37 and Tg(pdgfbr:GAL4FF)ncv24(UAS:RFP) that expressed eGFP and RFP in vMC under the control of transgelin and pdgfrb, respectively (Extended data Fig. 2e,f) 19,26 . Overall, we concluded that oxPPP blockade impairs vMC coverage in developing zebrafish embryos.
Fig. 1. Oxidative Pentose Phosphate Pathway (oxPPP) regulates vascular maturation.
a, Validation of pharmacological treatments in zebrafish embryos by mass spectrometry. 6-aminonicotinamide (6-AN) and Physcion were used to inhibit PPP and the R-X-Ru-5P/G6P ratio was used to validate the inhibition of the metabolic pathway. Inhibition of glutaminase I by CB839 was validated by analyzing the ratio between glutamate and glutamine, which represent the substrate and the product of the enzymatic reaction, respectively. Acetylcarnitine (carnitine-C2)/free carnitine (C0) ratio was calculated to verify the activity of β-oxidation after etomoxir treatment, an inhibitor of Cpt1a. Finally, lactate levels were analyzed to validate the overall inhibition of glycolysis by AZ67. Vehicle (n=8), 6-AN, Physcion, CB839 and etomoxir (n=5) and AZ67 (n=3) treatment from 2 independent experiments. Data are shown as mean ± SEM. Statistics was performed by unpaired Student’s t test vs vehicle.
b, Confocal images of partial z-projection of the trunk region (somite 8-14) of a Tg(kdrl:eGFP)s843 ;Tg(acta2:mCherry)uto5 zebrafish embryos at 4dpf. Merged and single channels of embryos treated from 2dpf onward with DMSO (Ctrl), 6-AN (3mM), Physcion (50 μM), CB839 (7.5 μM), Etomoxir (5 μM) and AZ67 (20 μM) are shown. Arrows indicates vMC coverage. DA=dorsal aorta, PCV=posterior cardinal vein, G=gut. Scale bar, 50μm.
c, Scatter plots show the quantification of vMC coverage in the DA (dashed box area). Ctrl (n=19), 6-AN (n=14), Physcion (n=11), CB839 (n=15), Etomoxir (n=13), AZ67 (n=6) embryos from two independent experiments. Data are shown as mean ± SEM. Statistics were done using one-way ANOVA followed by Tukey’s multiple comparison test.
d, Confocal images of partial z-projection of the trunk region (somite 8-14) of a
Tg(kdrl:eGFP)s843 ;Tg(acta2:mCherry)uto5 embryos at 4dpf in g6pdsa24272 compared to control (g6pdwt ) and pgduto71 compared to control (pgdwt ). Arrows indicates vMC coverage. DA=dorsal aorta, PCV=posterior cardinal vein, G=gut. Scale bar, 100μm.
e, Scatter plots show the quantification of vMC coverage in the DA (dashed box area). g6pdwt (n=13), g6pdsa24272 (n=8), pgdwt (n=11), pgduto71 (n=8) zebrafish embryos from 2 independent experiments. Data are shown as mean ± SEM. Statistics were done using unpaired Student’s t-test.
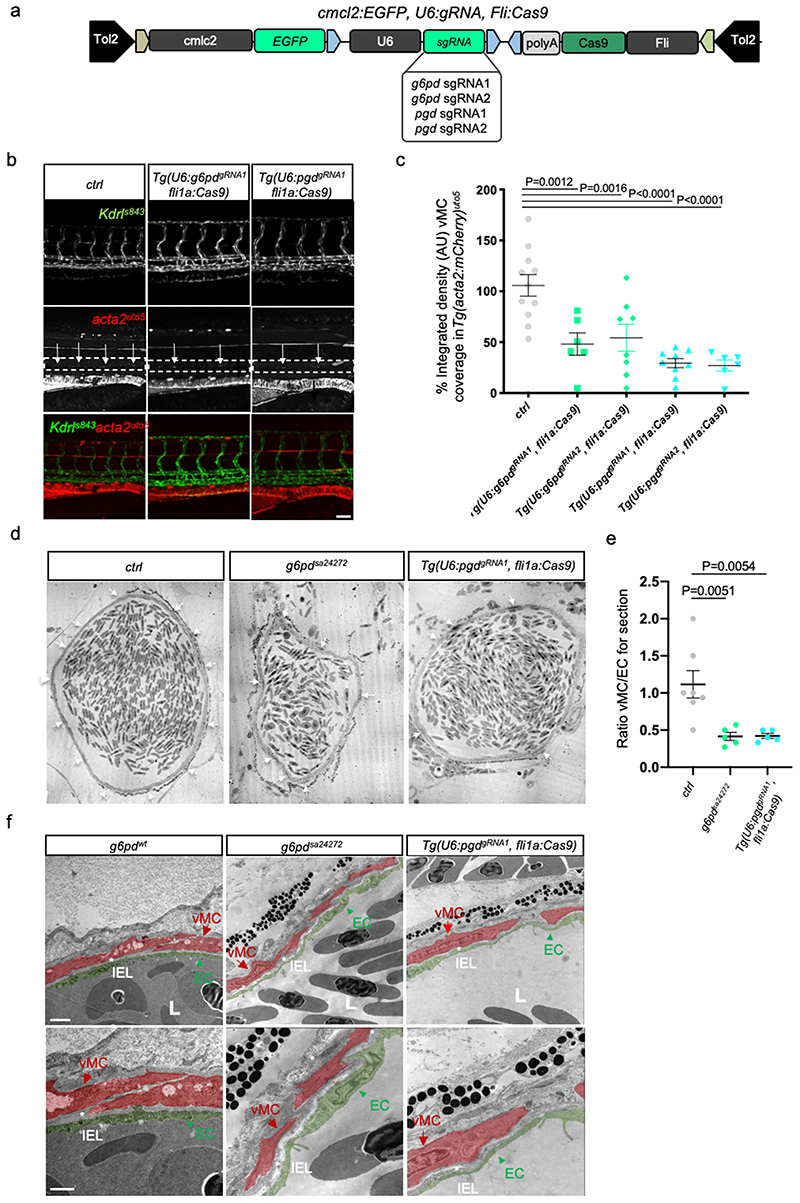
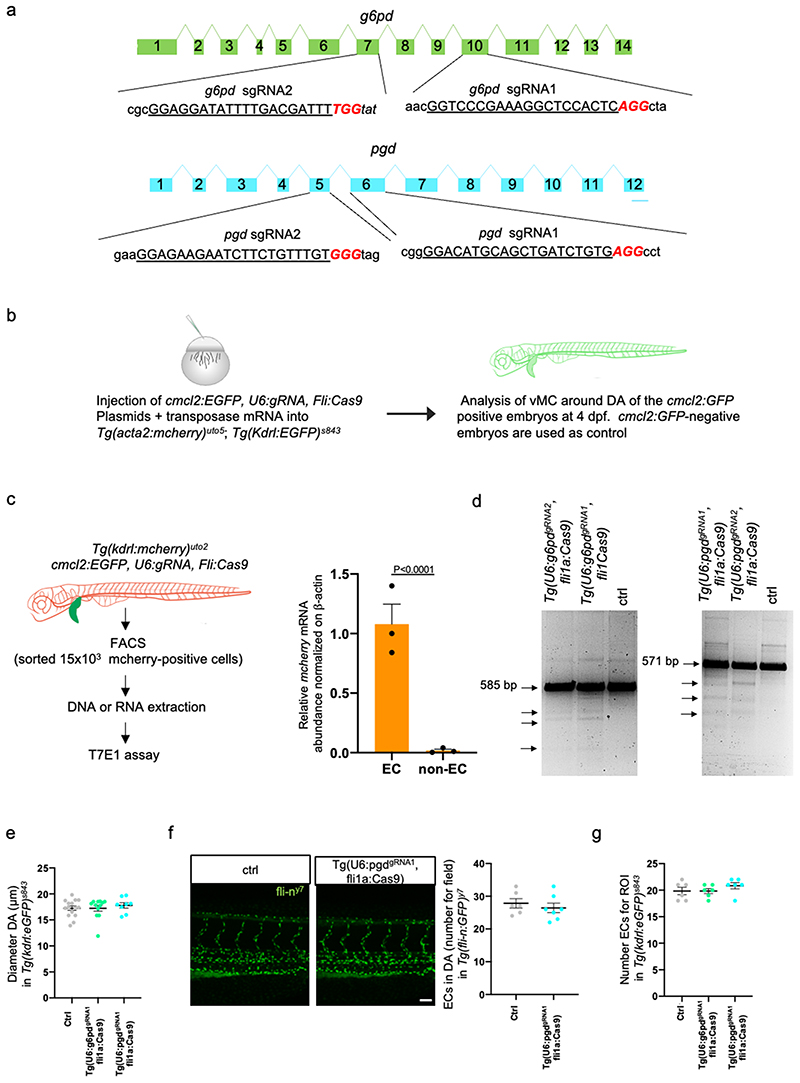
To understand the autonomous role G6pd and Pgd play in vascular tissues, we analyzed public available transcriptomics data comparing EC vs vMC in zebrafish 16 (Extended data Fig. 2g). Additionally, we sorted EC and vMC by FACS (Fluorescence-Activated Cell Sorting) from zebrafish embryos and analysed g6pd and pgd expression in these two distinct populations of cells (Extended data Fig. 2h,i). Sorting analyses indicated that g6pd and pgd are expressed almost exclusively in EC and not in vMC. Taking advantage of a CRISPR/Cas9 vector system for tissue-specific gene disruption in zebrafish 27 , we selectively inactivated g6pd and pgd in EC during zebrafish development (Fig. 2a and Extended data Fig. 2a-d). We found that zebrafish embryos carrying deletion of g6pd or pgd only in EC showed severe impairment in vMC coverage around the dorsal DA of zebrafish embryos (Fig. 2b,c). Such phenotype occurs in the context of regular embryo development and an overall normal blood vessels morphology with unaltered number of EC in the DA (Extended data Fig. 3e-g).
Figure 2. Endothelial oxPPP control vMC coverage of dorsal aorta (DA) in zebrafish.
a, Schematic representation of the plasmids used for injection for EC-specific CRISPR-based KO technology.
b, Images of partial z-projection of the trunk region (somite 8-14) of a Tg(kdrl:eGFP)s843 ;Tg(acta2:mCherry)uto5 zebrafish embryo after the injection with Tol2 mRNA and the following plasmids: U6:g6pdgRNA1; fli1a:Cas9 and U6:pgdgRNA1; fli1a:Cas9, respectively. Arrows in the dashed box area indicate vMC coverage. Scale bar, 100 μm.
c, Scatter plots show the quantification of vMC coverage in the DA (dashed box area) of embryos, using also the second gRNA for both g6pd and pgd (Extended Data Fig. 3a). Tg(U6:g6pddgRNA1; fli1a:Cas9) (n=11), Tg(U6:g6pddgRNA2; fli1a:Cas9) (n=6), Tg(U6:pgdgRNA1; fli1a:Cas9) (n=8), Tg(U6:pgdgRNA2; fli1a:Cas9) (n=6) embryos from 2 independent experiments. Data are shown as mean ± SEM. Statistical analysis was done by one-way ANOVA followed by Tukey’s multiple comparison test.
d, Representative transmission electron microscopy (TEM) images of transverse sections in g6pd full KO (g6pdsa24272 ) and EC-specific pgd KO Tg(U6:pgdgRNA1; fli1a:Cas9) zebrafish animals. Arrows indicate vMC coverage in DA. Scale bar, 10μm.
e, Scatter plots show the quantification of vMC/EC ratio in the DA in TEM images of transverse sections in ctrl, g6pd full KO (g6pdsa24272 ) and EC-specific pgd Tg(U6:pgdgRNA1; fli1a:Cas9). Control (n=7), g6pdsa2427 (n=5), Tg(U6:pgdgRNA1; fli1a:Cas9) (n=5) fish from 3 independent experiments. Data are shown as mean ± SEM. One-way ANOVA followed by Dunn’s multiple comparison test was applied for statistical analysis.
f, High-magnification TEM images of transverse section in g6pd full KO (g6pd sa24272) and EC-specific KO of pgd Tg(U6:pgdgRNA1, fli1a:Cas9) zebrafish animal show a vascular lumen (L) and the lining EC surrounded by tightly apposed vMC. Images show EC (arrowhead), vMC (arrow) and IEL organization in wt e mutant animals. EC and vMC are pseudo-colored in green and red, respectively. vMC=mural cells, EC=endothelial cells. IEL=internal elastic laminae. L= lumen. Images are representative of at least five independent experiments (n=5) with similar results. Scale bars, 1μm and 2 μm.
To better characterize the vMC coverage defects observed during oxPPP blockade in vivo, we examined DA of g6pdsa24272 zebrafish mutants by means of transmission electron microscopy (TEM) on ultra-thin cross-sections (Fig. 2d). TEM analyses showed a small number of vMC around the DA of g6pd zebrafish null mutants that lead to a low vMC/EC ratio compared to controls (Fig. 2e). Similar results were obtained using the Tg(U6:pgdgRNA1 , fli1a:Cas9) line with EC-specific inactivation of pgd. In addition, high magnification TEM images of DA of both mutant lines showed that control animals displayed a vascular wall composed of a layer of ECs lining the vascular lumen (L) and an internal elastic lamina (IEL) with a layer of mature and differentiated vMC (Fig. 2f). In mutant animals, none or few vMC were present and they showed an immature phenotype in an undifferentiated IEL.
It is highly possible that oxPPP within EC controls vMC coverage around the DA regulating vascular maturation in developing zebrafish.
Tie2-specific PPP blockade affects vMC coverage in the mouse embryonic dorsal aorta
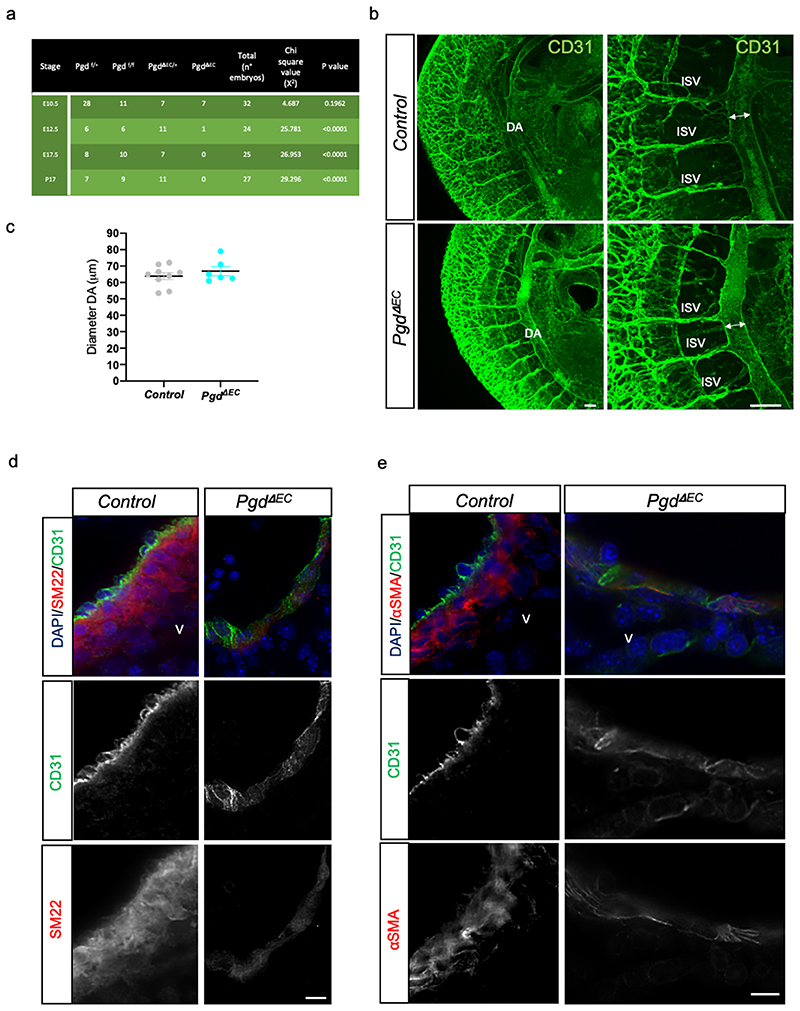
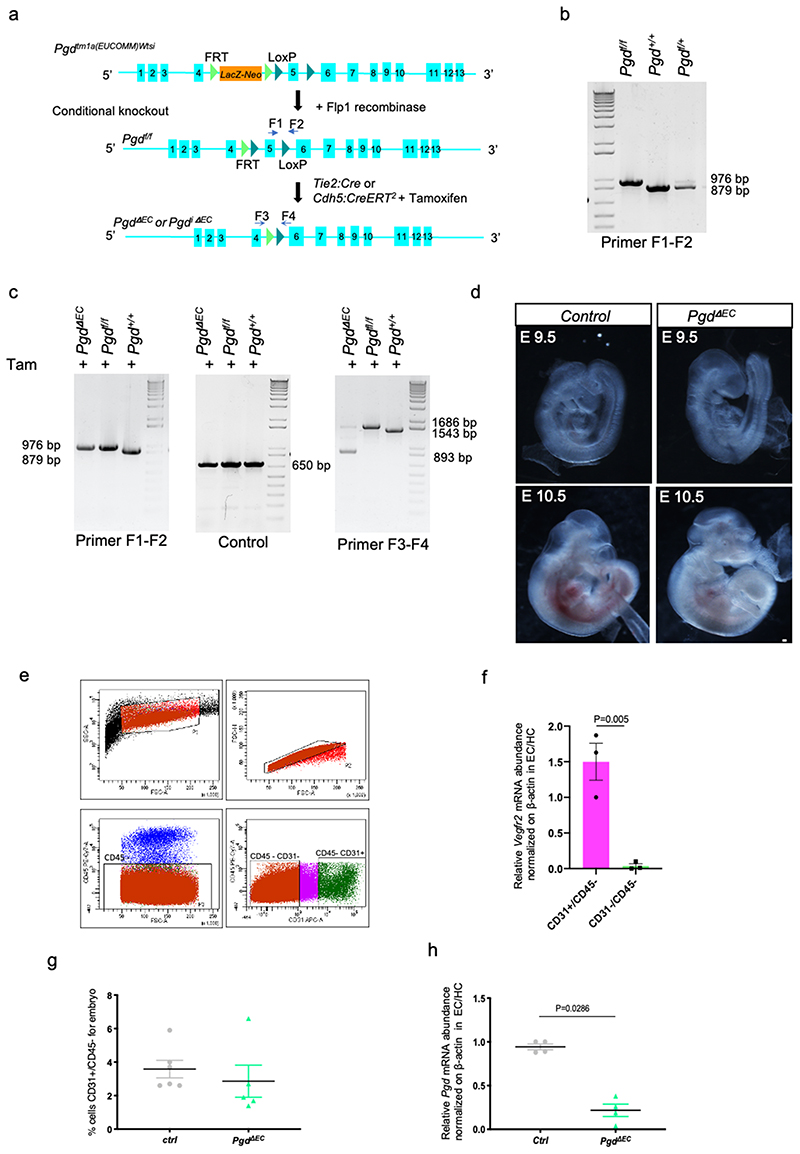
To study the function of oxPPP metabolism in mammalian vascular development, we used a Pgd conditional mouse allele, Pgd f/f, and we developed a mouse model for EC-specific Pgd ablation (Extended data Fig. 4a-c). At first, we crossed Pgd f/f mice with Tg(Tek-Cre)2352Rwng mice expressing the Cre recombinase under the endothelial-specific receptor tyrosine kinase Tek/Tie2 promoter to generate Tie2-specific Pgd knockout (KO) animals. We called these Tg mice PgdΔEC , since Cre activity is detected mostly in EC. However, since Cre activity also occurs in some hematopoietic cells (HC) at these developmental stages, we do not exclude that also HC can contribute to the phenotype 28 . While heterozygous PgdΔEC/+ mice were born in normal mendelian ratios and developed normally, PgdΔEC mice died during embryogenesis after developmental day E12.5 (Figure 3a and Extended data Fig. 4d).
Figure 3. Endothelial Pgd drives vMC coverage of the DA in mouse embryos.
a, Table of viable offspring from Tie2-Cre;Pgdf/+ (male) and Pgdf/f (female) intercrosses at developmental stages E10.5, E12.5, E17.5 and P17. Pearson’s Chi-square values are shown and indicate whether the observed ratios were significantly different from the expected ratios.
b, Confocal images of E11 controls (Pgdf/f) and Pgd ΔEC mutants (Tie2-Cre; Pgdf/f) wholemount CD31 (green) staining. Major trunk blood vessels including DA and intersomitic vessels (ISV) are present and developed in Pgd mutants. Images are representative of at least three independent experiments (n=3) with similar results. Scale bars, 50μm.
c, Scatter plots show the quantification of DA diameter of E11 controls (Pgdf/f) and Pgd ΔEC mutants (Tie2-Cre; Pgdf/f). Pgdf/f (n=9), Tie2-Cre; Pgdf/f (n=6). Data are shown as mean ± SEM.
d-e, DA sections of E11 control and Pgd △EC mouse embryos immunostained with antibodies against SM22 or α-smooth muscle actin (αSMA) to detect vMC (red) and CD31 for EC/HC (green). DAPI (blue) stains all nuclei. V: ventral. Images are representative of three independent pups (n=3). Scale bars, 10μm.
Next, we examined whether vascular development appears disturbed in mutant mice. At first, we counted the number of CD31+/CD45- cells in PgdΔEC mutant embryos by flow cytometry analyses (Extended data Fig. 4e-g). In accordance with the zebrafish model, we did not detect vascular abnormalities at E11 in PgdΔEC embryos compared to controls although CD31+/CD45- cell population holds a significant reduction of Pgd expression (Extended data Fig. 4h). We then examined in more details the trunk vascular network by CD31 staining of E11 PgdΔEC embryos through confocal analyses of dorsal aorta (DA) and intersomitic vessels (ISV) (Fig. 3b). We also measure DA diameter in PgdΔEC embryos compared to controls (Fig. 3c). No significant morphological vascular defects within DA and ISV or DA diameter alteration were detected in PgdΔEC embryos compared to controls.
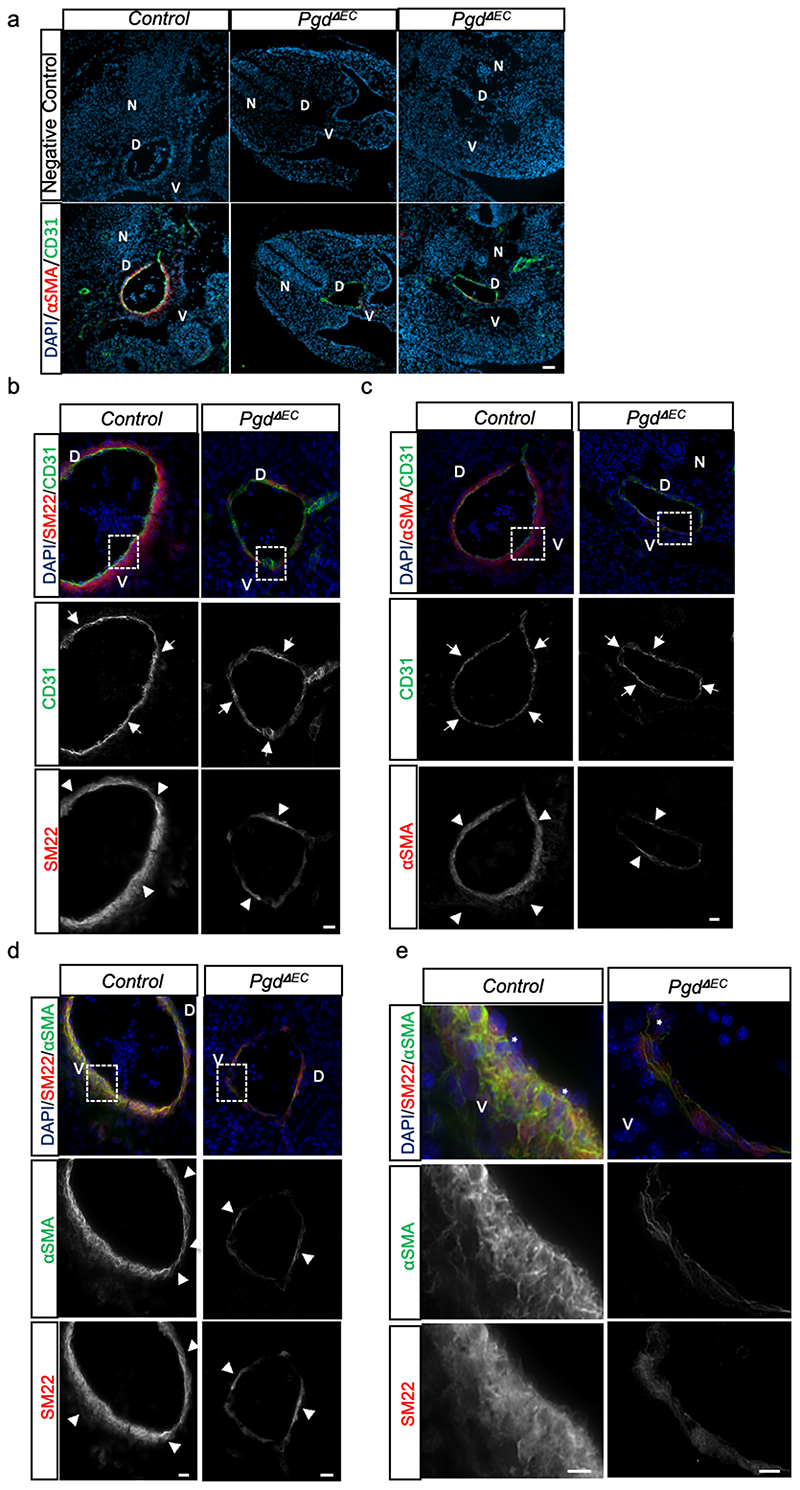
Next, we investigated whether PgdΔEC mouse embryos showed vMC coverage defects. Aortas from control littermate and PgdÆC mouse embryos at E11 (44-45 somite pairs) were subjected to co-immunostaining for CD31 and αSMA or SM22, markers of EC/HC and vMC, respectively, at this developmental stage (Figure 3d,e). Compared to negative controls, in which primary antibodies were absent, we showed that CD31 and αSMA staining is specific (Extended data Fig. 5a). The DA of control embryos is surrounded by CD31-expressing EC closely encircled by αSMA- or SM22-expressing vMC as previously shown 29 . Our data further showed that CD31 expression is confirmed in the PgdΔEC embryonic DA, while only rare αSMA- or SM22-expressing cells were found in these animals (Extended data Fig. 5b-e). We concluded that PgdΔEC mouse embryos showed an impairment of vMC coverage around the dorsal aortic wall. Overall, we confirmed that Tie2-specific Pgd KO in mouse embryos displayed vMC coverage defects around the DA confirming the data previously obtained in the zebrafish models.
We concluded that EC (and possibly HC) actively use glucose and the oxidative PPP shunt to control vMC coverage of the DA and blood vessel maturation in mouse embryos.
oxPPP controls ELASTIN expression and deposition in EC
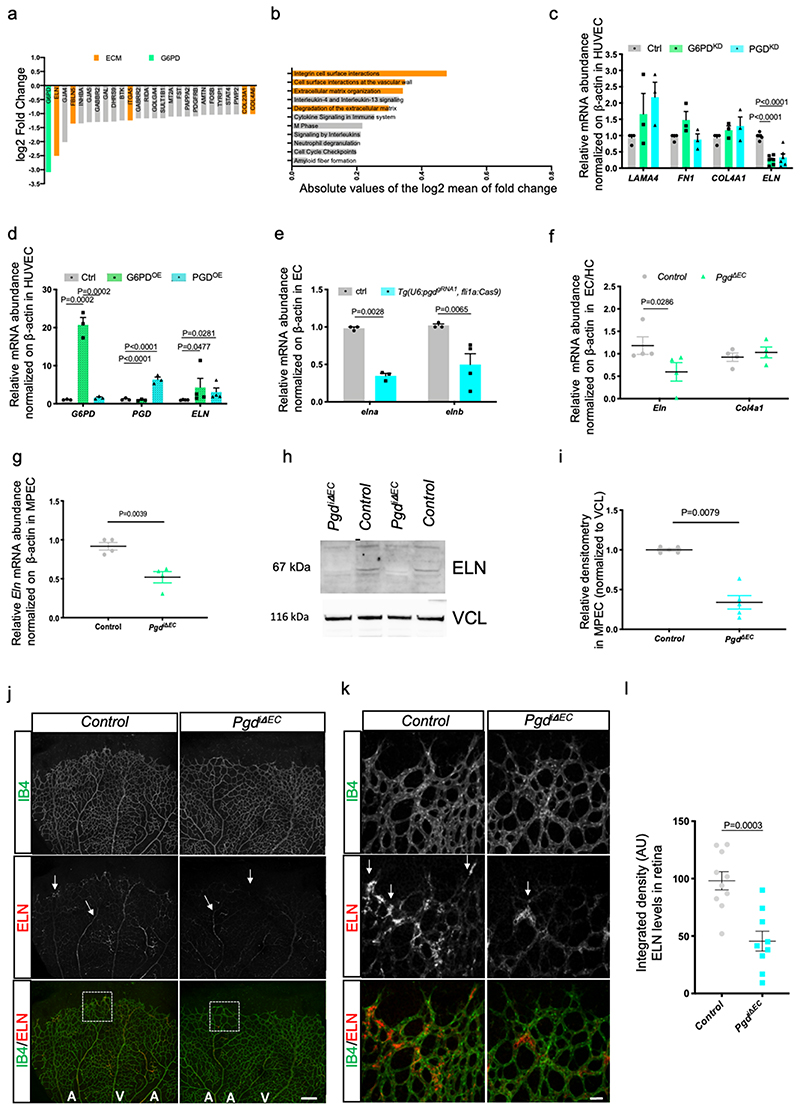
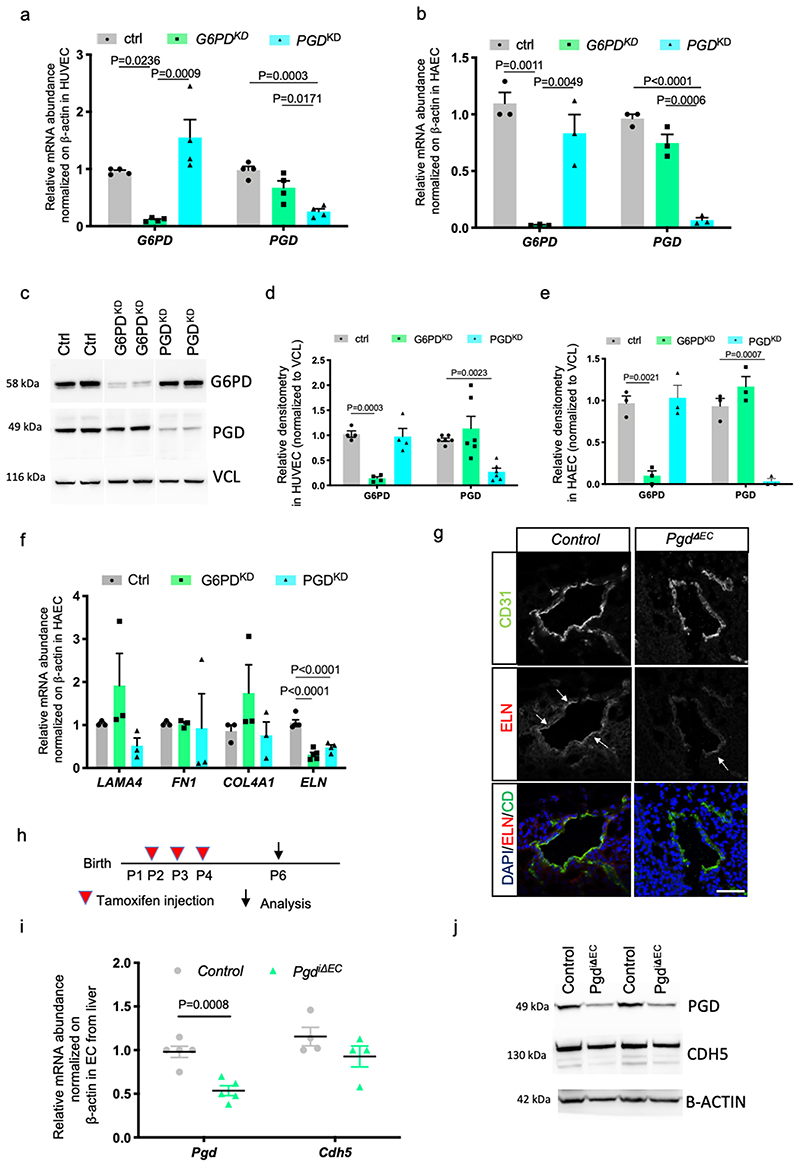
Recent discoveries assume the knowledge that changes affecting metabolic pathways and enzymes might influence epigenetic dynamics and, consequently, gene expression 30,31 32 . To uncover whether oxPPP regulates gene expression in EC, we performed EC transcriptomics profile with oxPPP blockade by knocking down (KD) G6PD (Fig. 4a and Supplementary Table 1). RNAseq analyses of human EC revealed that ELASTIN (ELN), a major component of the vascular ECM and an essential determinant of arterial morphogenesis 33,34 , is the most downregulated gene in condition of oxPPP blockade (G6PDKD). Furthermore, Reactome pathway enrichment analyses showed that genes belonging to ECM organization, degradation and binding represent the major hits (Fig. 4b and Supplementary Table 2) suggesting that oxPPP blockade mainly perturbed ECM signaling. To confirm our transcriptomics data we inactivated G6PD (G6PDKD) and PGD (PGDKD) genes in two different human EC lines, HUVEC (human umbilical vein EC) and HAEC (human arterial EC) by means of short hairpin RNAs (shRNAs)(Extended data Fig. 6a-e) and we analyzed the expression of different extracellular matrix genes related to EC-vMC interactions in blood vessels, such as LAMa4, FN1 and COL4A1 (Fig. 4c and Extended data Fig. 6f). ELN, but not the other ECM genes tested, was downregulated by oxPPP blockade. To support the specificity of ELN regulation by oxPPP, we overexpressed G6PD and PGD genes by means of lentiviral vectors and analyzed ELN expression (Fig. 4d). Expression of G6PD (G6PDOE) and PGD (PGDOE) led to an increase of ELN. We can conclude that ELN expression is specifically regulated by oxPPP enzymes in EC in vitro.
Figure 4. oxPPP regulates ELASTIN expression in EC.
a, Logarithmic fold change of gene expression (G6PDKD/control) of Differentially Expressed Genes (DEGs) lower than -1 in HUVEC. Genes are ordered by expression, thus genes with the greatest change in expression are on the left side of the plot. DEGs were calculated with EdgeR statistics by fitting GLM, p-values were corrected for multiple testing with Benjamini-Hochberg false discovery rate. DEGs were defined as genes with adjusted p-value less than 0.05.
b, Reactome pathway enrichment analyses of the 3216 DEGs identified comparing G6PDkd vs control. Pathway p-values were corrected for multiple testing with Benjamini-Hochberg false discovery rate and pathways with adjusted p-value lower than 0.01 were considered as enriched. Pathways in the figure are ordered by absolute and logarithmic mean of Fold Change (G6PDkd / control), thus pathways with the greater change in expression are in the upper part of the plot.
c, qRT-PCR expression analysis of LAMA4, FN1, COL4A1 and ELN in control, G6PDKD and PGDKD in HUVEC. LAMa4, FN1, COL4A1 (n=3) and ELN (n=4) from three independent experiments. Data are shown as mean ± SEM. Statistics were done using one-way ANOVA followed by Tukey’s multiple comparison test.
d, qRT-PCR expression analysis of G6PD, PGD and ELASTIN in control, G6PDOE and PGDoe in EC. HUVEC were transduced with lentiviral particles encoding human G6PD and PGD cDNA for 24 hours and analyses of G6PD, PGD (n=3) and ELN (n=4) genes from two independent experiments. Data are shown as mean ± SEM. Statistics were done using oneway ANOVA followed by Tukey’s multiple comparison test.
e, qRT-PCR analysis of the relative expression of elna/elnb in EC-specific KO for pgd in EC sorted from Tg(U6:pgdgRNA1,fli1a:Cas9),Tg(kdrl:mCherry) uto2 . Cmlc2:eGFP-negative embryos were used a control (Ctrl). n=4 from two independent experiments. Fifty mCherry and eGFP-positive embryos or mcherry-positive embryos were used in each sample (n). Data are shown as mean ± SEM. Statistics were done using unpaired Student’s t-test.
f, Relative mRNA expression levels of Eln and Col4a1 in EC (CD31+/CD45-) that were FACS-sorted from control or Pgd ΔEC mouse embryos at E11. Eln (n=4) and Col4al (n=4) embryos from three independent experiments. Data are shown as mean ± SEM. Statistics were done using unpaired Student’s t-test.
g, qRT-PCR analysis of Eln in control and Pgd ΔEC pups at P6 on EC isolated from murine lungs (MPEC). n=4 from three independent experiments. Data are shown as mean ± SEM. Statistics were done using unpaired Student’s t-test.
h, Western blot analyses of ELN in control (Pgdf/f) and Pgdi △EC mutants (Cdh5:Cre-ERT2; Pgdf/f ) at P6 on EC isolated from mice’s lung (MPEC). VINCULIN (VCL) is used as loading control.
i, Densitometric analysis of ELN expression in control (Pgdf/f) (n=4) and Pgdi △EC (n=5) mutants (Cdh5:Cre-ERT2; Pgdf/f) at P6 on EC isolated from mice’s lung (MPEC) relative to VINCULIN from three independent experiments. Data are shown as mean ± SEM. Statistics were done using unpaired Student’s t-test.
j, Confocal images of postnatal mouse retina angiogenesis in Pgdi △EC. Control and Pgd△EC mice were injected with tamoxifen and analyzed at P6. Representative confocal projections of isolectin-B4 (green) and ELN (red) immunostained retinas from control and Pgd△EC pups (A, Artery; V, Vein). Scale bars, 200 μm.
k, Confocal images magnification of the front region of controls and Pgdi △EC retinas stained for isolectin-B4 (green) and ELN (red). Scale bars, 10 μm.
l, Scatter plots show the quantification of ELN staining in controls and Pgdi △EC pups. n=10 (control) and n=9 (Pgdi △EC) mouse pups from four independent experiments. Data are shown as mean ± SEM. Statistics were done using unpaired Student’s t-test.
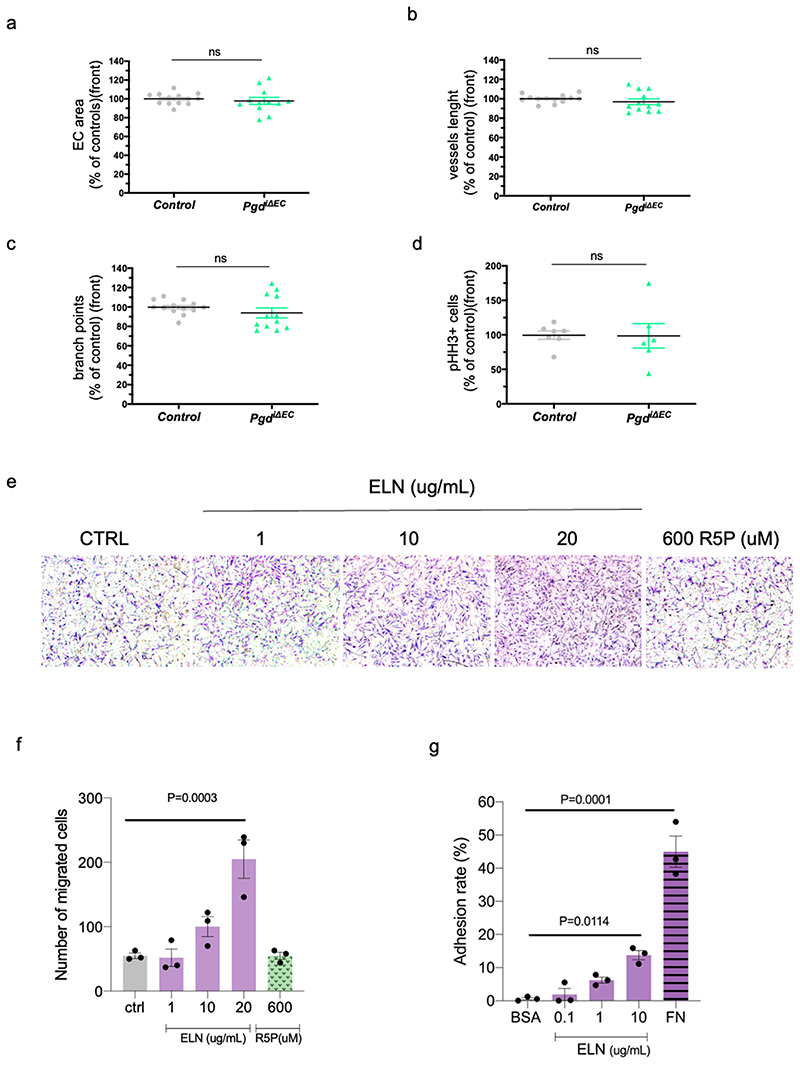
ELN is a key extracellular matrix protein that is critical to the elasticity of the vascular wall which helps to stabilize the arterial structure by regulating vascular smooth muscle cell activity 35 . It has been shown that vMC are connected to elastic lamina (IEL) in the developing mouse aorta and that this connection plays a critical role in aortic medial organization 36 . We then analyzed whether oxPPP controls ELN expression also in vivo during normal vascular development. To this purpose we analysed elna and elnb expression in EC of Tg(U6:pgdgRNA1, fli1a:Cas9) zebrafish embryos (Fig. 4e). In agreement with human data (Fig. 4c), zebrafish elastin genes, elna and elnb, are both positively regulated by oxPPP since their expression is impaired in EC-specific Pgd zebrafish mutants. Lastly, we analysed Elastin (Eln) expression during mouse development. CD31+/CD45- cells isolated from E11 mouse embryos were analysed for Eln expression (Fig. 4f). Compared to control embryo, cells from PgdΔEC embryos showed significant reduction of Eln expression but not of Col4a1, another basement membrane component. Accordingly, confocal analyses of DA of mouse embryos confirmed a reduced Eln deposition in PgdΔEC embryos (Extended Data Fig. 6g). To further investigate the effect of Pgd ablation on Eln expression, we generated an inducible EC KO model for Pgd (PgdiΔEC ) by crossing Pgdf/f with Tg(Cdh5-cre-ERT2)1Rha , expressing the Cre recombinase under the tamoxifen-inducible vascular endothelial cadherin 5 (Cdh5) promoter 37 . Pgd ablation was induced by a daily tamoxifen injection from P2 (postnatal day) to P4. At P6 we found a significant reduction of Pgd expression and protein levels in EC from PgdiΔEC pups compared to tamoxifen-injected Pgdf/f animals (Extended Data Fig. 6h-j). Importantly, Eln mRNA expression and protein synthesis were also reduced in these cells (Fig. 4g-i). Next, we analyzed Eln deposition in PgdiΔEC mice using the postnatal retinal angiogenesis model (Extended Data Fig. 7a-d). Endothelial loss of Pgd do not alter retinal angiogenesis, in terms of EC area, branch points, vessel length and EC proliferation. However, Eln deposition was significantly affected in retinal blood vessels of PgdiΔEC pups (Fig. 4j-l).
Finally, we questioned whether Eln acts by supporting vMC migration towards EC. To address this question, we performed vMC chemotaxis assays using human aortic vascular SMC (AoSMC) in presence of Eln (Extended Data Fig. 7e,f). We showed that increasing concentrations of ELN can promote vMC migration. As control we use R5P that instead does not affect vMC migration. Interestingly, we counted a slight but significant increase of vMC adhesion when plated on ELN (Extended Data Fig. 7g) supporting the possibility that EC-released Eln leads to coverage of vMC also through cell attachment and anchorage.
Overall, these data indicate that endothelial oxPPP is required for ELASTIN expression which is possibly required for vMC recruitments and adhesion around DA.
Hemodynamic forces promote ELASTIN synthesis and vMC coverage in a PPP-dependent manner
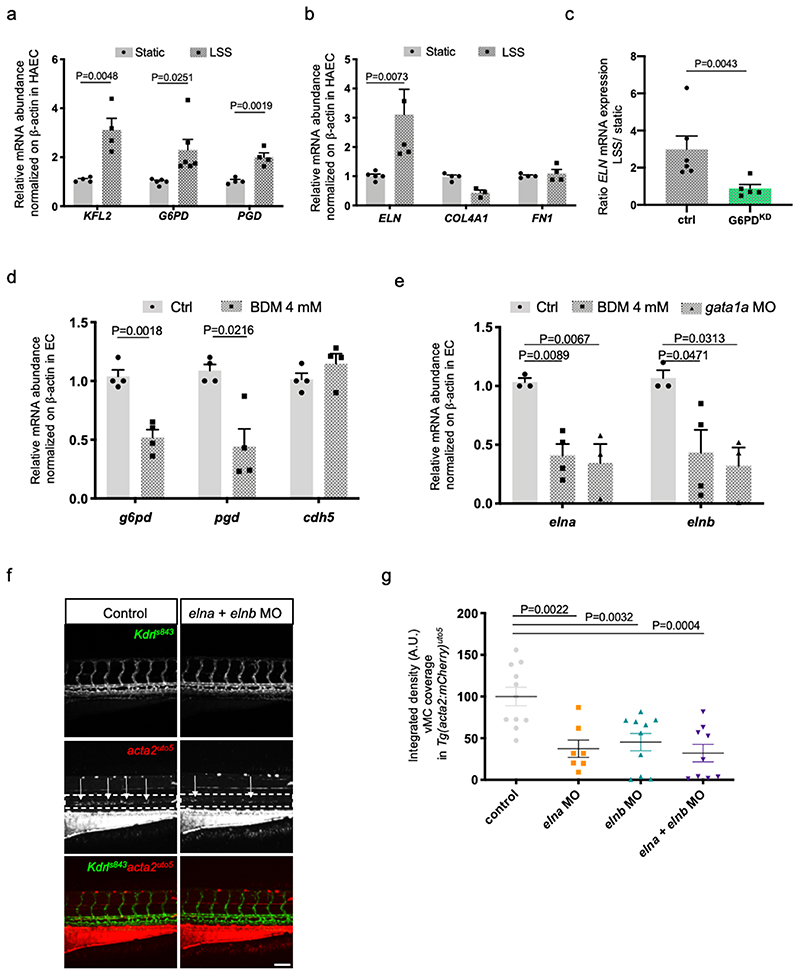
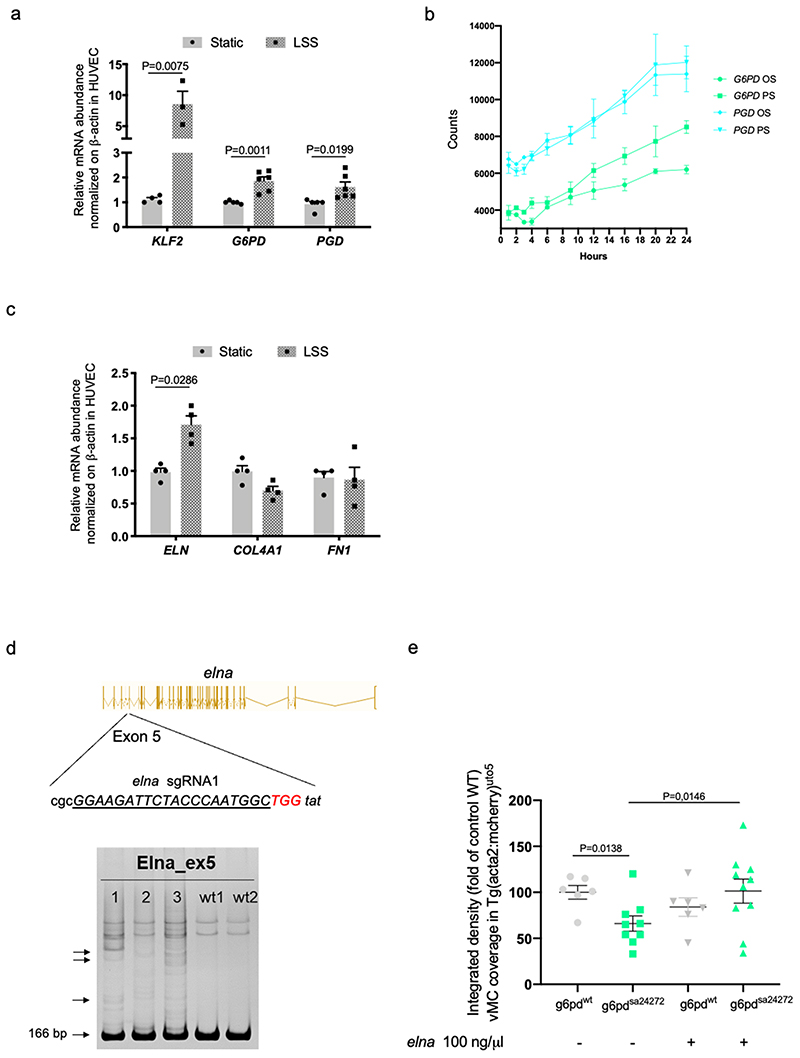
We previously discovered that hemodynamic forces are required for vascular myogenesis in zebrafish 20 . The function of shear stress and hemodynamic forces in vascular development has been proven as a crucial mechanism in shaping the developing vascular system 38,39 . We then hypothesized that hemodynamic forces are important for vMC recruitment by modulating oxPPP in EC. To test it, we exposed human EC to laminar shear stress (LSS) resembling arterial conditions (LSS; 18 dynes/cm2) and evaluated the expression levels of G6PD and PGD genes in EC (Fig. 5a and Extended data Fig. 8a). Our qRT-PCR analyses showed that both enzymes were significantly induced by LSS. By taking advantage of public expression data 40 , we also showed that oscillatory flow (OS) and pulsatile flow (PS) can promote G6PD and PGD in supporting the oxidative phase of PPP (Extended data Fig. 8b).
Figure 5. Hemodynamic forces promote vMC coverage through oxPPP and ELN expression.
a, Effects of shear stress on the expression of G6PD and PGD genes exposed to 24hr of LSS (Laminar Shear Stress) in human endothelial cell lines (HAEC). KLF2 was used a positive control being a flow-induced gene. N=4 from three independent experiments. Data are shown as mean ± SEM. Statistics were done using unpaired Student’s t-test.
b, Effects of shear stress on the expression of different ECM target genes in HAEC after 24hr of LSS. n=4 from three independent experiments. Data are shown as mean ± SEM. Statistics were done using unpaired Student’s t-test.
c, qRT-PCR analysis of ELASTIN expression after LSS in G6PDkd EC. Scatter plots show the quantification of LSS/Static ratio in control and G6PDKD in HAEC. n=5 from four independent experiments. Data are shown as mean ± SEM. Statistics were done using unpaired Student’s t-test.
d, qRT-PCR analysis of pgd and g6pd expression in ECs sorted from Tg(kdrl:eGFP)s843 treated with BDM 4mM or control at 72 hpf. n=4 from two independent experiments. Fifty GFP-positive embryos from Tg(kdrl:eGFP)s843 were used in each sample. Data are shown as mean ± SEM. Statistics were done using unpaired Student’s t-test.
e, qRT-PCR analysis of elna and elnb expression in ECs sorted from Tg(kdrl:eGFP) embryos treated with BDM or injected with control or gata1 MO at 72hpf. Ctrl and gata1a MO (n=3), BDM (n=4) from two independent experiments. Fifity GFP-positive embryos from Tg(kdrl:eGFP)s843 were used in each sample. Data are shown as mean ± SEM. Statistics were done using one-way ANOVA followed by Dunnet’s multiple comparison test.
f, Confocal images of partial z-projection of the trunk region (somite 8-14) of a Tg(kdrl:eGFP)s843 ;Tg(acta2:mCherry)uto5 embryo at 4dpf after elna and elnb antisense morpholino (MO) injection. Scale bar, 100 μm.
g, Scatter plots show the defect in vMC coverage in elna/elnb morphants at 4dpf. Ctrl (n=11), elna MO (n=7), elnb MO (n=10), elna/elnb MO (n=9) embryos from 2 independent experiments. Data are shown as mean ± SEM. Statistics were done using one-way ANOVA followed by Tukey’s multiple comparison test.
Since it has been shown that blood flow affects ECM deposition in the embryonic aorta 41 , we evaluated whether ELN expression is under the control of laminar flow (Fig. 5b and Extended data Fig. 8c). Upon exposure of EC to LSS, we discovered that ELN is positively regulated by LSS compared to other ECM genes, such as COL4A1 and FN1. We then questioned whether oxPPP is required for flow-dependent ELN expression. To answer this question, we exposed G6PDKD cells to LSS and measured ELN expression (Fig. 5c). We found that oxPPP blockade affects flow-dependent ELN expression in EC.
To validate these findings in vivo, we analyzed the expression of g6pd and pgd genes in EC of zebrafish embryos treated with BDM, a compound known to block heart beating and impair hemodynamic forces in zebrafish blood vessels 20 (Fig. 5d). Our data revealed that both g6pd and pgd were downregulated in zebrafish EC in the absence of blood flow. Next, we investigated whether hemodynamic forces are required for eln expression in zebrafish by analyzing the two zebrafish elastin genes, elna and elnb in BDM-treated embryos and in gata1, a gene required for erythroblast development and used to block wall shear stress in developing zebrafish embryos morphants (Fig. 5e) 39,42 . Both pharmacological and genetic blockade of blood flow reduced elna and elnb gene expression in zebrafish EC. Overall, these data indicate that ELASTIN expression is regulated by shear stress in an oxPPPdependent manner in both human and zebrafish EC.
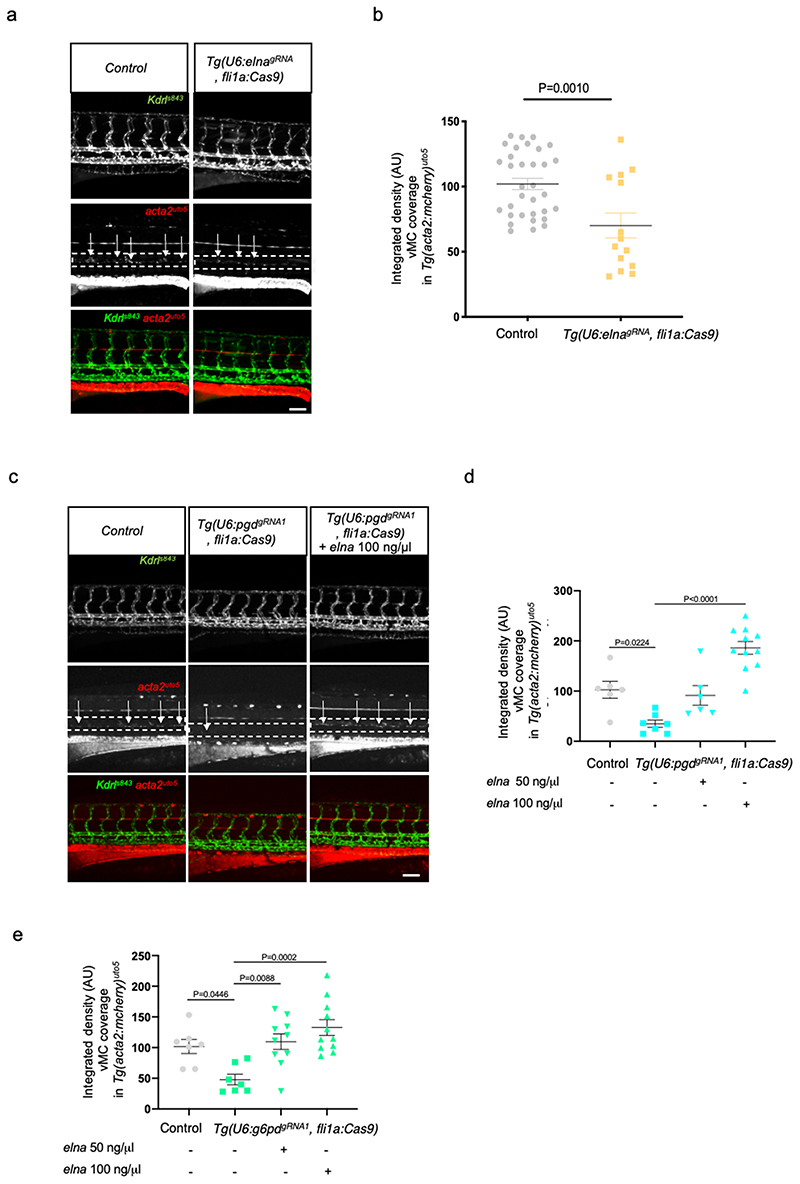
To correlate vMC recruitment to oxPPP and eln expression, we assessed vMC coverage in zebrafish embryos where zebrafish elastin genes, elna and elnb, were knocked down by morpholino injections (Fig. 5f,g) 43 . Single or double morphants for elna and elnb showed significant reduction of vMC recruitment suggesting that elastin is required for this process during zebrafish embryo development. Similar results were obtained using the Tg(U6:elnagRNA, fli1a:Cas9) line with EC-specific inactivation of elna (Fig. 6a,b and Extended Fig. 8d). These data correlate with previous work showing that Eln is directly related to vascular maturation and stabilization of arterial structures 33 . To confirm the specific function of ELN as downstream target of oxPPP we attempted to rescue vMC recruitment in g6pd and pgd EC-specific mutant zebrafish embryos by expressing eln genes in Tg(U6:pgdgRNA1, fli1a:Cas9) and Tg(U6:g6pdgRNA1 , fli1a:Cas9) (Fig. 6c-e). We found that mRNA expression of elna can specifically rescue vMC recruitment in EC-specific mutant of g6pd and pgd in a dose-dependent manner. The same results were obtained using g6pd and pgd zebrafish mutant embryos (Extended Fig. 8e). We concluded that ELN is responsible for vMC coverage in oxPPP-deficient embryos.
Figure 6. ELN rescue vMC recruitment in absence of functional oxPPP in EC.
a, Confocal images of partial z-projection of the trunk region (somite 8-14) of Tg(kdrl:eGFP)s843 ;Tg(acta2:mCherry)uto5 embryos at 4dpf after the injection with the Tol2 mRNA plasmid U6:elnagRNA; fli1a:Cas9 compared to control plasmid-injected embryos. Scale bar, 100 μm.
b, Scatter plots showing the quantification of vMC coverage of Tg(kdrl:eGFP)s843 Tg(acta2:mCherry)uto5 embryos at 4dpf after the injection with the Tol2 mRNA plasmid U6:elnagRNA; fli1a:Cas9 (n=14) compared to control plasmid-injected embryos (n=33) from three independent experiments. Data are shown as mean ± SEM. Statistics were done using unpaired Student’s t-test.
c, Confocal images of partial z-projection of the trunk region (somite 8-14) of
Tg(kdrl:eGFP)s843 ;Tg(acta2:mCherry)uto5 embryos at 4dpf in ctrl and in Tg(U6:pgdgRNA1, fli1a:Cas9) with and without elna mRNA injection. Scale bar, 100 μm.
d, Scatter plots showing the quantification of vMC coverage of Tg(kdrl:eGFP)s843 Tg(acta2:mCherry)uto5 embryos at 4dpf in ctrl and in Tg(U6:pgdgRNA1, fli1a:Cas9 with and without elna mRNA-injected at 50ng/μl and 100ng/μl ctrl (n=6) Tg(U6:pgdgRNA1, fli1a:Cas9)(n=7), Tg(U6:pgdgRNA1, fli1a:Cas9) elna 50ng/μl (n=6), Tg(U6:pgdgRNA1, fli1a:Cas9) elna 100ng/μl (n=11) embryos from two independent experiments. Data are shown as mean ± SEM. Statistics were done using one-way ANOVA followed by Tukey’s multiple comparison test.
e, Scatter plots showing the quantification of vMC coverage of Tg(kdrl:eGFP)s843 Tg(acta2:mCherry)uto5 embryos at 4dpf in ctrl and in Tg(U6:g6pdgRNA1, fli1a:Cas9) with and without elna mRNA-injected at 50ng/μl and 100ng/μl. ctrl (n=7), Tg(U6:g6pdgRNA1, fli1a:Cas9)(n=7), Tg(U6:g6pdgRNA1, fli1a:Cas9) elna 50ng/μl (n=10), Tg(U6:g6pdgRNA1, flila:Cas9) elna 100ng/μl (n=11) embryos from two independent experiments. Data are shown as mean ± SEM. Statistics were done using one-way ANOVA followed by Tukey’s multiple comparison test.
Overall, we propose that hemodynamic forces control vMC coverage of DA and vascular maturation via oxidative PPP metabolism and elastin expression.
R5P is required for ELN expression and vMC coverage during vascular development
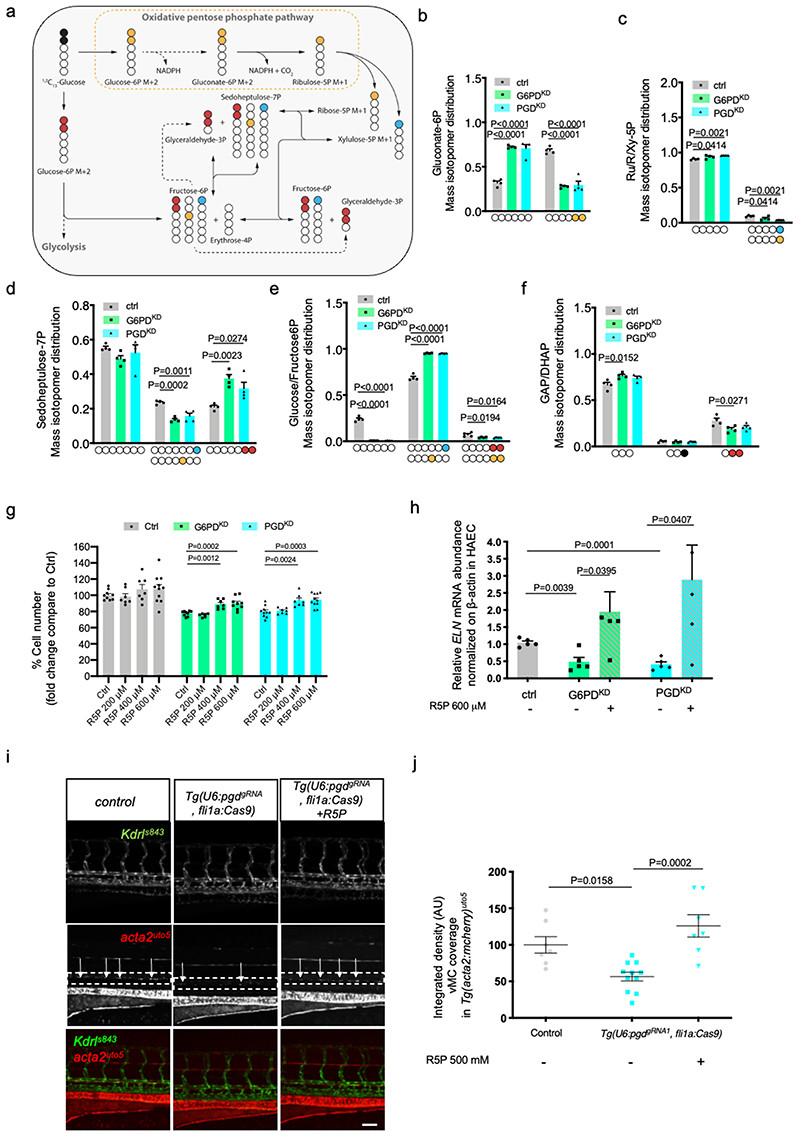
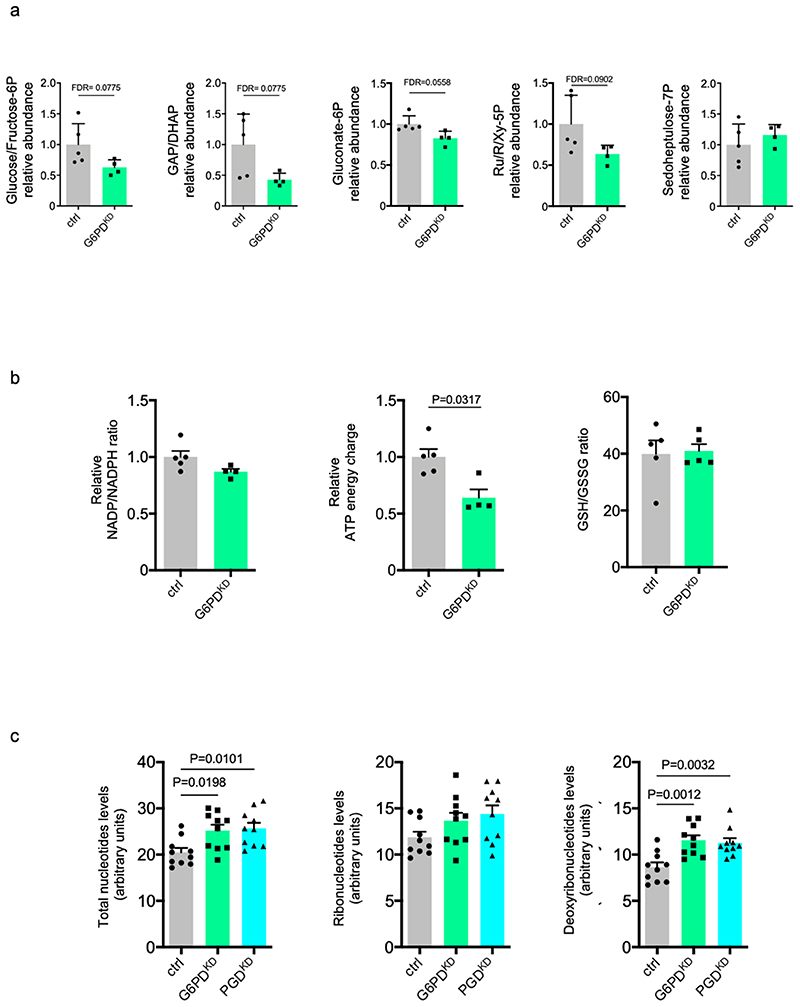
The PPP is a fundamental component of cellular metabolism. It is important to maintain carbon homeostasis, to provide precursors for nucleotide and amino acid biosynthesis, to provide reducing molecules for anabolism, and to defeat oxidative stress 12 . The PPP is characterized by two branches: the irreversible oxidative branch and the reversible non-oxidative branch (Fig. 7a). The oxidative branch is highly active in most eukaryotes and converts glucose 6-phosphate into carbon dioxide, R5P and NADPH (Fig. 7a, yellow and light blue carbons). NADPH function is critical to maintain redox balance under stress situations, while R5P is required for nucleotide synthesis and cell proliferation. After silencing G6PD (G6PDKD) in EC, we detected a significant reduction of gluconate-6P, R5P and ATP energy charge, but we did not detect an important reduction of sedoheptulose7P, NADP/NADPH and GSH/GSSG ratio (Extended data Fig. 9a,b).
Figure 7. oxPPP-dependent R5P levels are required for EC viability, ELN expression and vMC recruitment.
a, Schematic of pentose phosphate pathway (PPP). Yellow and light blue dots represent 13 C originating from 1,2- 13 C2-glucose through the PPP, while red dots represent 13 C through glycolysis and reverse PPP.
b-f Mass isotopomer distribution (MID) of M+2 gluconate-6P (b), M+1 ribulose/ribose/xylulose-5P (c), M+1 sedoheptulose-7P (d), M+1 and M+2 glucose/fructose-6P (e), M+1 and M+2 glyceraldehyde/dihydroxyacetone phosphate (GAP/DHAP) (f). Colored carbons refer to the scheme in Fig. 7a. n=4 from one single experiment. Data are shown as mean ± SEM. Statistics were done using one-way ANOVA followed by Dunnett’s multiple comparison test.
g, Cell number assay of G6PDKD and PGDKD EC-treated with different concentration of R5P in HAEC for 72 hours compared to controls. n=8 from two independent experiments. Data are shown as mean ± SEM. Statistics were done using one-way ANOVA followed by Dunnet’s multiple comparison test.
h, qRT-PCR analysis of ELN in G6PDkd and PGDkd EC treated with 500uM of R5P. n=4 from two independent experiments. Data are shown as mean ± SEM. Statistical analysis was done using unpaired Student’s t-test.
I, Confocal images of partial z-projection of the trunk region (somite 8-14) of a Tg(kdrl:eGFP)s843 ;Tg(acta2:mCheny)uto5 zebrafish embryos at 4 dpf in ctrl and in EC-specific pgd mutants Tg(U6:pgdgRNA1, flila:Cas9) with or without injection of R5P (500 mM). Scale bar, 100 μm.
j, Scatter plots showing the quantification of vMC coverage around the DA in Tg(U6:pgdgRNA1, flila:Cas9). ctrl (n=7), Tg(U6:pgdgRNA1, fli1a:Cas9)(n=11), Tg(U6:pgdgRNA1, flila:Cas9)+R5P (n=7) embryos from two independent experiments. Data are shown as mean ± SEM. Statistical analysis was done using one-way ANOVA followed by Tukey’s multiple comparison test.
To better investigate PPP metabolic flux in EC, we performed 1,2-13C2-glucose isotope labelling experiments. Consistently with a steady state metabolomics, M+2 gluconate-6P and M+1 Ribose/Ribulose/Xylulose-5P were decreased in G6PDKD and PGDKD cells (Fig. 7b,c). Moreover, M+1 Sedoheptulose-7P originating from oxPPP was also significantly decreased (Fig. 7d). Our tracing analysis also demonstrated impaired glucose flux through glycolysis in G6PDKD and PGDKD, as supported by reduced levels of M+2 glucose/fructose-6P and glyceraldehyde 3-phosphate and dihydroxyacetone phosphate (GAP/DHAP) and increased of M+2 Sedoheptulose-7P (Fig. 7d-f, red carbons and Extended data Fig. 9a). When R5P is reduced, such as in G6PDKD and PGDKD cells, R5P can be formed through glycolytic intermediates through the non-oxidative PPP branch. This non-oxidative PPP branch metabolizes the glycolytic intermediates fructose 6-phosphate and glyceraldehyde 3-phosphate as well as sedoheptulose-7P sugars, yielding ribose 5-phosphate for the synthesis of nucleic acids and sugar phosphate precursors for the synthesis of amino acids. This option does not seem to be the case in EC. In fact, despite an increase in M+2 Sedoheptulose-7P, we did not detect any peaks ascribable to M+2 ribose/xylulose-5P, indicating that these metabolites are not replenished by reverse nonoxPPP.
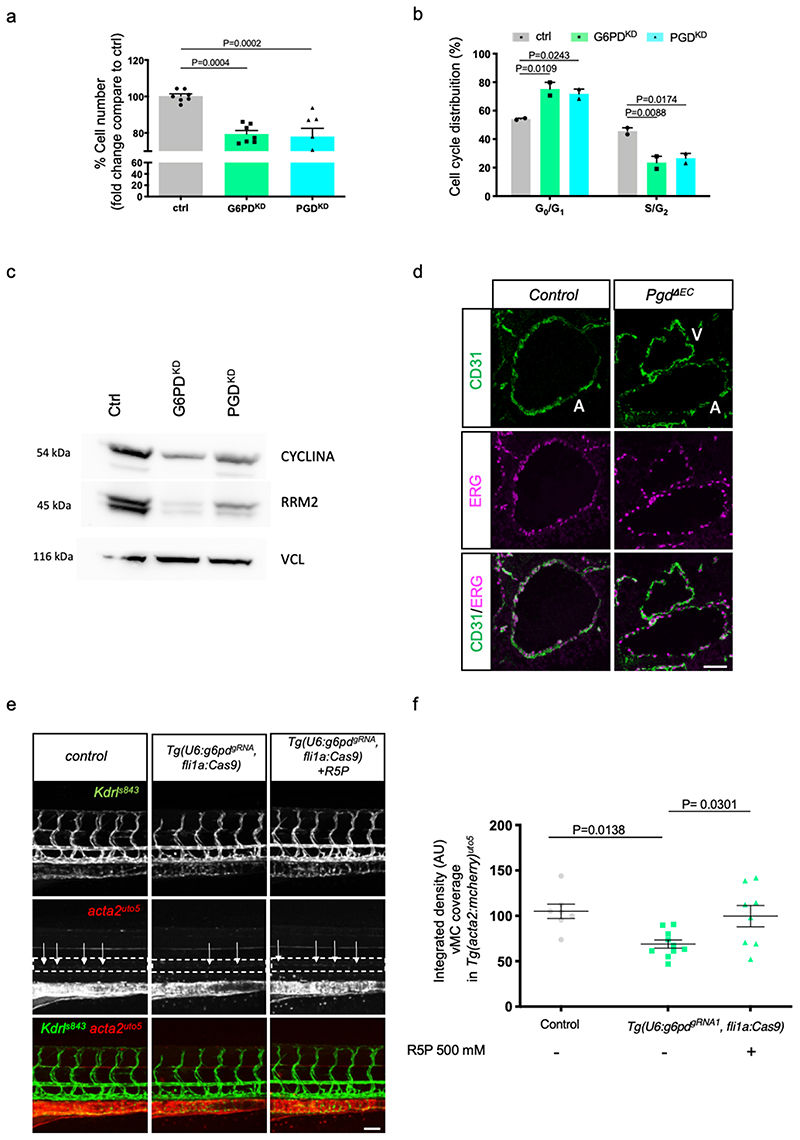
Cellular proliferation is expected to be regulated by oxPPP, which generates ribose 5-phosphate for nucleotide synthesis. We investigated EC number in G6PDKD and PGDKD conditions (Extended data Fig. 10a) and we detected a reduction in EC when oxPPP is inactive. Next, we determined the levels of total nucleotides, ribonucleotides (NTPs) and deoxyribonucleotides (dNTPs) in ctrl, G6PDKD and PGDKD EC. We found significant differences in total nucleotide levels after G6PD and PGD shRNA treatment compared to scramble shRNA cells. Specifically, our data evidenced no major differences in NTPs but higher levels of dNTPs in both G6PDKD and PGDKD cells (Extended data Fig. 9c). Since G6PD and PGD silencing reduced cell number, it is conceivable to speculate that increased dNTPs levels might be due to reduced synthesis of DNA and cellular proliferation. However, we cannot discard the impairment of others molecular mechanisms implied in the maintenance of dNTP pools.
Considering the specific drop in R5P/Ru5P in oxPPP-deficient cells, we investigated whether the lack of R5P is responsible for such defect. We treated G6PDKD and PGDKD EC with increasing concentrations of R5P to evaluate their cell number (Fig. 7g). R5P was able to rescue EC viability in a dose-dependent manner. We then examined the distribution of cells within the different phases of the cell cycle when oxPPP is blocked (Extended data Fig. 10b). Notably, in the absence of PPP enzymes, there is a block in the G0/G1 phase. We also analyzed two different markers of cell proliferation including RRM2 (a cell-cycle-regulated enzyme, that catalyzes the rate-limiting step in the de novo synthesis of DNA precursors 44 and CYCLINA (Extended data Fig. 10c). Both markers decreased in oxPPPblockade conditions, in line with the reduced number of cells. We were able to confirm these defects again in vivo by looking at EC cell number with ERG staining of the DA (Extended data Fig. 10d). PgdΔEC mouse embryos displayed a reduced ERG-positive cells compared to controls.
To test whether the lack of R5P/Ru5P was responsible for the vascular myogenesis defects induced by oxPPP blockade in EC, we tested if the addition of R5P/Ru5P sugars to G6PDKD and PGDKD EC were able to rescue ELN expression (Fig. 7h). According to our hypothesis, R5P was able to rescue ELN expression in absence of a functional oxPPP.
Next, we investigated whether R5P could be responsible for the lack of vMC coverage in zebrafish embryos. To this purpose both Tg(U6: g6pdgRNA1 , fli1a:Cas9) and Tg(U6: pgdgRNA1 , fli1a:Cas9) embryos were treated with similar amount of R5P and vMC recruitment was evaluated (Fig. 7i-j and Extended data Fig. 10e,f). R5P treatment was able to significantly rescue the lack of vMC recruitment in both transgenic lines. These data indicates that 5-carbon sugars generated by the oxPPP are required to drive eln expression during zebrafish development.
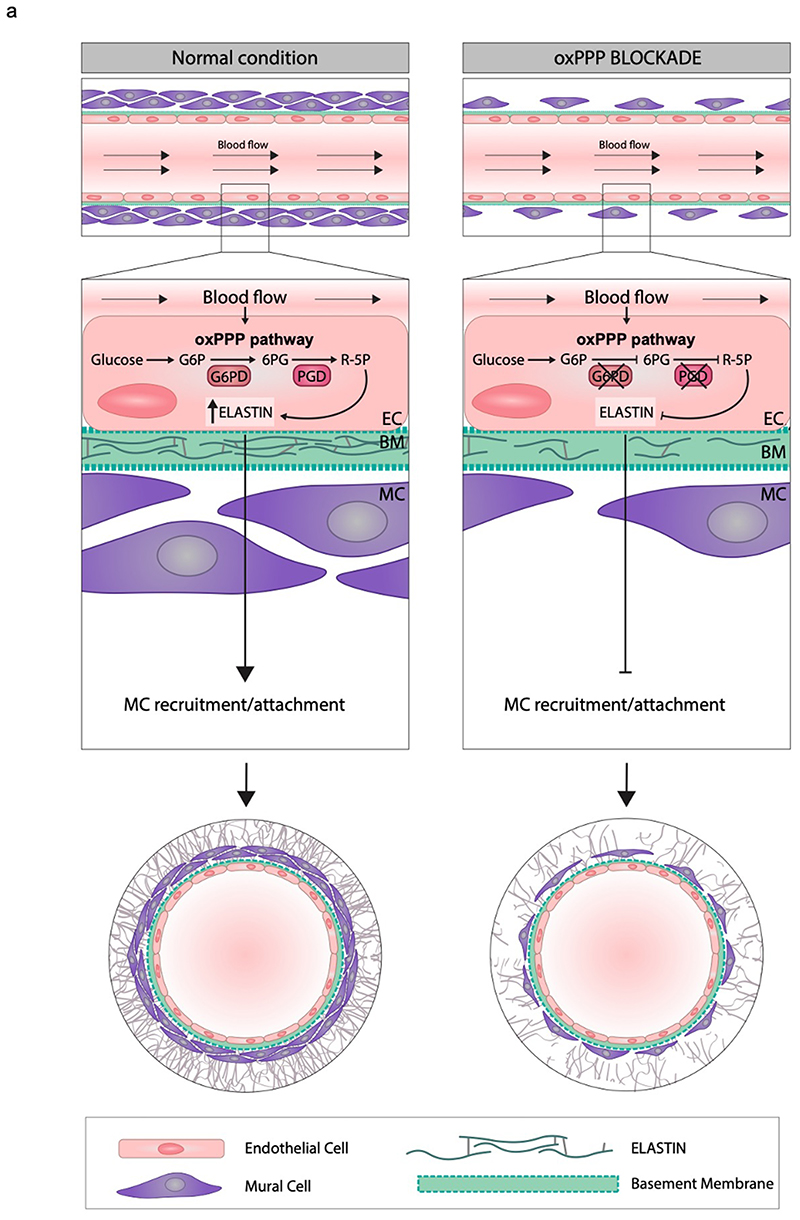
We can conclude that we have identified a novel evolutionary conserved function of the PPP that promotes vascular myogenesis during development through elastin expression and mural cell recruitment (Fig. 8a). Moreover, the hemodynamic flow also plays a key role in this process by supporting glucose utilization towards the oxPPP.
Figure 8. Schematic representation of oxPPP function in EC.
a, During vascular development blood flow acts on EC forming DA to promote glucose utilization through the oxidative branch of PPP (oxidative PPP: oxPPP). PPP metabolism produces R5P which is important for EC viability and elastin synthesis. Elastin is then deposited into ECM and drives vMC recruitment and/or differentiation around the DA of developing animals. In oxPPP blockade conditions, this mechanism is impaired leading to a vascular phenotype characterized by a “naked” and immature DA.
Discussion
Here we highlighted a role for endothelial PPP in regulating vascular mural cell coverage and vascular arteriogenesis through ECM deposition. By using human EC, zebrafish and mouse models we proved that oxidative Pentose Phosphate Pathway (oxPPP) contributes in shaping blood vessels during development by regulating vascular basement membrane deposition and EC-mural cell interactions. Our work also establishes an important link between hemodynamics, pentose phosphate metabolism, ECM and vascular maturation that needs to be further investigated.
We identified ELN as a target of endothelial PPP metabolism. However, the mechanisms involved in ELASTIN transcription and synthesis by oxPPP are currently unknown. Previous work has identified specific transcription factors (TFs) that can sense intracellular sugar levels such as the paralogs ChREBP (Carbohydrate-Responsive Element Binding Protein, MLXIPL, or MondoB) and MondoA, both of which heterodimerize with Mlx 32 . The ChREBP/MondoA-Mlx complex is activated by intracellular glucose-6-phosphate and possibly by other phosphorylated hexoses, including some from PPP catabolism 45–47 . Interestingly, WBSCR14, a gene mapping to the deleted region of Williams–Beuren disease, is a member of the Mlx transcription factor network and the cardiovascular aspects of this syndrome are caused by elastin haploinsufficiency 48 . These data lead us to hypothesize the existence of a molecular link between PPP metabolites, MLx family and elastin transcription, but further studies are needed.
The disruption of these fundamental cell-cell interactions could be a factor of central importance to the pathogenesis of common cardiovascular diseases such as atherosclerosis, aneurysms and various forms of stroke. Our work provides a rationale for therapeutic targeting of this metabolic pathway in the treatment of arterial-associated vascular diseases such as atherosclerosis, characterized by excessive elastin accumulation and altered vMC differentiation.
Materials and Methods
Maintenance and handling of zebrafish and mouse Tg lines
All experiments were performed in accordance with the European and Italian Legislations (Directive 2010/63/EU) and with permission for animal experimentation from the Ethics Committee of the University of Padua and the Italian Ministry of Health (Authorization number 856/2018-PR and8 35/2020-PR). Danio rerio (zebrafish) were maintained in a temperature-controlled (28.5°C) environment in a 12:12 light/dark (LD) cycle and fed as described by Kimmel et al. (1995) 49 . For anesthesia or euthanasia of zebrafish embryos and larvae, tricaine was added to the fish water at 0.16 mg/ml or 0.3 mg/ml, respectively. Wild type lines used in this work included Tuebingen and Giotto/Umbria strains (purchased in 1994 from a local pet shop and bred in our facility for more than 6 generations). For in vivo studies, the following transgenic lines were used: Tg(kdrl:eGFP)s843 ; Tg(kdrl:mcherry)uto2 , Tg(acta2:mCherry)uto5 , Tg(tagln:eGFP)uto37 , TgBAC(pdgfrb:Gal4FF)ncv24 ;Tg(UAS:mcherry), Tg(fli-n:GFP)y7 . The following mutant line were used: g6pdsa24272 (ZDB-ALT-161003-11894), pgdsa24360 (ZDB-ALT-131217-17700), g6pduto70 and pgduto71. Pgd tm1a(EucoMM)wtsi mouse line (Pgd f/f was purchased from EUCOMM (EM:09987) and bred into the C57Bl/6N mouse background. Mice were housed under conventional conditions in individual cages in a controlled room at 22°C and 12h light/dark cycle with ad libitum access to food and water and were regularly monitored for weight and food consumption. For constitutive Cre-mediated recombination in ECs, Pgd f/f mice were bred with Tg(Tek-Cre)2352Rwng transgenic mice 50 . To avoid recombination in the female germline, only T/e2-cre-positive male mice were used for intercrossing. Embryos were collected from Cre-negative females at the indicated time points and genotyping was performed. For conditional EC-specific deletion, Pgd f/f mice were bred with Tg(Cdh5-Cre-ERT2) 1Rha mice 37 , which express the tamoxifen-inducible Cre-ERT2 in EC 51 . For analysis of angiogenesis in the retina, postnatal mice were injected intraperitoneally with 50 μl of TAM (1 mg/ml, H6278, Sigma) on postnatal days (P) 1, 2, 3 and retinas were harvested on P6. Control animals were littermates without Cre-ERT2 expression. Due to the nature of the experimental setup, animals were randomly assigned to treatment groups. Only litters that reached normal body weight at P6 were used.
Genomic DNA was isolated from ear biopsies of the mouse. Tie2-Cre, Cdh5:Cre-ERT2 transgene, and floxed Pgd allele were distinguished by PCR (Supplementary Table 3).
Cell Lines
Human umbilical vein endothelial cells (HUVEC) were purchased from Lonza (#00191027), while immortalized human aortic endothelial cells (HAEC) were obtained from American Type Culture Collection (ATCC, CRL-4052). Aortic smooth muscle cells (AoSMCs) were purchased from Lonza #CC-2571. HUVEC were tested negative for mycoplasma and cultured until the fifth passage. HUVEC were grown in complete M199: medium (Thermo) supplemented with 20% heat-inactivated fetal bovine serum (FBS) (Carlo Erba Reagents), 1mg/mL heparin, 0.2% Bovine Brain Extract, 100U/ml penicillin, and 100μg/mL streptomycin. HAECs were cultured in Endothelial Cell Growth Medium 2 (PromoCell) supplemented with 100U/ml penicillin and 100μg/mL streptomycin. AoSMCs were cultured in smooth muscle cell growth medium SmGM-2 (CC-3182), HEK293T (ATCC CRL-11268) were cultured in DMEM GlutaMax medium (Thermo) containing 10% FBS, 100u/ml penicillin, and 100μg/mL streptomycin. HUVEC and HAEC were cultured on 0.2% pre-coated gelatin plates. All cell lines were kept in a 37°C incubator with humidified atmosphere of 5% CO2.
Virus transduction
The specific shRNAs for G6PD and PGD were obtained from Sigma-Aldrich (G6PD-targeting shRNA TRCN0000025817 and PGD-targeting shRNA TRCN0000028584). Recombinant lentiviruses carrying shRNA for specific genes were produced by cotransfecting HEK293T cells with a mixture of plasmid DNA consisting of pMD2.G (Addgene #12259), pMDLg/pRRE (Addgene #12251), and pRSV-Rev (Addgene #12253) using Lipofectamine 2000 Transfection Reagent according to the manufacturer’s recommendations. In parallel, lentiviruses carrying the scramble shRNA (Addgene #17920) were produced. Supernatants containing virus were collected, passed through 0.45-μm filters, and stored at -80°C. Virus particles were quantified using Lenti-X™ p24 Rapid Titer Kit (Takara, #632200). For in vitro modulation of oxPPP pathway, endothelial cells were infected with lentiviral vectors for 24 hours. Cells were collected at the indicated time points for biochemical and transcriptional analyses.
RNA-Seq data generation
Total RNA was extracted using Trizol (Thermo) according to manufacturer’s instructions including a DNAse treatment. RNA concentration and purity were determined spectrophotometrically using the Nanodrop 1000 (Thermo Fisher Scientific) and RNA integrity was assessed using a Bioanalyzer 2100 (Agilent), respectively.
RNA sequencing (RNA-Seq) analysis was performed by the VIB Nucleomics Core (Leuven, www.nucleomics.be). Briefly, samples (biological triplicates) were prepared with the TruSeq Stranded RNA sample preparation kit (Illumina, USA) from 1 μg RNA according to Illumina’s protocol and sequencing was performed using the NextSeq High Output Kit (75 cycles; Illumina) with single end reads all according to manufacturer’s recommendations.
RNA-Seq data processing and analyses
Data quality per sample and per read were assessed and processed to remove technical artifacts. Then, low-quality-end reads were trimmed (<Q20) and reads shorter than 35bp, adapters and polyA were removed 52 . Alignment of preprocessed reads were performed with STAR 2.4.1 to the reference genome of Homo sapiens 38 (GRCh38) 53 . Reads from alignments that are non-primary mappings or have a mapping quality ≤ 20 were removed 54 . The expression levels were computed using featureCounts v1.4.6 54 . Then we removed 41923 genes which displayed less than 1 counts-per-million in all samples (absent genes). We corrected per sample for GC-content using full quantile normalization with the EDASeq package 55 . Differentially expressed genes were selected with the edgeR 3.8.6 package by fitting GLM 56 . p-values were corrected for multiple testing with Benjamini-Hochberg 57 . We considered differentially expressed all genes with FDR-value less than 0.05.
We performed pathway analyses using differentially expressed genes. Considered gene sets were Gene Ontology and Reactome pathways, through clusterProfiler 58 and ReactomePA R packages 59 and graphite R package setting as universe the expressed genes of the dataset. Pathways with a Benjamini-Hockeberg corrected p-value less than 0.01 were considered enriched 57 . Pathway ID, pathway description, number of differentially expressed genes in pathways, number of differentially expressed genes not in pathway and Adjusted p-value and logarithmic mean of expression fold change were reported in the Supplementary Table 2.
RNA-seq data have been deposited in SRA with the PRJNA669230 accession code.
Shear stress public data retrieving and analysis
We downloaded fastq data from SRA (SRP117215) published by Ajami et al 40 . The dataset studied the longitudinal transcriptional response of endothelial cells to shear stress providing 42 Illumina RNA-seq data at 10 time-points (1, 2, 3, 4, 6, 9, 12, 16, 20, 24 hr) under pulsatile shear and oscillatory shear conditions. Two replicates were provided for each condition timepoint. The expression levels were computed using rsem aligning preprocessed reads with STAR 2.4.1 to the reference genome of Homo sapiens 38 (GRCh38). Expected counts for each sample were collected and genes with zero counts in all samples were filtered out. Row counts were normalized using full between lane normalization as implemented in EDASeq package 55 . Normalized counts have been used for data visualization in Extended Fig. 4a selecting genes PGD (ENSG00000142657) and G6PD (ENSG00000160211).
Cell viability assay
Cell viability experiments were performed using Crystal Violet Staining (CVS). HUVEC and HAEC were seeded in 48-well plates at a density of 3x10⁴cells/well and infected with different lentiviruses (control, G6PDKD, and PGDKD) at a MOI of 100 viral particles/cell. At 24h post-infection, cells were treated with 500 μM R5P or 500 μM Ru5P for 48 hours. At each time point, the medium was aspirated and 0.5% crystal violet (Sigma) staining solution was added to each well, and incubated for 20 min at room temperature on a bench rocker with a frequency of 20 oscillations per minute. The plates were washed four times with water and 200uL of methanol was added to each well. The absorbance of the solution was measured using an Infinite M1000PRO Tecan microplate spectrophotometer at a wavelength of 595 nm.
Cell attachment analysis
Cell attachment analysis was performed as described 60 . To determine the degree of cell attachment, 96 wells plates were incubated in 70 μl of elastin (ELN) (Human Tropoelastin, Biogems Cat. #RT110), diluted to the appropriate concentration in PBS at room temperature for 1 h. Unbound ELN was aspirated, and wells were washed with 2 × 200 μl of PBS. Nonspecific polystyrene binding was blocked with 70 μl of 5 mg/ml heat-denatured bovine serum albumin (BSA) in PBS for 1 h at room temperature.
Aortic smooth muscle cells (AoSMCs) were cultured in smooth muscle cell growth medium SmGM-2. One day before of attachment experiments, the medium was changed to Dulbecco’s modified Eagle’s medium (DMEM) supplemented with 10% FBS. After that, cells were serum-starved in DMEN overnight. AoSMCs were trypsinized by incubating with trypsin-EDTA at 37 °C for 4 min followed by neutralization with an equal volume of 10% FBS-DMEM. The cell suspension was centrifuged at 200 × g for 5 min, and cells were resuspended in DMEM. The cell density was counted and adjusted to 2.5 × 10⁵ cells/ml. The BSA blocking solution was aspirated from the wells and washed with PBS (2 x 200 μl). Next, 200-μl aliquots of cells were added to the wells and incubated at 37 °C in a 5% CO2 incubator for 40 min. Total adherent cells were performed adding the same number of cells to unblocked wells in presence of 10% FBS-DMEM incubated overnight. After incubation, AoSMCs were washed with 200 μL PBS and stained with 0.5 % crystal violet H2O: methanol (4:1). The crystal violet was aspirated, and excess stain was removed with washes of distilled H2O. The crystal violet was solubilized in 100 μl methanol, and the absorbance was measured at 570 nm using Tecan Infinite 200 PRO Microplate Reader. Percentage of adhesion was determined by dividing the O.D. of adherent cells by the O. D. of total adherent cells multiplying by 100.
Transwell migration assay
Cell migration was measured by using transwell migration plates (Corning, #353097). Briefly, one day before of transwell migration assays, the medium was changed to Dulbecco’s modified Eagle’s medium (DMEM) supplemented with 10% FBS. After that, cells were serum-starved in DMEM overnight. AoSMCs were trypsinized by incubating with trypsin-EDTA at 37 °C for 4 min followed by neutralization with an equal volume of 10% FBS-DMEM. The cell suspension was centrifuged at 200 × g for 5 min, and cells were resuspended in DMEM. A number of 7.5 x 10⁴ cells were plated in the top chamber and different concentrations of ELN (1, 10 and 20ug/mL) prepared in DMEM were added in the lower chamber. After overnight incubation, the cells were washed in PBS and fixed in 10% neutral buffered formalin solution for 2 min and stained with 0.5% crystal violet H2O: methanol (4:1). The cells that invaded through the pores to the lower surface of the inserts were photographed under the microscope and the number of migrated cells in the well was quantified using image J software.
Flow cytometric analysis of cell cycle
Control, G6PDKD, and PGDKD HUVEC were harvested 48h after transfection at ~80% confluence. The cells were harvested, washed twice in cold PBS and fixed in 70% ethanol overnight at 4°C. Cells were then centrifuged, washed and incubated with PBS containing 50 μg/ml propidium iodide (Sigma) and 100 μg/ml ribonuclease A for 1h at 37°C. Data were acquired using a BD FACS LSR II flow cytometer and analyzed using ModFit LT™ software.
Shear Stress experiments
Cells were seeded at a density of 5x10⁵ cells/slide on fibronectin-coated chamber slides (Ibidi, #80176) and grown to confluence for 1 day. Confluent cell monolayers were exposed 2 to LSS at a calculated wall shear stress of 18 dynes/cm for the indicated time, using a peristaltic pump (Cole Parmer; EW-07550-10) equipped with a “Masterflex Easy Load Head for precision tubing” pump-head (HV-07516-00), and PharMed BPT L/S 14 tubing. Static cells were cultured in parallel for each experiment.
Real time qRT-PCR
RNA isolation was performed with the TRIzol™ Reagent (Thermo #15596018) according to manufacturer’s instructions. RNA concentration and purity were determined using NanoDrop spectrophotometer at A260 and A280/260, respectively. cDNA was synthesized from 0.5–1 mg of total RNA using High Capacity cDNA Reverse Transcription Kit (Thermo #4368814). qRT-PCR analysis was performed in triplicate using the appropriate primers (Supplementary Table 3) and 5x HOT FIREPol®EvaGreen® qRT-PCR Mix Plus (Solis BioDyne # 08-24-00001) on CFX384 Touch Real-time PCR Detection System (Biorad). Relative quantification was calculated using the 2-ΔΔCT method normalizing to control for fold changes 61 .
Western blotting
Cells were rinsed with ice-cold PBS and collected from culture plates by scraping. Samples were lysed in modified RIPA buffer (Thermo) supplemented with protease and phosphatase inhibitor cocktail (Complete Mini, Roche) for 30 min, and soluble lysate fractions were clarified by centrifugation at 20000g for 10min. 20μg of protein per well was loaded in an SDS-PAGE gel and transferred to a nitrocellulose membrane. After blocking with 5% milk in 1x TBS-T for 1h, the membranes were incubated with the following primary antibodies overnight at 4°C in 1% BSA: VE-Cadherin (CDH5, 1:1000, #AF938, R and D Systems), CDH5 (1:1000, #160840, Cayman Chemical), β-ACTIN AC74 (1:1000, #A5316, Sigma), CYCLINA CY-A1 (1:1000, #C4710, Sigma), RRM2 E7Y9J XP (1:1000, #65939, Cell Signaling Technology), G6PD (1:1000, #12263, Cell Signaling Technology), PGD (1:1000, #PA5-21376, Thermo Fisher Scientific), PGD (1:1000, #ab129199, Abcam), VINCULIN (clone HVIN-1) (1:2000, #V9131, Sigma), ELASTIN (1:500, Calbiochem, #324756). Following the incubation, all membranes were washed prior to incubation with the appropriate horseradish peroxidase (HRP)-conjugated secondary antibodies (IgG) (1:10000, Sigma). For analysis, membranes were incubated with ECL (Clarity Western ECL Substrate, Biorad) and imaged using a ChemiDoc MP system (Biorad). The band intensities on developed films were quantified using Fiji software v2.0
Steady-state metabolomics and metabolic flux analysis
HAEC cell cultures
HAECs (1x10⁷) were plated on gelatin pre-coated 6-wells plates in complete M199 and infected with different lentiviruses (control, G6PDKD, shPGDKD). After 24h, the medium was replaced with complete M199 prepared with dFBS. Metabolites were then isolated as previously described 62 . Specifically, after 48h cells were washed twice with cold PBS and collected with scrapers. Tubes were centrifuged at 1000 g for 10 min at 4 °C and then frozen in liquid nitrogen. Cells were then harvested in 250 μl ice-cold methanol/acetonitrile 1:1 and spun at 20000 g for 5 min at 4 °C. Supernatant were then filtered through a regene rated cellulose filter, dried and resuspended in 100 μl MeOH for subsequent analysis. Metabolomic data were obtained by liquid chromatography coupled to tandem mass spectrometry. We used an API-4000 triple quadrupole mass spectrometer (AB Sciex, Framingham, MA, USA) coupled with a HPLC system (Agilent) and CTC PAL HTS autosampler (PAL System). Cells were smashed in a tissue lyser for 2 min at maximum speed in 250μl of ice-cold methanol/acetonitrile 50:50 containing [U-13C6]-glucose 1ng/μl and [U-13C5]-glutamine 1ng/μl as internal standards. Lysates were spun at 15,000g for 15 min at 4°C and supernatants were then passed through a regenerated cellulose filter (4mm Ø, Sartorius). Samples were then dried under N2 flow at 40°C and resuspended in 125μl of icecold methanol/water 70:30 for subsequent analyses.
Amino acids, their derivatives and biogenic amine quantification was performed through previous derivatization. Briefly, 25μl out of 125μl of samples were collected and dried separately under N2 flow at 40°C. Dried samples were resuspended in 50μl of phenylisothiocyanate (PITC), EtOH, pyridine and water 5%:31.5%:31.5%:31.5% and then incubated for 20 min at RT, dried under N2 flow at 40°C for 90 min and finally resuspended in 100μl of 5mM ammonium acetate in MeOH/H2O 50:50. Quantification of different amino acids was performed by using a C18 column (Biocrates, Innsbruck, Austria) maintained at 50°C. The mobile phases for positive ion mode analysis were phase A: 0.2% formic acid in water and phase B: 0.2% formic acid in acetonitrile. The gradient was T0: 100%A, T5.5: 5%A, T7: 100%A with a flow rate of 500μl/min. All metabolites analysed in the described protocols were previously validated by pure standards and internal standards were used to check instrument sensitivity.
Quantification of energy metabolites was performed on methanolic extracts by using a cyano-phase LUNA column (50mm x 4.6mm, 5μm; Phenomenex) by a 5 min run in negative ion mode The mobile phase A was: water and phase B was: 5mM ammonium acetate in MeOH and the gradient was 10% A and 90% B for all the analysis with a flow rate of 500μl/min.
Acylcarnitines, GSH, GSSG and SAMe quantification was performed on the same samples by using a Varian Pursuit XRs Ultra 2.8 Diphenyl column (Agilent). Samples were analysed by a 5 min run in positive ion mode. Mobile phases were A: 0.1% formic acid in H20 B: 0.1% formic acid in MeOH and the gradient was 15% A and 85% B for all the run.
MultiQuant™ software (version 3.0.3, AB Sciex) was used for data analysis and peak review of chromatograms. Metabolite levels in steady state metabolomics was normalized as previously reported 62–65 . Specifically, metabolomic data were normalized by defining x!¦ļ (relative metabolite area) as calculated in equation 1:
| (1) |
where xn represents the peak areas of metabolite n for samples a, b, …, z, and represents the sum of peak areas of metabolite n for samples a, b, …, z.
Relative metabolite area ( obtained from equation 1) was then divided by the sum of relative metabolite areas analyzed in each sample to obtain the relative metabolite abundance (m), as:
| (2) |
where ∑a=1 a represents the sum of relative metabolite areas 1, 2, …, n for sample a. Obtained data were then transformed by generalized log-transformation and Pareto scaled to correct for heteroscedasticity, reduce the skewness of the data, and reduce mask effects 66 . In detail, obtained values were transformed by generalized log (glog) as calculated in equation 3:
| (3) |
where a is a constant with a default value of 1 and x is the sample area for a given metabolite 67 . Then, obtained values underwent Pareto scaling as calculated in equation 4:
| (4) |
where xij is the transformed value in the data matrix (i (metabolites), j (samples)) and si is the standard deviation of transformed metabolite values 68 . Obtained values were considered as relative metabolite levels. Data processing and analysis were performed by MetaboAnalyst 5.0 web tool 69 .
Metabolic flux analysis was carried out by seeding HAECs (1x10⁵) on gelatin pre-coated 6-wells plates in complete M199 and infected with different lentiviruses (control, G6PDKD, shPGDKD). After 24h, the medium was replaced with complete M199 prepared with dFBS. The following day medium was replaced with freshly prepared complete M199 with dFBS and cells were treated with [1,2-13C2]-glucose 2,5 mM (Sigma-Aldrich, 453188) for 24 h. Quantification of labeled labelled metabolites was performed with the same protocol described above. Data were corrected for the natural abundance of 13C. Specifically, the correction for natural abundance was performed as previously reported for tandem mass spectrometry 70,71 . Briefly, we subtracted the signal of not-labelled cells (mean of two technical replicates for each experimental condition). Then, we analytically corrected the peak areas for tracer purity, 13 C enrichment of the tracer, and natural abundance of carbon atoms by classical correction method.
The complete list of mass spectrometry parameters used for the analysis of metabolites are reported in Supplementary Table 4.
Zebrafish
Steady state metabolomics by liquid chromatography coupled to tandem mass spectrometry. We used an API-3500 triple quadrupole mass spectrometer (AB Sciex, Framingham, MA, USA) coupled with an ExionLC™ ū AC System (AB Sciex). ~30 zebrafish per sample (n) were smashed in a tissue lyser for 2 min at maximum speed in 250μl of ice-cold methanol/water/acetonitrile 55:25:20 containing [U-13C6]-glucose 1ng/μl and [U-13C5]-glutamine 1ng/μl as internal standards. Lysates were spun at 15,000g for 15 min at 4°C and supernatants were then passed through a regenerated cellulose filter (4mm Ø, Sartorius). Samples were then dried under N2 flow at 40°C and resuspended in 125μl of ice-cold methanol/water 70:30 for subsequent analyses.
Amino acids, their derivatives, biogenic amine and acylcarnitines were analyzed as described above. Quantification of energy metabolites was performed by using a cyanophase LUNA column (50mm x 4.6mm, 5μm; Phenomenex) by a 5 min run in negative ion mode with two separated runs. Protocol A: Samples lysed in acetonitrile/methanol were used to analyze lactate, malate, αKetoglutarate, phosphoenolpyruvate (PEP), dihydroxyacetone-P/glyceraldehyde-3P (DHAP/GAP), erytrose-4P (E4P), dTMP, dAMP, dIMP, dCTP, ITP, GTP, sedoheptulose-7P and gluconate-6P. The mobile phase A was: water and phase B was: 5mM ammonium acetate in MeOH and the gradient was 10% A and 90% B for all the analysis with a flow rate of 500μl/min. Protocol B: samples lysed in water/methanol solution were used to analyse 3’, 5’-Cyclic GMP, acetyl-CoA, ADP, AMP, ATP, cAMP, Citrate, CMP, CoA, CTP, dADP, dATP, dCDP, dCMP, dGDP, dGMP, dGTP, dITP, dTTP, dUMP, dUTP, FAD, fructose-1,6-BisP, fumarate, GDP, glucose, glucose-6P, GMP, IMP, iso-citrate, malonyl-CoA, NAD+, NADH, NADP+, NADPH, oxaloacetate, pyruvate, ribose-xylulose-ribulose-5P (R-X-Ru-5P), succinate, succinyl-CoA, UDP, UMP and UTP. The mobile phase A was: water and phase B was: 5mM ammonium acetate in MeOH and the gradient was 50% A and 50% B for all the analysis with a flow rate of 500μl/min. Data were acquired and analyzed as described above.
Generation of g6pd and pgd null zebrafish embryos
The zebrafish lines carrying a mutation in the g6pd and pgd genes were obtained through the Zebrafish Mutation Project (ZMP, Wellcome Trust Sanger Institute) g6pdsa24272 (ZDB-ALT-161003-11894) and pgdsa24360 (ZDB-ALT-131217-17700). Lines were generated with point mutations throughout the genome using classical ENU mutagenesis 72 , followed by association of the induced mutations with protein-coding genes using whole exome sequencing methods 73 . G6pduto71 and pgduto71 and zebrafish mutants were generated by CRISPR/Cas9-mediated genome editing as described in Gagnon et al. 74 . A single guide RNA (sgRNA) was designed using the online tool http://crispor.tefor.net/ based on exon site, high efficacy, and not off-target published algorithms to specifically target an optimal CRISPR sequence on exon 6 of pgd gene (ENSDARG00000015343) and on exon 10 of g6pd gene (ENSDARG00000071065). The pgd-targeting sgRNA, with the specific targeting sequence GGACATGCAGCTGATCTGTG-AGG and the g6pd-targeting sgRNA, with the specific targeting sequence GGTCCCGAAAGGCTCCACTC-AGG were injected in one-cell stage embryos in a solution containing Nls-CAS9 protein (PNA BIO). The mutagenesis efficacy was evaluated on pools of 30 injected embryos, whose genomic DNA was PCR amplified and analyzed via T7 endonuclease system. F0 injected embryos were raised to adulthood and screened, by genotyping the F1, for germline transmission of the mutation. Heterozygous mutants harboring the mutation were then crossed to obtain homozygous mutants.
Heterozygotes and homozygotes for each mutation were identified through a fin-clip based DNA isolation, PCR amplification of the region around the mutation using designed primer sets (Primer 3), and Sanger sequencing using a sequencing primer. Genomic DNA was prepared via HotSHOT protocol 75 . Primer sets and conditions are in Supplementary Table 3.
CRISPR vector for endothelial-specific gene targeting
This method has been described previously in 27 . Briefly, we generated an integratable CRISPR vector for endothelial-specific gene targeting by introducing the fli promoter into the pDestTol2pA2-U6:gRNA (guided RNA; Addgene #63157) by gateway cloning. Verified gRNA target oligos of g6pd, pgd, and elna were designed as indicated in Supplementary Table 3 and inserted into the above plasmid to make the final injection constructs called U6:g6pdgRNA , fli1a:Cas9, U6:pgdgRNA , fli1a:Cas9, and U6:elnagRNA , fli1a:Cas9. These plasmids were injected together with Tol2 mRNA into one-to two-cell-stage embryos. Stable expression of the CRISPR vector induces more penetrant gene inactivation. For U6:g6pdgRNA, fli1a:Cas9, U6:pgdgRNA, fli1a:Cas9, F0 embryos showing mosaic expression of cmlc2:eGFP were raised to adulthood. They were then out-crossed to wild-type AB fish. F1 embryos with eGFP-positive hearts were sorted and analyzed.
Chemical treatment
For the vMCs coverage analysis, zebrafish embryos were treated with the following drugs: 6-AN (Sigma), Physcion (Sigma), CB-839 (Aurogene #S-7655), Etomoxir (Sigma) and AZ67 (TOCRIS #5742) from 48 hpf (hours post fertilization) onward. The myosin ATPase inhibitor 2,3-butanedione 2-monoxime (BDM) (Sigma) was used to block cardiac contraction in the developing embryo as previously published. BDM was dissolved at 4 mM in fish water embryo media and added after the establishing of the embryonic circulation at 30 hpf until 3 dpf (days post fertilization). R5P was injected at 500 mM in once cell stage zebrafish embryos.
Morpholino and mRNA injection
Morpholinos were synthetized from GeneTools (Philomath, OR) and dissolved in nuclease-free water. Morpholinos were injected at one cell-stage in different strains and phenotype was assayed between 72-96 hpf as described. Gene knockdown in zebrafish embryos was performed by microinjection of the following morpholinos: elna/elnb 0.25 mM 43 , gata1 0,5 mM 76 . For elna and elnb genes knockdown, antisense morpholino (MO) oligomers were provided by 43 . elna full length cDNA was cloned in pBKS and provided by 43 . In vitro transcription was performed using mMESSAGE mMACHINE® T7 Transcription Kit (Thermo) following the manufactory protocol and polyadenylated using the Poly(A) Tailing Kit (Thermo # AM1350). The capped and tailed mRNA of elna was purified with the RNA Clean and Concentrator Kit (ZYMO Research, # R1013) and was injected into each embryo at one-cell stage.
T7E1 mutagenesis assay
The eGFP-positive or eGFP-negative embryos for cmcl2 (cardiac myosin light chain 2) were selected from Tg(U6:g6pdgRNA , fli1a:Cas9) and Tg(U6:pgdgRNA , fli1a:Cas9) lines at 2–4 dpf stages and were lysated for genomic DNA extraction in order to be analyzed in a T7E1 assay as described 27 77 . Briefly, the target site-flanking sequence was amplified by PCR using the primers in Supplementary Table 3. The 200-ng PCR product was mixed with 2 μL NEBuffer 2 in a total of 19 mL of volume to run a hybridization reaction in a thermocycler: 5 min, 95°C; ramped down to 85°C at a rate of 2°C/s; and then ramped down to 25°C at a rate of 1°C/s. Then 1 μL of T7E1 enzyme (NEB) was added and incubated at 37°C for 15 min. Finally, the samples were loaded in a 3% agarose gel.
Images acquisition and analysis of zebrafish embryos
Tg(kdrl:eGFP)s843 and Tg (acta2:mCherry)uto5 double transgenic fluorescence in mutant background was visualized under a AZ100 stereomicroscope equipped with AxioCam (Zeiss). Larvae were anaesthetized and mounted in 1% low melting point-agarose gel. Stained tissue/cells were analysed at high resolution with a TCS SP8 confocal microscope (Leica). All images were analyzed with Fiji software (v2.0) or Adobe Photoshop (v20.0), and total signal intensity was calculated, according to previous work 78 . For all images in which the levels of immunostaining were compared, settings for laser excitati on and confocal scanning detection were kept constant between groups. After confocal acquisition, heterozygous and homozygous siblings were genotyped by PCR on DNA extracted from the single larvae, as previously described 74 . For the zebrafish conditional KO experiments, embryos were sorted for eGFP-positive hearts at 24 hpf.
Transmission electron microscopy (TEM) imaging
Embryos were anaesthetized and fixed with 2.5% glutaraldehyde in 0.1 M sodium cacodylate buffer, then dehydrated, embedded in epoxy resin and sectioned, following a standard TEM sample preparation protocol 14 . All steps after fixation were performed by the TEM service of the Department of Biology (University of Padova, Italy).
Isolation of mouse endothelial cells from liver
EC were isolated from livers using magnetic cell sorting system (Miltenyi #130-105-807). First, livers (~0.8g) were dissociated using Dissociation Kit (Miltenyi) according to manufacturer’s instructions. After tissue dissociation, the suspension was passed through a cell strainer (50μm) to remove large tissue fragments and obtain a cellular suspension. Cells were washed by centrifugation at 300g with PBS/EDTA/BSA buffer (PEB buffer) containing phosphate buffer saline (PBS) 1X, pH 7.2, 0.5% bovine serum albumin (BSA) and 2mM EDTA. The cell suspension was depleted for CD45+ cells using CD45 microbeads (Miltenyi #130-052-301); after that, cells were labelled with EC marker CD31 microbeads (Miltenyi #130-097-418) and selected through magnetic cell separation (MACS) columns as recommended by manufacture’s experimental procedure Milteny Biotec.
Isolation of mouse micropulmonary endothelial cells (MPECs)
MPECs were isolated using magnetic cell sorting from mouse lungs. Lungs were rinsed in Hanks’ balanced salt solution and minced into small pieces for digestion with 1mg/mL collagenase A (Sigma, #11088793001) for 20 min at 37°C. The suspension was passed through a cell strainer (50μm), centrifuged and resuspended in PEB buffer. Cell suspensions were counted and incubated with rat monoclonal anti-Mouse CD31 (Pharmigen™, #550274) (10μg of antibody was added per 107 target cells) for 10min at 4°C. After extensive washing with PEB buffer, 1 ml of cell suspension was incubated with the magnetic beads (Dynabeads™ Sheep Anti-Rat IgG, Thermo, # 11035) for 30 min at 4°C on a rocker. Beadbound cells were selected with a magnet, and the supernatant was removed. Three to five washes with PEB buffer were done to remove unbound cells.
Retinal angiogenesis
To analyze postnatal retina angiogenesis, whole mouse eyes were washed in PBS and fixed in 4% PFA on ice for 5 min. Eyes were washed in PBS, and the retinas were dissected and stored in methanol at -80°C. Retinas were permeabilized in 1% BSA and 0.5% Triton X-100 (in PBS) at 4°C overnight. Retinas were rinsed in PBS, washed twice in PBLEC buffer (0.1mM CaCl2, 0.1mM MgCl2, 0.1mM MnCl2 and 1% Triton X-100 in PBS), and incubated in 20μg/ml isolectin GS-IB4 Alexa Fluor TM 488-conjugate (Thermo, #I21411) for 4h at 4°C. Retinas were washed five times for 20 minutes in PBS and left in PBS at 4°C overnight. After blocking in 2% goat serum, 1% BSA and 0.5% Triton X-100 (in PBS) for 1h at room temperature, the retinas were incubated at 4°C overnight in blocking buffer containing the following primary antibodies: Elastin (Abcam #AB9519-500, 1:250) and phospho-Histone H3 (Ser10) (Merck #06-570, 1:400). After five washes with PBS, retinas were incubated with Alexa Fluor 568-conjugated secondary antibodies (1:500) in blocking buffer for 2h at room temperature. Before flat-mounting for imaging, retinas were washed four times for 20 minutes in PBS and partially cut into four leaflets. All quantifications were done on high-resolution confocal images. Endothelial cell area, vessel length and number of branching points were quantified using the Angiotool software (v0.6), considering vascular fields at the angiogenic front in a region between an artery and a vein. All parameters were quantified in a minimum of three vascularized fields per sample.
Mouse and zebrafish embryos dissociation for fluorescence activated cell sorting (FACS)
The protocol for dissociation of zebrafish cells was previously described 79 , however, several modifications were introduced. Zebrafish embryos were dissociated at 2-4 days post fertilization (dpf) using 1x PBS, 0.25% trypsin phenol red free, 1 mM EDTA pH 8.0, 2.2 mg/ml Collagenase P (Sigma). Digestion was stopped by adding CaCl2 to a final concentration of 1 mM and fetal calf serum to 10%. Dissociated cells were rinsed once in PBS and resuspended in Opti-MEM (Gibco), 1% fetal calf serum and 1X PenicillinStreptomycin solution (Sigma). Cells were filtered through a 40 μm nylon membrane.
E10/11 mouse embryos were dissected as follows: single cell suspensions were prepared by enzymatically digesting tissues at 37°C in 1 mg/ml Collagenase A (Sigma) for 30 min, after which tissues were further mechanically disrupted with a P1000 pipette. Cells were subsequently passed over a 40 μm strainer, collagenase washed away with PBS + 10%FBS + 1%P/S (PFP), centrifuged at 1500 g for 5 minutes and resuspended in PFP for flow cytometric antibody staining. Cells were incubated at 4°C for 30 min in PFP with the following directly conjugated antibodies to a final concentration of 2 ug/ml: CD31 (APC Rat Anti-Mouse CD31, cat# 551262, BD Pharmingen) and CD45.2 (CD45.2 PE-Cyanine7, cat.#25-0454-82, eBioscience). Excess of antibodies was washed away with PFP before fluorescence activated cell sorting (FACS). Gates were set based on unstained WT and fluorescence-minus-one (FMO) controls.
Cell sorting was performed with a FACSAria III cell sorter (BD Biosciences, San José, USA) equipped with blue, red, violet and yellow-green lasers. Cells were analyzed by forward scatter (FSC) versus side scatter (SSC) dot plot, selected and sorted by multiple fluorophores, with the following settings: for eGFP a 20 mW 488 nm air-cooled laser, 502 LP 530/30 BP filters; for APC a 17 mW 633 nm laser and 660/20 BP filter; for PE and mCherry a 10 mW 561 nm laser, 582/15 BP filter for PE and 600 LP, 610/20 BP filter for mCherry. A 100 μm nozzle, cell sorter’s purity option at a rate of 10,000 events per second were used. We performed data acquisition and analysis with the BD FACSDiva software (BD Biosciences, San José, CA, USA). Sorted populations were analyzed, showing a sorting purity of a minimum of 95%. Cells were separately collected in resuspension medium, and RNA was extracted using the RNA isolation kit Nucleospin® RNA XS (Macherey-Nagel, # 740902).
Immunofluorescence analyses on mouse embryos
For the whole-mount CD31 mouse embryo immunostaining, somite pairs were counted on fixed embryos which were next dehydrated in 20% sucrose (Sigma; 84100) diluted in PBS (Sigma; D8537) and incubated overnight (O/N) at 4°C. The next day, mouse embryos were washed with PBS and permeabilized in 2.5% BSA, 0.3% Triton X-100 and 5% goat serum (GS) O/N at 4°C. Embryos were washed two times in PBLEC buffer (1% Triton X-100, 1 mM CaCl2, 1 mM MgCl2 and 0,1 mM MnCl2 in PBS pH 6.8) for 20 min and incubated for 48 hours at 4°C in PBLEC containing CD31 (#DIA-310) antibody. Following five washes (20 min each) in PBS, embryos were incubated with secondary antibody (1:500) for 2hours at RT. Embryos were washed five times (20 min each) in PBS at RT and left in PBS for 72 hours at 4°C. Embryos were dehydrated in methanol, rocking in a cold room at 4°C for 10 min in 50% (vol/vol) methanol/PBS and 10 min in 100% methanol. Finally, the methanol was replaced first with 50% methanol/ 50% BABB (three washes of 10 min), and then with 100% BABB (three washes of 10 min) until the sample was clear. Embryos were analyzed using Leica SP8 DLS microscopy.
For mouse aorta staining, after dehydratation, embryos were embedded in optimum cutting medium (OCT; CellPath), frozen in 100% ethanol cold vapor in dry ice. Sections 7-10μm thick were cut using a cryostat. Slides were post-fixed with 1:1 volume of cold methanolacetone for 5 min at room temperature (RT) and washed two times 5 min with PBS. All sections were incubated with a blocking solution (Protein Block; Spring Bioscience, PB-125) for 30min at RT in a humidified container. Sections were next incubated with the primary anti-mouse antibody for SM22/Transgelin (Goat polyclonal, Abcam, ab10135; 1:100) diluted in antibody diluent, overnight at 4°C. Negative control sections were only incubated with the antibody diluent solution. On the following day, slides were washed two times 5 min with PBS at RT and a secondary antibody, AF488 (Donkey anti-Goat; Invitrogen, A-11055; 1:250) was added for 1h at RT in a dark and humified container. Slides were washed with PBS and incubated with anti-mouse primary antibodies αSMA (Cy3; Sigma; C6198-.2ml; 1:100) and the biotinylated CD31 (BD Pharmingen; 553371; 1:50) diluted in 5% goat serum diluted in PBS (PBS/GS) for 2h at RT in a dark and humidified container. Negative control sections were only incubated with PBS/GS solution. Following this step, all sections were washed with PBS then incubated with streptavidin AF647 (Life Technologies; S21374; 1:250) for 30 min at RT. After a new wash with PBS, all sections were incubated with DAPI (1:500; Thermofisher Scientific; D1306) for 15 min at RT, washed, and mounted using Fluoromount-G (Southern Biotech; 0100-01) and coverslips. Stained sections were kept at 4°C in a dry box in the dark for a minimum of 24h then imaged using an inverted widefield fluorescence microscope (Zeiss Observer) and analyzed with Zen (v. 2.6 Lite) for images taken at 20x magnification and ImageJ/Fiji (v.1.52p) after a step of deconvolution in Hyugens Professional (v.19.10) for images at 40x and 63x magnification. For ERG and ELASTIN-stained slides, an alternative protocol was used. Slides were incubated with the primary antibody for Elastin (1:100, #AB9519-500, Abcam), ERG (1:200, #ab92513, Abcam), and αSMA (1:100, #GTX100034, Genetex) diluted in PBS/GS overnight at 4°C. Negative control sections were only incubated with PBS/GS solution. On the following day, slides were washed two times for 5 min with PBS at RT and a secondary antibody was added for 1 h at RT in a dark and humified container.
Statistics and reproducibility
Statistical analysis was performed in GraphPad Prism v8.2.1. All data were based with independent biological replicates (n), except for flux metabolomics and RNAseq data, which were based on independent biological replicates collected in a single experiment. Experimental repetitions in cell culture were carried out by thawing a new aliquot of cells derived from the original stock. The Shapiro-Wilk normality test was used to confirm the normality of the data. If the data passed the normality test (alpha = 0.05), then a parametric test, such as unpaired t test or ordinary one-way ANOVA (in the case of multiple comparisons) was used. If the data did not pass the normality test, a non-parametric test was used (Mann-Whitney test or Kruskal-Wallis test for multiple comparisons). To correct for multiple comparisons either Tukey’s multiple comparisons test (for ordinary one-way ANOVA) or Dunnet’s multiple comparisons test (for Kruskal-Wallis test) was used. The individual statistical tests used for experiments are mentioned in the corresponding figure legends. The exact value of sample size (n) is given in the figure legends and for in vivo/in vitro experiments indicates the number of animals/samples. Data are presented as mean and single points with standard error of the mean (SEM) or standard deviation (SD) as indicated in the figure legends. Metabolomics data were analysed by MetaboAnalyst web tool. Briefly, multiple parametric t-test followed by false discovery rate (FDR) correction was performed to identify significantly different metabolites. FDR threshold was set to 10%.
Extended Data
Extended Data Fig. 1.
Extended Data Fig. 2.
Extended Data Fig. 3.
Extended Data Fig. 4.
Extended Data Fig. 5.
Extended Data Fig. 6.
Extended Data Fig. 7.
Extended Data Fig. 8.
Extended Data Fig. 9.
Extended Data Fig. 10.
Supplementary Material
Acknowledgments
Research in the lab of MMS is supported by the European Research Council (ERC) Consolidator Grant-Rendox (ERC-CoG 647057) and AIRC (Associazione Italiana Ricerca sul Cancro) IG Grant 20119. NF was supported by a fellowship by Fondazione Umberto Veronesi. EC is supported by AIRC MFAG 23522. MC is supported by the Association Française contre la Myopathie (AFM, 22134/6744359/I1 90311-2308) and by the Welcome Trust/Institutional Strategic Support Fund (ISSF, 199MCR/J22739). We thank Davide Vigetti for reagents, Stephanie Herkenne for neonatal retina angiogenesis experiments, Francesco Boldrin for TEM analyses, Luigi Pivotti and Shkendy Iljazi for zebrafish handling, Elena Marchesan for assistance in figure design, Anna Cabrelle for technical support with FACS sorting and Yvan Marc for immunostaining. We thank Ellen Jane Corcoran for editorial and language assistance.
Footnotes
Authors contributions
MMS conceived the concept of the study, provided supervision and wrote the manuscript.
MMS and NF were involved in the experimental design and drafting the manuscript.
NF contributed to the execution, support and analysis of experiments, and/or provided advice.
RO performed AoSMC migration and adhesion as well as metabolic experiments.
NF and MAs performed zebrafish and cell culture experiments.
NF, MAs, MS carried out mouse experiments and assays.
MAs and NF performed LSS and retina angiogenesis experiments.
MAu and NM performed the metabolomics analyses.
EC performed bioinformatic analyses.
MC and MM as well as NF and MS performed Pgd mouse embryo freezing, sectioning, immunostaining, and analysis.
All authors agreed on the final version of the manuscript.
Competing interests
The authors declare no competing interests
Data Availability
Expression data that support the findings of this study have been deposited in GEO with the accession code PRJNA669230 (https://www.ncbi.nlm.nih.gov/sra/?term=PRJNA669230) with any restriction to access. In our article we also included public available gene expression data deposited in GEO with the accession code GSE103672 (https://www.ncbi.nlm.nih.gov/geo/query/acc.cgi?acc=GSE103672), made available by 80 . Homo sapiens 38 (GRCh38) was used as reference genome.
References
- 1.Adams RH, Alitalo K. Molecular regulation of angiogenesis and lymphangiogenesis. Nat Rev Mol Cell Biol. 2007;8:464–478. doi: 10.1038/nrm2183. [DOI] [PubMed] [Google Scholar]
- 2.Herbert SP, Stainier DY. Molecular control of endothelial cell behaviour during blood vessel morphogenesis. Nat Rev Mol Cell Biol. 2011;12:551–564. doi: 10.1038/nrm3176. [DOI] [PMC free article] [PubMed] [Google Scholar]
- 3.Potente M, Makinen T. Vascular heterogeneity and specialization in development and disease. Nat Rev Mol Cell Biol. 2017;18:477–494. doi: 10.1038/nrm.2017.36. [DOI] [PubMed] [Google Scholar]
- 4.Jain RK. Molecular regulation of vessel maturation. Nat Med. 2003;9:685–693. doi: 10.1038/nm0603-685. [DOI] [PubMed] [Google Scholar]
- 5.Bergers G, Song S. The role of pericytes in blood-vessel formation and maintenance. Neuro Oncol. 2005;7:452–464. doi: 10.1215/S1152851705000232. [DOI] [PMC free article] [PubMed] [Google Scholar]
- 6.Davis GE, Senger DR. Endothelial extracellular matrix: biosynthesis, remodeling, and functions during vascular morphogenesis and neovessel stabilization. Circ Res. 2005;97:1093–1107. doi: 10.1161/01.RES.0000191547.64391.e3. [DOI] [PubMed] [Google Scholar]
- 7.Mack CP. Signaling mechanisms that regulate smooth muscle cell differentiation. Arterioscler Thromb Vasc Biol. 2011;31:1495–1505. doi: 10.1161/ATVBAHA.110.221135. [DOI] [PMC free article] [PubMed] [Google Scholar]
- 8.Armulik A, Genove G, Betsholtz C. Pericytes: developmental, physiological, and pathological perspectives, problems, and promises. Dev Cell. 2011;21:193–215. doi: 10.1016/j.devcel.2011.07.001. [DOI] [PubMed] [Google Scholar]
- 9.Ando K, et al. Peri-arterial specification of vascular mural cells from naive mesenchyme requires Notch signaling. Development. 2019;146 doi: 10.1242/dev.165589. [DOI] [PMC free article] [PubMed] [Google Scholar]
- 10.Li X, Carmeliet P. Targeting angiogenic metabolism in disease. Science. 2018;359:1335–1336. doi: 10.1126/science.aar5557. [DOI] [PubMed] [Google Scholar]
- 11.Potente M, Carmeliet P. The Link Between Angiogenesis and Endothelial Metabolism. Annu Rev Physiol. 2017;79:43–66. doi: 10.1146/annurev-physiol-021115-105134. [DOI] [PubMed] [Google Scholar]
- 12.Stincone A, et al. The return of metabolism: biochemistry and physiology of the pentose phosphate pathway. Biol Rev Camb Philos Soc. 2015;90:927–963. doi: 10.1111/brv.12140. [DOI] [PMC free article] [PubMed] [Google Scholar]
- 13.Gaengel K, Genove G, Armulik A, Betsholtz C. Endothelial-mural cell signaling in vascular development and angiogenesis. Arterioscler Thromb Vasc Biol. 2009;29:630–638. doi: 10.1161/ATVBAHA.107.161521. [DOI] [PubMed] [Google Scholar]
- 14.Santoro MM, Pesce G, Stainier DY. Characterization of vascular mural cells during zebrafish development. Mech Dev. 2009;126:638–649. doi: 10.1016/j.mod.2009.06.1080. [DOI] [PMC free article] [PubMed] [Google Scholar]
- 15.Stratman AN, et al. Interactions between mural cells and endothelial cells stabilize the developing zebrafish dorsal aorta. Development. 2017;144:115–127. doi: 10.1242/dev.143131. [DOI] [PMC free article] [PubMed] [Google Scholar]
- 16.Whitesell TR, et al. foxc1 is required for embryonic head vascular smooth muscle differentiation in zebrafish. Dev Biol. 2019;453:34–47. doi: 10.1016/j.ydbio.2019.06.005. [DOI] [PubMed] [Google Scholar]
- 17.Santoro MM. Zebrafish as a model to explore cell metabolism. Trends Endocrinol Metab. 2014;25:546–554. doi: 10.1016/j.tem.2014.06.003. [DOI] [PubMed] [Google Scholar]
- 18.Schlegel A, Gut P. Metabolic insights from zebrafish genetics, physiology, and chemical biology. Cell Mol Life Sci. 2015;72:2249–2260. doi: 10.1007/s00018-014-1816-8. [DOI] [PMC free article] [PubMed] [Google Scholar]
- 19.Ando K, et al. Clarification of mural cell coverage of vascular endothelial cells by live imaging of zebrafish. Development. 2016;143:1328–1339. doi: 10.1242/dev.132654. [DOI] [PMC free article] [PubMed] [Google Scholar]
- 20.Chen X, Gays D, Milia C, Santoro MM. Cilia Control Vascular Mural Cell Recruitment in Vertebrates. Cell Rep. 2017;18:1033–1047. doi: 10.1016/j.celrep.2016.12.044. [DOI] [PMC free article] [PubMed] [Google Scholar]
- 21.Panieri E, Millia C, Santoro MM. Real-time quantification of subcellular H2O2 and glutathione redox potential in living cardiovascular tissues. Free Radic Biol Med. 2017;109:189–200. doi: 10.1016/j.freeradbiomed.2017.02.022. [DOI] [PubMed] [Google Scholar]
- 22.Lin R, et al. 6-Phosphogluconate dehydrogenase links oxidative PPP, lipogenesis and tumour growth by inhibiting LKB1-AMPK signalling. Nat Cell Biol. 2015;17:1484–1496. doi: 10.1038/ncb3255. [DOI] [PMC free article] [PubMed] [Google Scholar]
- 23.Hall CJ, et al. Blocking fatty acid-fueled mROS production within macrophages alleviates acute gouty inflammation. J Clin Invest. 2018;128:1752–1771. doi: 10.1172/JCI94584. [DOI] [PMC free article] [PubMed] [Google Scholar]
- 24.Rumping L, et al. GLS hyperactivity causes glutamate excess, infantile cataract and profound developmental delay. Hum Mol Genet. 2019;28:96–104. doi: 10.1093/hmg/ddy330. [DOI] [PubMed] [Google Scholar]
- 25.Burmistrova O, et al. Targeting PFKFB3 alleviates cerebral ischemia-reperfusion injury in mice. Scientific Reports. 2019;9:11670. doi: 10.1038/s41598-019-48196-z. [DOI] [PMC free article] [PubMed] [Google Scholar]
- 26.Gays D, et al. An exclusive cellular and molecular network governs intestinal smooth muscle cell differentiation in vertebrates. Development (Cambridge) 2017;144:464–478. doi: 10.1242/dev.133926. [DOI] [PubMed] [Google Scholar]
- 27.Ablain J, Durand EM, Yang S, Zhou Y, Zon LI. A CRISPR/Cas9 vector system for tissue-specific gene disruption in zebrafish. Dev Cell. 2015;32:756–764. doi: 10.1016/j.devcel.2015.01.032. [DOI] [PMC free article] [PubMed] [Google Scholar]
- 28.Payne S, De Val S, Neal A. Endothelial-Specific Cre Mouse Models. Arterioscler Thromb Vasc Biol. 2018;38:2550–2561. doi: 10.1161/ATVBAHA.118.309669. [DOI] [PMC free article] [PubMed] [Google Scholar]
- 29.Ozerdem U, Grako KA, Dahlin-Huppe K, Monosov E, Stallcup WB. NG2 proteoglycan is expressed exclusively by mural cells during vascular morphogenesis. Dev Dyn. 2001;222:218–227. doi: 10.1002/dvdy.1200. [DOI] [PubMed] [Google Scholar]
- 30.Etchegaray JP, Mostoslavsky R. Interplay between Metabolism and Epigenetics: A Nuclear Adaptation to Environmental Changes. Mol Cell. 2016;62:695–711. doi: 10.1016/j.molcel.2016.05.029. [DOI] [PMC free article] [PubMed] [Google Scholar]
- 31.Janke R, Dodson AE, Rine J. Metabolism and epigenetics. Annu Rev Cell Dev Biol. 2015;31:473–496. doi: 10.1146/annurev-cellbio-100814-125544. [DOI] [PMC free article] [PubMed] [Google Scholar]
- 32.Abdul-Wahed A, Guilmeau S, Postic C. Sweet Sixteenth for ChREBP: Established Roles and Future Goals. Cell Metab. 2017;26:324–341. doi: 10.1016/j.cmet.2017.07.004. [DOI] [PubMed] [Google Scholar]
- 33.Li DY, et al. Elastin is an essential determinant of arterial morphogenesis. Nature. 1998;393:276–280. doi: 10.1038/30522. [DOI] [PubMed] [Google Scholar]
- 34.Wagenseil JE, Mecham RP. Vascular extracellular matrix and arterial mechanics. Physiol Rev. 2009;89:957–989. doi: 10.1152/physrev.00041.2008. [DOI] [PMC free article] [PubMed] [Google Scholar]
- 35.Karnik SK, et al. A critical role for elastin signaling in vascular morphogenesis and disease. Development. 2003;130:411–423. doi: 10.1242/dev.00223. [DOI] [PubMed] [Google Scholar]
- 36.Davis EC. Smooth muscle cell to elastic lamina connections in developing mouse aorta. Role in aortic medial organization. Lab Invest. 1993;68:89–99. [PubMed] [Google Scholar]
- 37.Wang Y, et al. Ephrin-B2 controls VEGF-induced angiogenesis and lymphangiogenesis. Nature. 2010;465:483–486. doi: 10.1038/nature09002. [DOI] [PubMed] [Google Scholar]
- 38.le Noble F, et al. Flow regulates arterial-venous differentiation in the chick embryo yolk sac. Development. 2004;131:361–375. doi: 10.1242/dev.00929. [DOI] [PubMed] [Google Scholar]
- 39.Boselli F, Freund JB, Vermot J. Blood flow mechanics in cardiovascular development. Cell Mol Life Sci. 2015;72:2545–2559. doi: 10.1007/s00018-015-1885-3. [DOI] [PMC free article] [PubMed] [Google Scholar]
- 40.Ajami NE, et al. Systems biology analysis of longitudinal functional response of endothelial cells to shear stress. Proceedings of the National Academy of Sciences. 2017;114:10990–10995. doi: 10.1073/pnas.1707517114. [DOI] [PMC free article] [PubMed] [Google Scholar]
- 41.Espinosa MG, Taber LA, Wagenseil JE. Reduced embryonic blood flow impacts extracellular matrix deposition in the maturing aorta. Dev Dyn. 2018;247:914–923. doi: 10.1002/dvdy.24635. [DOI] [PMC free article] [PubMed] [Google Scholar]
- 42.De Luca E, et al. ZebraBeat: a flexible platform for the analysis of the cardiac rate in zebrafish embryos. Scientific Reports. 2014;4:4898. doi: 10.1038/srep04898. [DOI] [Google Scholar]
- 43.Moriyama Y, et al. Evolution of the fish heart by sub/neofunctionalization of an elastin gene. Nat Commun. 2016;7:10397. doi: 10.1038/ncomms10397. [DOI] [PMC free article] [PubMed] [Google Scholar]
- 44.Nordlund P, Reichard P. Ribonucleotide reductases. Annu Rev Biochem. 2006;75:681–706. doi: 10.1146/annurev.biochem.75.103004.142443. [DOI] [PubMed] [Google Scholar]
- 45.Li MV, et al. Glucose-6-phosphate mediates activation of the carbohydrate responsive binding protein (ChREBP) Biochem Biophys Res Commun. 2010;395:395–400. doi: 10.1016/j.bbrc.2010.04.028. [DOI] [PMC free article] [PubMed] [Google Scholar]
- 46.Stoltzman CA, Kaadige MR, Peterson CW, Ayer DE. MondoA senses non-glucose sugars: regulation of thioredoxin-interacting protein (TXNIP) and the hexose transport curb. J Biol Chem. 2011;286:38027–38034. doi: 10.1074/jbc.M111.275503. [DOI] [PMC free article] [PubMed] [Google Scholar]
- 47.Mattila J, et al. Mondo-Mlx Mediates Organismal Sugar Sensing through the Gli-Similar Transcription Factor Sugarbabe. Cell Rep. 2015;13:350–364. doi: 10.1016/j.celrep.2015.08.081. [DOI] [PubMed] [Google Scholar]
- 48.Cairo S, Merla G, Urbinati F, Ballabio A, Reymond A. WBSCR14, a gene mapping to the Williams--Beuren syndrome deleted region, is a new member of the Mlx transcription factor network. Hum Mol Genet. 2001;10:617–627. doi: 10.1093/hmg/10.6.617. [DOI] [PubMed] [Google Scholar]
- 49.Kimmel CB, Ballard WW, Kimmel SR, Ullmann B, Schilling TF. Stages of embryonic development of the zebrafish. Dev Dyn. 1995;203:253–310. doi: 10.1002/aja.1002030302. [DOI] [PubMed] [Google Scholar]
- 50.Braren R, et al. Endothelial FAK is essential for vascular network stability, cell survival, and lamellipodial formation. J Cell Biol. 2006;172:151–162. doi: 10.1083/jcb.200506184. [DOI] [PMC free article] [PubMed] [Google Scholar]
- 51.Claxton S, et al. Efficient, inducible Cre-recombinase activation in vascular endothelium. Genesis. 2008;46:74–80. doi: 10.1002/dvg.20367. [DOI] [PubMed] [Google Scholar]
- 52.Martin M. Cutadapt removes adapter sequences from high-throughput sequencing reads. EMBnet journal. 2011;17:10–12. [Google Scholar]
- 53.Dobin A, et al. STAR: ultrafast universal RNA-seq aligner. Bioinformatics. 2013;29:15–21. doi: 10.1093/bioinformatics/bts635. [DOI] [PMC free article] [PubMed] [Google Scholar]
- 54.Li H, et al. The Sequence Alignment/Map format and SAMtools. Bioinformatics. 2009;25:2078–2079. doi: 10.1093/bioinformatics/btp352. [DOI] [PMC free article] [PubMed] [Google Scholar]
- 55.Risso D, Schwartz K, Sherlock G, Dudoit S. GC-content normalization for RNA-Seq data. BMC bioinformatics. 2011;12:480. doi: 10.1186/1471-2105-12-480. [DOI] [PMC free article] [PubMed] [Google Scholar]
- 56.Robinson MD, Smyth GK. Moderated statistical tests for assessing differences in tag abundance. Bioinformatics. 2007;23:2881–2887. doi: 10.1093/bioinformatics/btm453. [DOI] [PubMed] [Google Scholar]
- 57.Benjamini Y, Hochberg Y. Controlling the false discovery rate: a practical and powerful approach to multiple testing. Journal of the Royal statistical society: series B (Methodological) 1995;57:289–300. [Google Scholar]
- 58.Yu G, Wang L-G, Han Y, He Q-Y. clusterProfiler: an R package for comparing biological themes among gene clusters. Omics: a journal of integrative biology. 2012;16:284–287. doi: 10.1089/omi.2011.0118. [DOI] [PMC free article] [PubMed] [Google Scholar]
- 59.Yu G, He Q-Y. ReactomePA: an R/Bioconductor package for reactome pathway analysis and visualization. Molecular BioSystems. 2016;12:477–479. doi: 10.1039/c5mb00663e. [DOI] [PubMed] [Google Scholar]
- 60.Bax DV, Rodgers UR, Bilek MM, Weiss AS. Cell adhesion to tropoelastin is mediated via the C-terminal GRKRK motif and integrin alphaVbeta3. J Biol Chem. 2009;284:28616–28623. doi: 10.1074/jbc.M109.017525. [DOI] [PMC free article] [PubMed] [Google Scholar]
- 61.Donninger H, et al. Whole genome expression profiling of advance stage papillary serous ovarian cancer reveals activated pathways. Oncogene. 2004;23:8065–8077. doi: 10.1038/sj.onc.1207959. [DOI] [PubMed] [Google Scholar]
- 62.Audano M, et al. Zc3h10 regulates adipogenesis by controlling translation and F-actin/mitochondria interaction. Journal of Cell Biology. 2021;220 doi: 10.1083/jcb.202003173. [DOI] [PMC free article] [PubMed] [Google Scholar]
- 63.Magni G, et al. Glial cell activation and altered metabolic profile in the spinal-trigeminal axis in a rat model of multiple sclerosis associated with the development of trigeminal sensitization. Brain Behav Immun. 2020;89:268–280. doi: 10.1016/j.bbi.2020.07.001. [DOI] [PubMed] [Google Scholar]
- 64.Palma C, et al. Caloric Restriction Promotes Immunometabolic Reprogramming Leading to Protection from Tuberculosis. Cell Metab. 2021;33:300–318.:e312. doi: 10.1016/j.cmet.2020.12.016. [DOI] [PubMed] [Google Scholar]
- 65.M A, et al. Mitochondrial Dysfunction Increases Fatty Acid β-Oxidation and Translates Into Impaired Neuroblast Maturation. FEBS letters. 2019;593 doi: 10.1002/1873-3468.13584. [DOI] [PubMed] [Google Scholar]
- 66.Ghaffari MH, et al. Metabolomics meets machine learning: Longitudinal metabolite profiling in serum of normal versus overconditioned cows and pathway analysis. J Dairy Sci. 2019;102:11561–11585. doi: 10.3168/jds.2019-17114. [DOI] [PubMed] [Google Scholar]
- 67.Durbin BP, Hardin JS, Hawkins DM, Rocke DM. A variance-stabilizing transformation for gene-expression microarray data. Bioinformatics. 2002;18(Suppl 1):S105–110. doi: 10.1093/bioinformatics/18.suppl_1.s105. [DOI] [PubMed] [Google Scholar]
- 68.van den Berg RA, Hoefsloot HC, Westerhuis JA, Smilde AK, van der Werf MJ. Centering, scaling, and transformations: improving the biological information content of metabolomics data. BMC Genomics. 2006;7:142. doi: 10.1186/1471-2164-7-142. [DOI] [PMC free article] [PubMed] [Google Scholar]
- 69.Chong J, Wishart DS, Xia J. Using MetaboAnalyst 4.0 for Comprehensive and Integrative Metabolomics Data Analysis. Curr Protoc Bioinformatics. 2019;68:e86. doi: 10.1002/cpbi.86. [DOI] [PubMed] [Google Scholar]
- 70.Heinrich P, et al. Correcting for natural isotope abundance and tracer impurity in MS-, MS/MS- and high-resolution-multiple-tracer-data from stable isotope labeling experiments with IsoCorrectoR. Sci Rep. 2018;8:17910. doi: 10.1038/s41598-018-36293-4. [DOI] [PMC free article] [PubMed] [Google Scholar]
- 71.Midani FS, Wynn ML, Schnell S. The importance of accurately correcting for the natural abundance of stable isotopes. Anal Biochem. 2017;520:27–43. doi: 10.1016/j.ab.2016.12.011. [DOI] [PMC free article] [PubMed] [Google Scholar]
- 72.Haffter P, et al. The identification of genes with unique and essential functions in the development of the zebrafish, Danio rerio. Development. 1996;123:1–36. doi: 10.1242/dev.123.1.1. [DOI] [PubMed] [Google Scholar]
- 73.Kettleborough RN, et al. A systematic genome-wide analysis of zebrafish proteincoding gene function. Nature. 2013;496:494–497. doi: 10.1038/nature11992. [DOI] [PMC free article] [PubMed] [Google Scholar]
- 74.Gagnon JA, et al. Efficient mutagenesis by Cas9 protein-mediated oligonucleotide insertion and large-scale assessment of single-guide RNAs. PLoS One. 2014;9:e98186. doi: 10.1371/journal.pone.0098186. [DOI] [PMC free article] [PubMed] [Google Scholar]
- 75.Meeker ND, Hutchinson SA, Ho L, Trede NS. Method for isolation of PCR-ready genomic DNA from zebrafish tissues. Biotechniques. 2007;43:610, 612, 614. doi: 10.2144/000112619. [DOI] [PubMed] [Google Scholar]
- 76.Mugoni V, et al. Ubiad1 is an antioxidant enzyme that regulates eNOS activity by CoQ10 synthesis. Cell. 2013;152:504–518. doi: 10.1016/j.cell.2013.01.013. [DOI] [PMC free article] [PubMed] [Google Scholar]
- 77.Kim HJ, Lee HJ, Kim H, Cho SW, Kim JS. Targeted genome editing in human cells with zinc finger nucleases constructed via modular assembly. Genome Res. 2009;19:1279–1288. doi: 10.1101/gr.089417.108. [DOI] [PMC free article] [PubMed] [Google Scholar]
- 78.Facchinello N, Schiavone M, Vettori A, Argenton F, Tiso N. Monitoring Wnt Signaling in Zebrafish Using Fluorescent Biosensors. Methods Mol Biol. 2016;1481:81–94. doi: 10.1007/978-1-4939-6393-5_9. [DOI] [PubMed] [Google Scholar]
- 79.Covassin L, et al. Global analysis of hematopoietic and vascular endothelial gene expression by tissue specific microarray profiling in zebrafish. Dev Biol. 2006;299:551–562. doi: 10.1016/j.ydbio.2006.08.020. [DOI] [PMC free article] [PubMed] [Google Scholar]
- 80.Adami M, et al. Simvastatin ointment, a new treatment for skin inflammatory conditions. J Dermatol Sci. 2012;66:127–135. doi: 10.1016/j.jdermsci.2012.02.015. [DOI] [PubMed] [Google Scholar]
Associated Data
This section collects any data citations, data availability statements, or supplementary materials included in this article.
Supplementary Materials
Data Availability Statement
Expression data that support the findings of this study have been deposited in GEO with the accession code PRJNA669230 (https://www.ncbi.nlm.nih.gov/sra/?term=PRJNA669230) with any restriction to access. In our article we also included public available gene expression data deposited in GEO with the accession code GSE103672 (https://www.ncbi.nlm.nih.gov/geo/query/acc.cgi?acc=GSE103672), made available by 80 . Homo sapiens 38 (GRCh38) was used as reference genome.


