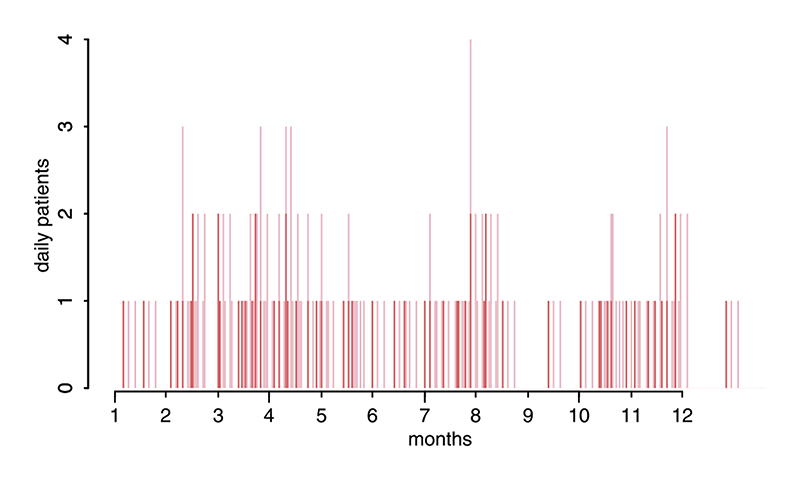
Fig. 2.
Example patient presentation dates in a low throughput clinic with an average of 5 new patients presenting monthly. Red bars show dates patients initiated PEP and pink bars correspond to subsequent return dates following the 1-week 2-site ID regimen. In this example 140 vials are used with vials shared on days with 2 or more patient presentations. In this situation because of vial sharing 20% fewer vials are used than if no vials were shared. (For interpretation of the references to colour in this figure legend, the reader is referred to the web version of this article.)

