Abstract
FAT1, which encodes a protocadherin, is one of the most frequently mutated genes in human cancers 1–5 . However, the role and the molecular mechanisms by which FAT1 mutations control tumour initiation and progression are poorly understood. Here, using mouse models of skin squamous cell carcinoma and lung tumours, we found that deletion of Fat1 accelerates tumour initiation and malignant progression and promotes a hybrid epithelial-to-mesenchymal transition (EMT) phenotype. We also found this hybrid EMT state in FAT1-mutated human squamous cell carcinomas. Skin squamous cell carcinomas in which Fat1 was deleted presented increased tumour stemness and spontaneous metastasis. We performed transcriptional and chromatin profiling combined with proteomic analyses and mechanistic studies, which revealed that loss of function of FAT1 activates a CAMK2–CD44–SRC axis that promotes YAP1 nuclear translocation and ZEB1 expression that stimulates the mesenchymal state. This loss of function also inactivates EZH2, promoting SOX2 expression, which sustains the epithelial state. Our comprehensive analysis identified drug resistance and vulnerabilities in FAT1-deficient tumours, which have important implications for cancer therapy. Our studies reveal that, in mouse and human squamous cell carcinoma, loss of function of FAT1 promotes tumour initiation, progression, invasiveness, stemness and metastasis through the induction of a hybrid EMT state.
FAT1 is very frequently mutated in a broad range of human cancers—in particular, in squamous cell carcinomas (SCCs) 1–5 . Mutations in FAT1 have previously been associated with poor clinical outcome and resistance to anti-cancer therapy 6 . In skin SCCs induced by the chemical carcinogen 7,12-dimethylbenz[a]-anthracene (DMBA) in combination with 12-O-tetradecanoylphorbol-13-acetate (TPA) (hereafter, DMBA/TPA), Fat1 is mutated in about 20% of cases 7 , as in human SCCs. Stop–gain mutations are very frequently found, which indicates that these mutations result in loss of function (LOF) and that FAT1 acts as a tumour-suppressor gene 1,4,8 . Knockdown of FAT1 using short hairpin RNA in human cancer cell lines has previously been shown to decrease cell–cell adhesion and promote cell migration, whereas contradictory results have been obtained regarding the role of FAT1 in regulating EMT in vitro 9,10 . However, a formal in vivo demonstration by a genetic LOF experiment that shows that Fat1 acts as a tumour-suppressor gene is lacking. More importantly, the molecular mechanisms by which mutations in FAT1 promote tumorigenesis and control tumour heterogeneity in vivo are completely unknown.
Fat1 deletion promotes malignant progression
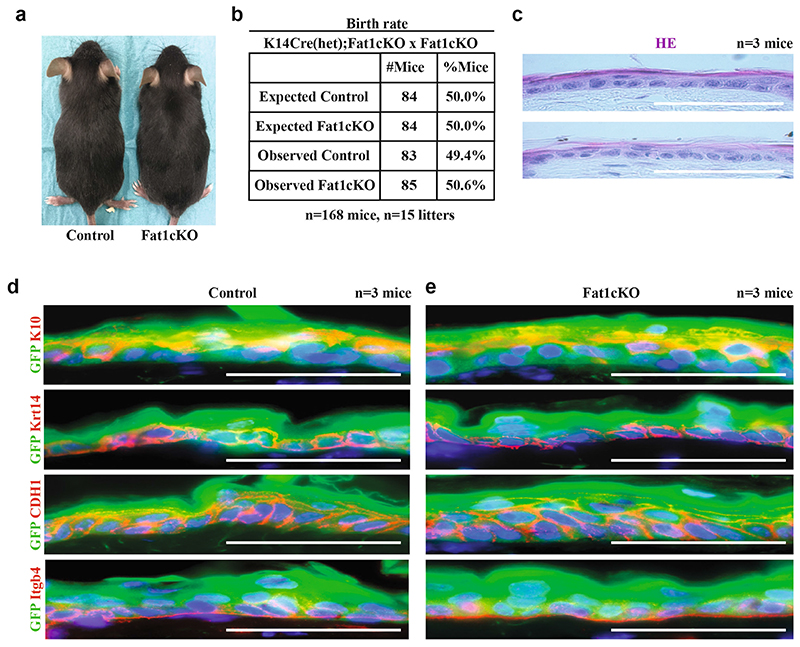
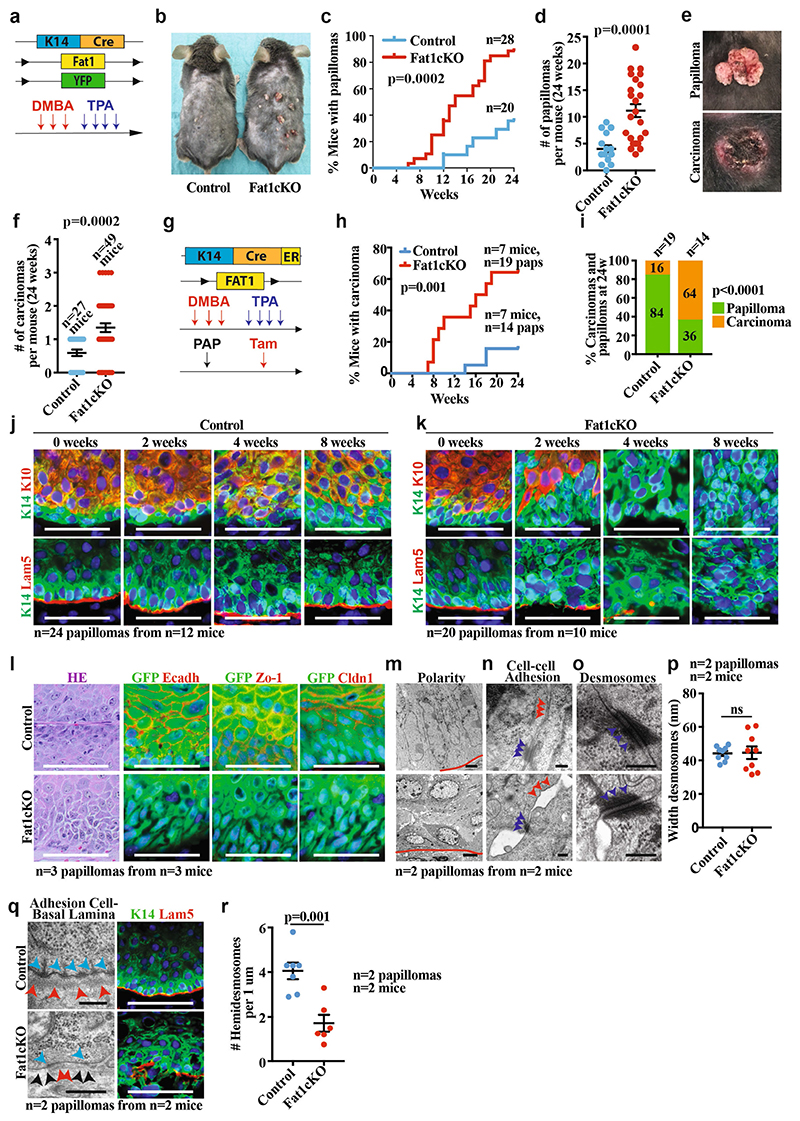
To assess whether Fat1 LOF promotes tumour initiation, we performed conditional deletion of Fat1 in the skin epidermis using the constitutive Krt14-cre (Krt14-cre;Fat1flox/flox;Rosa26YFP/+ ; hereafter referred to as Fat1-constitutive knockout (Fat1-cKO)) mouse model. Fat1-cKO mice were born at a Mendelian ratio and did not present skin abnormalities (Extended Data Fig. 1). Following administration of DMBA/TPA, tumorigenesis developed more rapidly: the number of benign and malignant tumours per mouse was increased in Fat1-cKO mice, which demonstrates that Fat1 acts a tumour-suppressor gene in DMBA/TPA-induced skin SCCs (Extended Data Fig. 2a–f). To assess the role of FAT1 in regulating malignant progression, we performed acute deletion of Fat1 in benign papillomas using inducible Krt14-creER (Krt14-creER; Fat1flox/flox;Rosa26YFP/+ ). Immunostaining and electron microscopy analyses revealed that after deletion of Fat1, the polarity of the basal cells as well as the adherens and tight junctions were rapidly lost, the basal lamina became discontinued, the hemidesmosomes were decreased and KRT10 expression—characteristic of benign tumour differentiation—was rapidly lost (Extended Data Fig. 2j–r).
These data demonstrate that Fat1 deletion promotes malignant progression by controlling cell polarity and adhesion between tumour cells, and between tumour cells and the extracellular matrix.
Fat1 deletion promotes a hybrid EMT
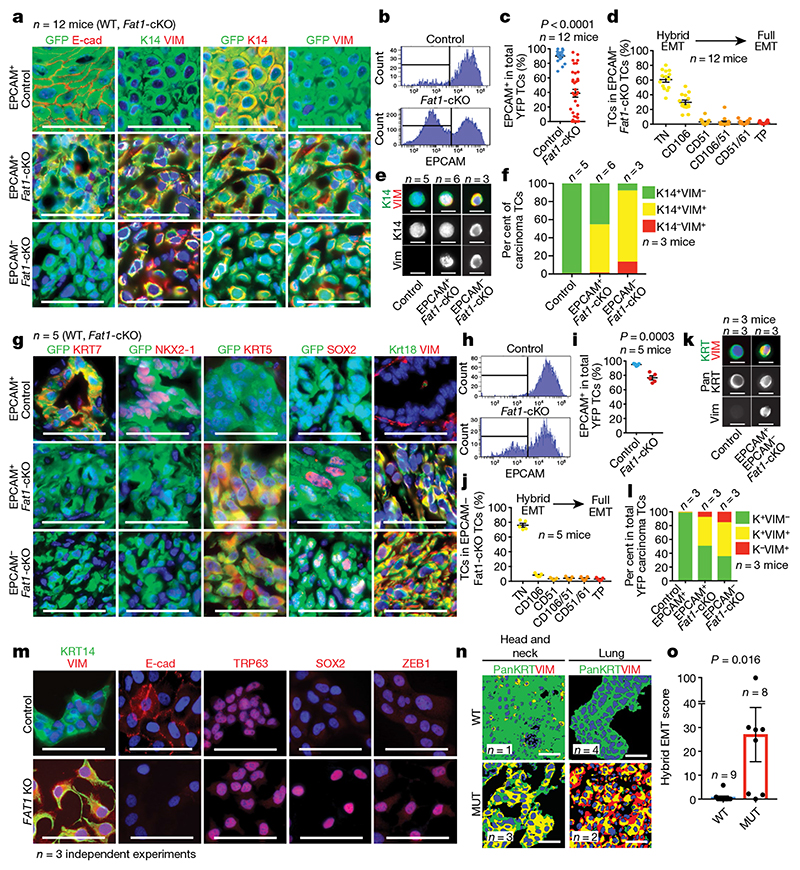
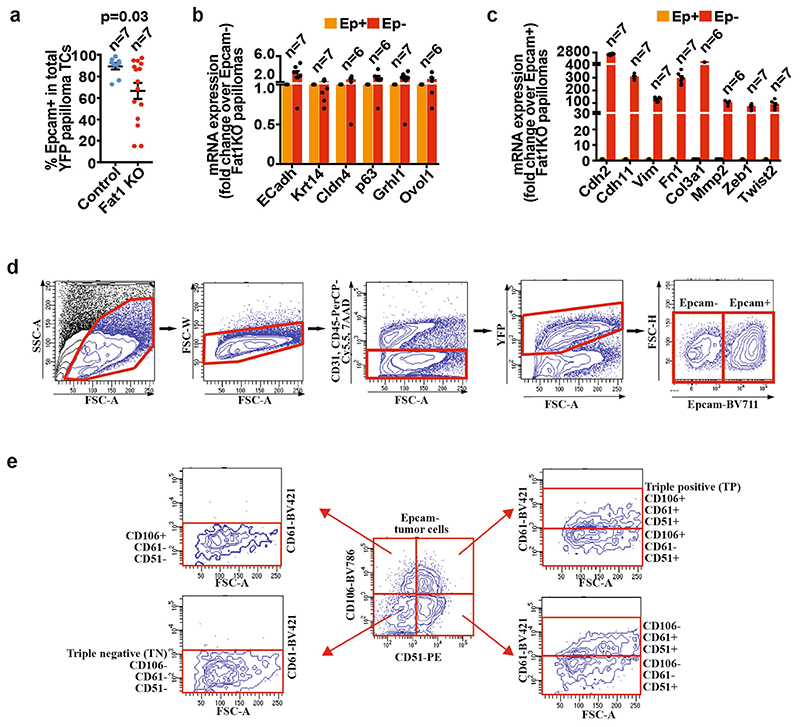
The histological differences we observed in benign papillomas persisted in malignant SCCs. Fat1-cKO tumour cells were less cohesive and had rounded shapes; most of these tumour cells expressed the mesenchymal marker vimentin, which suggest that they underwent EMT. Fluorescence-activated cell sorting (FACS) analysis showed that Fat1-cKO SCCs contained a large proportion of EPCAM- cells, which was very rare in DMBA/TPA-induced SCCs with wild-type Fat1. The EMT occurred very early during tumour progression, as EPCAM- tumour cells could be detected in papillomas (Fig. 1a–c, Extended Data Fig. 3).
Fig. 1. LOF of Fat1 promotes hybrid EMT state in mouse skin SCC, mouse lung cancer and human SCC.
a, Immunostaining for GFP, E-cadherin (E-cad), vimentin (VIM) and KRT14 (K14) in EPCAM+ control (wild-type (WT)), EPCAM+ Fat1-cKO and EPCAM− Fat1-cKO DMBA/TPA-induced SCCs. Scale bars, 50 μm. b, c, FACS analysis (b) and percentage of EPCAM expression (c) in control and Fat1-cKO YFP+ skin SCCs. Mean ± s.e.m., two-tailed t-test. TC, tumour cell. d, Distribution of YFP+EPCAM− tumour cells in CD106 (also known as VCAM1), CD61 (also known as ITGB3) and CD51 (also known as ITGAV) subpopulations in Fat1-cKO SCCs. Mean ± s.e.m. TN, EPCAM− triple negative (CD106−CD51−CD61−); TP, EPCAM− triple positive (CD106+CD51+CD61+). e, f, Co-immunostaining (e) and quantification (f) of KRT14 and vimentin in cytospin of FACS-isolated skin SCC tumour cells. Scale bars, 20 μm. n = 90 cells per condition and tumour. g, Immunostaining for GFP, KRT7, NKX2-1, KRT5, SOX2, KRT8 and KRT18 (KRT8/18), and vimentin in Fat1 wild-type and -knockout lung carcinomas. Scale bars, 50 μm. h, i, FACS analysis (h) and percentage of EPCAM expression (i) in control and Fat1-cKO YFP+ lung tumour cells. Mean ± s.e.m., two-tailed t-test. j, Distribution of YFP+EPCAM− tumour cells in CD106/VCAM1, CD61/ ITGB3 and CD51/ITGAV subpopulations in Fat1-cKO lung carcinomas. Mean ± s.e.m. k, l, Co-immunostaining (k) and quantification (l) of pancytokeratin (pan KRT) and vimentin in cytospin of FACS-isolated lung carcinoma tumour cells. Scale bars, 20 μm. n = 70 cells per condition and tumour. In l, K denotes pancytokeratin. m, Immunostaining for KRT14 and vimentin, E-cadherin, SOX2, TRP63 and ZEB1 in FAT1 wild-type and FAT1-knockout (KO) A388 human skin SCC cell line. Scale bars, 50 μm. n, o, Representative images (n) and quantification of hybrid EMT score (o) (colocalization of pancytokeratin and vimentin) in wild-type and FAT1-mutated (MUT) head and neck, and lung, patient-derived xenografts. Scale bars, 50 μm, Mean ± s.e.m., two-tailed Mann–Whitney U test.
Distinct tumour EMT states—which are characterized by the expression of different levels of the cell-surface markers EPCAM, CD106, CD61 and CD51, and represent different stages within the EMT process—have recently been recognized 11 . The majority of the Fat1-cKO EPCAM- EMT tumour cells were negative for the CD106, CD61 and CD51 markers or expressed CD106 alone; these represent two hybrid EMT subpopulations characterized by the co-expression of epithelial and mesenchymal markers in genetically induced skin SCCs 11 . We performed cytospin on FACS-isolated tumour cells, which confirmed that Fat1 deletion promoted the appearance of hybrid EMT subpopulations that co-express epithelial (KRT14) and mesenchymal (vimentin) markers (Fig. 1c–f). These data demonstrate that a genetic mutation in a tumour-suppressor gene can promote the acquisition of a hybrid EMT phenotype.
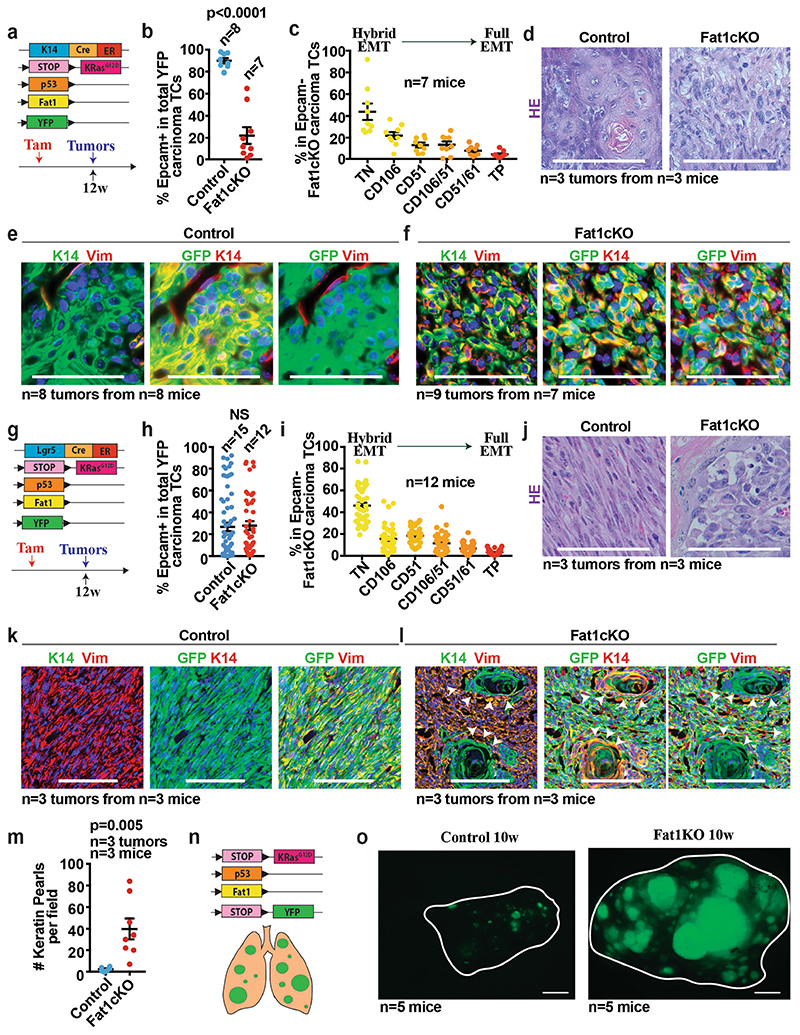
To assess whether Fat1 LOF promotes the acquisition of a hybrid EMT phenotype in other models, we combined deletion of Fat1 and p53 (also known as Trp53) with KrasG12D expression in different epidermal lineages. Krt14-creER, which targets the interfollicular epidermis, induces SCCs with well-differentiated phenotypes without EMT features, whereas Lgr5-creER—which targets the hair follicle—induces heterogeneous tumours characterized by different degrees of EMT 12 . Similar to what we found in DMBA/TPA-derived SCCs, loss of Fat1 in the Krt14-creER;KrasG12D;p53cKO;Fat1cKO;Rosa26YFP/+ mouse model promoted the acquisition of a hybrid EMT phenotype, whereas Lgr5-creER-induced SCCs—which presented high proportion of EMT phenotypes independently of Fat1 deletion—did not further increase EMT features upon Fat1 LOF. By contrast with the control condition 11 , most Lgr5-creER Fat1-cKO tumour cells continued to express KRT14 and presented signs of squamous differentiation that were visible as keratin pearls (Extended Data Fig. 4a–m). These data demonstrate that, in three independent mouse models of skin SCC, Fat1 deletion promotes the acquisition of stable hybrid EMT phenotypes.
To assess whether the promotion of the tumour hybrid state by Fat1 deletion is skin-specific or whether it is conserved across different types of tumour, we combined Fat1 and p53 deletion with KrasG12D expression in the lung epithelia by intratracheal instillation of cre-expressing adenovirus. Fat1 deletion considerably increased the number of tumours per lung (Extended Data Fig. 4n, o), and these tumours also presented signs of hybrid EMT. Whereas KrasG12D expression and p53 deletion promoted the onset of adenocarcinomas characterized by expression of NKX2-1 (also known as TTF1), the simultaneous deletion of Fat1 promoted the formation of lung SCCs, which were characterized by a decreased expression of NKX2-1 as well as by SOX2 expression (Fig. 1g–l). This is consistent with the higher proportion of FAT1 mutations found in lung SCCs relative other types of lung cancer 1,2 , and suggests that FAT1 mutations could be a driving force for the squamous tumour phenotype.
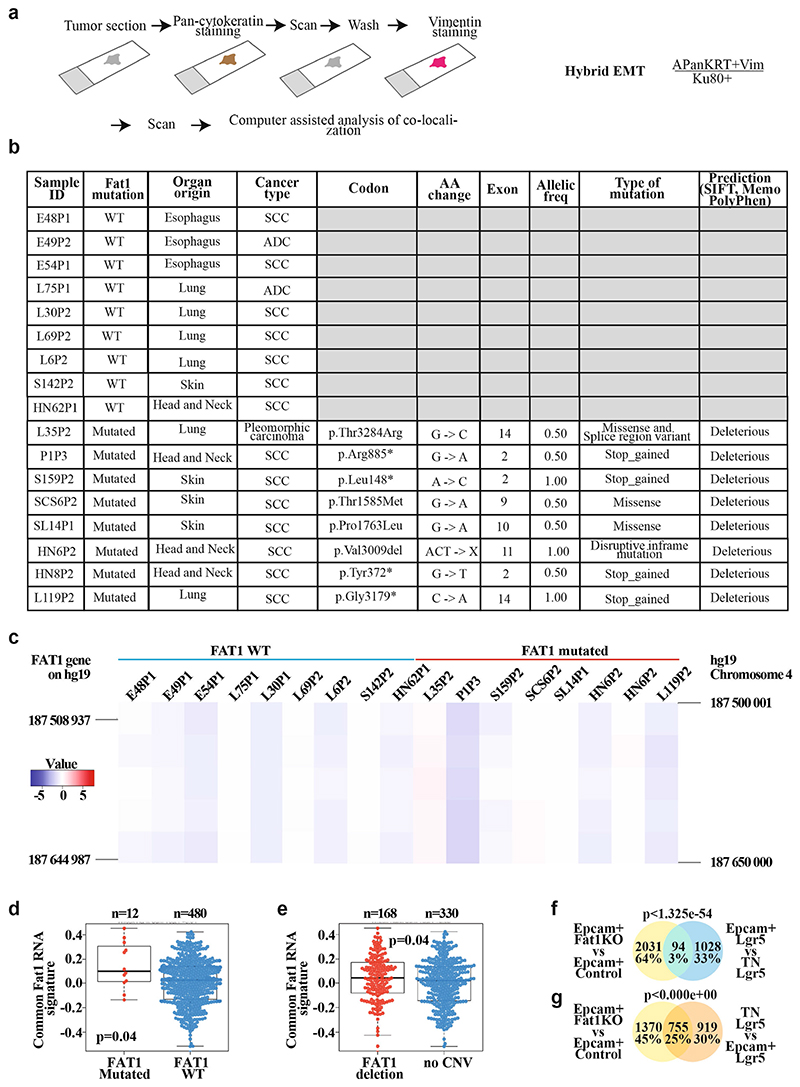
To assess the human relevance of our findings, we performed FAT1 deletion using CRISPR–Cas9 in the A388 human epithelial SCC cell line, which contains wild-type FAT1. Upon FAT1 deletion, cells were less cohesive and more rounded, had decreased expression of E-cadherin and co-expressed epithelial (KRT14, p63 and SOX2) and mesenchymal (vimentin and ZEB1) markers (Fig. 1m), which is reminiscent of the EMT hybrid state found in mouse SCCs. By sequencing patient-derived xenotransplants of SCCs from different organs, we identified SCCs with and without FAT1 LOF mutations. Co-immunostaining of pan-cytokeratin and vimentin showed that FAT1-mutated SCCs exhibit a much higher EMT hybrid score as compared to SCCs with wild-type FAT1 (Fig. 1n, o, Extended Data Fig. 5). These data show that FAT1 mutations promote the acquisition of a hybrid EMT state in human cancers.
FAT1 deletion promotes stemness and metastasis
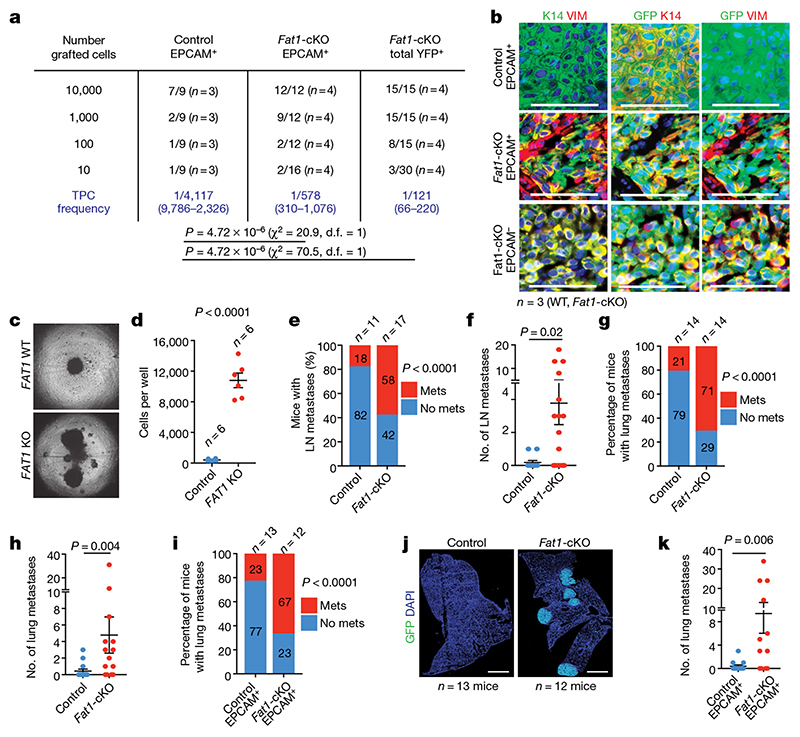
EMT has previously been associated with an increase in tumour stemness 11–14 . Tumour transplantation assays of Fat1-cKO and wild-type EPCAM+ and EPCAM− tumour cells showed that Fat1 LOF was associated with a tenfold increase in tumour-propagating cells as compared to Fat1 wild type. The histology of the secondary tumours recapitulated the histology of the primary tumours (Fig. 2a, b). Tumour stemness is also associated with increased clonogenicity in vitro. To validate our findings, we assessed the clonogenicity of wild-type and FAT1-knockout human SCC cell lines in 3D tumour spheroid assays. FAT1-knockout cell lines grew much better than the isogenic wild-type control cell line (Fig. 2c, d). Altogether, these data show that FAT1 deletion promotes tumour stemness in mouse and human cancers.
Fig. 2. Fat1 deletion promotes tumour stemness and metastasis in skin SCCs.
a, Tumour-propagating cell (TPC) frequency observed upon subcutaneous transplantation of limiting dilutions of YFP+EPCAM+ control, YFP+EPCAM+ and total YFP+ Fat1-cKO tumour cells using extreme limiting dilution analysis. χ 2 test. d.f., degrees of freedom. b, Immunostaining for GFP, KRT14 and vimentin in the secondary tumours arising after subcutaneous transplantation of tumour cells. Scale bars, 50 μm. c, Images showing spheroids formed 7 d after plating 4,000 FAT1 wild-type or FAT1-knockout human A388 skin SCC cells on an ultra-low adherent plate. d, Quantification of cell number in FAT1 wild-type and FAT1-knockout spheroids. Mean + s.e.m., two-tailed t-test. e, f, Proportion of mice presenting lymph node (LN) metastasis (χ 2 test) (e) and number of lymph node metastases per mouse (f) (mean ± s.e.m., two-tailed t-test). Mets, metastases. g, h, Proportion of mice presenting lung metastasis (χ 2 test) (g) and number of lung metastases per mouse (h) (mean ± s.e.m., two-tailed t-test). i, Proportion of mice presenting lung metastasis 40 d after intravenous injection of 20,000 YFP+EPCAM+ tumour cells. χ 2 test. j, Mosaic images of immunostaining for YFP of lungs after intravenous injection of control and Fat1-cKO tumour cells Scale bars, 1 mm. k, Number of metastases per lung arising from the injection of 20,000 YFP+EPCAM+ Fat1 wild-type and Fat1-cKO tumour cells. Mean ± s.e.m., two-tailed t-test.
The hybrid EMT tumour state has previously been associated with the presence of circulating tumour cells and with increased metastatic potential upon intravenous injection of tumour cells 11 . Notably, the proportion of the mice presenting lymph node and lung metastases and the number of metastases per mouse were increased in Fat1-cKO mice (Fig. 2e–h). Intravenous injection of EPCAM+ Fat1-cKO tumour cells gave rise to a higher number of lung metastasis as compared to tumour cells with wild-type Fat1 (Fig. 2i–l), which demonstrates that Fat1 LOF greatly increases spontaneous metastasis and lung colonization in skin SCCs, independently of the number of primary tumours or the occurrence of EMT. These data demonstrate that Fat1-LOF-induced hybrid EMT state promotes metastasis in vivo.
Gene signature of Fat1-mutated tumours
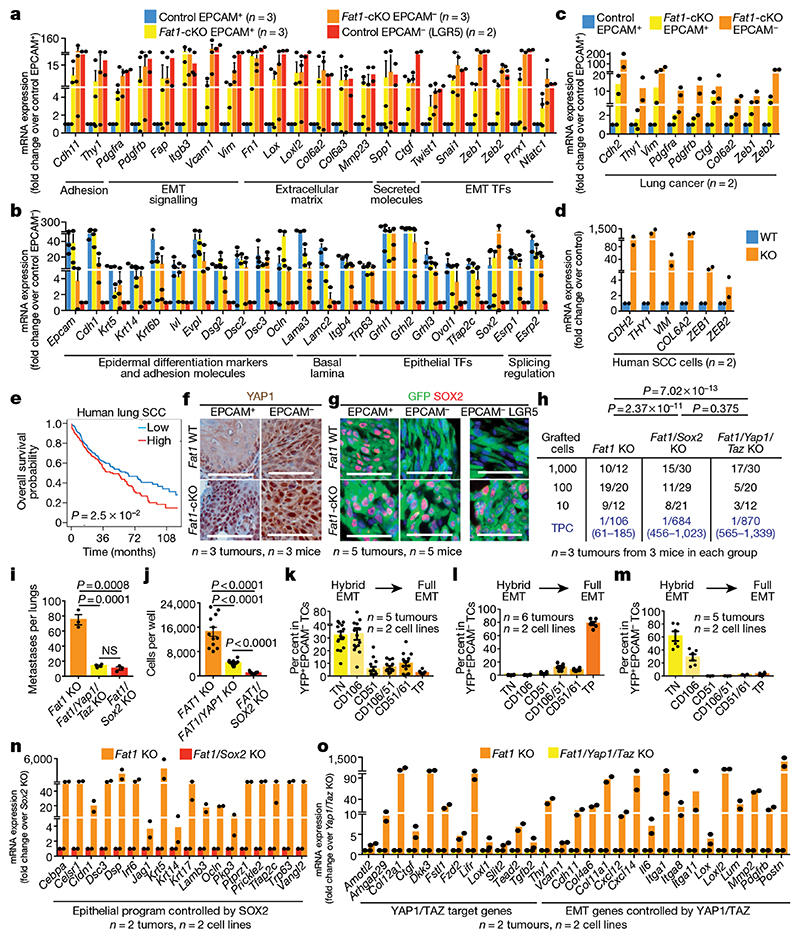
To investigate the molecular mechanisms by which Fat1 LOF promotes the hybrid EMT state, we first assessed the transcriptional signature of Fat1-mutated tumour cells from mouse skin SCCs. RNA sequencing (RNA-seq) revealed that Fat1-cKO EPCAM+ tumour cells presented a strong upregulation of many well-known EMT markers—including Vim, Snai1, Prrx1, Twist1, Zeb1 or Zeb2—and the expression of these genes was further upregulated in EPCAM− Fat1-knockout tumour cells, which suggests that EPCAM+ Fat1-cKO tumour cells are transcriptionally primed to undergo EMT. In contrast to EPCAM− tumour cells from Lgr5-creER; KrasG12D;p53cKO -derived SCCs that present full EMT, EPCAM− Fat1-cKO tumour cells continued to express high levels of several epithelial genes (such as Krt14, p63 and Sox2). The transcriptional signature of Fat1-cKO tumour cells significantly overlapped with the hybrid EMT signature obtained by RNA-seq of CD106−CD61−CD51− hybrid EMT tumour cells from Lgr5-creER;KrasG12D;p53cKO SCCs and did not overlap significantly with the full EMT signature 11 (Fig. 3a, b, Extended Data Fig. 5f, g).
Fig. 3. YAP1 and SOX2 regulate mesenchymal and epithelial states downstream of Fat1 deletion.
a, b, mRNA expression (RNA-seq) of mesenchymal (a) and epithelial (b) genes in mouse skin SCC. Mean + s.e.m. TF, transcription factor. c, d, mRNA expression (RNA-seq) of mesenchymal genes in mouse lung carcinoma (c) and human SCC cells (d). Mean + s.e.m. e, Overall survival of patients with lung SCC, stratified by the expression of the common gene signature between mouse skin and lung and human skin FAT1-knockout SCC. log-rank Mantel–Cox test. f, g, Immunohistochemistry for YAP1 (f) and immunostaining for GFP and SOX2 (g) in wild-type and Fat1-cKO skin SCCs. Scale bars, 50 μm. h, i, Tumour-propagating cells (h) and lung metastasis (i) following the injection of YFP+EPCAM− Fat1-knockout, Fat1- and Sox2 double-knockout or Fat1, Yap1 and Taz triple-knockout skin SCC cells. Mean ± s.e.m. two-tailed-t-test. NS, not significant. j, Number of cells in spheroids formed by FAT1-knockout, FAT1 and YAP1 double-knockout or FAT1 and SOX2 double-knockout human SCC cells after 7 d. Mean ± s.e.m., two-tailed t-test. k–m, YFP+EPCAM− CD106/VCAM1, CD61/ITGB3 and CD51/ITGAV subpopulations in SCC after subcutaneous transplantation of Fat1-cKO (k), Fat1 and Sox2 double-knockout (l) or Fat1, Yap1 and Taz triple-knockout (m) mouse skin SCC cells. Mean ± s.e.m. Scale bars, 50 μm. n, o, mRNA (RNA-seq) expression of genes controlled by Sox2 (n) or by Yap1 and Taz (o) in EPCAM− Fat1-cKO skin SCC. Mean + s.e.m.
RNA-seq data from EPCAM+ and EPCAM- Fat1-cKO lung cancer cells and from CRISPR–Cas9 FAT1-knockout human SCC cells showed that—in both cases—similar mesenchymal genes (including ZEB1, ZEB2 and VIM) were upregulated following deletion of FAT1, uncovering a common gene signature associated with FAT1 deletion across different tumour types and between mouse and human cancers. Importantly, we found that high expression of this common FAT1-mutated signature was associated with poor survival in patients with lung SCC (Fig. 3c–e).
YAP1 and SOX2 regulate the hybrid EMT
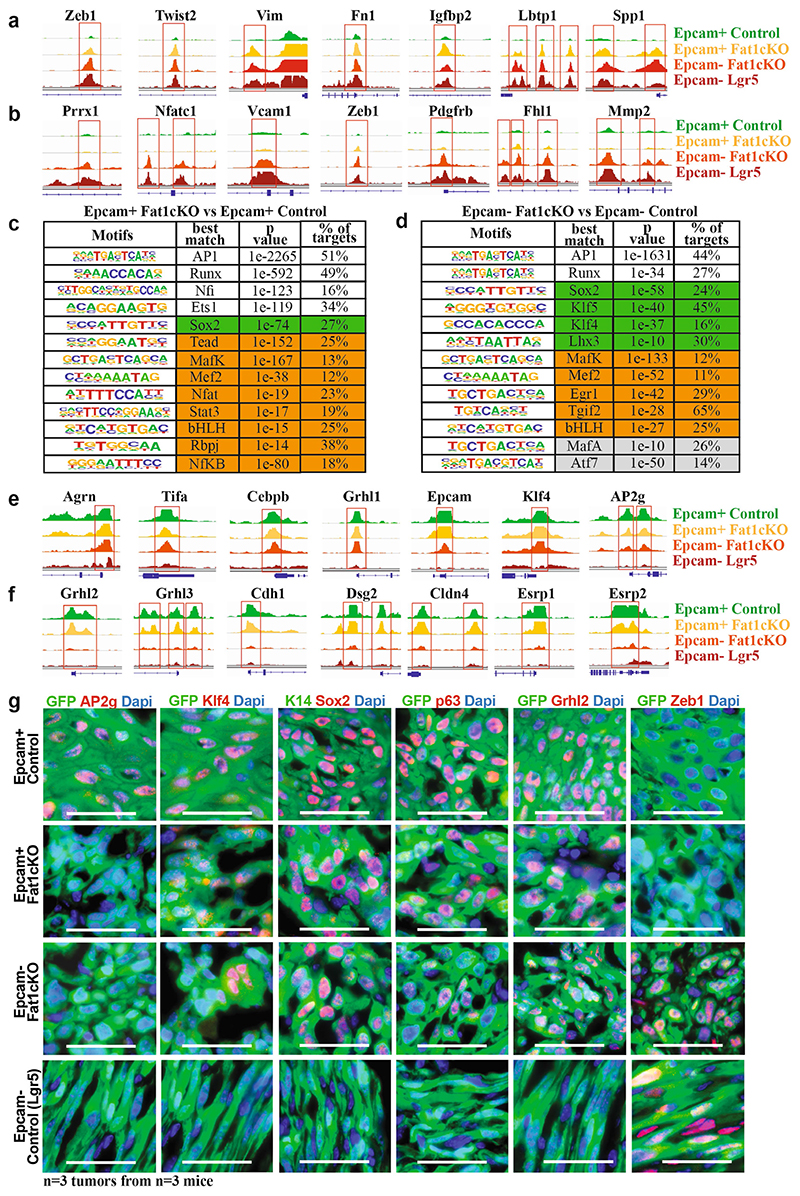
To define the changes in the chromatin landscape that are responsible for the hybrid EMT state that occurs after deletion of Fat1, we performed assay for transposase-accessible chromatin using sequencing (ATAC-seq) of FACS-isolated wild-type and Fat1-cKO EPCAM+ and EPCAM- tumour cells. We identified enhancers within key EMT transcription factors (such as Zeb1, Snail1 or Twist2) and other EMT markers (for example, Vim or Col6a3) that were more accessible in EPCAM+ Fat1-cKO tumour cells as compared to EPCAM+ wild-type cells, which potentially accounts for the epigenetic priming of tumour cells to undergo EMT upon Fat1 deletion. By performing motif discovery in differentially accessible chromatin regions between wild-type and Fat1-mutated tumour cells, we identified Ap1 (also known as Jun) and Tead transcription-factor motifs as being strongly enriched in the chromatin regions that are more open in Fat1-mutated tumour cells that also have increased expression of YAP1 (Fig. 3f, Extended Data Fig. 6), which suggests that the JUN and FOS family of transcription factors cooperates with other transcription factors—including those of the TEAD family—that relay the YAP1 pathway to the nucleus to prime the Fat1-mutated cancer cells to undergo the EMT in skin SCC in vivo 8 .
To identify the transcription factors that are responsible for the sustained expression of epithelial genes in EPCAM− Fat1-cKO tumour cells, we performed motif discovery in the ATAC-seq peaks that were upregulated in EPCAM− Fat1-cKO as compared to EPCAM− control tumour cells from fully mesenchymal Lgr5-creER;KrasG12D;p53cKO SCCs. We found that Ap1, Sox or Klf motifs were strongly enriched in EPCAM− Fat1-cKO cells (Fig. 3g, Extended Data Fig. 6), which suggests that the epithelial program of the hybrid EMT state in Fat1-cKO is mediated by an AP1–SOX2–KLF transcriptional network. SOX2 is amplified in many human SCCs and marks cancer stem cells in skin SCCs 15–17 , and could be responsible for the sustained expression of epithelial genes in Fat1-cKO tumour cells.
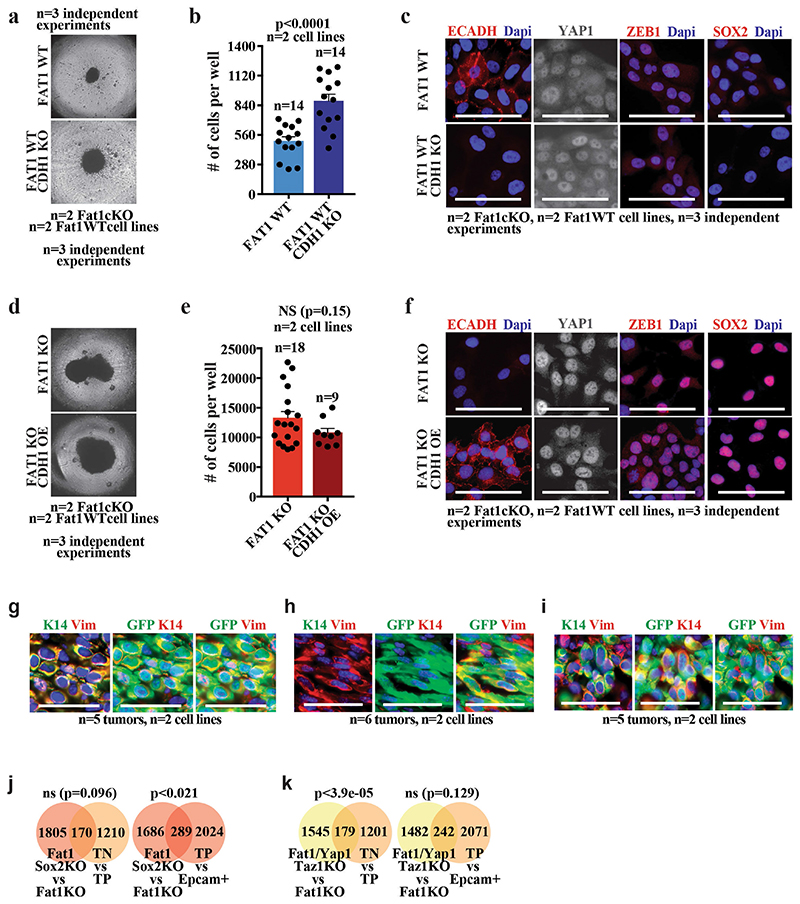
To functionally validate the bioinformatic predictions, we assessed the effect of CRISPR–Cas9-mediated deletion of Yap1 and Taz, or of Sox2, on tumour stemness, metastasis and the gene expression program of mouse skin SCCs. Both tumour-propagating cell frequency and the number of metastasis were reduced upon deletion of Sox2 or of Yap1 and Taz in primary EPCAM− cell lines derived from Lgr5-creER;KrasG12D;p53cKO; FatcKO SCCs (Fig. 3h, i), which demonstrates that the SOX2 and the YAP1 and TAZ transcriptional programs are important for the promotion of tumour stemness and metastasis downstream of Fat1 deletion. SOX2 or YAP1 deletion in the human SCC cell line decreased the tumour growth mediated by FAT1 deletion in 3D spheroid assays (Fig. 3j), which demonstrates that SOX2 and YAP1 promote tumour growth downstream of FAT1 deletion in human cancer cells. Conversely, the deletion of the E-cadherin gene (CDH1) in the same cell line—which induced defects of cell adhesion—did not induce SOX2 or ZEB1 expression, or an increase in nuclear YAP1. Overexpression of CDH1 in FAT1-knockout cells did not decrease the clonogenicity or the expression of mesenchymal genes induced by FAT1 deletion (Extended Data Fig. 7a–f), which shows that the promotion of tumour stemness or the hybrid EMT phenotype by FAT1 deletion is not simply the result of a defect in cell adhesion.
Sox2 deletion in Lgr5-creER;KrasG12D;p53cKO;FatcKO SCCs resulted in the loss of epithelial characteristics and a shift from hybrid to complete EMT upon subcutaneous transplantation, whereas the deletion of Yap1 and Taz promoted an early hybrid EMT state (as shown by immunostaining and FACS analysis) (Fig. 3k–m, Extended Data Fig. 7g–i). The RNA-seq data from Fat1 and Sox2 knockout further demonstrated a significant enrichment in the late EMT signature, marked by an increase of mesenchymal markers (for example, Lox and Pdgfra) and a decrease of epithelial markers (for example, Cebpa, Krt5 and p63). Instead, the transcriptome of Fat1, Yap1 and Taz triple-knockout SCCs showed significant enrichment of the EPCAM+ epithelial and early hybrid EMT signature. Many classical canonical target genes of YAP1 and TAZ (for example, Ctgf (also known as Ccn2), Amotl2 and Fstl1), as well as EMT genes (for example, Vcam1, Thy1 and Pdgfrb), were decreased after Fat1, Yap1 and Taz triple knockout as compared to Fat1 knockout (Fig. 3n, o, Extended Data Fig. 7j, k and data not shown). Altogether, these data demonstrate that SOX2, and YAP1 and TAZ, control distinct transcriptional programs that lead to a stable hybrid EMT phenotype downstream of Fat1 LOF.
Signalling cascades downstream of FAT1
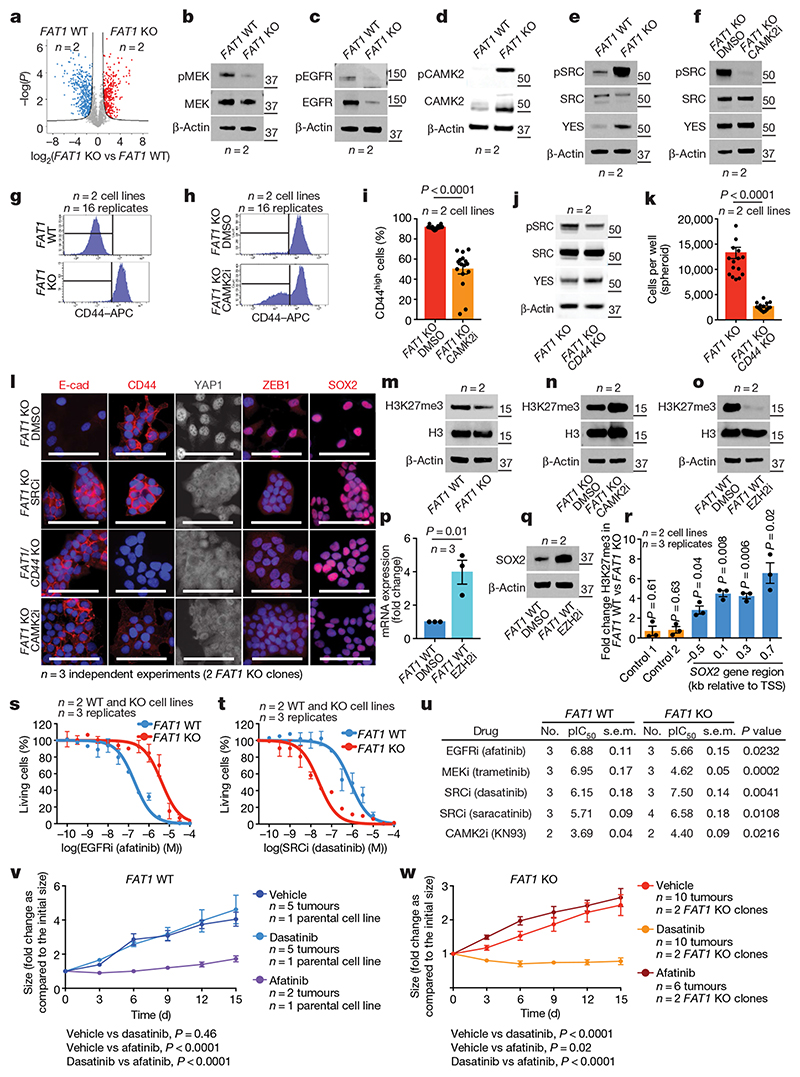
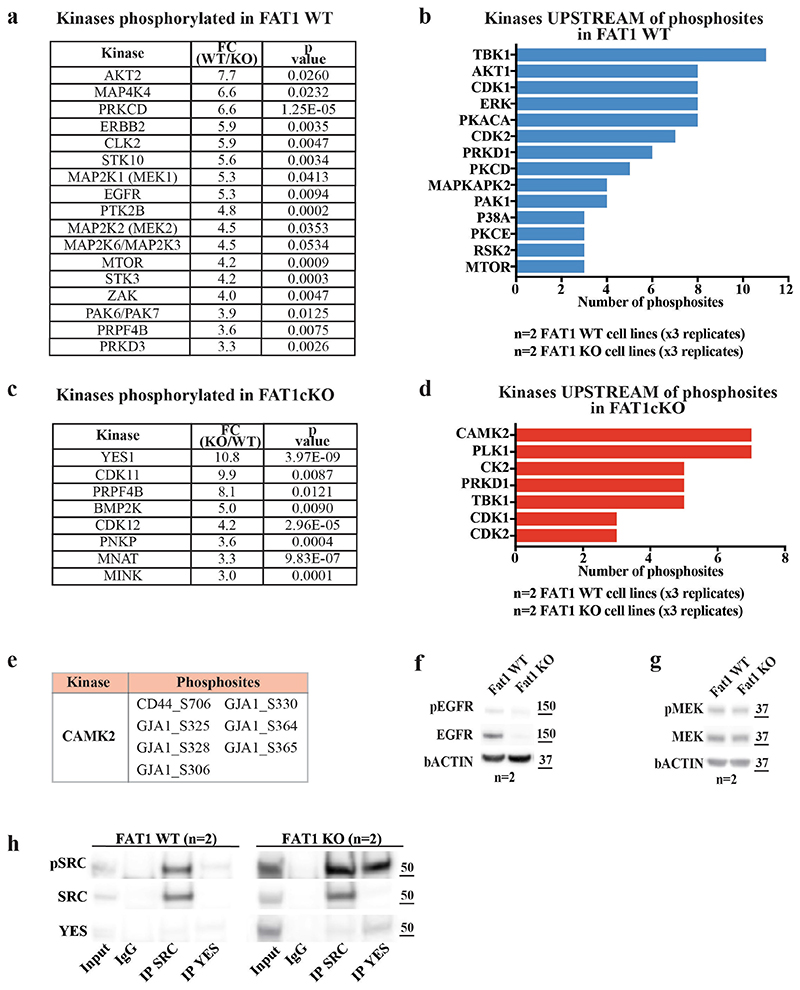
To understand how FAT1 LOF activates SOX2 or YAP1 and TAZ, we performed a phosphoproteomic analysis of wild-type and CRISPR–Cas9 FAT1-knockout human SCC cells. We identified 288 phosphosites that were significantly upregulated and 335 that were significantly downregulated in FAT1-knockout tumour cells as compared to FAT1 wild type. FAT1 LOF induced a decrease in the phosphorylation of proteins involved in cell–cell adhesion (such as ZO1 or ZO2), as well as of PRKCD, EGFR, ERBB2, MEK1, MEK2, AKT2 or MTOR. In good accordance with the phosphoproteomic analysis, MEK1 and MEK2 were significantly less phosphorylated—and the total levels of EGFR and phosphorylated EGFR—were decreased in FAT1-knockout tumour cells (Fig. 4a–c, Extended Data Figs. 8, 9). These data suggest that EGFR–RAS–RAF–MEK–MAPK and the EGFR–PI3K–AKT–MTOR signalling pathways are decreased upon FAT1 LOF.
Fig. 4. Phosphoproteomic analysis identifies the signalling cascades downstream of FAT1 deletion.
a, Volcano plot showing the fold change and statistical significance of each phosphopeptide in wild-type versus FAT1-knockout cells (false-discovery rate (FDR) = 0.05, S 0 = 1). b–e, Western blot showing phosphorylated (p)MEK1 and MEK2 (MEK1/2) and total MEK (b), pEGFR and total EGFR (c), pCAMK2 and total CAMK2 (d), and pSRC, total SRC and YES (e) in FAT1-knockout and wild-type cells. f, Western blot showing pSRC, total SRC and YES in FAT1-knockout cells treated with dimethyl sulfoxide (DMSO) or with a CAMK2 inhibitor (CAMK2i). g, h, FACS analysis showing CD44 expression in wild-type and FAT1-knockout cells (g), and in FAT1-knockout cells treated with a CAMK2 inhibitor (h). i, FAT1-knockout cells expressing high levels of CD44 were treated with DMSO or a CAMK2 inhibitor. Mean + s.e.m. two-tailed-t-test. j, Western blot showing pSRC, total SRC and YES in FAT1-knockout and FAT1 and CD44 double-knockout cells. k, Number of cells in FAT1-knockout and FAT1 and CD44 double-knockout spheroids. Mean + s.e.m. two-tailed-t-test. l, Immunostaining for E-cadherin, CD44, YAP1, ZEB1 and SOX2 in FAT1 and CD44 double-knockout, and FAT1-knockout, cells treated with DMSO, an SRC inhibitor (SRCi) (saracatinib) or a CAMK2 inhibitor. Scale bars, 50 μm. m–o, Western blot showing the expression of H3K27me3 and total H3 in FAT1 wild-type and -knockout cells (m), FAT1-knockout cells treated with a CAMK2 inhibitor (n) and in FAT1 wild-type cells treated with DMSO or an EZH2 inhibitor (EZH2i) (o). p, q, SOX2 mRNA (quantitative PCR with reverse transcription) (p) and protein (western blot) (q) in FAT1 wild-type cells 7 d after treatment with an EZH2 inhibitor. Mean ± s.e.m., two-tailed t-test. r, ChIP–qPCR of H3K27me3 mark in regions close to the SOX2 transcription start site. Ratio of relative enrichment in FAT1 wild-type versus -knockout cells; one sample t-test, mean ± s.e.m. s, t, Dose–response curve showing the effect of the EGFR inhibitor (ECFRi) afatinib (s) and the SRC inhibitor dasatinib (t) on FAT1 wild-type and FAT1-knockout cell viability at 48 h. Nonlinear regression log (inhibitor) with least-squares fit method. Mean ± s.e.m. u, Summary (n = 3) of pIC50 (negative log of half-maximal inhibitor concentration) and s.e.m. for different drugs for FAT1 wild-type and FAT1-knockout cells. Two-tailed t-test. v, w, Effect of dasatinib and afatinib on FAT1 wild-type (v) and FAT1-knockout (w) tumour growth upon subcutaneous transplantation. Mean ± s.e.m., two-way analysis of variance. The molecular weight (kDa) is indicated to the right of the blots in b–f, j, m–o, q.
Conversely, FAT1-deficient tumour cells exhibited a strong increase in the phosphorylation of the YES tyrosine kinase that belongs to the SRC family, as well as of the MAP1B and GJA1 proteins. GJA1 phosphorylation promotes GJA1 localization at the plasma membrane and increases the formation of functional gap junctions, which has previously been linked to increased metastatic capacity 18 (Extended Data Fig. 8). These data suggest that FAT1 LOF induces a global remodelling of cell–cell adhesions, cell communication and the cytoskeleton, which is associated with the acquisition of a hybrid EMT state.
To decipher the signalling cascade that acts downstream of FAT1 LOF, we used the PhosphoSitePlus online tool and bibliographic search to predict kinases that act upstream of the phosphosites we identified. Ca2+/calmodulin-dependent protein kinase II (CAMK2) was the kinase that we found to most frequently act upstream of phosphopeptides enriched in FAT1-knockout tumour cells (CD44 on S706 19 and GJA1 on S328, S325, S306, S330, S364 and S365 20 ). In accordance with the bio-informatic prediction, western blot analysis showed that CAMK2 was substantially more phosphorylated in FAT1 LOF as compared to FAT1 wild type. We further confirmed that SRC and YES also showed high levels of expression and phosphorylation upon FAT1 LOF. Immunoprecipitation of SRC and YES showed that YES was substantially more highly expressed and phosphorylated with FAT1 knockout, whereas the levels of SRC were comparable between FAT1 wild-type and -knockout tumour cells, and SRC phosphorylation was increased after FAT1 knockout (Extended Data Fig. 8h). Treatment with a CAMK2 inhibitor (KN93) greatly decreased the level of SRC and YES phosphorylation, which shows that CAMK2 directly or indirectly phosphorylates YES and SRC upon FAT1 LOF (Fig. 4d–f, Extended Data Fig. 8).
CD44 is upregulated during EMT, promoting tumour stemness, progression and metastasis 21 . Previous computational analysis predicted that an ESRP1–CD44–ZEB1 loop stabilizes the hybrid EMT state in human lung cancer cells 22 . Phosphorylation of CD44 by different kinases, including CAMK2 23 , regulates its cellular localization and activity. To assess whether CD44 phosphorylation at S706 (which is upregulated upon FAT1 LOF) could affect CD44 cellular localization, we performed a FACS analysis that revealed increased levels of cell-surface CD44 in FAT1-knockout cells, which were significantly reduced upon treatment with a CAMK2 inhibitor (Fig. 4g–i). To determine whether CAMK2 phosphorylates YES and SRC directly or through CD44 21 signalling in FAT1-knockout cells, we performed CD44 deletion using CRISPR–Cas9 in FAT1-knockout cells and found that phosphorylation of SRC was decreased upon double knockout of CD44 and FAT1 (Fig. 4g–j). These data demonstrate that upon FAT1 LOF, CAMK2 activates SRC at least partially though CD44. The clonogenicity of FAT1 and CD44 double-knockout human SCC cells decreased significantly in 3D tumour spheroid assays (Fig. 4k), which demonstrates that CD44 stabilization contributes to the increase in tumour stemness observed upon FAT1 LOF.
We further assessed whether the hybrid EMT phenotype could be promoted by CAMK2–CD44–SRC signalling. We found that FAT1 and CD44 double-knockout and FAT1-knockout cells treated with CAMK2 (KN93) or SRC (saracatinib or dasatinib) inhibitors presented a strong decrease in nuclear YAP1 and ZEB1 and an increase in expression of E-cadherin, and were growing in more-compact epithelial colonies. These results demonstrate that FAT1 LOF activates a CAMK2–CD44–SRC–YAP–ZEB1 axis that promotes the expression of a mesenchymal program. We observed a decrease in SOX2 expression only in FAT1-knockout tumour cells treated with a CAMK2 inhibitor. However, no change in SOX2 expression was observed upon inhibition of the CD44–SRC cascade (Fig. 4l).
Phosphoproteomic analysis revealed an increase in the inactivating phosphorylation of EZH2 at T487 24 in FAT1-knockout cells. EZH2 belongs to the PRC2 complex that methylates H3 at K27, mediating transcriptional repression 25 . This histone mark is remodelled at the Sox2 locus during the formation of SCCs 15 . We hypothesized that EZH2 inhibition in FAT1-knockout cells could decrease trimethylation of H3 at K27 (H3K27me3) repressive histone marks, and thus promote the expression of SOX2. The global level of H3K27me3 was substantially decreased in FAT1-knockout cells, which suggests that EZH2 could be less active upon FAT1 LOF. Administration of a CAMK2 inhibitor increased the global levels of H3K27me3 in FAT1-knockout cells, consistent with the notion that CAMK2 activation inhibits EZH2 and PRC2 activity in tumour cells. To further validate this hypothesis, we treated FAT1 wild-type cells with an EZH2 inhibitor (GSK343) and observed a decrease of H3K27me3 and increase in SOX2 mRNA and protein expression after seven days of treatment, which further suggests that SOX2 is epigenetically regulated by a FAT1–CAMK2–EZH2-dependent mechanism. Chromatin immunoprecipitation with quantitative PCR (ChIP–qPCR) demonstrated that H3K27me3 marks around the SOX2 promoter were significantly reduced upon FAT1 deletion, which provides support for the notion that FAT1 deletion regulates the expression of SOX2 through an epigenetic mechanism (Fig. 4m–r).
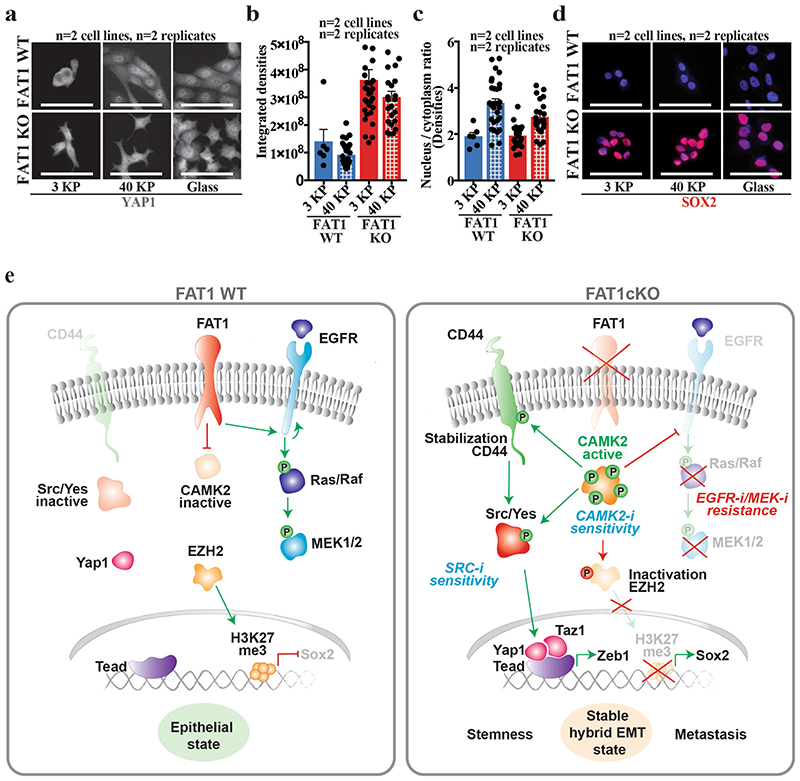
As YAP1 and TAZ signalling can be regulated by the stiffness of the extracellular matrix 26 , we assessed the effect of substrate stiffness on YAP1 and SOX2 expression. In contrast to FAT1 wild-type cells, FAT1-knockout tumour cells exhibited high levels of total and nuclear YAP1 expression even on a soft substrate, which demonstrates that FAT1 deletion constitutively activates signalling pathways that lead to high YAP1 expression; this causes the FAT1-knockout cells to behave—in respect to YAP1 nuclear expression—as if the tumour cells were exposed to a stiff substrate. No changes in SOX2 expression were observed, demonstrating that SOX2 is constitutively activated upon FAT1 LOF independently of the extracellular stiffness (Extended Data Fig. 10a–d).
Drug vulnerabilities in FAT1-mutated tumours
To test whether the signalling cascades that change upon FAT1 LOF could predict therapeutic resistance and vulnerability of FAT1-mutated cancers, we assessed the sensitivity of wild-type and isogenic FAT1-knockout human cancer cell lines to the inhibitors of the signalling pathways that we found to be differentially regulated between wild-type and FAT1-knockout cells. EGFR inhibitors such as afatinib, and MEK inhibitors such as trametinib, are widely used in patients with metastatic SCC 27,28 . FAT1-knockout cells were significantly more resistant to afatinib and trametinib as compared to FAT1 wild-type SCC cells in vitro (Fig. 4s–u).
By contrast, FAT1-knockout tumour cells were significantly more sensitive to the SRC inhibitors dasatinib and saracatinib and the CAMK2 inhibitor KN93 as compared to FAT1 wild-type tumour cells (Fig. 4s–u). Administration of afatinib and dasatinib to mice transplanted with FAT1 wild-type and -knockout human SCC cell lines showed that FAT1 wild-type tumour cells were more sensitive to afatinib and FAT1-knockout tumour cells were more sensitive to dasatinib (Fig. 4v, w), consistent with the difference in drug sensitivity observed in vitro.
Discussion
Our study reveals that, in mouse models and human cancers, FAT1 deletion promotes the acquisition of a hybrid EMT state that presents increased tumour stemness and metastasis. We identify the epigenetic and transcriptional mechanisms that link a loss of cell polarity and cell adhesion with the induction of a hybrid EMT phenotype downstream of Fat1 deletion. Our comprehensive molecular characterization—including transcriptomic, epigenomic and proteomic characterization of Fat1 mutants—shows that the hybrid EMT signature is mediated by the activation of YAP1 and SOX2, which regulate the co-expression of mesenchymal and epithelial transcriptional programs, respectively, in cancer cells. We show that the gene signature associated with FAT1 LOF is predictive of poor survival in patients with lung cancer. We identify the signalling cascades that lead to the activation of YAP1 and SOX2 downstream of FAT1 LOF. The activation and inhibition of these signalling pathways lead to an increased sensitivity of FAT1-mutated cancer cells to CAMK2 and SRC inhibition and to resistance to EGFR and MEK inhibition (Extended Data Fig. 10). This study has important implications for personalized medicine, in the prognosis and treatment of the high number of patients with cancer that displays FAT1 mutations.
Online content
Any methods, additional references, Nature Research reporting summaries, source data, extended data, supplementary information, acknowledgements, peer review information; details of author contributions and competing interests; and statements of data and code availability are available at https://doi.org/10.1038/s41586-020-03046-1.
Extended Data
Extended Data Fig. 1. Fat1 LOF does not alter development and skin homeostasis.
a, Image showing Fat1-cKO mouse and its control littermate. b, Table showing the number of control mice and mice with constitutive Fat1-cKO in skin epidermis, showing the absence of deviation from Mendelian ratio. c, Haematoxylin and eosin staining in control and Fat1-cKO epidermis. Scale bar, 50 μm. d, e, Immunostaining for GFP and KRT10, KRT14, E-cadherin or ITGB4 in control (d) and Fat1-cKO (e) epidermis. Scale bar, 50 μm.
Extended Data Fig. 2. Fat1 LOF accelerates DMBA/TPA-induced tumour initiation and malignant progression.
a, Model allowing constitutive Fat1 deletion in the skin epidermis and the scheme of DMBA/TPA protocol. b, Control and Fat1-cKO littermates 24 weeks after initiation of DMBA/TPA treatment. c, d, Time elapsed from the beginning of DMBA/TPA treatment until the appearance of the tumour (log-rank Mantel–Cox test) (c) and the number of papillomas per mouse (mean ± s.e.m., two-tailed t-test) (d) in control and Fat1-cKO mice. e, Macroscopic appearance of papilloma and carcinoma. f, Number of carcinomas per mouse at 24 weeks after DMBA/TPA in control and Fat1-knockout mice. Mean ± s.e.m., two-tailed t-test. g, Acute deletion of Fat1 in DMBA/TPA-induced papillomas. h, Time elapsed from tamoxifen (tam) administration to macroscopic malignant progression from papillomas into carcinomas. log-rank Mantel–Cox test. i, Proportion of papillomas that progressed to carcinomas in control and Fat1-cKO mice. χ 2 test. j, k, Immunostaining for KRT14, KRT10 and LAM5 in control (j) and Fat1-cKO papillomas (k) 0, 2, 4 and 8 weeks after tamoxifen administration. Scale bar, 50 μm. l, Haematoxylin and eosin and immunostaining for YFP, E-cadherin, ZO-1 or CLDN1 in control and Fat1-cKO papillomas. Scale bar, 50 μm. m–o, Electron microscopy images showing polarity (Scale bars, 2 μm (control papilloma), 5 μm (Fat1-cKO papilloma)) (m), cell–cell adhesion (scale bar, 0.2 μm) (n) or desmosomes (scale bar, 0.2 μm) (o) in Fat1-cKO and wild-type papillomas. Red lines indicate interface between tumour cells and stroma. Blue arrowheads, desmosomes. Red arrowheads, tight and adherens junctions. p, Width of the desmosomes measured in nm in control and Fat1-cKO papillomas. Mean ± s.e.m., two-tailed t-test. q, Electron microscopy (scale bars, 0.2 μm (control), 5 μm (Fat1-cKO)) and immunostaining for KRT14 and LAM5 (scale bar, 50 μm) of control and Fat1-cKO papillomas. Blue arrowheads, hemidesmosomes. Red arrowheads, basal lamina in control papillomas and discontinued basal lamina in Fat1-cKO papillomas. Black arrowheads show fenestration of basal lamina in Fat1-cKO papillomas. r, Number of hemidesmosomes per 1 μm. Mean ± s.e.m., two-tailed t-test).
Extended Data Fig. 3. EMT in papillomas and gating strategy for FACS analysis and cell sorting of the tumour subpopulations.
a, Percentage of EPCAM+YFP+ tumour cells in control and Fat1-cKO papillomas. Mean ± s.e.m., two-tailed t-test. b, c, mRNA (qPCR) expression of epithelial (b) and mesenchymal (c) genes in EPCAM+ and EPCAM− control and Fat1-cKO papillomas. Mean + s.e.m. d, FACS plots showing the gating strategy used to FACS-isolate or to analyse the proportion of YFP+EPCAM+ and EPCAM− tumour cells from DMBA/TPA-induced K14-cre;Fat1cKO;Rosa26YFP/+ carcinomas and papillomas, Lgr5-creER;KRasG12D;p53cKO;Fat1cKO;Rosa26YFP/+ or K14-creER;KRasG12D;p53cKO;Fat1cKO;Rosa26YFP/+ skin SCCs and KrasG12D;p53cKO;Fat1cKO;Rosa26YFP/+ lung carcinomas. e, FACS plots showing the gating strategy to define the six subpopulations of EPCAM− tumour cells: EPCAM−CD106−CD51−CD61− (triple negative), EPCAM−CD106+CD51−CD61−, EPCAM−CD106−CD51+CD61-, EPCAM−CD106+CD51+CD61-, EPCAM−CD106−CD51+CD61+ and EPCAM-CD106+CD51+CD61+ (triple positive) populations.
Extended Data Fig. 4. Fat1 LOF promotes hybrid EMT state in a genetic model of skin SCC.
a, Mouse model of skin SCC allowing YFP and KrasG12D expression as well as p53 and Fat1 deletion preferentially in the interfollicular epidermis (IFE) using Krt14-creER. b, Percentage of EPCAM+ tumour cells in control and Fat1-cKO SCCs. Mean ± s.e.m., two-tailed t-test. c, Graph showing the distribution of the different EPCAM− tumour cell subpopulations on the basis of the expression of CD106/VCAM1, CD61/ITGB3 and CD51/ITGAV in Fat1-cKO tumours. Mean ± s.e.m. d, Haematoxylin and eosin staining, showing representative control and Fat1-cKO tumours. Scale bar, 50 μm. e, f, Immunostaining for GFP, KRT14 or vimentin in representative control (e) and Fat1-cKO tumour (f). Scale bar, 50 μm. g, Mouse model of skin SCC allowing the expression of YFP and KrasG12D as well as p53 and Fat1 deletion preferentially in the hair follicle lineage using Lgr5-creER. h, Percentage of EPCAM+ tumour cells in the control and Fat1-cKO tumours. Mean ± s.e.m., two-tailed t-test. i, Graph showing the distribution of the different EPCAM− tumour cell subpopulations on the basis of the expression of CD106/VCAM1, CD61/ITGB3 and CD51/ITGAV in Fat1-cKO tumours. Mean ± s.e.m. j, Haematoxylin and eosin staining, showing a representative Fat1 wild-type and Fat1-cKO tumour. Scale bar, 50 μm. k, l, Immunostaining for KRT14 and vimentin showing the absence of keratin pearls in representative EPCAM− control SCC (k) and the presence of keratin pearls in representative EPCAM− Fat1-cKO SCC (l). White arrowheads indicate keratin pearls. Scale bar, 100 μm. m, Dot plot showing the number of keratin pearls quantified per field at magnification 20×. n = 5 fields quantified per sample, mean ± s.e.m., two-tailed t-test. n, Mouse model allowing YFP and KrasG12D expression as well as p53 and Fat1 deletion in lung epithelial cells using intratracheal instillation of Ad5CMVCre virus. o, Immunofluorescence image showing the YFP+ lung tumours 10 weeks after intratracheal instillation of Ad5CMVCre virus in Fat1 wild-type and Fat1-cKO mice. Scale bar, 1 mm.
Extended Data Fig. 5. Mutations in FAT1 promotes hybrid EMT state in human cancers.
a, Schematic representing the method of analysing the co-expression of pan-cytokeratin and vimentin using immunohistochemistry of patient-derived xenografts that present (or not) mutations in FAT1, and the definition of hybrid EMT score. b, Table summarizing the samples of patient-derived xenografts on which whole-exome sequencing was performed, and detailed information on the mutations: codon, amino acid change, the exon containing the mutation, the allelic frequency, the type of mutations and the bioinformatic prediction of the effect of the mutation on the function of the protein using three bioinformatic algorithms (SIFT, Memo and PolyPhen). c, Heat map showing the copy number variation profile of FAT1 genomic region in the patient-derived xenograft samples included in the analysis of hybrid EMT score. The colour code corresponds to the quantified copy number and the genomic coordinate (reference genome hg19) of bin set for quantification. The FAT1 gene is marked on each vertical edge. d, e, Box plot showing the distribution of the common mRNA signature (mouse skin and lung Fat1-cKO SCCs and human FAT1-knockout SCC cell line) compared to FAT1 mutation status in human lung SCC (TCGA database; for the analysis, only high-impact mutations in >20% of variant allele frequency were considered) (d) and FAT1 copy number variation status in human lung SCC (TCGA database) (e). Boundaries of the box indicate the first and third quartiles of the FAT1 RNA signature value. The bold horizontal line indicates the median and the two external horizontal lines shows the minimum and maximum values. The dots represent all data points. Differences between the two groups are assessed using a two-sided Wilcoxon rank-sum test. f, g, Venn diagram of the genes upregulated in the EPCAM+ Fat1-cKO skin SCC and upregulated in LGR5 EPCAM+ versus triple-negative hybrid EMT tumour cells (f) or in triple-negative versus EPCAM+ cells (g). Two-sided hypergeometric test.
Extended Data Fig. 6. EPCAM+ Fat1-cKO tumour cells are epigenetically primed to undergo EMT, whereas EPCAM− Fat1-cKO sustain the expression of epithelial program.
a, ATAC-seq profiles of the chromatin regulatory regions of mesenchymal genes closed in control EPCAM+ tumour cells and opened in EPCAM+ Fat1-cKO tumour cells, showing epigenetic priming of EPCAM+ Fat1-cKO tumour cells to undergo EMT. b, ATAC-seq profiles of the chromatin regulatory regions of mesenchymal genes with open chromatin regions only in EMT EPCAM− tumour cells. c, Transcription factor motifs enriched in the ATAC-seq peaks upregulated between the EPCAM+ Fat1-cKO and EPCAM+ control tumour cells as determined by Homer. Cumulative hypergeometric distributions. White boxes show core transcription factors; boxes highlighted in green show epithelial transcription factors; and boxes highlighted in orange show EMT transcription factors. d, Transcription factor motifs enriched in the ATAC-seq peaks that are upregulated between the EPCAM− Fat1-cKO and EPCAM− control tumour cells as determined by Homer analysis. Cumulative hypergeometric distributions. White boxes show core transcription factors; boxes highlighted in green show epithelial transcription factors; boxes highlighted in orange show EMT transcription factors; and boxes highlighted in grey show other transcription factors. e, ATAC-seq of the chromatin regulatory regions of epithelial genes with open chromatin regions in EPCAM− Fat1-cKO tumour cells as compared to EPCAM− tumour cells from LGR5-derived SCCs, showing the sustained opening of epithelial enhancers in EPCAM− Fat1-cKO tumour cells. f, ATAC-seq of the chromatin regulatory regions of epithelial genes that are closed upon EMT, irrespective of Fat1 deletion. g, Immunostaining for GFP and AP2G, KLF4, SOX2, p63, GRHL2 or ZEB1 in EPCAM+ and EPCAM− control and Fat1-cKO DMBA/TPA skin SCCs. Scale bar, 50 μm.
Extended Data Fig. 7. Loss of cell adhesion is not sufficient to induce the hybrid EMT phenotype.
a, Images showing spheroids formed 7 d after plating 4,000 FAT1 wild-type or FAT1 wild-type, CDH1-knockout human A388 skin SCC cells on an ultra-low adherent plate. b, Bar chart showing the quantification by FACS of the number of cells in FAT1 wild-type, and FAT1 wild-type and CDH1-knockout, spheroids. Mean + s.e.m., two-tailed t-test. c, Immunostaining for E-cadherin, YAP1, ZEB1 and SOX2 in FAT1 wild-type, and FAT1 wild-type and CDH1-knockout, tumour cells. Scale bar, 50 μm. d, Images showing spheroids formed 7 d after plating 4,000 FAT1-knockout or FAT1-knockout and CDH1-overexpressing human A388 skin SCC cells on an ultra-low attachment plate. e, Bar chart showing the quantification by FACS of the number of cells in FAT1-knockout or FAT1-knockout and CDH1-overexpressing spheroids. Mean + s.e.m., two-tailed t-test. f, Immunostaining for E-cadherin, YAP1, ZEB1 and SOX2 in FAT1-knockout or FAT1-knockout and CDH1-overexpressing tumour cells. Scale bar, 50 μm. g–i, Immunostaining of K14 and vimentin after subcutaneous transplantation of Fat1-cKO (g), Fat1 and Sox2 double-knockout (h) or Fat1, Yap1 and Taz triple-knockout (i) mouse skin SCC cells. Mean ± s.e.m. Scale bars, 50 μm. j, k, Venn diagram of the genes upregulated in EPCAM− Fat1-cKO skin SCC upon Sox2 deletion (j) or upon Yap1 and Taz deletion (k), and upregulated genes in hybrid EMT triple-negative cells versus late EMT triple-positive cells (early hybrid EMT signature) and in triple-positive versus EPCAM+ cells (late EMT signature). Two-sided hypergeometric test.
Extended Data Fig. 8. Phosphoproteomic analysis reveals signalling cascades downstream of FAT1 LOF.
a, Table showing kinases that are significantly more phosphorylated in FAT1 wild-type cells as compared to FAT1-knockout cells. t-test, FDR = 0.05, S 0 = 1. b, Bar chart showing the kinases that are predicted to phosphorylate phosphosites significantly enriched in FAT1 wild-type tumour cells. c, Table showing kinases that are significantly more phosphorylated in FAT1-knockout cells as compared to FAT1 wild-type cells. t-test, FDR = 0.05, S 0 = 1. d, Bar chart showing the kinases that are predicted to phosphorylate phosphosites that are significantly enriched in FAT1-knockout tumour cells. e, Table showing the sites in FAT1-knockout cells predicted to be phosphorylated by CAMK2. f, g, Western blot showing pEGFR and EGFR (f) or pMEK and MEK (g) in Fat1 wild-type and Fat1-knockout Lgr5-creER;KrasG12D; p53cKO;Fat1fl/fl;RYFP mouse skin SCC cells. h, Western blot showing the expression levels of pSRC, total SRC and YES on the input of wild-type and FAT1-knockout cells, and upon immunoprecipitation of SRC and YES (n = 4). The apparent molecular weight reference in kDa is indicated close to f–h.
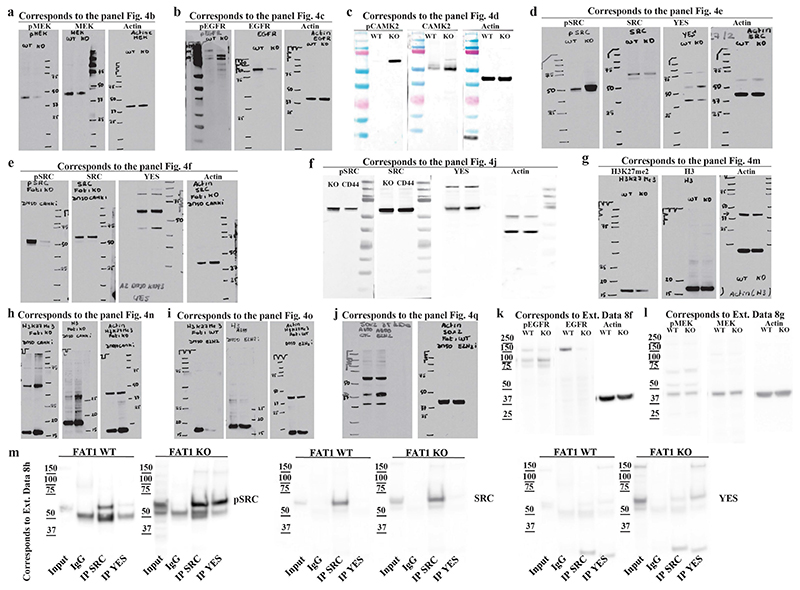
Extended Data Fig. 9. Full scan of western blot membranes.
a–k, Images showing full scan of western blot membranes displayed in Fig. 4. Each panel indicates the figure and the panel to which the full membrane image belongs. Molecular weight size standards are indicated on each membrane. In all the experiments the controls (β-actin) were run on the same gel as the samples.
Extended Data Fig. 10. Increase in YAP1 and SOX2 signalling downstream of FAT1 LOF is independent of the stiffness of the substrate.
a, Immunostaining for YAP1 in FAT1 wild-type and FAT1-knockout human SCC cells upon increasing stiffness conditions. Scale bar, 50 μm. b, Quantification of YAP1 expression on the basis of fluorescence intensity in FAT1 wild-type and FAT1-knockout cells in different stiffness conditions. Mean + s.e.m. c, Quantification of YAP1 nuclear/cytoplasmic ratio on the basis of fluorescence intensity in FAT1 wild-type and FAT1-knockout cells in different stiffness conditions. Mean + s.e.m. d, Immunostaining for SOX2 in FAT1 wild-type and FAT1-knockout human SCC cells in increasing stiffness conditions. Scale bar, 50 μm e, Model of the signalling pathways that are activated or repressed in FAT1-knockout cells to induce a hybrid EMT state and to predict a differential effect on the response to therapy.
Supplementary Material
Acknowledgements
We thank the ULB animal facility and ULB genomic core facility (F. Libert and A. Lefort); and J. Allard from CMMI (supported by the European Regional Development Fund and the Walloon Region). I.P. is supported by FNRS and Foundation Against Cancer (FCC). F.M. was supported by FNRS post-doctoral fellowship and by the TELEVIE. The Department of Pathology (Erasme Hospital, ULB) acknowledges Fonds Yvonne Boel. C. Decaestecker is a senior research associate in F.R.S.-FNRS. The patient-derived xenograft project was supported by Fonds Erasme. C. Blanpain is supported by WELBIO, FNRS, Fond Erasme, Fondation Contre le Cancer, ULB Foundation, European Research Council, Worldwide Cancer Research and the Foundation Baillet Latour.
Footnotes
Author contributions I.P., F.M. and C. Blanpain designed the experiments and performed data analysis. I.P. and F.M. performed most of the biological experiments. F.H. generated Fat1-cKO mice and provided her expertise. Y. Song performed bioinformatic analysis. F.d.C. and B.S. helped to perform CRISPR experiments. B.M. and V.J. performed intratracheal AdenoCRE installation for lung cancer generation. F.I. and D.V.H. performed phosphoproteomic analysis. M.O. and M.T. performed stiffness experiments. M.V. and D.P.-M. performed electron microscopy imaging and analysis. F.I. and D.V.H. performed phosphoproteomic analysis. Y.B. and C.S. performed analysis of patient survival using the TCGA database. I.S., Y. Sokolow, S.H., A.P.-B., B.A.-M., L.R.-B., P.J., M.D.T., P.R., R.S.-G., N.D’H., J.F.M.-C. and O.S. provided human samples. C. Balsat, C. Decaestecker and Y.-R.V.E. performed staining and analysis of patient-derived xenograft samples. C. Dubois performed FACS. V.M., S.L., G.L., J.B., M.R. and S.S. performed immunostainings, western blotting, treatments and follow-up of the mice. All authors read and approved the final manuscript.
Competing interests C. Blanpain, I.P. and F.M. are co-inventors on a patent application on the use of SRC inhibitors for the treatment of FAT1-mutated cancers.
Publisher’s note Springer Nature remains neutral with regard to jurisdictional claims in published maps and institutional affiliations.
Reporting summary
Further information on research design is available in the Nature Research Reporting Summary linked to this paper.
Peer review information Nature thanks Salvador Aznar Benitah and the other, anonymous, reviewer(s) for their contribution to the peer review of this work.
Reprints and permissions information is available at http://www.nature.com/reprints.
Data availability
All the raw sequencing data have been deposited in the Gene Expression Omnibus with the following accession numbers: mouse RNA-seq (GSE158502), human RNA-seq (GSE158501), ATAC-seq (GSE158501), whole-exome sequencing (GSE158503), low-coverage whole-genome sequencing (GSE158505) or a global accession number (GSE158506. The mass spectrometry proteomics data have been deposited to the ProteomeXchange Consortium via the PRIDE partner repository with the dataset identifier PXD022268. All other relevant data are available from the corresponding author upon reasonable request. Source data are provided with this paper.
References
- 1.Morris LG, et al. Recurrent somatic mutation of FAT1 in multiple human cancers leads to aberrant Wnt activation. Nat Genet. 2013;45:253–261. doi: 10.1038/ng.2538. [DOI] [PMC free article] [PubMed] [Google Scholar]
- 2.Dotto GP, Rustgi AK. Squamous cell cancers: a unified perspective on biology and genetics. Cancer Cell. 2016;29:622–637. doi: 10.1016/j.ccell.2016.04.004. [DOI] [PMC free article] [PubMed] [Google Scholar]
- 3.Sánchez-Danés A, Blanpain C. Deciphering the cells of origin of squamous cell carcinomas. Nat Rev Cancer. 2018;18:549–561. doi: 10.1038/s41568-018-0024-5. [DOI] [PMC free article] [PubMed] [Google Scholar]
- 4.The ICGC/TCGA Pan-Cancer Analysis of Whole Genomes Consortium. Pan-cancer analysis of whole genomes. Nature. 2020;578:82–93. doi: 10.1038/s41586-020-1969-6. [DOI] [PMC free article] [PubMed] [Google Scholar]
- 5.Lawrence MS, et al. Discovery and saturation analysis of cancer genes across 21 tumour types. Nature. 2014;505:495–501. doi: 10.1038/nature12912. [DOI] [PMC free article] [PubMed] [Google Scholar]
- 6.Li Z, et al. Loss of the FAT1 tumor suppressor promotes resistance to CDK4/6 inhibitors via the Hippo pathway. Cancer Cell. 2018;34:893–905.:e8. doi: 10.1016/j.ccell.2018.11.006. [DOI] [PMC free article] [PubMed] [Google Scholar]
- 7.Nassar D, Latil M, Boeckx B, Lambrechts D, Blanpain C. Genomic landscape of carcinogen-induced and genetically induced mouse skin squamous cell carcinoma. Nat Med. 2015;21:946–954. doi: 10.1038/nm.3878. [DOI] [PubMed] [Google Scholar]
- 8.Martin D, et al. Assembly and activation of the Hippo signalome by FAT1 tumor suppressor. Nat Commun. 2018;9:2372. doi: 10.1038/s41467-018-04590-1. [DOI] [PMC free article] [PubMed] [Google Scholar]
- 9.Hu X, et al. FAT1 prevents epithelial mesenchymal transition (EMT) via MAPK/ERK signaling pathway in esophageal squamous cell cancer. Cancer Lett. 2017;397:83–93. doi: 10.1016/j.canlet.2017.03.033. [DOI] [PubMed] [Google Scholar]
- 10.Srivastava C, et al. FAT1 modulates EMT and stemness genes expression in hypoxic glioblastoma. Int J Cancer. 2018;142:805–812. doi: 10.1002/ijc.31092. [DOI] [PubMed] [Google Scholar]
- 11.Pastushenko I, et al. Identification of the tumour transition states occurring during EMT. Nature. 2018;556:463–468. doi: 10.1038/s41586-018-0040-3. [DOI] [PubMed] [Google Scholar]
- 12.Latil M, et al. Cell-type-specific chromatin states differentially prime squamous cell carcinoma tumor-initiating cells for epithelial to mesenchymal transition. Cell Stem Cell. 2017;20:191–204.:e5. doi: 10.1016/j.stem.2016.10.018. [DOI] [PMC free article] [PubMed] [Google Scholar]
- 13.Pastushenko I, Blanpain C. EMT transition states during tumor progression and metastasis. Trends Cell Biol. 2019;29:212–226. doi: 10.1016/j.tcb.2018.12.001. [DOI] [PubMed] [Google Scholar]
- 14.Nieto MA, Huang RY, Jackson RA, Thiery JP. EMT: 2016. Cell. 2016;166:21–45. doi: 10.1016/j.cell.2016.06.028. [DOI] [PubMed] [Google Scholar]
- 15.Boumahdi S, et al. SOX2 controls tumour initiation and cancer stem-cell functions in squamous-cell carcinoma. Nature. 2014;511:246–250. doi: 10.1038/nature13305. [DOI] [PubMed] [Google Scholar]
- 16.Ferone G, et al. SOX2 is the determining oncogenic switch in promoting lung squamous cell carcinoma from different cells of origin. Cancer Cell. 2016;30:519–532. doi: 10.1016/j.ccell.2016.09.001. [DOI] [PMC free article] [PubMed] [Google Scholar]
- 17.Siegle JM, et al. SOX2 is a cancer-specific regulator of tumour initiating potential in cutaneous squamous cell carcinoma. Nat Commun. 2014;5:4511. doi: 10.1038/ncomms5511. [DOI] [PMC free article] [PubMed] [Google Scholar]
- 18.Cooper CD, Lampe PD. Casein kinase 1 regulates connexin-43 gap junction assembly. J Biol Chem. 2002;277:44962–44968. doi: 10.1074/jbc.M209427200. [DOI] [PubMed] [Google Scholar]
- 19.Lewis CA, Townsend PA, Isacke CM. Ca2+/calmodulin-dependent protein kinase mediates the phosphorylation of CD44 required for cell migration on hyaluronan. Biochem J. 2001;357:843–850. doi: 10.1042/0264-6021:3570843. [DOI] [PMC free article] [PubMed] [Google Scholar]
- 20.Huang RY, et al. Identification of CaMKII phosphorylation sites in connexin43 by high-resolution mass spectrometry. J Proteome Res. 2011;10:1098–1109. doi: 10.1021/pr1008702. [DOI] [PMC free article] [PubMed] [Google Scholar]
- 21.Chen C, Zhao S, Karnad A, Freeman JW. The biology and role of CD44 in cancer progression: therapeutic implications. J Hematol Oncol. 2018;11:64. doi: 10.1186/s13045-018-0605-5. [DOI] [PMC free article] [PubMed] [Google Scholar]
- 22.Jolly MK, et al. Interconnected feedback loops among ESRP1, HAS2, and CD44 regulate epithelial-mesenchymal plasticity in cancer. APL Bioeng. 2018;2:031908. doi: 10.1063/1.5024874. [DOI] [PMC free article] [PubMed] [Google Scholar]
- 23.Chellaiah MA, Biswas RS, Rittling SR, Denhardt DT, Hruska KA. Rho-dependent Rho kinase activation increases CD44 surface expression and bone resorption in osteoclasts. J Biol Chem. 2003;278:29086–29097. doi: 10.1074/jbc.M211074200. [DOI] [PubMed] [Google Scholar]
- 24.Göllner S, et al. Loss of the histone methyltransferase EZH2 induces resistance to multiple drugs in acute myeloid leukemia. Nat Med. 2017;23:69–78. doi: 10.1038/nm.4247. [DOI] [PMC free article] [PubMed] [Google Scholar]
- 25.Avgustinova A, Benitah SA. Epigenetic control of adult stem cell function. Nat Rev Mol Cell Biol. 2016;17:643–658. doi: 10.1038/nrm.2016.76. [DOI] [PubMed] [Google Scholar]
- 26.Panciera T, Azzolin L, Cordenonsi M, Piccolo S. Mechanobiology of YAP and TAZ in physiology and disease. Nat Rev Mol Cell Biol. 2017;18:758–770. doi: 10.1038/nrm.2017.87. [DOI] [PMC free article] [PubMed] [Google Scholar]
- 27.Machiels JP, et al. Afatinib versus methotrexate as second-line treatment in patients with recurrent or metastatic squamous-cell carcinoma of the head and neck progressing on or after platinum-based therapy (LUX-Head & Neck 1): an open-label, randomised phase 3 trial. Lancet Oncol. 2015;16:583–594. doi: 10.1016/S1470-2045(15)70124-5. [DOI] [PubMed] [Google Scholar]
- 28.Planchard D, et al. Dabrafenib plus trametinib in patients with previously untreated BRAFV600E-mutant metastatic non-small-cell lung cancer: an open-label, phase 2 trial. Lancet Oncol. 2017;18:1307–1316. doi: 10.1016/S1470-2045(17)30679-4. [DOI] [PubMed] [Google Scholar]
Associated Data
This section collects any data citations, data availability statements, or supplementary materials included in this article.
Supplementary Materials
Data Availability Statement
All the raw sequencing data have been deposited in the Gene Expression Omnibus with the following accession numbers: mouse RNA-seq (GSE158502), human RNA-seq (GSE158501), ATAC-seq (GSE158501), whole-exome sequencing (GSE158503), low-coverage whole-genome sequencing (GSE158505) or a global accession number (GSE158506. The mass spectrometry proteomics data have been deposited to the ProteomeXchange Consortium via the PRIDE partner repository with the dataset identifier PXD022268. All other relevant data are available from the corresponding author upon reasonable request. Source data are provided with this paper.


