Abstract
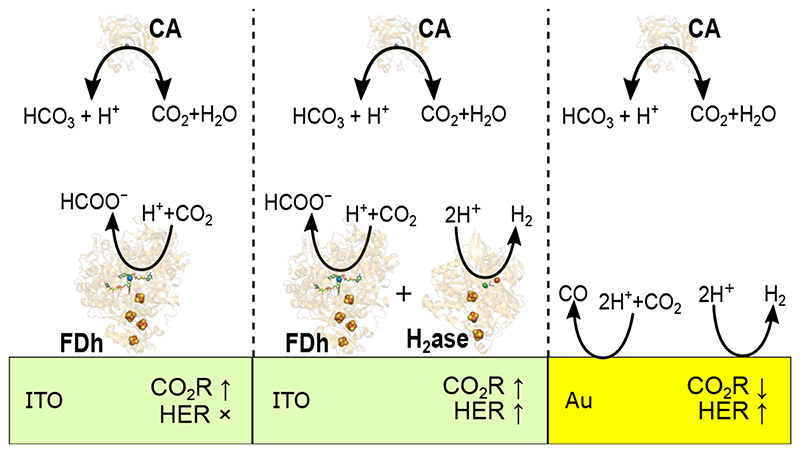
The performance of heterogeneous catalysts for electrocatalytic CO2 reduction (CO2R) suffers from unwanted side reactions and kinetic inefficiencies at the required large overpotential. However, immobilised CO2R enzymes — such as formate dehydrogenase — can operate with high turnover and selectivity at a minimal overpotential and are therefore ‘ideal’ model catalysts. Here, through the co-immobilisation of carbonic anhydrase, we study the effect of CO2 hydration on the local environment and performance of a range of disparate CO2R systems from enzymatic (formate dehydrogenase) to heterogeneous systems. We show that the co-immobilisation of carbonic anhydrase increases the kinetics of CO2 hydration at the electrode. This benefits enzymatic CO2 reduction — despite the decrease in CO2 concentration — due to a reduction in local pH change, whereas it is detrimental to heterogeneous catalysis (on Au), because the system is unable to suppress the H2 evolution side reaction. Understanding the role of CO2 hydration kinetics within the local environment on the performance of electrocatalyst systems provides important insights for the development of next generation synthetic CO2R catalysts.
Introduction
The development of a carbon neutral economy requires substituting our reliance on fossil fuels with sustainable fuels and chemical building blocks from renewable sources. Carbon capture and utilisation in the form of electrochemical CO2 reduction (CO2R) using intermittent renewable electricity provides a promising approach to address this global challenge. 1 To support the development of commercial CO2 electrolysis, improved catalysts and optimised electrochemical conditions will be needed to address the current challenges such as a limited efficiency and selectivity for CO2R. In particular, suppression of the H2 evolution reaction (HER) from an aqueous electrolyte solution is a major challenge to improve selectivity and requires a compromise in solution conditions such as pH, 2 electrolyte composition 3 and temperature, 4 which is often accompanied by a reduced CO2R performance.
The local chemical environment at electrodes for CO2R can be significantly different to the bulk solution, the understanding and manipulation of which is a key challenge in contemporary research. 5–9 Porous heterogeneous CO2R catalysts have been structured to generate large increases in the local pH within the electrode structure due to their hindered mass transport which can suppress HER, 9–14 increasing the CO2R selectivity. These systems exploit the inherently slow kinetics (~0.05 s−1) 15 of CO2 hydration (equation 1) by: (i) Allowing large local pH changes to reduce HER as buffering of the pH by CO2 hydration is kinetically slow and (ii) maintaining high CO2 concentrations despite the basic local environment to maximise the rate of CO2R. This increases the Faradaic efficiency (FE) of CO2R at the expense of a modest decrease in CO2 partial current density, 12 a compromise only required due to the poor selectivity of current benchmark heterogeneous CO2R catalysts, their high overpotentials and sluggish first order kinetics.
| (1) |
Enzymatic CO2R electrocatalysts such as formate dehydrogenase (FDh) perform nominally similar chemistry to heterogeneous catalysts. Although FDh is highly selective, possessing a high affinity for CO2 following Michaelis-Menten kinetics while exclusively producing formate, 16 it’s activity for CO2R is highly sensitive to pH. 17 As such the compromises of heterogeneous CO2R that exploit the fortuitously low uncatalysed rate of CO2 hydration may not be effective for enzymatic catalysis.
Like heterogeneous CO2R, enzymatic electrocatalysis also utilises porous electrodes 16,18–28 in applications ranging from sensing 20,28 to biofuel cells 24,25,27,29 and electrosynthesis, 16,17,19,22,26,30 predominantly to increase enzyme loadings to reach higher current densities and product yields as opposed to suppressing side reactions. This nanoconfinement within pores can increase the local concentrations of redox mediators and intermediates for enzymatic cascade reactions, 21–23,31 but similarly to heterogeneous catalysis, creates large local pH changes that can be damaging to the activity of enzymes due to their high sensitivity to solution pH. 17,32 By adding kinetically fast buffers the local pH changes can be reduced and more closely matched to the enzyme’s optimal performance 33 without concern for side reactions. However, the addition of buffers in heterogeneous CO2R significantly increased HER on Cu due to the decrease in local pH, with minimal increase in CO2R. 8
While additional buffers offer one route to address the detrimental effect of local pH changes, their presence can inhibit enzyme activity, 33,34 and their role as proton donors mean they can play an active role in the catalytic mechanism. 35,36 They may also not be innocent electrolytes and can be oxidised at modest potentials, 37 so should be avoided when the anodic half reaction occurs in the same compartment such as in photoelectrochemical leaf devices. 19,38,39 Additional components also increase the complexity of product separation after catalysis. As such, for the development of highly optimised catalytic systems the buffer choice must be carefully considered. 33,35 If the slow kinetics of CO2 hydration can be overcome, CO2/HCO3 − can actively buffer and assist in improving the local environment as opposed to just being present as a substrate and removing the potentially harmful interactions of an additional buffer system with the enzyme.
In nature CO2 hydration is frequently catalysed by carbonic anhydrase (CA), a non-redox enzyme that plays a key role in numerous metabolic processes, with rates as high as 1 × 10⁶ s−1. 40 CA also catalyses the reverse reaction from HCO3 − to CO2 and has recently garnered interest for use in low or no CO2 systems to kinetically improve the dehydration of HCO3 − for CO2 utilisation 23,41 and to conclusively prove that formate dehydrogenase reduces CO2 and not HCO3 −. 42 CA has also been used in enzymatic CO2 reduction by a cofactor dependent FDh with NADH recycling to improve system performance by increasing CO2 solubilisation at reduced CO2 concentrations (20% CO2 in N2), although the reported FE was only ~10%. 43
This recent interest in CA to enhance CO2 hydration in electrocatalysis has been limited to low CO2 enzymatic systems with a focus on increasing solution CO2. However, the effect of CA on saturated CO2 conditions that offer greater reaction rates, where heterogeneous systems benefit from slow CO2 hydration has yet to be investigated. In this work, CA is used to understand the differing role of CO2 hydration kinetics in activity and selectivity from enzymatic to heterogeneous CO2R catalysts. It’s role in the modification of the pH, concentration of CO2 and proton donors in the local environment is resolved using finite element modelling (FEM) in combination with electrochemical measurements. The unique properties of enzymes are exploited to allow the complicated interactions of competing side reactions and kinetic effects to be decoupled and selectively introduced to bridge the gap between the state-of-the-art for enzymatic and heterogeneous CO2R and the role of fast CO2 hydration kinetics in their optimal performance.
Results and Discussion
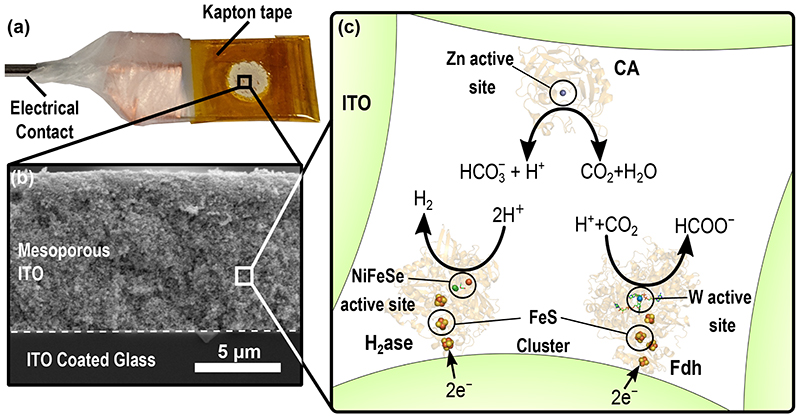
[NiFeSe]-hydrogenase (H2ase) and W-formate dehydrogenase (FDh) from Desulfovibrio vulgaris Hildenborough were co-immobilised either separately or together with the non-redox enzyme CA from bovine erythrocytes on mesoporous ITO electrodes (Figure 1) to catalyse electrocatalytic fuel forming reactions and CO2 hydration, respectively, simultaneously within the local electrode environment. CA from bovine erythrocytes (EC 4.2.1.1, Figure 1c) was chosen to catalyse CO2/HCO3 − equilibration due to its robustness, ready availability and fast kinetics. 44 This improves the kinetics of the bicarbonate buffer system, rapidly interconverting CO2 and HCO3 − to maintain the thermodynamic equilibrium with pH. H2ase is a H2 cycling enzyme that can undergo direct electron transfer when immobilised on an electrode surface 18 and it’s activity is relatively insensitive to [CO2] (SI Table 1), while being significantly affected by the basic local pH environment that is generated by the enzyme reaction due to its consumption of H+. FDh offers high activity and selectivity for CO2 reduction to formate and its electrochemical reversibility makes it an ideal model catalyst for understanding fundamental properties of CO2R. 16
Figure 1.
The co-immobilisation of enzymes within mesoporous ITO electrodes (a) Photograph of a mesoporous ITO electrode insulated with Kapton tape (b) Edge view SEM image of mesoporous ITO electrode (9k× magnification, SEM HV: 10 kV, WD: 15.1 mm) (c) Schematic description of enzyme immobilisation within porous ITO electrodes and their respective catalytic reactions. CA (PDB:1V9E) catalyses the hydration of CO2 to H2CO3 that rapidly dissociates to HCO3 − and H+. This enzyme acts to remove the kinetic limitation of the bicarbonate buffer system within the pore and does not exchange electrons with the porous ITO electrode. H2ase (PDB: 5JSK) can undergo 2e− direct electron transfer from an electrode to catalyse the reduction of H+ to H2. FDh (PDB: 6SDV) can undergo 2e− direct electron transfer from an electrode to catalyse the reduction of CO2 to formate, consuming 1H+ net.
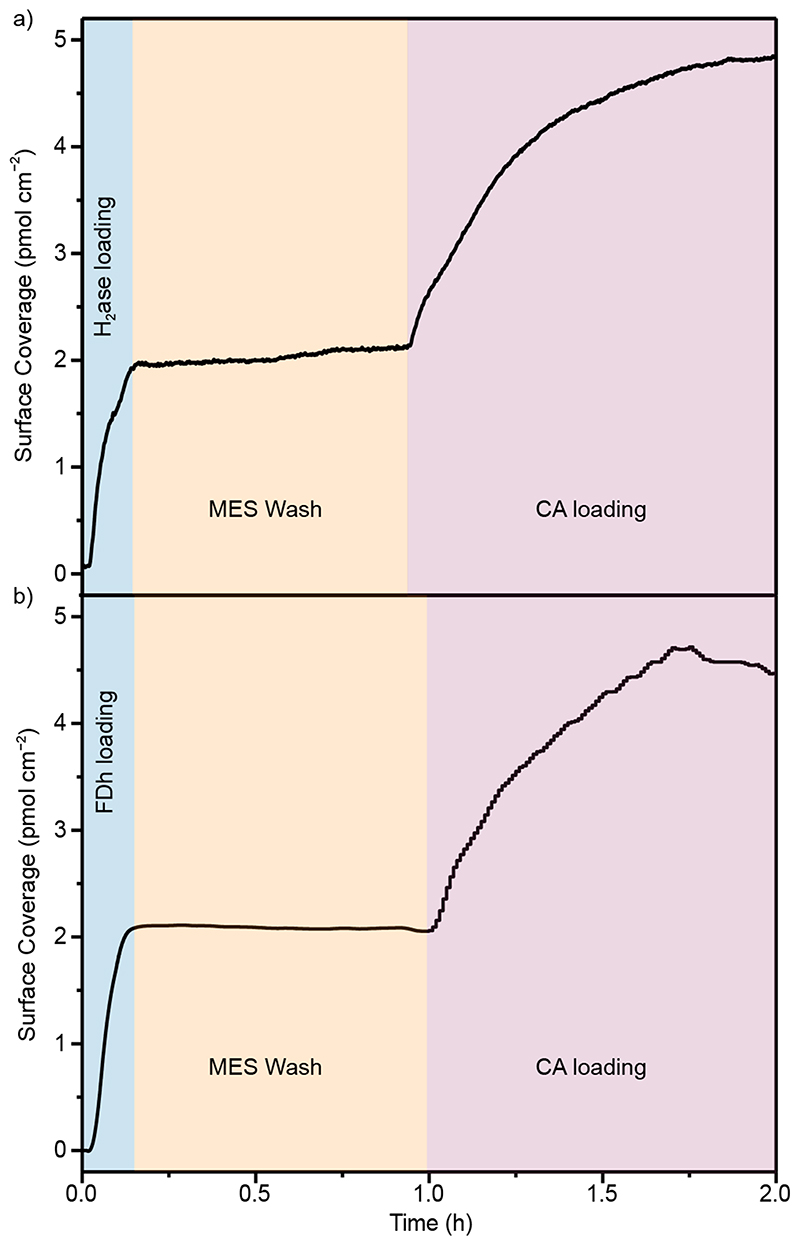
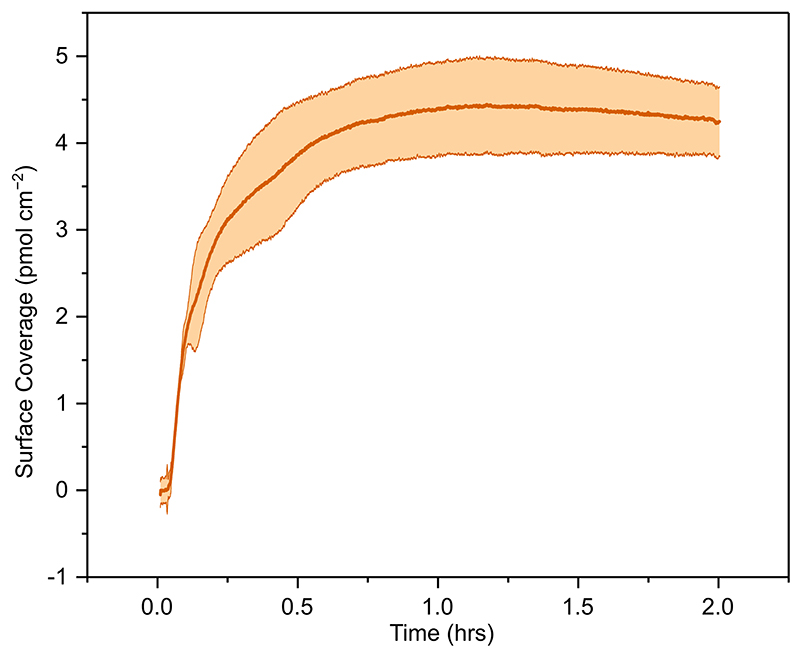
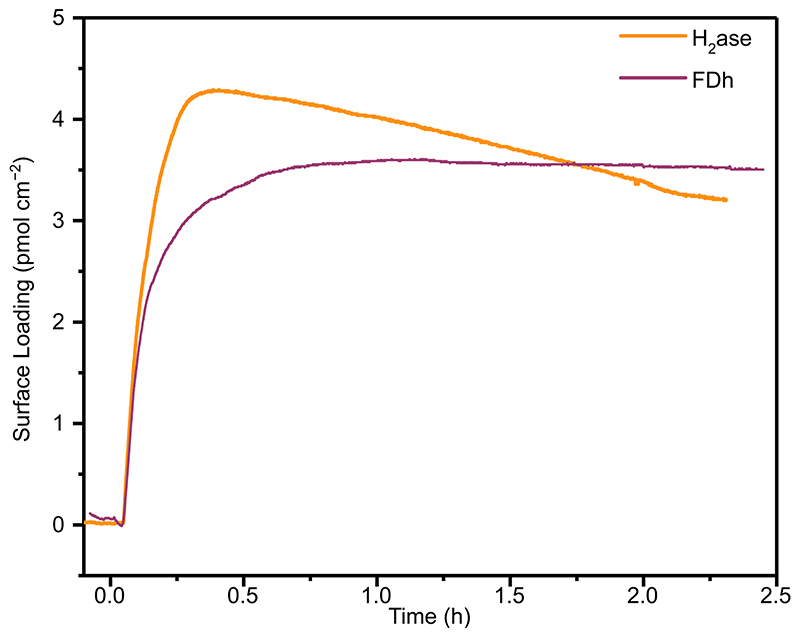
CA was immobilised on a planar ITO electrode surface with a maximum surface coverage of 4.3 ± 0.4 pmol cm−2 (Extended Data Figure 1) determined using a quartz crystal microbalance (QCM). Immobilisation of FDh or H2ase resulted in saturated surface coverages of 4.2 and 3.8 pmol cm−2, respectively (Extended Data Figure 2). For co-immobilisation of the redox enzyme with CA, H2ase (Figure 2a) or FDh (Figure 2b) was first immobilised in separate experiments to approximately half saturated coverage, then the solution was changed to enzyme free Good’s buffer (0.1 M 2-(N-morpholino)ethanesulfonic acid (MES) buffer and 0.05 M KCl), followed by the buffer solution containing CA (30 pmol), which was loaded until saturation.
Figure 2. Co-immobilisation of H2ase and FDh with CA on planar ITO.
QCM showing (a) co-immobilisation of H2ase and CA, with H2ase loaded to ~½ saturation followed by MES washing then CA loading to saturation. (b) Co-immobilisation of FDh and CA, with FDh loaded to ~½ saturation followed by MES washing then CA loading to saturation. Conditions: 30 pmol of enzyme (CA, H2ase or FDh) in 1 mL MES buffer (0.1 M, pH 6.5) recirculated over an ITO-coated QCM chip (area = 0.79 cm–2) at 0.141 mL min–1. MES wash: 0.1 M MES buffer (pH 6.5) circulated over ITO at 0.141 mL min–1.T= 25 °C.
Immobilisation of H2ase and FDh on planar ITO at surface coverages below saturation, shows that the enzyme film was stable with no marked desorption observed by QCM during MES washing (Figure 2). In the electrochemical experiments in this work, mesoporous ITO electrodes with a high surface area were used (46 nm particle size, 9 μm film thickness, geometric surface area = 0.19 cm2, absolute surface area= 139 cm2, Extended Data Figure 3). The final enzyme loadings from the well-defined areas of planar surfaces used for QCM can be used to guide the loadings used on porous electrodes, with enzyme quantities chosen to be well below the saturation of the porous ITO electrodes used (maximum saturated surface loading = 600, 560 and 530 pmol for CA, H2ase and FDh, respectively, calculated from loadings on planar surfaces). Remaining well below the electrode saturation ensures quantitative and stable loading onto the porous electrodes.
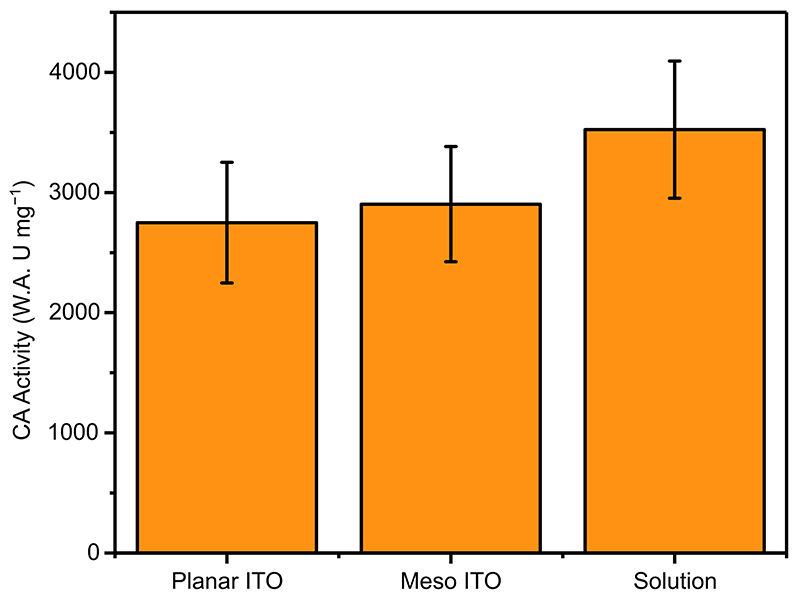
CA was shown by a Wilbur-Anderson solution assay 45 to be effective at catalysing CO2 hydration both in solution and when immobilised on a mesoporous ITO electrode with a rate of 3500 ± 570 and 2900 ± 470 W.A. U mg−1, respectively (Extended Data Figure 4), equivalent to a turnover frequency of 4.9 × 10 4 s−1 (SI Figure 1, SI Table 2). The python script used to simulate Wilbur-Anderson solution assays and calculate turnover frequencies is freely available (SI page 13). The comparable activity observed when CA is immobilised indicates that the enzyme remains active on the ITO surface, allowing it to locally catalyse CO2 hydration.
Effect of CA on the local pH
The reduction of H+ to H2 by H2ase (20 pmol) increases the local pH within a mesoporous electrode, a system where the concentration of CO2 is irrelevant to the activity of the enzyme whilst being affected by the solution pH. 32 Thus, the activity of this system resolves the effect of CA on the local pH, without convolution from the buffer system also acting as a substrate.
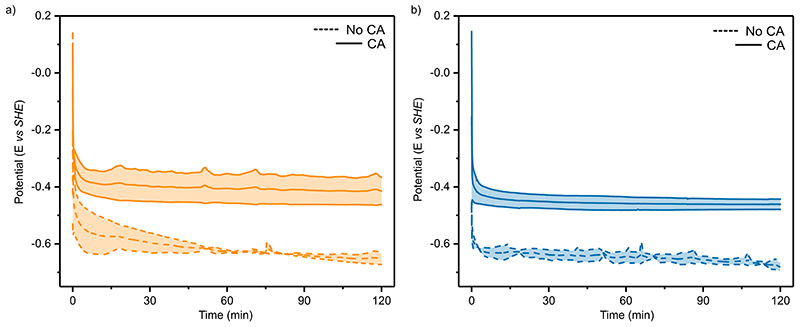
In CO2 purged aqueous 0.1 M KHCO3 solution (Figure 3a, purple, pH 6.67), the immobilisation of CA (40 pmol) on the electrode surface improved the partial current densities for H2 production (jH2 ; calculated from the total current density corrected by the FE for H2 quantified by gas chromatography), from −0.18 ± 0.06 to −0.47 ± 0.05 mA cm−2 at −0.65 V vs SHE. In all solutions and in the presence and absence of CA the FE was invariant at 86±8% with no other products detected by gas chromatography in the headspace or ion chromatography in the electrolyte solution. Immobilised CA did not produce H2, CO or HCOO− (SI Table 3) and therefore the increase in current must be derived from an improved activity of H2ase. Galvanostatic experiments performed in CO2 purged 0.1 M KHCO3 at −0.18 mA cm−2 (the maximal current density observed in the absence of CA) showed no difference in selectivity when CA was added (89±6 and 87±7 in the absence and presence of CA, respectively). This is due to the near unity selectivity of H2ase across the conditions used in this work, with CA mitigating the local pH change to increase the relative activity of the H2ase. This reduces the potential required to produce the desired current density, but the selectivity is unaffected (Extended Data Figure 5a).
Figure 3. The electrochemical performance and simulated local environment of H2ase with and without CA co-immobilisation.
(a) Experimental and simulated partial current densities for H2 production from controlled potential electrolysis with 20 pmol H2ase immobilised on a mesoporous ITO electrode (H2 quantified by online GC). Points represent averages of at least three independent stepped-chronoamperometry experiments, where filled circles used co-immobilised CA (40 pmol) on the electrode surface and unfilled no CA. Error bars represent the standard deviation. (b) Average pH within the porous electrode from FEM at steady state at different applied potentials. For a-b lines represent simulated results from FEM, solid lines are with CA and dashed lines without. For N2 purged MES the absence of HCO3 − and CO2 means the model results are identical with and without CA and as such are perfectly overlaid. (c) Effect of pH on activity. The solid black line represents the enzyme pH activity determined from solution assay 32 and the points are the average pH value from FEM within the porous electrode at −0.65 V vs SHE. Dashed vertical lines are the bulk solution pH. Solution conditions for a-c; Purple: CO2 purged 0.1 M KHCO3 + 0.05 M KCl (pH 6.67); Orange: CO2 purged 0.05 M KHCO3+ 0.05 M MES + 0.05 M KCl (pH 6.45); Blue: N2 purged 0.132 M MES + 0.05 M KHCO3 (pH 6.45). All experiments conducted at 20°C. note: the simulated results for N2 purged 0.132 M MES with and without CA (blue solid and dashed lines, respectively) are identical and directly overlaid.
A Finite Element Model (FEM) including the electrode and diffusion layer geometry (SI Figure 2); enzyme and solution kinetics and thermodynamics; enzyme activity factors and mass transport was built to understand the observed activity increase (SI page 15). This was predictive of the experimental outcome, using fundamental and well understood properties of the system as inputs, instead of experimental currents. This provides insight into the system that cannot be gained by purely experimental methods, as the direct measurement of local pH and solution properties is at best difficult and in some cases currently not possible. 6 Using FEM the solution composition can be investigated at any point in space and time and related to the performance of the system.
The model closely matched the experimental currents in all cases (Figure 3a, lines), suggesting there are no significant specific interactions of any solution component with the enzyme or electrodes that have not been considered, and the catalysis of CO2 hydration by CA was sufficient to explain the differing currents observed in its presence. From this it was possible to use the FEM to explore the local environment within the porous electrode. A smaller local pH change was observed in the presence of CA (0.92 vs 1.5 pH units at −0.65 V vs SHE at steady state, Figure 3b) due to the improved kinetics of CO2 hydration, placing the enzyme activity closer to the enzyme’s optimal (Figure 3c). The difference in local pH when CA was immobilised was largest at greater overpotentials due to the increased current densities. The large pH change and minimal change in [CO2] in the absence of CA (Extended Data Figure 6) demonstrates that over the diffusion lengths in this system there is insufficient time for CO2 to react to form HCO3 − and H+ and act as a buffer. Whereas in the presence of CA, CO2, H+ and HCO3 − are in equilibrium, with increased CA concentrations having little effect on the local pH (<0.01 pH units, SI Figure 3). Therefore, in the absence of CA the local pH of 0.1 M KHCO3 is predominantly controlled by the diffusion of H+ as opposed to the reaction and diffusion of buffer components which possess a flux orders of magnitude higher than H+ due to their increased concentration.
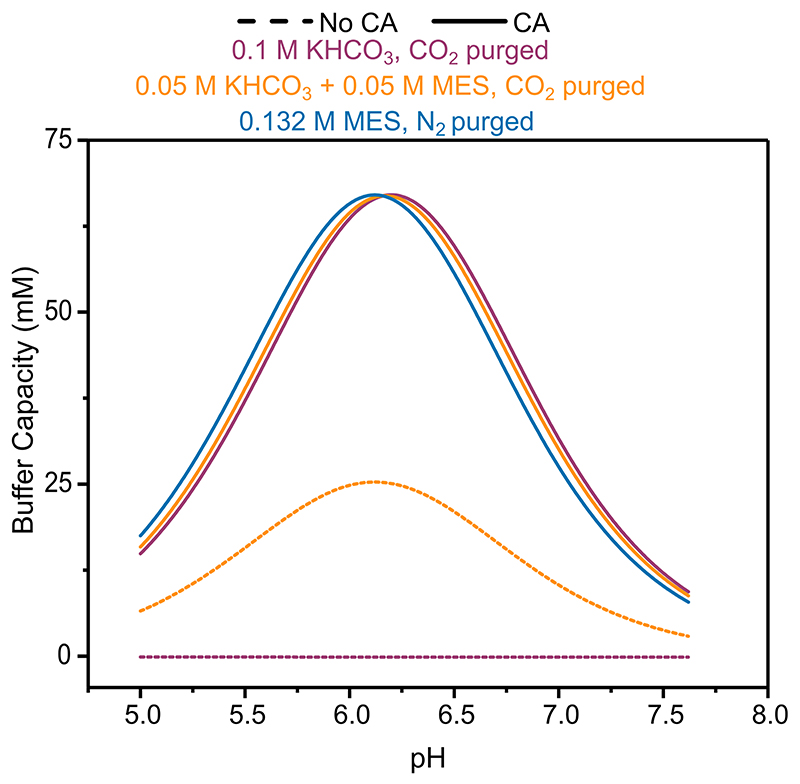
Replacing 50 mM of KHCO3 with kinetically fast MES buffer (0.05 M KHCO3 + 0.05 M MES, Figure 3-orange) increased jH2 from −0.18 ± 0.06 to −0.40 ± 0.05 mA cm−2 at −0.65 V vs SHE in the absence of CA, and −0.57 ± 0.04 mA cm−2 when co-immobilised with CA. MES provides a kinetically fast analogue of the HCO3 − buffer system, possessing a similar pKa (6.27 vs 6.34), but requiring no hydration step. Therefore, MES provides greater buffer capacity in the absence of CA and almost identical buffer capacities when CA was immobilised (Extended Data Figure 7). This mitigates the local pH change in a way uncatalysed HCO3 − does not, maintaining a pH closer to the enzyme’s optimal. The lower bulk pH of 0.05 M KHCO3 + 0.05 M MES was required to lower the bulk HCO3 − concentration and resulted in a lower local pH despite the comparable buffer capacity, responsible for the increased currents when CA was immobilised. This result was within error of N2 purged MES buffer (0.132 M MES, pH 6.45, Figure 3, blue) with a comparable buffer capacity (Extended Data Figure 7) at the same pH (jH2 = −0.62 ± 0.1 mA cm−2), demonstrating the similarities between a diffusion limited buffer and CO2/HCO3 − when catalysed by CA. The addition of CA had no effect on the H2ase activity in N2 purged MES buffer (jH2= −0.59 ± 0.02 mA cm−2) due to the absence of substrate. This is supported by the FEM which gave identical results irrespective of CA co-immobilisation. These results trend strongly with the calculated local pH (Figure 3c), where higher effective buffer capacities lead to a lower local pH.
Effect of CA on enzymatic CO2 reduction
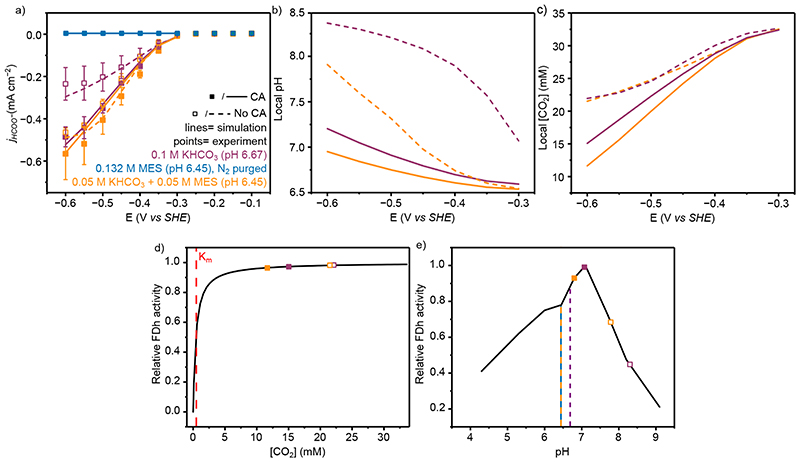
The activity of FDh for CO2R also displays pH dependence, with an optimum at pH 7.1 from solution assays, 17 higher than the pH of CO2 purged 0.1 M KHCO3 (pH= 6.67). Therefore, some increase in the local pH is desirable, but the activity drops rapidly beyond this point and any local pH changes should be modest for high activity. For CO2R the buffer component is also the enzyme substrate, further complicating the system. In CO2 purged 0.1 M KHCO3 the co-immobilisation of CA (40 pmol) with FDh (50 pmol), increased formate partial current densities (jHCOO- ; calculated from the total current density corrected by the FE for formate quantified by ion chromatography) from −0.24 ± 0.06 to −0.49 ± 0.05 mA cm−2 (Figure 4a). The FE was 96±6 % by ion chromatography with no other gas products detected in the headspace (e.g. H2, CO) by gas chromatography under any condition. Therefore, the increase in current is solely due to an increase in FDh activity, as opposed to any change in specificity. For FDh in the absence of CO2 and HCO3 − (with or without CA) no appreciable current is observed (−6 ± 1 μA cm−2 in N2 purged pH 6.45 MES buffer) and no product was detected by ion or gas chromatography (Figure 4a). Galvanostatic experiments in CO2 purged 0.1 M KHCO3 at −0.24 mA cm−2 showed no change in selectivity when CA was added (95±6 and 97±4 in the absence and presence of CA, respectively). As with H2ase, this is due to the near unity selectivity across the range of conditions used, with CA improving the local pH environment and enzyme activity leading to a less negative applied potential when same current was applied galvanostatically (Extended Data Figure 5b).
Figure 4. The electrochemical performance and simulated local environment of FDh with and without CA co-immobilisation.
(a) Experimental and simulated partial current densities for HCOO− quantified by ion chromatography from controlled potential electrolysis of 50 pmol FDh immobilised on a mesoporous ITO electrode. Points represent averages of at least three independent stepped-chronoamperometry experiments, where filled circles used co-immobilised CA (40 pmol) on the electrode surface and unfilled no CA. Error bars represent the standard deviation (b) Average pH and (c) CO2 concentration within the mesoporous electrode from the FEM at steady state. For a-c lines represent simulated results from the FEM, with solid lines are with CA and dashed lines without. (d) Effect of CO2 concentration on CO2R activity. The line represents the enzyme Michaelis-Menten kinetics determined from solution assay (KM = 0.420 mM) 17 and the points are the concentrations used in this work. e) Effect of pH on activity. The line represents the enzyme pH activity determined from solution assay 17 and the points are the average values from FEM within the mesoporous electrode for the system used. Dashed vertical lines are the bulk solution pH. Solution conditions; Purple: CO2 purged 0.1 M KHCO3 and 0.05 M KCl (pH 6.67); Orange: CO2 purged 0.05 M KHCO3, 0.05 M MES and 0.05 M KCl (pH 6.45); Blue: N2 purged 0.132 M MES + 0.05 M KHCO3 (pH 6.45). All experiments conducted at 20°C.
The FEM model is in good agreement with the experimental currents (Figure 4a), allowing the local environment to be assessed and providing further evidence that the improved hydration of CO2 is responsible for the observed current increase.
The local pH varied by 1.5 pH units across the solutions and electrodes used and was up to 2 pH units from the bulk pH at the highest overpotentials (Figure 4b). Despite similar current densities and the net consumption of 1 H+ for CO2R with FDh vs 2 H+ for HER by H2ase, the range of ΔpH is larger but maintains overall the same trend as H2ase. This is due to the lack of convection from H2 bubble formation causing a thicker diffusion layer and slower replenishment of depleted protons at the electrode surface from bulk solution. When CA is present, the local pH is closer to the enzyme optimal, leading to an increase in catalytic activity.
The substitution of 50 mM KHCO3 for 50 mM MES (0.05 M KHCO3 and 0.05 M MES, pH 6.45) displayed a similar trend to HER, with the increased buffer capacity leading to a reduced local pH (Figure 4b), and a greater maximum jHCOO− (−0.46 ± 0.01 mA cm−2) than in 0.1 M KHCO3 when CA was not present (Figure 4a, orange unfilled points). Co-immobilisation of CA increased the maximum jHCOO− to −0.56 ± 0.12 mA cm−2 (Figure 4a, filled orange points) by further reducing the ΔpH (Figure 4b) due to a greater buffer capacity. In all cases CA significantly reduces the [CO2] within the electrode (Figure 4c) by hydrating it to form HCO3 − and H+, but the high affinity of FDh for CO2 (K M= 0.420 mM) 17 means this reduction has a minimal effect on the relative activity of the system (98% to 97%, Figure 4d). Therefore, local pH effects dominate the current response (Figure 4e), as the relative CO2R activity can be improved from 44% to 98% of its maximal activity by the co-immobilisation of CA. It is therefore advantageous to sacrifice the substrate concentration to provide an improved local pH environment for the overall performance of the system.
Enzymatic mimic of heterogeneous CO2R
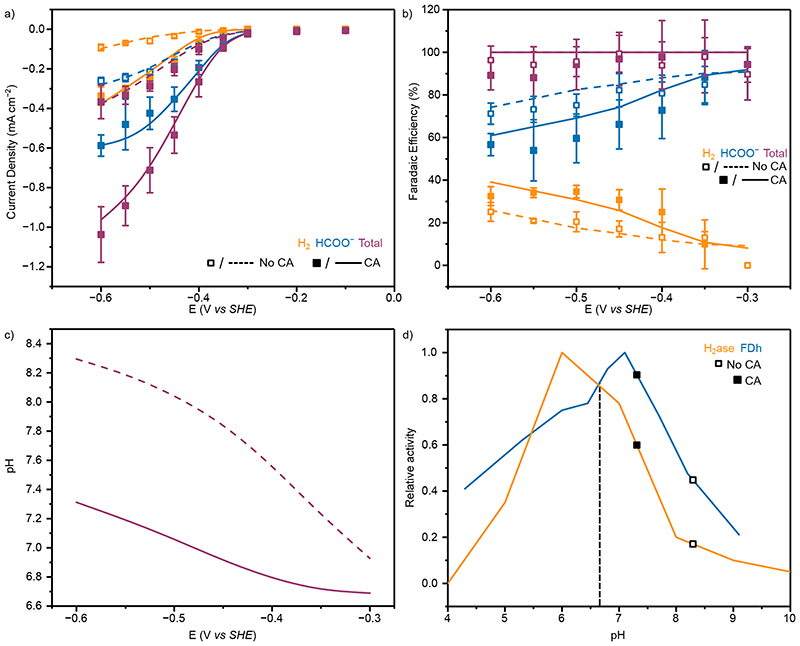
By co-immobilising the two redox enzymes H2ase and FDh (20 and 50 pmol, respectively) on a porous electrode it is possible to build a system that begins to mimic ‘non-ideal’ heterogeneous catalysis as the electrode is no longer selective for only one reaction, while maintaining the pH dependences and Michaelis-Menten kinetics of enzymes (Figure 5).
Figure 5. The electrochemical performance of the co-immobilisation of FDh and H2ase with and without CA co-immobilisation in 0.1 M KHCO3.
(a) Experimental (points) and simulated (lines) total (purple) and partial current densities for H2 (orange) and HCOO− (blue) from controlled potential electrolysis of 20 pmol H2ase and 50 pmol FDh co-immobilised on a mesoporous ITO electrode. Points represent averages of at least three independent stepped-chronoamperometry experiments, where filled squares used co-immobilised CA (40 pmol) on the electrode surface an.d unfilled no CA. Error bars represent the standard deviation (b)Experimental (points) and simulated (lines) H2 (orange), HCOO− (blue) and total (purple) FE with (filled points/solid lines) and without (empty points/dashed lines). (c) Average pH and (d) Effect of pH on activity. The line represents the enzyme pH activity determined from solution assay 17,32 and the points are the average values from FEM within the mesoporous electrode for the system used. Dashed vertical lines are the bulk solution pH. Solution conditions; CO2 purged 0.1 M KHCO3 and 0.05 M KCl (pH 6.67). All experiments conducted at 20°C.
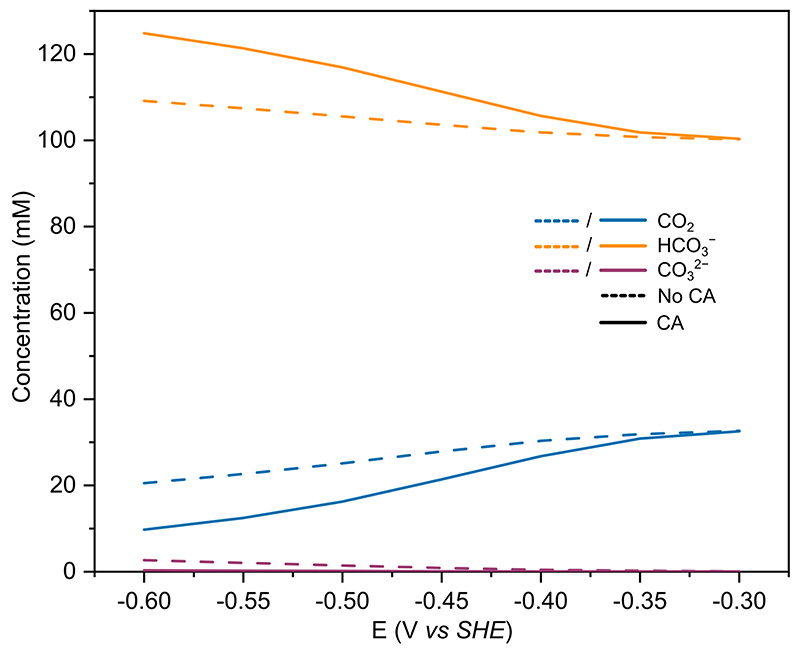
CA co-immobilisation increased the total current density from −0.37±0.08 to −1.04±0.14 mA cm−2 and the partial current density for both CO2R (-0.26±0.02 to −0.58±0.05 mA cm−2) and HER (-0.09±0.02 to −0.33±0.05 mA cm−2) (Figure 5a), in a similar manner to when each redox enzyme was immobilised individually. The increase in H2ase activity is relatively larger, leading to an increase in FE for HER from 25±4% to 32±4%, and concomitant decrease in the FE for CO2R from 71±5% to 57±5%, while the overall FE for the two processes remains close to unity (94±4%) across the entire potential range. This result mirrors the outcome from the FEM, with the total and partial current densities in good agreement with experiment. As with the single redox enzymes above, CA co-immobilisation decreases the local pH at the electrode (Figure 5c) causing the increases in activity (Figure 5d). The co-immobilisation of CA, as above, reduced the local [CO2] from 20.5 to 9.7 mM at −0.6 vs SHE (Extended Data Figure 8) due to increased CO2 hydration to form HCO3 − and rate of consumption at the electrode. However, unlike in heterogenous catalysis, the [CO2] remains above the Km and the activity of FDh is negligibly affected by the reduced local substrate concentration from fast CO2 hydration kinetics(SI Figure 4).
Comparison to Heterogeneous CO2R
The slow kinetics of CO2 hydration has differing effects on enzymatic and heterogeneous CO2R. Polycrystalline Au in CO2 purged 0.1 M KHCO3 (pH 6.67) is a common and well-studied system for heterogeneous CO2R, where the simple product distribution of a planar Au surface (almost exclusively CO and H2 at the overpotentials used, −0.8 to −1.2 V vs SHE) offers an ideal comparison to enzymatic systems, while the first order kinetics of Au CO2R gives a different response to [CO2]. Also, unlike single redox enzyme systems, the heterogenous system is not selective for CO2R, with significant current densities for HER.
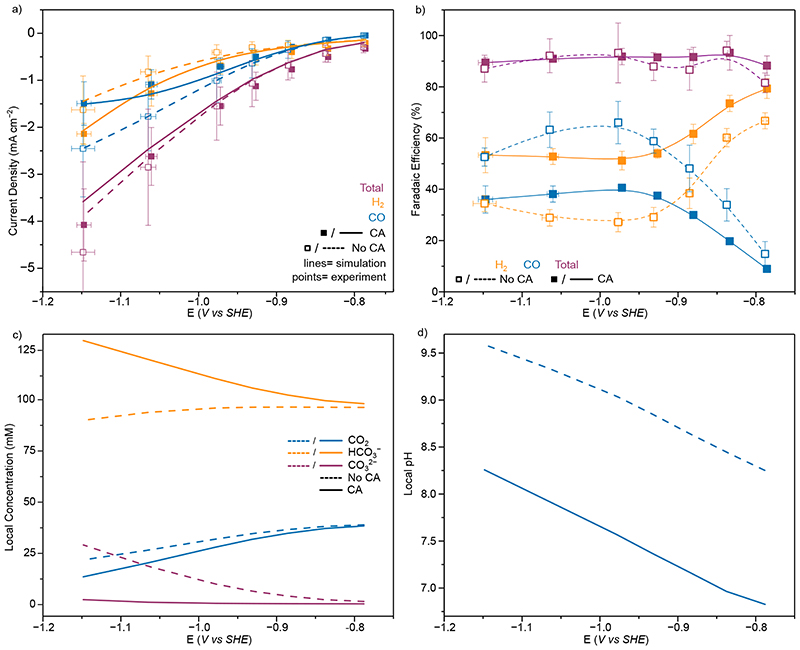
Electrocatalysis of polished Au foil (roughness factor = 15, Area = 1 cm2, SI Figure 5 and 6) in CO2 purged 0.1 M KHCO3 gave maximal current densities of −2.45 ± 0.25 mA cm−2 and −1.6 ± 0.6 mA cm−2 for CO2R and HER, respectively at −1.15 V vs SHE, the most negative potential used (Figure 6a). The peak FE for CO2R to CO was 66% at −0.97 V vs SHE (Figure 6b), quantified by gas chromatography. The addition of CA (20 μM in solution) reduced the partial current density for CO2R to −1.5 ± 0.4 mA cm−2 and increased the partial current density for HER to −2.1 ± 0.2 mA cm−2 (Figure 6a) determined by gas chromatography. This is unlike in the heterogeneous enzyme mimic, where fast CO2 hydration kinetics increased the rate of both CO2R and HER. The peak FE of CO2R was reduced to 41% and a corresponding increase was observed for HER from 27 to 51% at −0.97 V vs SHE (Figure 6b), a more pronounced change than in the heterogeneous enzymatic mimic due to the contrary effect on CO2R. A comparable response was observed when the experiment was conducted galvanostatically (Extended Data Figure 9), with a peak FE of 64% for CO at 2 mA cm−2 in the absence of CA and 37% in the presence of CA.
Figure 6.
CO2R on Au with and without CA (20 µM) in 0.1 M KHCO3 solution (a) Experimental (points) and simulated (lines) total (purple) and partial current densities for H2 (orange) and CO (blue) from controlled potential electrolysis of Au. Points represent averages of at least three independent stepped-chronoamperometry experiments, where filled points were with CA (20 µM) in solution and unfilled without. (b) Experimental H2 (orange), CO (blue) and total (purple) FE. Lines added to guide the eye and do not represent fits (c) Simulated concentrations at the electrode surface for CO2 (blue), HCO3 − (orange) and CO3 2− (purple) with (solid lines) and without (dashed lines) CA in solution. (d) Electrode surface pH from FEM with (solid lines) and without (dashed lines) CA in solution. Points represent averages of at least three independent stepped-chronoamperometry experiments, where filled points were with CA immobilised on the electrode surface and unfilled without. Y Error bars represent the standard deviation of measured currents and X the standard deviation in applied potential due to the ohmic drop correction of multiple measurements(n=4). All experiments conducted at 20°C
A 1D finite element model was developed to describe CO2R at a planar Au electrode (SI page 24), following an approach and kinetic equations similar to those reported previously. 46 The simulated currents were in good agreement with the experiment (Figure 6a), demonstrating the experimentally observed currents can be replicated purely by increased CO2 hydration kinetics in solution due to the presence of CA.
From FEM it is apparent that the CA in solution is rapidly converting CO2 to HCO3 − to buffer the local pH change (Figure 6c and d) and the local pH change with CA present is dramatically reduced (~1.5 pH unit reduction). HCO3 − is the main proton donor for HER, therefore the increased [HCO3 −] at the surface increases HER currents in a similar manner to the enzymatic mimic of heterogeneous catalysis above. However, the first order kinetics of heterogeneous CO2R on Au mean the reduced [CO2] when CA is added is detrimental to the rate of CO2R, as opposed to in the enzyme mimic where the reduction in substrate concentration has a negligible effect on activity and the increased FDh activity is driven by the closer to optimal pH environment when CA is co-immobilised. As such in the case of heterogeneous catalysis, fast CO2 hydration kinetics have a much more pronounced effect on the FE for CO2R than in the enzymatic mimic.
The uncatalysed hydration of CO2 has been previously used to keep the [CO2] high within the highly basic local environment of metallic porous electrodes. 10–12 The effects observed on planar Au electrodes would be amplified in porous microenvironments. The catalysis of CO2 hydration would lead to low CO2 concentrations at the high pH values observed 9 and the reduced local pH change would increase the rate of HER like adding other buffer components, 8 limiting the benefits of porous electrodes for heterogeneous catalysis. This is in contrast to enzymatic systems where the selectivity and affinity offer direct benefits for the activity of CO2R in porous electrodes due to control of the local pH with the effect of the reduced [CO2] being negligible. The origins of the significantly different response of these systems that conduct similar chemistry has been elucidated and understood, this knowledge can be applied across CO2R systems.
Conclusions
CA immobilised within porous ITO electrodes can enzymatically enhance CO2 hydration kinetics and improve the performance of CO2 as a buffer, approaching the activity of an ideal diffusion limited buffer without introducing additional components. This increase in CO2 hydration kinetics however is detrimental to heterogeneous CO2R on Au. An enzymatic mimic of heterogeneous catalysis bridges the gap between these two disparate systems. The co-immobilisation of CA with fuel forming redox enzymes results in significant (>2×) increases in H2 (H2ase) and formate production (FDh), due to a more optimal local pH upon CA co-immobilisation. The reduction in [CO2] has little effect on the activity of FDh, due it’s high affinity for CO2. When H2ase and FDh are co-immobilised, removing the selectivity advantage of enzymes, the decrease in FE with CA arises from the relatively larger increase in HER. In contrast, the increase in [HCO3 −] and reduction in [CO2] and local pH are detrimental for heterogeneous catalysis, reducing CO2R while increasing HER and significantly lowering the FE when CO2 hydration is catalysed. This demonstrates the disparities between heterogeneous catalysis and bioelectrocatalysis. Today’s state-of-the-art heterogeneous catalysts for CO2R still display poor selectivity and affinity for CO2, with systems operating far away from optimal conditions to improve the FE. This compromise is not required in enzymatic catalysis due to their high affinity efficiency, selectivity and reversibility meaning the environment can be optimised enzymatically using CA to catalyse CO2 hydration and mitigate the local pH change. As synthetic catalysts are being developed and start approaching the efficiency of enzymes, displaying lower overpotentials, higher selectivities and affinities, increases in electrocatalytic performance will require optimisation of the system beyond the catalysts active site, with the solution and electrode architecture becoming of greater importance as the compromises of current heterogeneous CO2 reduction are no longer required. Enzymatic bioelectrocatalysis provides a glimpse into a future, where synthetic catalysts approach the selectivity and activity of enzymes.
Methods
Materials
All chemicals were obtained from commercial suppliers and used without further purification unless otherwise stated: glacial acetic acid (Fisher Chemical), 2-propanol (Honeywell), methanol (Fischer Scientific), absolute ethanol (VWR Chemicals), DL-dithiotreithol (DTT, BioXtra >99.5%, Sigma), 2-(N-morpholino)ethanesulfonate (MES) sodium salt (Bioreagent >99%, Sigma-Aldrich), MES acid monohydrate (BioXtra >99.5%, Sigma-Aldrich), sodium hydrogen carbonate (>99.998% trace metal basis, Puratronic), tris(hydroxymethyl)aminomethane hydrochloride (TRIS HCl, >99.0%, Sigma), potassium chloride (KCl, >99.999% trace metal basis, Fischer Scientific), potassium ferricyanide (>99.95%, Sigma Aldrich), InCl3 (>99.95%, Acros Organics), SnCl3.5H2O (>99.9%, Fisher Scientific), ethylene glycol (>99%, Sigma Aldrich), NaOH (>97%, Sigma Aldrich), formate solution (1 g L−1, Sigma Aldrich, ≥ 99.0%) and Carbonic Anhydrase from bovine erythrocytes (CA, Sigma Aldrich, EC 4.2.1.1, >95%, ≥3500 WA U mg−1). A Nafion® 117 Membrane (Sigma-Aldrich), Parafilm® M (Sigma-Aldrich), rubber septa (Subaseal), ITO-coated glass slides (Visiontek, 7 Ω sq−1) were used, ultrapure water was used for all electrode and electrolyte preparation (Simplicity UV MilliQ system, >18.2 MΩ cm). N2 (>99.998%) and CO2 (>99.8%) were supplied by BOC.
Preparation of electrolytes
All CO2 purged electrolyte solutions were purged for 1 min mL–1 with CO2 prior to buffer preparation. All buffer components were of the highest possible purity of either trace metal basis (>99.999%) or BioUltra (>99.5%) purity. All glassware was only used for the preparation of electrolyte solutions and sonicated in 10% aqueous HNO3 for 10 min, followed by copious rinsing and sonication (3 × 10 min) in ultrapure water prior to each preparation. Volumetric flasks were filled with ultrapure water whilst unused between preparations. All electrolyte solutions were stored under N2. Bulk electrolyte composition calculations were performed using the freeware chemical equilibrium model Visual MINTEQ. 47 MES buffers were made to the desired pH by combining the buffer base (sodium salt) and acid with KCl and sodium bicarbonate in the quantities determined by MINTEQ and were used without further adjustment of the pH.
Preparation of ITO nanoparticles
ITO nanoparticles were synthesised by a solvothermal method as previously described. 48 Anhydrous InCl3 (4.5 mmol) and SnCl4·5H2O (0.5 mmol) were dissolved in ethylene glycol (4 mL) and a NaOH solution in ethylene glycol (1.67 M, 6 mL) was added to this solution under continuous stirring at 0 °C. After 15 min of stirring, the suspension was transferred into a Teflon-lined autoclave and heated at 250 °C for 96 h to obtain ITO nanoparticles. After cooling to room temperature, the product was washed three times with ethanol and twice with water/ethanol mixture (50% v/v), then once with acetone and dried under vacuum at room temperature. The final particle size and distribution was determined by Dynamic Light Scattering (Malvern Zetasizer) to be 45.6 ± 1.4 nm (SI Figure 7).
Preparation of mesoporous ITO (mesoITO) Electrodes
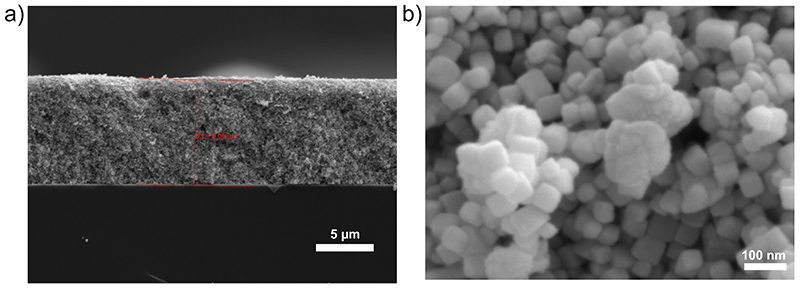
The mesoITO electrode synthesis was developed from a previously reported procedure. 49 The ITO-coated glass (2 × 1 cm) was sonicated sequentially with isopropanol and ethanol for 30 min and then dried at 150 °C. A scotch tape ring was placed onto the ITO coated glass to define the geometrical surface area of the exposed ITO as 0.19 cm2. The 46 nm ITO nanoparticles (43 mg) were dispersed in an acetic acid (57 μL) and ethanol (143 μL) mixture by sonication for >1 h in a sealed vial. 5 μL of the ITO suspension was dropcast onto the pre-defined area and, after 10 s, spin-coated at 1,000 rpm for 30 s. The electrode was allowed to dry for approximately 45 min before the scotch tape was removed. Finally, the electrodes were heated at a rate of 1°C min−1 from room temperature to 400 °C and annealed at this temperature for 1 h. The resulting mesoporous ITO electrodes had a geometrical surface area of 0.19 cm2 and an average thickness of 9 μm (Extended Data Figure 3).
Electrical connection of mesoITO working electrode
Prior to enzyme immobilisation, all mesoITO electrodes were wired to a stainless-steel rod by attaching a copper wire to the electrode using copper tape, the connection is then sealed using successive layers of Teflon tape, parafilm and then a final layer of parafilm over the metal rod and the electrode. Finally, Kapton tape was used to cover any bare ITO surface so that only the predefined area was open to the electrolyte solution (Figure 1a, I Figure 8).
Preparation of mesoITO|H2ase working electrode
[NiFeSe]-H2ase from Desulfovibrio vulgaris Hildenborough was expressed, purified and characterised according to a published method. 50 [NiFeSe] H2ase (2 μL, 20 pmol) was dropcast onto the mesoITO electrode and incubated under inert conditions for 3 min before being transferred directly to the electrolyte solution.
Preparation of mesoITO|FDh working electrode
W-FDh from Desulfovibrio vulgaris Hildenborough was expressed, purified and characterised according to a published method. 17 A 80 mM solution of dithiothreitol (DTT) was made up in Tris-HCL (20 mM, pH 9). FDH (1.4 μL, 50 pmol) was incubated with DTT solution (2.5 μL) under inert conditions for 5 min. The FDH-DTT solution was then dropcast onto the mesoITO electrode and dried for 3 min before being transferred directly to the electrolyte solution.
Preparation of mesoITO|CA|H2ase working electrode: [NiFeSe] H2ase (2 μL, 20 pmol) was dropcast onto the mesoITO electrode and incubated under inert conditions for 3 min before dropcasting CA (2μL, 40 pmol) and incubating under inert conditions for a further 3 min.
Preparation of mesoITO|CA|FDh working electrode
A 80 mM solution of dithiothreitol (DTT) was made up in Tris-HCL (20 mM, pH 9). FDH (1.4 μL, 50 pmol) was incubated with DTT solution (2.5 μL) under inert conditions for 30 min. The FDH-DTT solution was then dropcast onto the mesoITO electrode and incubated for 3 min before dropcasting CA (2 μL, 40 pmol) and incubating under inert conditions for a further 3 min before being transferred directly to the electrolyte solution.
Preparation of Au Working Electrode
Before every experiment, gold foil (Premion 99.9975+% metals basis), 0.1 mm thick, 25×25mm2, Alfa Aesar) was polished with P1200 sandpaper, rinsed with ultrapure water and dried under a stream of N2. The Au was then stored in 68% aqueous HNO3 for a minimum of 10 min before being rinsed and sonicated in ultrapure water 3 times (minimum 1 minute each). The Au foil was then insulated with Kapton tape to define an area of 1 cm2.
Wilbur-Anderson Assay
Wilbur Anderson Assays were conducted to analyse the activity of CA in solution following a literature method. 45 Briefly, a blank time was determined using 3 mL of 20 mM Tris (pH 8.3 at 25 °C) chilled on ice, to which 0.05 mL of chilled H2O was added (blank enzyme solution) followed by 2 mL of chilled CO2 saturated H2O. The time for the pH to change from 8.3 to 6.3 was recorded. For the enzyme determination the 0.05 mL of chilled H2O was replaced with 0.05 mL of chilled CA solution (1 mg mL−1 in H2O). The blank and enzyme determination were repeated in triplicate and the number of units calculated using methods equation (Eq.) 1, below. This was then converted into specific activity (U mg−1) of enzyme.
| (Eq. 1) |
To determine CA activity when immobilised on ITO a modified Wilbur-Anderson assay was developed. The blank determination was first performed in the same manner as above. Then the enzyme solution (2 μL, 40 pmol) was incubated on a planar or porous ITO electrode for 3 min. The electrode was then rinsed with 3 × 1 mL chilled 20 mM Tris (pH 8.3 at 25°C) to ensure only immobilised enzyme remained, before being placed into 3 mL of 20 mM Tris (pH 8.3 at 25°C). 0.05 mL of chilled (enzyme-free) H2O was added, followed by 2 mL of chilled CO2 saturated H2O. The time for the pH to change from 8.3 to 6.3 was recorded as above. The blank and enzyme determination were repeated in triplicate and the number of units calculated using Methods Eq. 1, above. This was converted into specific activity (U mg−1) using the saturated surface coverage from QCM or the amount of enzyme dropcast for planar and porous electrodes, respectively.
H2 Evolution Bulk Solution Assay
The rate of hydrogen production was measured by gas chromatography (GC) with a Trace GC Ultra (Thermo Scientific) equipped with a thermal conductivity detector and a MolSieve 5A 80/100 column (Althech) with N2 as a carrier gas.
The standard assay was performed in a gas-tight screwcap 10 mL vial containing 1 mL of 50 mM Tris-HCl buffer pH 7.6, 1 mM methyl viologen (MV), 15 mM sodium dithionite, 0.5 mg mL−1 bovine serum albumin, under a N2 atmosphere. The reaction was started by the addition of 10 μL of enzyme (approximately 9 nM). The vial was incubated in a shaker at 37 °C for 10 min after which a headspace sample was taken every 4 min. One unit of enzyme is defined as the amount of hydrogenase evolving 1μmol of H2 min−1.
To evaluate the effect of CO2 on activity, the hydrogen production was measured under a headspace of 100% CO2 and in 50 mM Tris-HCl buffer at pH 8.5 (resulting in identical final pH as under N2).
Quartz Crystal Microbalance
Quartz crystal microbalance (QCM) experiments were conducted under an inert atmosphere in a glovebox with a Biolin Q-Sense Explorer module and a QCM flow cell. Typically, an ITO-coated quartz chip was cleaned using 2% Hellmanex followed by rinsing with ultrapure water before being inserted into the cell. Prior to the measurement, 10 mL of enzyme-free MES buffer solution (0.1 M, pH 6.5) with KCl (50 mM) under a N2 environment was flowed through the cell at 0.14 mL min−1 for 10 min to generate a stable baseline. Following this, an enzyme-containing buffer solution (30 pmol in 1 mL) was injected into the cell. Enzyme adsorption was quantified as mass by monitoring changes in the resonance frequency of the piezoelectric quartz chip using the Sauerbrey equation (Methods Eq. 2). 51
| (Eq. 2) |
where f0 is the resonance frequency of the quartz oscillator, A is the piezoelectrically active crystal area, Δm is the change in mass, pq is the density of quartz, and μq is the shear modulus of quartz. To convert the mass adsorbed to quantity of enzyme, an assumption was made that 25% of the adsorbed mass consisted of water molecules bound to the enzyme. The seventh harmonic was used in all data analysis.
Electrochemical Measurements
A Ag|AgCl (KCl sat.) reference electrode (BASi) was used and tested regularly for potential drift. A Pt mesh electrode was used as a counter electrode. The electrochemistry experiments were controlled by an Ivium Compactstat electrochemical analyser controlled by the Iviumsoft software installed on a personal computer. Cyclic voltammetry (CV) and controlled potential electrolysis (CPE) were performed in a three-electrode configuration with the working electrode located in the same compartment as the reference electrode, and the Pt counter electrode in the other compartment, separated by a Nafion® membrane. Before every experiment, the glass components making up the working and counter electrode compartment were sonicated in 10% aqueous HNO3 for at least 10 min, followed by washing with copious amounts of ultrapure water and sonicating twice in ultrapure water (minimum 3 min each). They were blown dry with N2 before the assembly of the cell. A Nafion® ion-exchange membrane was used to separate the compartments. All potentials have been quoted vs SHE using the conversion ESHE=EAg|AgCl + 0.197 V (25 °C). CV experiments were performed with a scan rate of 50 mV s−1. The electrochemical cell was filled with the listed electrolyte solution and each solution stirred at the same rate.
The surface area of Au electrode wase calculated by oxide dissolution. Electrodes were immersed in a 50 mM aqueous H2SO4 solution degassed with N2. Current averaged CVs from 0.2 − 0.7 V vs SHE were collected until the traces converged. The reduction wave at ca. 1.0 V vs SHE was integrated. To calculate the roughness factor (Rf) the charge density (C cm−2) passed was compared to film electrodes reported by Zhang et al., 46 with the charge density of the film electrodes taken as Rf=1.
For experiments using enzymes in CO2 purged electrolyte solutions, the cell was sealed and filled with the CO2 purged electrolyte, the electrode was inserted and the headspace of the compartment (~7 mL) purged for a further 20 min at 5 sccm. For HER experiments, the headspace was purged with CO2 or N2 as listed during electrochemical measurements at 5 sccm, with the outlet connected to a GC to allow for quantification of gas products including H2. Electrochemistry was either conducted in a wet-atmosphere anaerobic MBraun UNILab glovebox or the cell was sealed in the glovebox with rubber septa and handled in air.
The faradaic efficiency (FE) was calculated based on the ratio of measured gaseous/liquid product vs the amount of theoretically expected product based on accumulated charge during CA (two electrons consumed per molecule of H2 / formate).
Diffusion Layer Measurement
A planar ITO electrode with the same geometry as the mesoITO electrodes vide supra was used to calculate the diffusion layer thickness for the cell used in this work. The system was stirred and the headspace purged with CO2 in an identical manner as during electrocatalytic experiments. 0.4 V vs SHE was applied in a solution of 2 mM [Fe(CN)6]4− in 100 mM KCl to find the limiting oxidation current density. This current density was used with Fick’s second law, solved for a stagnant layer to calculate an apparent diffusion layer thickness and kconvection that was used to describe the system.
Other Instrumentation
Eppendorf pipettes (Research Plus) with OneTip pipette tips were used to prepare solutions. Solids were weighed using a Sartorius CPA225D balance. The surface morphology of the electrodes was analysed by scanning electron microscopy (SEM; Tescan MIRA3 FEG-SEM). Feature dimensions have been measured by built-in software. A Bandelin Sonorex Digiplus sonicator was used to disperse the ITO nanoparticles. A Carbolite furnace (ELF 11/14B/301) was used to anneal the electrodes.
Product Detection
The quantification of H2 and CO were performed with a Shimadzu Tracera GC-2010 Plus gas chromatograph equipped with a barrier discharge ionisation detector. A Hayesep D (2m * 1/8” OD * 2mm ID, 80/100 mesh, Analytical Columns) precolumn and a RT-Molsieve 5A (30m * 0.53 mm ID, Restek) main column were used to separate H2, O2, N2, CH4 and CO, while blocking CO2 and H2O from the sensitive Molsieve column. The He (5.0, BOC) carrier gas was purified (HP2-220, VICI) prior to entering the GC. The column temperature was kept constant at 85 °C, the detector temperature was 300 °C. The gas from the electrolysis cell was constantly flushed through a loop (1 mL) and injected every ca. 4.25 min into the GC. The GC was calibrated with a known standard for H2, CO and CH4 (2040 ppm H2/2050 ppm CO/2050 ppm CH4 in balance gas CO2, BOC) by diluting the gas with pure CO2. The detection limits for H2 and CO were significantly below 10 μA cm−2. Nevertheless, the total Faradaic yield was observed to be below unity for low total current densities, due to slow formation and spontaneous release of bubbles from the electrode surface. The partial current density was determined by Methods Eq. 3, below.
| (Eq. 3) |
where n is the number of electrons (2), F is Faraday’s constant, f is the response factor determined by GC calibration, p is the pressure in the cell (ambient pressure), R is the universal gas constant, T is the temperature (298 K). In short, the peak area, as measured by the GC is divided by the response factor to give the concentration in ppm of H2 and CO in the GC sample loop.
Formate production was quantified using ion chromatography (IC) on a Metrohm 882 Compact IC Plus ion chromatograph with a conductivity detector. The eluent buffer was an aqueous solution of Na2CO3 (3 mM), NaHCO3 (1 mM), and acetone (50 mL L−1). The system was calibrated for each batch of eluent buffer with samples containing 0, 0.25, 0.5, 0.75 and 1 mM formate in each individual electrolyte. Calibrations were done for each electrolyte batch and the experimental samples matched to the correct calibration batch. Samples were diluted 10-fold with H2O before injection in the IC.
Data Analysis
Data Analysis was performed in Microsoft Excel and graphs were plotted using OriginPro 2017. The freeware chemical equilibrium model Visual MINTEQ was used for electrolyte composition. 47 COMSOL Multiphysics 5.6 with the electrochemistry module was used for finite element modelling with further details on the construction of the model given in the Supporting Information. Enzyme graphics were produced using UCSF Chimera, developed by the Resource for Biocomputing, Visualization, and Informatics at the University of California, San Francisco, with support from NIH P41-GM103311. 52
Extended Data
Extended Data Fig. 1. QCM loading of CA on planar ITO.
QCM loading of CA on planar ITO. Conditions: Enzyme loading- 30 pmol of CA in 1 mL 0.1 M MES buffer (pH 6.5) recirculated over the ITO coated QCM chip (Area=0.7 cm2) at 0.14 mL min-1 MES wash: 0.1 M MES buffer (pH 6.5) flowed over the electrode at 0.14 mL min-1.T= 25°C.
Extended Data Fig. 2. QCM loading of H2ase and FDh.
QCM loading of H2ase (orange) and FDh (purple). Conditions: Enzyme loading- 30 pmol of enzyme (H2ase or FDh) in 1 mL 0.1 M MES buffer (pH 6.5) recirculated over the ITO coated QCM chip (Area=0.7 cm2) at 0.14 mL min-1. T= 25°C.
Extended Data Fig. 3. SEM images of mesoITO on ITO-coated glass.
SEM images of mesoITO on ITO-coated glass. (a) Edge view, mesoITO layer with an average thickness of 9 µm). (b) Top view SEM magnification: (a 9 kx), (b 320 kx), SEM HV: (a 10.0 kV), (b 5.0 kV); WD: (a 15.1 mm), (b 5.8 mm), Detector: secondary electron.
Extended Data Fig. 4. Wilbur Anderson Assay.
Wilbur Anderson assay for CA immobilised on the surface of planar ITO, Meso ITO and with the enzyme in solution. Enzyme loadings (in mg) were calculated from QCM studies (Figure S1) for planar surfaces (Planar ITO), from the amount dropcast (Meso ITO due to its high surface area) or the total amount added to solution (solution). Solution conditions: 20 mM Tris buffer, pH 8.3, T= 2 °C
Extended Data Fig. 5. Protein film chronopotentiometry.
Protein film chronopotentiometry (a) Measured potentials for galvanostatically controlled HER (-0.18 mA cm−2) by H2ase (20 pmol) in the absence (dashed lines) and presence (solid lines) of co-immobilised CA (40 pmol). (b) Measured potentials for galvanostatically controlled CO2R (-0.24 mA cm−2) by FDh (50 pmol) in the absence (dashed lines) and presence (solid lines) of co-immobilised CA (40 pmol). Lines are the average of at least 3 independent galvanostatic measurements, where the shaded area represents the standard deviation. Solution conditions: CO2 purged 0.1 M KHCO3 and 0.05 M KCl (pH 6.67). All experiments conducted at 20°C.
Extended Data Fig. 6. Local Environment within the diffusion layer for MesoITO|H2ase.
Simulation of mesoITO|H2ase (20 pmol) in CO2 purged 0.1 M KHCO3 + 0.05 M KCl (pH 6.67) at t = 270s (steady state), demonstrating the local environment changes as a function of distance from the electrode. (a) The pH change with distance from the electrode surface. b) Concentrations of CO2 (solid lines), HCO3 − (dashed lines), CO32- (dash-dot lines) at −0.65 to −0.3 V vs SHE. c) Concentrations of CO2 (orange), HCO3 − (purple), CO32 -(blue) at −0.65 V (solid lines) from simulation and the expected equilibrium concentrations at the simulated solution pH in SI Fig. 5a (dashed).
Extended Data Fig. 7. Calculated effective buffer capacities for solutions used in Figures 3 and 4.
Calculated effective buffer capacities for solutions used in Figures 3 and 4). The uncatalysed equilibration of CO2/HCO3 − is assumed not to contribute to the buffer capacity due to its slow kinetics. Solid lines are with CA and dashed lines without. Solutions: Purple- CO2 purged 0.1 M KHCO3 + 0.05 M KCl; Orange- CO2 purged 0.05 M KHCO3+ 0.05 M MES +0.05 M KCl; Blue- N2 purged 0.132 M MES+0.05 M KHCO3 (pH 6.45).
Extended Data Fig. 8. Local concentrations of carbon species during the enzymatic mimic of heterogeneous catalysis experiments from FEM.
Local concentrations of carbon species during the enzymatic mimic of heterogeneous catalysis experiments from FEM. Lines represent average concentrations of CO2 (blue),HCO3 − (orange) and CO32- (purple) within the porous electrode across the range of applied potentials used in this work. Solid lines are with the co-immobilisation of CA (40 pmol) and dashed without. Conditions: 20 pmol H2ase+ 50 pmol FDh co-immobilised on MesoITO electrode, CO2 purged 0.1 M KHCO3 and 0.05 M KCl (pH 6.67). All experiments conducted at 20°C.
Extended Data Fig. 9. Galvanostatically controlled CO2R on Au with and without CA (20 µM) in 0.1 M KHCO3 solution.
Galvanostatically controlled CO2R on Au with and without CA (20 µM) in 0.1 M KHCO3 solution (a) Experimental (points) and simulated (lines) total (purple) and partial current densities for H2 (orange) and CO (blue) from constant current electrolysis of Au. (b) Experimental H2 (orange), CO (blue) and total (purple) FE. Points represent averages of at least three independent stepped-chronopotentiometry experiments, where filled points were with CA immobilised on the electrode surface and unfilled without. Y Error bars represent the standard deviation of measured currents. All experiments conducted at 20°C
Supplementary Material
Acknowledgements
This work was supported by a European Research Council (ERC) Consolidator Grant (MatEnSAP, no. 682833; S.J.C, E.R.), the Leverhulme Trust (P80336; to S.J.C, E.R.), the Engineering and Physical Sciences Research Council (EPSRC) Graphene CDT (EP/L016087/1; V.B.), the Winston Churchilll Foundation of the United States (A.D.), OMV (A.W.), the Fundação para a Ciência e Tecnologia (FCT, Portugal) for fellowship SFRH/BD/100314/2014 (S.Z.), fellowship SFRH/BD/116515/2016 (A.R.O.), grant PTDC/BII-BBF/2050/2020 (I.A.C.P.) and MOSTMICRO-ITQB unit (UIDB/04612/2020 and UIDP/04612/2020), and EU Horizon 2020 R&I programme 810856. We thank Dr. E. Edwardes-Moore for useful discussions.
Footnotes
Author Contributions Statement
S.C. and E.R. designed the project. S.C. conducted electrochemical experiment and finite element modelling. S.C. and V.B. conducted QCM experiments. A.D. provided python scripts. S.C., V.B., A.W. and E.R. analysed and interpreted the data. A.R.O., S.Z. and I.A.C.P. provided FDh and H2ase. S.C. and E.R. wrote the manuscript with input from all authors. E.R. supervised the project.
Competing Interests
The authors declare no competing interests
Data Availability
All data is available in the main paper and Supplementary information files. Source data files are provided for all main text and extended data figures. Source data for the Main Text and Supplementary Information is available from the Cambridge Research Repository Apollo: https://doi.org/10.17863/CAM.78484
Code Availability
Python scripts for Wilbur-Anderson assay simulation are available from the Cambridge Research Repository Apollo: https://doi.org/10.17863/CAM.78484
References
- 1.Artz J, et al. Sustainable Conversion of Carbon Dioxide: An Integrated Review of Catalysis and Life Cycle Assessment. Chem Rev. 2018;118:434–504. doi: 10.1021/acs.chemrev.7b00435. [DOI] [PubMed] [Google Scholar]
- 2.Chan K, et al. pH effects on the electrochemical reduction of CO2 towards C2 products on stepped copper. Nat Commun. 2018;10:1–10. doi: 10.1038/s41467-018-07970-9. [DOI] [PMC free article] [PubMed] [Google Scholar]
- 3.Varela AS, Kroschel M, Reier T, Strasser P. Controlling the selectivity of CO2 electroreduction on copper: The effect of the electrolyte concentration and the importance of the local pH. Catal Today. 2016;260:8–13. doi: 10.1016/j.cattod.2015.06.009. [DOI] [Google Scholar]
- 4.Sargeant E, Kolodziej A, Le Duff CS, Rodriguez P. Electrochemical Conversion of CO2 and CH4 at Subzero Temperatures. ACS Catal. 2020;10:7464–7474. doi: 10.1021/acscatal.0c01676. [DOI] [Google Scholar]
- 5.Wagner A, Sahm CD, Reisner E. Towards molecular understanding of local chemical environment effects in electro- and photocatalytic CO2 reduction. Nat Catal. 2020;3:775–786. doi: 10.1038/s41929-020-00512-x. [DOI] [Google Scholar]
- 6.Monteiro MCO, Koper MTM. Measuring local pH in electrochemistry. Curr Opin Electrochem. 2021;25:100649. doi: 10.1016/j.coelec.2020.100649. [DOI] [Google Scholar]
- 7.Monteiro MCO, Jacobse L, Touzalin T, Koper MTM. Mediator-Free SECM for Probing the Diffusion Layer pH with Functionalized Gold Ultramicroelectrodes. Anal Chem. 2020;92:2237–2243. doi: 10.1021/acs.analchem.9b04952. [DOI] [PMC free article] [PubMed] [Google Scholar]
- 8.Yang K, Kas R, Smith WA. In Situ Infrared Spectroscopy Reveals Persistent Alkalinity near Electrode Surfaces during CO2 Electroreduction. J Am Chem Soc. 2019;141:15891–15900. doi: 10.1021/jacs.9b07000. [DOI] [PMC free article] [PubMed] [Google Scholar]
- 9.Suter S, Haussener S. Optimizing mesostructured silver catalysts for selective carbon dioxide conversion into fuels. Energy Environ Sci. 2019;12:1668–1678. doi: 10.1039/c9ee00656g. [DOI] [Google Scholar]
- 10.Song H, et al. Effect of mass transfer and kinetics in ordered Cu-mesostructures for electrochemical CO2 reduction. Appl Catal B Environ. 2018;232:391–396. doi: 10.1016/j.apcatb.2018.03.071. [DOI] [Google Scholar]
- 11.Yoon Y, Hall AS, Surendranath Y. Tuning of Silver Catalyst Mesostructure Promotes Selective Carbon Dioxide Conversion into Fuels. Angew Chemie - Int Ed. 2016;55:15282–15286. doi: 10.1002/anie.201607942. [DOI] [PubMed] [Google Scholar]
- 12.Hall AS, Yoon Y, Wuttig A, Surendranath Y. Mesostructure-Induced Selectivity in CO2 Reduction Catalysis. J Am Chem Soc. 2015;137:14834–14837. doi: 10.1021/jacs.5b08259. [DOI] [PubMed] [Google Scholar]
- 13.Burdyny T, et al. Nanomorphology-Enhanced Gas-Evolution Intensifies CO2 Reduction Electrochemistry. ACS Sustain Chem Eng. 2017;5:4031–4040. doi: 10.1021/acssuschemeng.7b00023. [DOI] [Google Scholar]
- 14.Singh MR, Clark EL, Bell AT. Effects of electrolyte, catalyst, and membrane composition and operating conditions on the performance of solar-driven electrochemical reduction of carbon dioxide. Phys Chem Chem Phys. 2015;17:18924–18936. doi: 10.1039/c5cp03283k. [DOI] [PubMed] [Google Scholar]
- 15.Gibbons BH, Edsall JT. Rate of Hydration of Carbon Dioxide and Dehydration of Carbonic Acid At. J Biol Chem. 1963;238:3502–3507. doi: 10.1016/s0021-9258(18)48696-6. [DOI] [PubMed] [Google Scholar]
- 16.Miller M, et al. Interfacing Formate Dehydrogenase with Metal Oxides for the Reversible Electrocatalysis and Solar-Driven Reduction of Carbon Dioxide. Angew Chemie - Int Ed. 2019;58:4601–4605. doi: 10.1002/anie.201814419. [DOI] [PMC free article] [PubMed] [Google Scholar]
- 17.Oliveira AR, et al. Toward the Mechanistic Understanding of Enzymatic CO2 Reduction. ACS Catal. 2020;10:3844–3856. doi: 10.1021/acscatal.0c00086. [DOI] [Google Scholar]
- 18.Mersch D, et al. Wiring of Photosystem II to Hydrogenase for Photoelectrochemical Water Splitting. J Am Chem Soc. 2015;137:8541–8549. doi: 10.1021/jacs.5b03737. [DOI] [PubMed] [Google Scholar]
- 19.Edwardes Moore E, Andrei V, Zacarias S, Pereira IAC, Reisner E. Integration of a Hydrogenase in a Lead Halide Perovskite Photoelectrode for Tandem Solar Water Splitting. ACS Energy Lett. 2020;5:232–237. doi: 10.1021/acsenergylett.9b02437. [DOI] [PMC free article] [PubMed] [Google Scholar]
- 20.Yang X, et al. Mesoporous Materials–Based Electrochemical Biosensors from Enzymatic to Nonenzymatic. Small. 2019;17:1–16. doi: 10.1002/smll.201904022. [DOI] [PubMed] [Google Scholar]
- 21.Megarity CF, et al. Electrified Nanoconfined Biocatalysis with Rapid Cofactor Recycling. ChemCatChem. 2019;11:5662–5670. doi: 10.1002/cctc.201901245. [DOI] [Google Scholar]
- 22.Morello G, Siritanaratkul B, Megarity CF, Armstrong FA. Efficient Electrocatalytic CO2 Fixation by Nanoconfined Enzymes via a C3-to-C4 Reaction That Is Favored over H2 Production. ACS Catal. 2019;9:11255–11262. doi: 10.1021/acscatal.9b03532. [DOI] [Google Scholar]
- 23.Morello G, Megarity CF, Armstrong FA. The power of electrified nanoconfinement for energising, controlling and observing long enzyme cascades. Nat Commun. 2021;12:1–9. doi: 10.1038/s41467-020-20403-w. [DOI] [PMC free article] [PubMed] [Google Scholar]
- 24.Gentil S, et al. Oriented Immobilization of [NiFeSe] Hydrogenases on Covalently and Noncovalently Functionalized Carbon Nanotubes for H2/Air Enzymatic Fuel Cells. ACS Catal. 2018;8:3957–3964. doi: 10.1021/acscatal.8b00708. [DOI] [Google Scholar]
- 25.Mazurenko I, et al. Impact of substrate diffusion and enzyme distribution in 3D-porous electrodes: A combined electrochemical and modelling study of a thermostable H2/O2 enzymatic fuel cell. Energy Environ Sci. 2017;10:1966–1982. doi: 10.1039/c7ee01830d. [DOI] [Google Scholar]
- 26.Hardt S, et al. Reversible H2 oxidation and evolution by hydrogenase embedded in a redox polymer film. Nat Catal. 2021;4:251–258. doi: 10.1038/s41929-021-00586-1. [DOI] [PMC free article] [PubMed] [Google Scholar]
- 27.Flexer V, Brun N, Courjean O, Backov R, Mano N. Porous mediator-free enzyme carbonaceous electrodes obtained through integrative chemistry for biofuel cells. Energy Environ Sci. 2011;4:2097–2106. doi: 10.1039/c0ee00466a. [DOI] [Google Scholar]
- 28.Lin Y, et al. Porous Enzymatic Membrane for Nanotextured Glucose Sweat Sensors with High Stability toward Reliable Noninvasive Health Monitoring. Adv Funct Mater. 2019;29:1–8. doi: 10.1002/adfm.201902521. [DOI] [Google Scholar]
- 29.Hickey DP, McCammant MS, Giroud F, Sigman MS, Minteer SD. Hybrid enzymatic and organic electrocatalytic cascade for the complete oxidation of glycerol. J Am Chem Soc. 2014;136:15917–15920. doi: 10.1021/ja5098379. [DOI] [PubMed] [Google Scholar]
- 30.Cai R, et al. Electroenzymatic C-C bond formation from CO2 . J Am Chem Soc. 2018;140:5041–5044. doi: 10.1021/jacs.8b02319. [DOI] [PubMed] [Google Scholar]
- 31.Wheeldon I, et al. Substrate channelling as an approach to cascade reactions. Nat Chem. 2016;8:299–309. doi: 10.1038/nchem.2459. [DOI] [PubMed] [Google Scholar]
- 32.Marques MC, et al. The direct role of selenocysteine in [NiFeSe] hydrogenase maturation and catalysis. Nat Chem Biol. 2017;13:544–550. doi: 10.1038/nchembio.2335. [DOI] [PubMed] [Google Scholar]
- 33.Edwardes Moore E, et al. The Local Chemical Environment of Enzymatic Electrochemistry. ChemRxiv. 2021 doi: 10.33774/chemrxiv-2021-vnk07. 10.33774/chemrxiv-2021-vnk07. [DOI] [Google Scholar]
- 34.Baker CJ, et al. Interference by Mes [2-(4-morpholino)ethanesulfonic acid] and related buffers with phenolic oxidation by peroxidase. Free Radic Biol Med. 2007;43:1322–1327. doi: 10.1016/j.freeradbiomed.2007.07.020. [DOI] [PubMed] [Google Scholar]
- 35.Le JM, et al. Tuning mechanism through buffer dependence of hydrogen evolution catalyzed by a cobalt mini-enzyme. Biochemistry. 2020;59:1289–1297. doi: 10.1021/acs.biochem.0c00060. [DOI] [PubMed] [Google Scholar]
- 36.Steiner H, Jonsson B, Lindskog S. The Catalytic Mechanism of Carbonic Anhydrase. Eur J Biochem. 1975;59:253–259. doi: 10.1021/ja00992a052. [DOI] [PubMed] [Google Scholar]
- 37.Wang F, Sayre LM. Oxidation of Tertiary Amine Buffers by Copper(II) Inorg Chem. 1989;28:169–170. doi: 10.1021/ic00301a001. [DOI] [Google Scholar]
- 38.Andrei V, Reuillard B, Reisner E. Bias-free solar syngas production by integrating a molecular cobalt catalyst with perovskite-BiVO4 tandems. Nat Mater. 2020;19:189–194. doi: 10.1038/s41563-019-0501-6. [DOI] [PubMed] [Google Scholar]
- 39.Kuk SK, et al. CO2 Reductive, Copper Oxide-Based Photobiocathode for Z-Scheme Semi-Artificial Leaf Structure. 2020;44413:2940–2944. doi: 10.1002/cssc.202000459. [DOI] [PubMed] [Google Scholar]
- 40.Khalifah RG. The Carbon Dioxide Hydration Activity of Carbonic Anhydrase. J Biol Chem. 1971;246:2561–2573. doi: 10.1016/S0021-9258(18)62326-9. [DOI] [PubMed] [Google Scholar]
- 41.Addo PK, et al. Methanol production via bioelectrocatalytic reduction of carbon dioxide: Role of carbonic anhydrase in improving electrode performance. Electrochem Solid-State Lett. 2011;14:5–10. doi: 10.1149/1.3537463. [DOI] [Google Scholar]
- 42.Meneghello M, et al. Formate Dehydrogenases Reduce CO2 Rather than HCO3 −An Electrochemical Demonstration. Angew Chemie - Int Ed. 2021;60:1–5. doi: 10.1002/anie.202101167. [DOI] [PubMed] [Google Scholar]
- 43.Srikanth S, Alvarez-Gallego Y, Vanbroekhoven K, Pant D. Enzymatic Electrosynthesis of Formic Acid through Carbon Dioxide Reduction in a Bioelectrochemical System: Effect of Immobilization and Carbonic Anhydrase Addition. ChemPhysChem. 2017;18:3174–3181. doi: 10.1002/cphc.201700017. [DOI] [PubMed] [Google Scholar]
- 44.da Costa Ores J, Sala L, Cerveira GP, Kalil SJ. Purification of carbonic anhydrase from bovine erythrocytes and its application in the enzymic capture of carbon dioxide. Chemosphere. 2012;88:255–259. doi: 10.1016/j.chemosphere.2012.03.059. [DOI] [PubMed] [Google Scholar]
- 45.Wilbur KM, Anderson NG. Electrometric and Colorimetric Determination of Carbonic Anhydrase. J Biol Chem. 1948;176:147–154. doi: 10.1016/S0021-9258(18)51011-5. [DOI] [PubMed] [Google Scholar]
- 46.Zhang BA, Ozel T, Elias JS, Costentin C, Nocera DG. Interplay of Homogeneous Reactions, Mass Transport, and Kinetics in Determining Selectivity of the Reduction of CO2 on Gold Electrodes. ACS Cent Sci. 2019;5:1097–1105. doi: 10.1021/acscentsci.9b00302. [DOI] [PMC free article] [PubMed] [Google Scholar]
- 47.Gustafsson JP. Visual MINTEQ ver 31. 2014.
- 48.Fang X, et al. Structure-Activity Relationships of Hierarchical Three-Dimensional Electrodes with Photosystem II for Semiartificial Photosynthesis. Nano Lett. 2019;19:1844–1850. doi: 10.1021/acs.nanolett.8b04935. [DOI] [PMC free article] [PubMed] [Google Scholar]
- 49.Rosser TE, Gross MA, Lai YH, Reisner E. Precious-metal free photoelectrochemical water splitting with immobilised molecular Ni and Fe redox catalysts. Chem Sci. 2016;7:4024–4035. doi: 10.1039/c5sc04863j. [DOI] [PMC free article] [PubMed] [Google Scholar]
- 50.Zacarias S, et al. Characterization of the [NiFeSe] hydrogenase from Desulfovibrio vulgaris Hildenborough. Methods Enzymol. 2018;613:169–201. doi: 10.1016/bs.mie.2018.10.003. [DOI] [PubMed] [Google Scholar]
- 51.Sauerbrey G. Verwendung von Schwingquarzen zur Wägung dünner Schichten und zur Mikrowägung. Zeitschrift für Phys. 1959;155:206–222. [Google Scholar]
- 52.Pettersen EF, et al. UCSF Chimera-a visualization system for exploratory research and analysis. J Comput Chem. 2004;25:1605–1612. doi: 10.1002/jcc.20084. [DOI] [PubMed] [Google Scholar]
Associated Data
This section collects any data citations, data availability statements, or supplementary materials included in this article.
Supplementary Materials
Data Availability Statement
All data is available in the main paper and Supplementary information files. Source data files are provided for all main text and extended data figures. Source data for the Main Text and Supplementary Information is available from the Cambridge Research Repository Apollo: https://doi.org/10.17863/CAM.78484
Python scripts for Wilbur-Anderson assay simulation are available from the Cambridge Research Repository Apollo: https://doi.org/10.17863/CAM.78484


