Abstract
Objectives
The aims of this study was to assess the utility of increased spatial resolution of magnetic resonance spectroscopic imaging (MRSI) at 7T for the detection of neurochemical changes in multiple sclerosis (MS)-related brain lesions.
Materials and Methods
This prospective, institutional review board-approved study was performed in twenty relapsing-remitting MS patients (9women/11men; mean age ± standard deviation, 30.8±7.7 years) after receiving written, informed consent. Metabolic patterns in MS lesions were compared at three different spatial resolutions of free-induction-decay MRSI with implemented parallel imaging acceleration: 2.2×2.2×8mm3; 3.4×3.4×8mm3; and 6.8×6.8×8mm3 voxel volume, i.e., matrix sizes of 100×100, 64×64, and 32×32. The quality of data was assessed by signal-to-noise ratio (SNR) and Cramér-Rao lower bounds (CRLB). Statistical analysis was performed using Wilcoxon signed-rank tests with correction for multiple testing.
Results
Seventy-seven T2-hyperintense MS lesions were investigated (median volume, 155.7 mm3; range, 10.8-747.0 mm3). The mean metabolic ratios in lesions differed significantly between the three MRSI resolutions (i.e., 100×100 vs. 64×64, 100×100 vs. 32×32, and 64×64 vs. 32×32) (p<0.001). With the ultra-high resolution (100×100), we obtained 40 to 80%-higher mean metabolic ratios and 100 to 150%-increase in maximum metabolic ratios in the MS lesions compared to the lowest resolution (32×32), while maintaining good spectral quality (signal-to-noise ratio >12, Cramér-Rao lower bounds <20%) and measurement time of 6 minutes. There were 83% of MS lesions that showed increased myo-Inositol/N-acetylaspartate with the 100x100 resolution, but only 66% were distinguishable with the 64x64 resolution and 35% with the 32x32 resolution.
Conclusions
Ultra-high-resolution MRSI (~2×2×8mm3 voxel volume) can detect metabolic alterations in MS, which cannot be recognized by conventional MRSI resolutions, within clinically acceptable time.
Keywords: multiple sclerosis, magnetic resonance spectroscopic imaging, ultra-high resolution, partial volume errors, ultra-high field, neuroinflammation
Introduction
Magnetic resonance imaging (MRI) has become the preferred imaging tool for the diagnosis and monitoring the course of multiple sclerosis (MS), owing to its high sensitivity to macroscopic tissue abnormalities [1,2,3]. Lesions are well visualized as hyperintensities on T2-weighted fluid-attenuated inversion recovery (FLAIR) images. Contrast-enhanced T1-weighted MRI enables to further distinguish active from chronic lesions by highlighting the areas with an increased blood-brain barrier permeability associated with inflammatory activity [4]. Hypointense “black-holes” visible on T1-weighted MRI indicate brain tissue damage. However, conventional MRI lacks the specificity to heterogeneous pathophysiological mechanisms underlying lesion formation and development [5].
Various quantitative MRI techniques have been employed to expand the knowledge about MS. Magnetization transfer ratio [6] and myelin water fraction [7,8] were proposed as a measure of myelin content. Diffusion tensor imaging, suggesting subtle alteration of the tissue structure, may contribute to early detection of inflammatory disease activity [9]. Quantitative susceptibility mapping can be used to visualize iron within the MS lesions, an indicator of microglia activity [10,11]. MR spectroscopy contributes to classical neuroimaging by providing non-invasive quantification of several brain neurochemicals, which were shown to be related to pathological processes relevant to MS (i.e., inflammation, demyelination, remyelination, axonal loss, and gliosis), including N-acetylaspartate (tNAA), choline (tCho), myo-Inositol (mIns), creatine (tCr) or glutamate+glutamine (Glx) [12]. Its utility has already been recognized in several studies in MS patients. Changes were reported in levels of mIns, tCr, tCho, tNAA, glutathione, and glutamate in normal-appearing white matter (NAWM) or in various brain structures [13–19].
Compared to MRI, MR spectroscopic imaging (MRSI) studies have been severely handicapped by poor spatial resolution, e.g., voxel sizes of 15×15×15 mm3 [15], or 10×10×10 mm3 [16,17,20]. This is a limitation for the investigation of most MS lesions, which are usually, on average, 6mm in diameter [21]. Thus, the observed metabolic changes appear rather diffuse, or in the case of smaller lesions, no metabolic changes can be observed. With the advent of ultra-high-resolution (i.e., ~2×2mm2 in-plane) MRSI at 7T [22,23], this limitation finally may be overcome.
In our study, we aimed to assess the utility of increased spatial resolution of MRSI at 7T for the detection of neurochemical changes in MS-related brain lesions.
Materials and Methods
Study Design and Patients
Institutional review board approval and patient informed consent were obtained for this prospective study. Inclusion criteria for enrollment were an MS diagnosis according to the revised McDonald criteria [24] and no evidence of other neurological or neuropsychiatric diseases. Exclusion criteria were any MRI contraindications. Twenty patients with relapsing-remitting MS (9W/11M; mean age, 30.8±7.7 years), who fulfilled the additional inclusion criteria of having at least one MS lesions in the MRSI volume of interest, as well as artifact-free MRI and MRSI scans, were consecutively included. Patient demographic data and medications, together with the Expanded Disability Status Scale [25], a score quantifying disability in MS, assessed by two experienced neurologists in consensus, are detailed in Table 1.
Table 1. Demographic data, clinical scores, the number of lesions investigated by MRSI and medications of the patients.
| Patient | Age, y / sex |
Months from diagnosis |
EDSS | Number of lesions |
Medication |
|---|---|---|---|---|---|
| 1 | 26/F | 0 | 0 | 1 | -- |
| 2 | 26/M | 43 | 2 | 6 | Natalizumab |
| 3 | 40/F | 43 | 3 | 4 | Dimethyl fumarate |
| 4 | 27/M | 105 | 1 | 4 | -- |
| 5 | 27/M | 158 | 1 | 4 | Dimethyl fumarate |
| 6 | 38/M | 43 | 2.5 | 6 | Alemtuzumab |
| 7 | 25/F | 53 | 0 | 1 | Glatiramer acetate |
| 8 | 48/M | 150 | 1 | 5 | Glatiramer acetate |
| 9 | 30/M | 13 | 0 | 1 | Dimethyl fumarate |
| 10 | 30/M | 194 | 1.5 | 3 | Fingolimod |
| 11 | 30/F | 162 | 2 | 4 | Glatiramer acetate |
| 12 | 25/M | 5 | 1 | 3 | Glatiramer acetate |
| 13 | 27/M | 42 | 2 | 4 | Dimethyl fumarate |
| 14 | 25/F | 55 | 2 | 5 | Natalizumab |
| 15 | 46/F | 113 | 4 | 3 | Fingolimod |
| 16 | 23/M | 5 | 1.5 | 3 | -- |
| 17 | 27/M | 56 | 1.5 | 5 | Dimethyl fumarate |
| 18 | 28/F | 51 | 4 | 6 | Natalizumab |
| 19 | 25/F | 46 | 4.5 | 3 | Natalizumab |
| 20 | 43/F | 96 | 3 | 6 | Fingolimod |
Note: EDSS - Expanded Disability Status Scale
Data acquisition
Measurements were performed using a 7T whole-body MR scanner (Magnetom, Siemens Healthcare, Erlangen, Germany) and a 32-channel head coil (Nova Medical, Wilmington, MA, US). Sagittal three-dimensional (3D) T2-weighted fluid-attenuated inversion recovery images (FLAIR), with 0.9×0.9×0.9mm3 spatial resolution, and sagittal 3D T1-weighted magnetization-prepared rapid acquisition gradient-echo images, with 0.75×0.75×0.75mm3 spatial resolution, were acquired to visualize MS lesions and position MRSI volumes of interest (i.e., covering the MS lesion-rich centrum semiovale area of the brain). MRSI with ultra-short acquisition delay of 1.3ms [22] and parallel imaging acceleration via Controlled aliasing in parallel imaging results in higher acceleration (CAIPIRINHA) [23], was acquired at two different resolutions, with 100×100 and 64×64 matrix sizes (i.e., 2.2×2.2×8 mm3 and 3.4×3.4×8 mm3 voxel sizes, respectively). The higher resolution (100×100) MRSI was expected to resolve smaller details, while the lower resolution (64×64) MRSI was tailored towards reliable mapping of important, but less abundant neurochemicals. To keep the acquisition time of both MRSI scans approximately in the same, clinically feasible range, the repetition times, flip angles, and vector sizes were adapted. In order to compare the feasibility of ultra-short acquisition delay spectroscopic imaging with the conventionally used MRSI sequences, a dataset with 32×32 matrix size (i.e., 6.8×6.8×8 mm3 voxel size) was reconstructed from the central k-space part of the 64×64 dataset. This allowed an investigation of MRSI with much shorter measurement time (<2min) as well as lower spatial resolution, while avoiding potential experimental uncertainties when acquiring this scan separately. Similarly, an additional 64×64 dataset was reconstructed by subsampling the inner k-space of 100×100 dataset. To test the consistency of the natively acquired and subsampled data, the native 64×64 MRSI data were directly compared with the subsampled 64×64 MRSI data, which simultaneously also validates the consistency of the 32×32 MRSI data, which could have been influenced by the effect of adapted sequence parameters. The detailed sequence parameters are displayed in Table 2.
Table 2.
MRSI sequence parameters with different spatial resolutions. Asterisk (*) indicates the data which were reconstructed by subsampling the inner k-space of the high-resolution datasets. The acquisition times for the reconstructed datasets are illustrational, in case they would had been natively acquired.
| MRSI matrix size | 100×100 | 64×64 | 32×32* | 64×64* |
|---|---|---|---|---|
| Repetition time (ms) | 200 | 600 | 600 | 200 |
| Echo time (ms) | 1.3 | 1.3 | 1.3 | 1.3 |
| Flip angle (degrees) | 29 | 45 | 45 | 29 |
| Nominal voxel size (mm3) | 2.2×2.2×8 | 3.4×3.4×8 | 6.8×6.8×8 | 3.4×3.4×8 |
| Vector size | 512 | 1024 | 1024 | 512 |
| Readout duration (ms) | 113 | 365 | 365 | 113 |
| Acquisition time (min:sec) | 6:06 | 5:11 | ~1:30 | ~2:30 |
| Acceleration factor | 4 | 6 | 6 | 4 |
Note: MRSI - magnetic resonance spectroscopic imaging
Spectral Analysis
To assess the neurochemical profile of MS lesions and NAWM, regions-of-interest (ROIs) were created by manual segmentation, conducted by a radiologist and an MR spectroscopist in consensus, using ITK-Snap software (version 3.6; http://www.itksnap.org/pmwiki/pmwiki.php). The ROIs were drawn on FLAIR images corresponding to the MRSI slice.
Software developed in-house was used for automated MRSI data processing and display [26]. Spectra were fitted in the range of 1.8 and 4.2 ppm using LCModel (version 6.3-1; http://s-provencher.com/lcmodel.shtml), with a basis-set consisting of 17 simulated metabolite resonances and a measured macromolecular background [27]. Simulations were performed in NMR Scope (jMRUI 5.0) using one hard pulse and consecutive free induction decay acquisition. Given short repetition time (200 ms for 100×100 or 600 ms for 64×64, respectively), T1-relaxation correction was performed based on values from the literature [28] according to the equation
where M0 is the equilibrium magnetization and Mobs(θ,TR) is the observed magnetization in the steady state resulting from a pulse sequence with parameters θ and TR.
Since the T2 relaxation times of the main metabolites at 7T are substantially longer (121-170ms) [29], T2-relaxation correction was negligible at an acquisition delay of 1.3ms. Metabolic maps of tNAA, tCr, tCho, mIns, Glx, and the ratios tCr/tNAA, tCho/tNAA, mIns/tNAA and Glx/tNAA, with three different spatial resolutions (32×32, 64×64, 100×100), were up-sampled to the same resolution (400×400) by means of tricubic interpolation, whereas lesion and NAWM ROIs were resampled by nearest-neighbour interpolation for further analysis. Mean and maximum metabolic ratios were derived for each ROI and compared between the resolutions.
MRSI data quality was assessed over the whole MRSI slice and in lesions via three parameters: Cramér-Rao lower bounds (CRLB) reported by LCModel; linewidth of tNAA calculated as full-width-at-half-maximum (FWHM) of the LCModel fit; and signal-to-noise ratio (SNR) of tNAA. Similarly as before, all maps with quality metrics were up-sampled to 400×400 resolution and compared.
Statistical analysis was performed using SPSS (version 24; IBM, Chicago, IL, US). Wilcoxon signed-rank tests with correction for multiple testing were used for pair-wise comparisons of metabolic ratios and spectral quality metrics between the resolutions. Mann-Whitney U tests were used to compare the metabolic ratios between NAWM and MS lesions.
Results
In total, 77 MS lesions were investigated: 17 in subcortical and 60 in periventricular white matter. The median lesion volume was 155.7 mm3 (range, 10.8-747.0 mm3) (Histogram in Figure S1).
Qualitative assessment
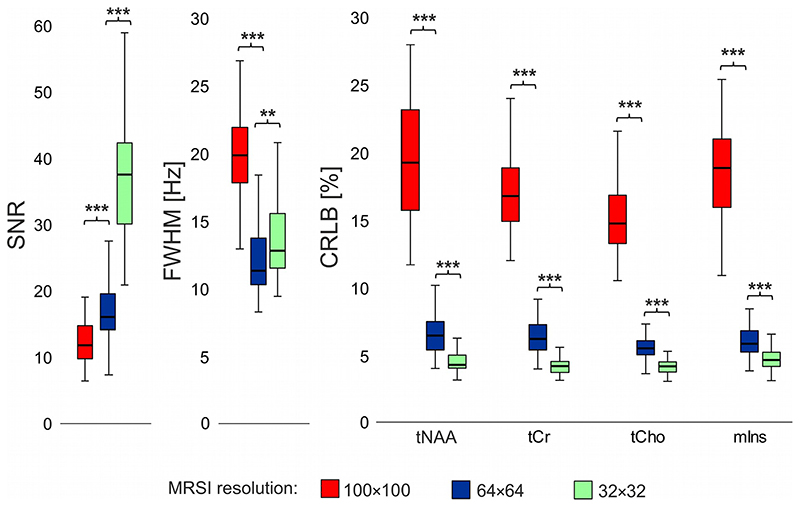
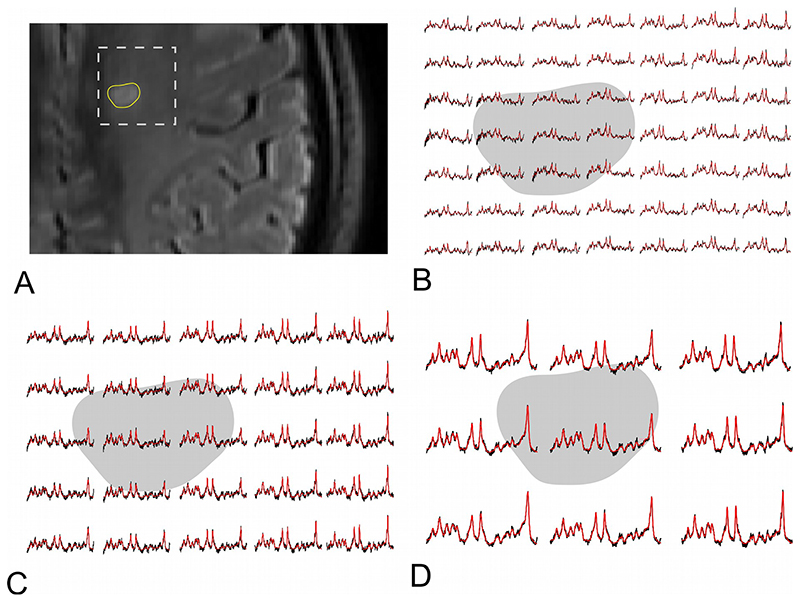
The spectral quality and quantification accuracy was very good in all MRSI scans (mean SNR>12, FWHM<20Hz, and CRLB<20% in MS lesions; and mean SNR>20, FWHM<20Hz, and CRLB<25% over the whole MRSI slice) with expected higher SNR and lower CRLB at lower resolutions (i.e., 32×32 and 64×64 compared to 100×100) (Figure 1). Example spectra are shown in Figure 2.
Figure 1. Boxplots with spectral quality and quantification accuracy metrics from three different resolutions of MRSI in multiple sclerosis lesions.
(** = p<0.01, *** = p<0.001, SNR = signal-to-noise ratio, FWHM = full-width-at-half-maximum, CRLB = Cramér-Rao lower bounds, tNAA = N-acetylaspartate + N-acetylaspartylglutamate, tCr = creatine + phosphocreatine, tCho = phosphocholine + glycerophosphocholine, mIns = myo-inositol)
Figure 2.
Representative spectra obtained by MRSI with A. 100×100, B. 64×64, and C. 32×32 matrix size in multiple sclerosis-related lesion (grey background) and surrounding normal-appearing white matter (white background). The N-acetylaspartate peak decrease is more prominent in ultra-high resolution MRSI.
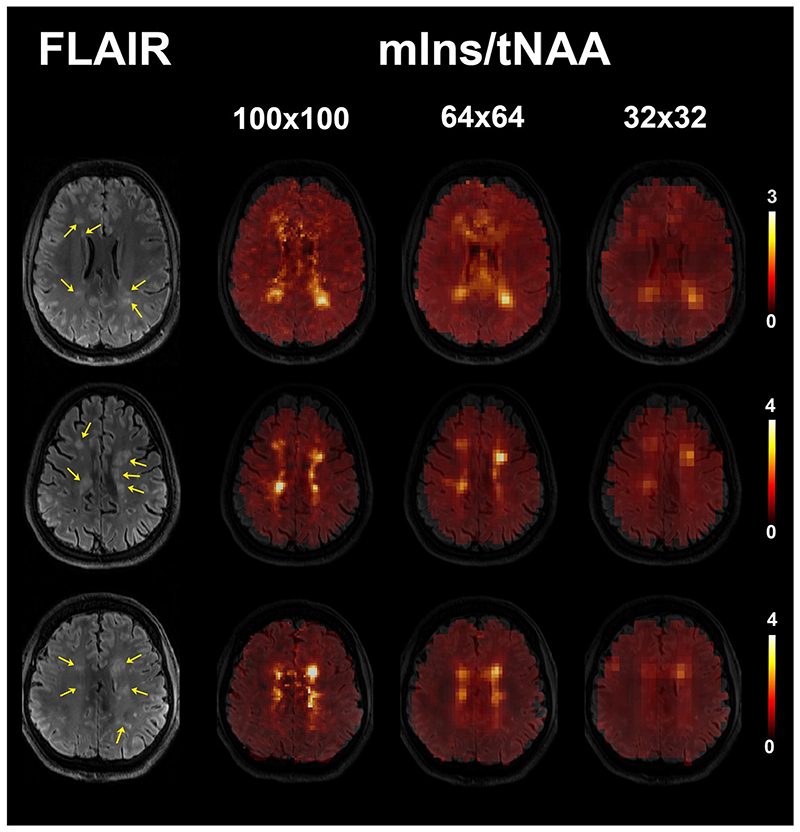
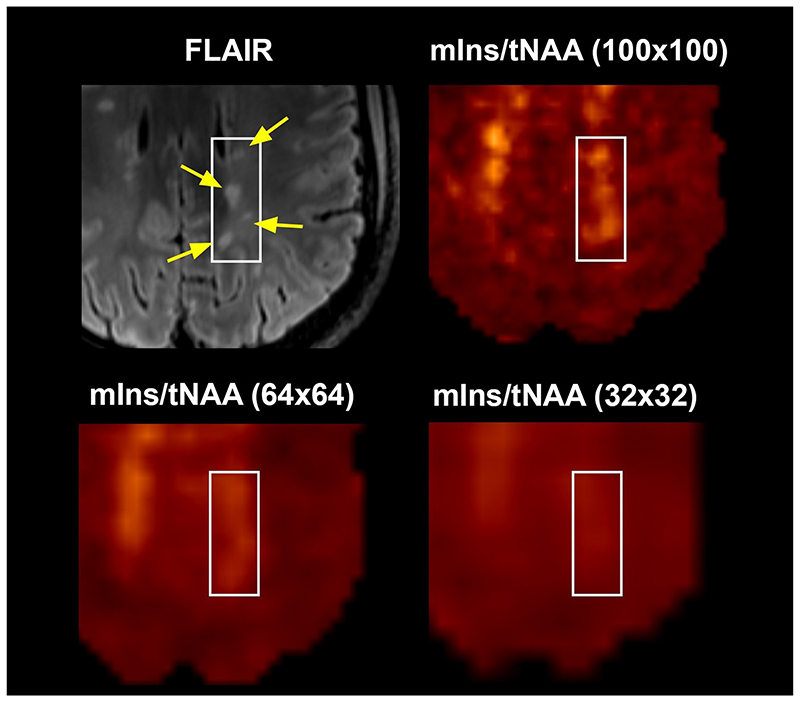
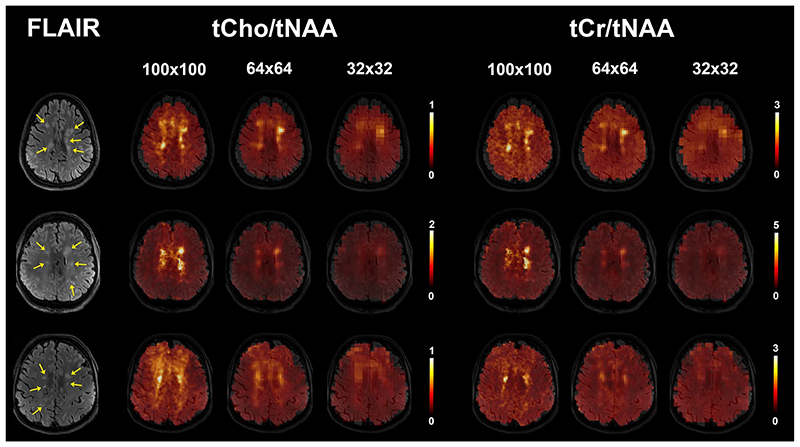
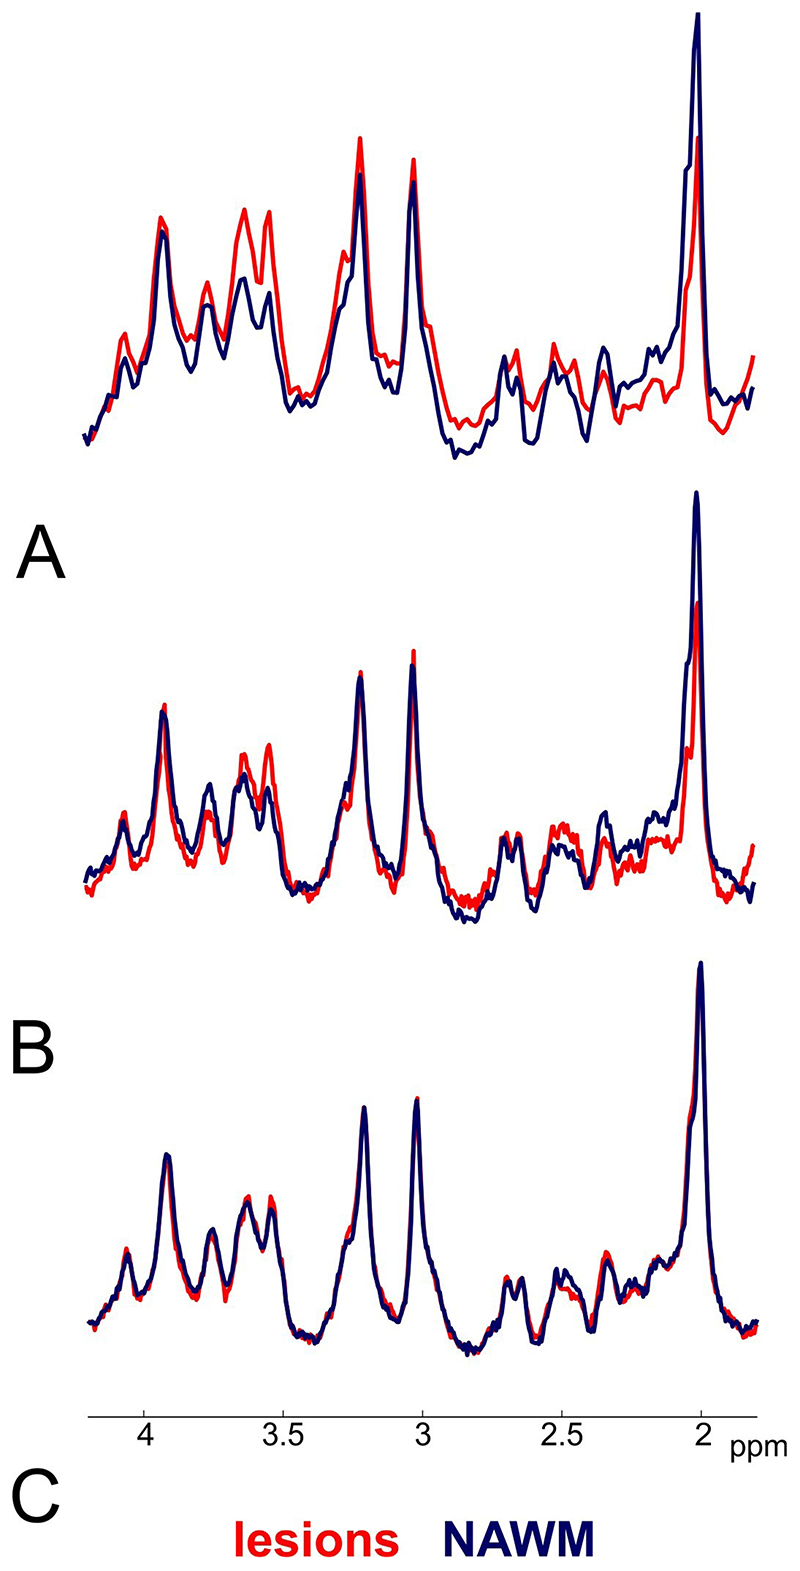
Changes in mIns/tNAA were the most prominent among the metabolic ratios at visual inspection. Sixty-four of investigated lesions (83%) were visible on mIns/tNAA maps at 100×100 resolution, 51 lesions (66%) were also elevated on 64×64 maps, and only 27 (35%) were visible on 32×32 maps (Figure 3). Moreover, although some very small adjacent lesions also showed elevations of mIns/tNAA at lower resolutions, they could not be properly resolved from each other, while this was possible with the 100×100 resolution (Figure 4). Other metabolic ratios (i.e., tCr/tNAA, tCho/tNAA) were also increased in some MS lesions at 100×100 resolution; these elevations were similarly less obvious or even invisible at lower resolutions (Figure 5). The increase of mIns, tCho and tCr, and the decrease of tNAA signal within lesions were well visible on mean ultra-high resolution spectrum. As the spatial resolution decreases, the differences between lesion and NAWM spectra diminish (Figure 6).
Figure 3.
mIns/tNAA maps of three patients with multiple sclerosis and for three different MRSI. The visibility of lesions (yellow arrows on FLAIR image) is decreased in lower resolutions. Some lesions are not visible in 64×64 or 32×32 resolution any more.
(FLAIR = fluid-attenuated inversion recovery, tNAA = N-acetylaspartate + N-acetylaspartylglutamate, mIns = myo-inositol)
Figure 4.
mIns/tNAA map of one patient in three different resolutions. Four small multiple sclerosis lesions (yellow arrows on FLAIR image) can be distinguished on the metabolic map with 100×100 resolution only.
(FLAIR = fluid-attenuated inversion recovery, tNAA = N-acetylaspartate + N-acetylaspartylglutamate, mIns = myo-inositol)
Figure 5.
Examples of tCho/tNAA and tCr/tNAA metabolic maps of three patients. The individual multiple sclerosis lesions (yellow arrows on FLAIR image) are visible in 100×100 resolution, but not all of them in lower resolutions.
(FLAIR = fluid-attenuated inversion recovery, tNAA = N-acetylaspartate + N-acetylaspartylglutamate, tCr = creatine + phosphocreatine, tCho = phosphocholine + glycerophosphocholine)
Figure 6.
Mean spectra from one representative patient obtained with the MRSI of a) 100×100, b) 64×64, and c) 32×32 matrix size. With the ultra-high resolution the differences between normal-appearing white matter (NAWM) (blue spectrum) and lesions (red spectrum) are more prominent due to lower partial volume errors. The signal of myo-inositol, creatine, and choline is increased, while N-acetylaspartate is decreased in lesions.
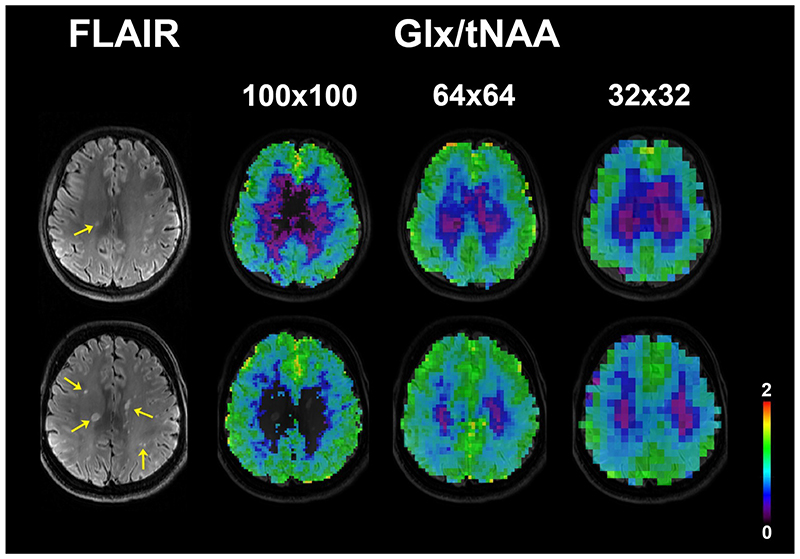
Metabolic ratios containing Glx could not be compared statistically due to lower quality of Glx fitting for the 100×100 resolution in 11 patients, but worked well with the 64×64 resolution (only one drop-out). Figure 7 shows examples of Glx/tNAA maps.
Figure 7.
Examples of Glx/tNAA metabolic maps at three MRSI resolutions from three different patients. Only voxels with Cramér-Rao lower bounds of Glx below 50% were included. At ultra-high resolution the spectral quality in many multiple sclerosis lesions (yellow arrows on FLAIR image) was not sufficient for Glx quantification.
(FLAIR = fluid-attenuated inversion recovery, tNAA = N-acetylaspartate + N-acetylaspartylglutamate, Glx = glutamate + glutamine)
Quantitative evaluations
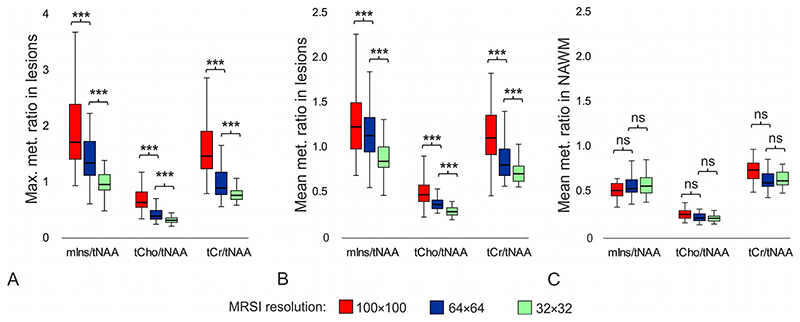
The mean/maximum metabolic ratios in lesions were significantly higher for the 100×100 resolution than for the 64×64 resolution (by +12%/+48% for mIns/tNAA; +41%/+87% for tCho/tNAA and +38%/+85% for tCr/tNAA) and the 32×32 resolution (by +42%/+109% for mIns/tNAA; +85%/+152% for tCho/tNAA and +62%/+137% for tCr/tNAA), respectively (all p≤0.001). Only larger lesions with volume above 150mm3 could be characterize with 64×64 MRSI without bias (in comparison to 100×100 MRSI, p>0.25). The separate analysis of 32×32 vs. 100×100 MRSI was not possible, because the cut-off value for lesion volume needed to be much larger and this population was low to perform statistical test. Similarly, the mean/maximum metabolic ratios in lesions were also significantly higher for the 64×64 resolution than for the 32×32 resolution (by +27%/+41% for mIns/tNAA; +31%/+35% for tCho/tNAA; and +17%/+28% for tCr/tNAA) (all p<0.001) (Figure 8a and 8b). No differences were found in metabolic ratios between native 64×64 and reconstructed 64×64 MRSI (all p>0.14); except for tCho/tNAA, p=0.024) (Figure S2).
Figure 8.
Boxplots with a) maximum and b) mean values of metabolic ratios in multiple sclerosis lesions, and c) mean values of metabolic ratios in NAWM obtained with different MRSI spatial resolutions; i.e. with 100×100, 64×64, and 32×32 matrix size. Each boxplot contains 77 values.
(***=p<0.001, ns = not significant, NAWM = normal-appearing white matter, tNAA =N-acetylaspartate + N-acetylaspartylglutamate, tCr = creatine + phosphocreatine, tCho = phosphocholine + glycerophosphocholine, mlns = myo-inositol)
There were no differences in metabolic ratios in NAWM between the resolutions, except of tCr/tNAA and tCho/tNAA between 100×100 and 32×32 MRSI resolutions (p<0.01) (Figure 8c). With 100×100 matrix size of MRSI we found significantly higher metabolic ratios in lesions than in NAWM (by +114% for mIns/tNAA; +55% for tCho/tNAA; and +53% for tCr/tNAA) (all p<0.001). With the 64×64 matrix size of MRSI the mIns/tNAA and tCr/tNAA ratios were significantly increased by +83% (p<0.001) or +39% (p<0.01), respectively, and with the 32×32 MRSI only mIns/tNAA was significantly increased in lesions compared to NAWM by +35% (p<0.001).
Discussion
We compared the ability of clinically feasible 7T MRSI protocols with three different spatial resolutions (i.e., 6.8×6.8×8 mm3, 3.4×3.4×8 mm3, and 2.2×2.2×8 mm3) to accurately characterize metabolic changes in the brains of MS patients. Our results show that lower MRSI resolutions vastly underestimate the extent of metabolic alterations in MS lesions.
The mean ratios of mIns/tNAA, tCr/tNAA and tCho/tNAA in MS lesions, acquired with 100×100 MRSI matrix size, were 1.4-, 1.6-, and 1.8-fold higher than for a 32×32. The discrepancy in maximum values of mIns/tNAA, tCr/tNAA and tCho/tNAA was even larger (e.g., 2.0-, 2.4-, and 2.5-fold higher ratios for 100×100 MRSI than for 32×32). This suggests that the vast majority of metabolic changes in MS lesions cannot be reliably assessed at conventionally used matrix sizes of 16×16 to 32×32. In the best case, low-resolution MRSI significantly underestimates the amount of changes due to higher susceptibility to partial volume errors, but, in the worst case, pathologic metabolic changes remain undetected. Therefore, the clinically feasible high-resolution 7T MRSI protocols suggested here may reveal much more pronounced neurochemical alterations in MS and contribute to understanding of the role of these alterations in the pathogenesis of the disease, or to enable monitoring the progress and treatment of MS.
Several groups have previously employed MRSI to study the evolution of neurometabolites in MS. In the majority of these studies, an increase in mIns was observed, either in the chronic lesions [13, 20], or in NAWM [14, 17]. Two groups reported increased tCr in pre-lesional tissue [13] or during lesion formation [17]. Both metabolites suggest ongoing glial proliferation. An increase of tCho and Glu in pre-lesional tissue [13, 17], or decrease of tNAA in lesions and NAWM were found [14, 15], related to axonal injury. In the work presented by Fleischer et al. [16], no significant changes were observed between chronic lesions and contralateral normal-appearing white matter, which, on the one hand, could indicate diffuse damage to white matter, or, on the other hand, partial volume errors could play a role. The metabolic changes in MS lesions presented in Fleischer’s work were lower than those we obtained, even with the lowest resolution of 32×32 (~0.57 vs. 0.88±0.23 for mIns/tNAA; or ~0.13 vs. 0.26±0.06 for tCho/tNAA). The metabolic ratios in NAWM were comparable with ours from 32×32 MRSI (~0.54 vs. 0.55±0.11 for mIns/tNAA; ~0.58 vs. 0.59±0.08 for tCr/tNAA; and ~0.12 vs. 0.20±0.04 for tCho/tNAA). The findings of Kirov et al. [13] were comparable to ours with 64×64 resolution (~1.15 vs. 1.12±0.28 for mIns/tNAA; 0.80 vs. 0.81±0.21 for tCr/tNAA; or 0.23 vs. 0.34±0.09 for tCho/tNAA); however, in the study by Kirov et al., only lesions >0.3cm3 were investigated. The MRSI data in these studies were acquired with in-plane spatial resolutions in the range of 10×10×10 mm3 to 15×15×15 mm3, and the measurement time varied between 18 to 34 min. As has already been shown, the application of ultra-high magnetic field (i.e., 7T), enables significantly improved spatial resolution and shortened MRSI scans [22, 30]. Our MRSI method can map neurometabolites in vivo in clinically acceptable times. The median lesion volume in our study was 155.7 mm3 (range, 10.8-747.0 mm3). We showed that with the ultra-high spatial resolution (2.2×2.2×8 mm3), even very small MS lesions can be well-resolved. This is particularly valuable for the study of highly active small cortical and subcortical MS lesions, where biochemical changes visible on MRSI could provide new insights into pathologic changes when jointly interpreted with other MRI contrasts. On the contrary, when less abundant metabolites such as Glx are of primary research interest, the ultra-high-resolution may not provide sufficient SNR in 6min to ensure reliable quantification. In such cases, lower spatial resolutions (e.g., 3.4×3.4×8 mm3), or longer scan times are required.
Differences in metabolite levels between higher and lower MRSI resolutions are expected due to partial volume errors; however, good data quality must be guaranteed. Thus, we estimated and compared the achieved spectral quality and quantification accuracy in the MS lesions and over the whole slice based on three parameters: SNR, FWHM, and CRLB. The obtained mean SNR>20 and CRLBs<25% for tNAA, tCr, tCho and mIns are considered satisfactory by the spectroscopic community, and therefore, the results of LCModel quantification reliable [12]. The differences in spectral quality metrics between the 100×100 and 64×64 resolutions can be explained by differences in applied acceleration factors (i.e., 4 vs. 6), directly determining the SNR; readout vector sizes (i.e., 512 vs. 1024), which define the CRLBs; and the readout duration (i.e., 113ms vs. 365ms), which can slightly affect the estimated linewidths. By reconstructing an additional dataset with 64×64 matrix size from 100×100 MRSI we showed that the sequence parameter adaptation has no significant effect on the metabolic ratios except for a small, but yet significant difference in tCho/tNAA (native 64×64, 0.34±0.09; reconstructed 64×64, 0.37±0.09). Consistency with recontructed 32×32 datasets can therefore be also expected.
Limitations
Our MRSI sequence is currently limited to the acquisition of 8mm thick single slices. Hence, the substantial partial volume effect is still present in the z-direction. In future studies, three-dimensional MRSI also at 7T and automated segmentation will remove this and allow improved characterization of neurometabolite changes over the entire brain [31]. A direct comparison of our findings with previously published results is complicated by differences in the employed sequences and spectral processing procedure, and was not the primary aim of this work. This might be overcome by an improved quantification routine. Reporting the absolute concentrations of metabolites requires assumption about relaxation parameters for both water and metabolites. There is strong evidence that both T1 and T2 relaxation are significantly altered in multiple sclerosis [32] and have not been assessed yet at 7T.
In conclusion, our results demonstrate that ultra-high resolution 7T MRSI is superior to conventional spectroscopic imaging resolutions in terms of accurately detecting brain metabolic alterations, if small lesions, such as multiple sclerosis lesions, are being investigated. Metabolic imaging of MS lesions might be beneficial in detecting early stages of lesion development, the detection of active lesions and their progression, as well as more sensitive monitoring under therapy.
Supplementary Material
References
- 1.Ge Y. Multiple Sclerosis: The Role of MR Imaging. Am J Neuroradiol. 2006;27(6):1165–76. [PMC free article] [PubMed] [Google Scholar]
- 2.Kober T, Granziera C, Ribes D, et al. MP2RAGE Multiple Sclerosis Magnetic Resonance Imaging at 3T. Invest Radiol. 2012;47(6):346–352. doi: 10.1097/RLI.0b013e31824600e9. [DOI] [PubMed] [Google Scholar]
- 3.Frischer JM, Bramow S, Dal-Bianco A, et al. The relation between inflammation and neurodegeneration in multiple sclerosis brains. Brain. 2009;132(5):1175–89. doi: 10.1093/brain/awp070. [DOI] [PMC free article] [PubMed] [Google Scholar]
- 4.Kaunzner UW, Gauthier SA. MRI in the assessment and monitoring of multiple sclerosis: an update on best practice. Ther Adv Neurol Disord. 2017;10(6):247–261. doi: 10.1177/1756285617708911. [DOI] [PMC free article] [PubMed] [Google Scholar]
- 5.Filippi M, Rocca MA. MR Imaging in Multiple Sclerosis. Radiology. 2011;259(3):659–81. doi: 10.1148/radiol.11101362. [DOI] [PubMed] [Google Scholar]
- 6.Amann M, Papadopoulou A, Andelova M, et al. Magnetization transfer ratio in lesions rather than normal-appearing brain relates to disability in patients with multiple sclerosis. J Neurol. 2015;262:1909–1917. doi: 10.1007/s00415-015-7793-5. [DOI] [PubMed] [Google Scholar]
- 7.Vargas WS, Monohan E, Pandya S, et al. Measuring longitudinal myelin water fraction in new multiple sclerosis lesions. Neuroimage Clin. 2015;9:369–375. doi: 10.1016/j.nicl.2015.09.003. [DOI] [PMC free article] [PubMed] [Google Scholar]
- 8.Kitzler HH, Su J, Zeineh M, et al. Deficient MWF mapping in multiple sclerosis using 3D whole-brain multi-component relaxation MRI. NeuroImage. 2012;59:2670–2677. doi: 10.1016/j.neuroimage.2011.08.052. [DOI] [PMC free article] [PubMed] [Google Scholar]
- 9.Ontaneda D, Sakaie K, Lin J, et al. Identifying the start of multiple sclerosis injury: a serial DTI study. J Neuroimaging. 2014;24(6):569–576. doi: 10.1111/jon.12082. [DOI] [PMC free article] [PubMed] [Google Scholar]
- 10.Hametner S, Wimmer I, Haider L, et al. Iron and neurodegeneration in the multiple sclerosis brain. Ann Neurol. 2013;74:848–861. doi: 10.1002/ana.23974. [DOI] [PMC free article] [PubMed] [Google Scholar]
- 11.Langkammer C, Liu T, Khalil M, et al. Quantitative susceptibility mapping in multiple sclerosis. Radiology. 2013;267:551–559. doi: 10.1148/radiol.12120707. [DOI] [PMC free article] [PubMed] [Google Scholar]
- 12.Oz G, Alger JR, Barker PB, et al. Clinical proton MR spectroscopy in central nervous system disorders. Radiology. 2014;270(3):658–79. doi: 10.1148/radiol.13130531. [DOI] [PMC free article] [PubMed] [Google Scholar]
- 13.Kirov II, Liu S, Tal A, et al. Proton MR Spectroscopy of lesion evolution in multiple sclerosis: Steady-state metabolism and its relationship to conventional imaging. Hum Brain Mapp. 2017;38(8):4047–63. doi: 10.1002/hbm.23647. [DOI] [PMC free article] [PubMed] [Google Scholar]
- 14.Kirov II, Tal A, Babb JS, et al. Serial proton MR spectroscopy of gray and white matter in relapsing-remitting MS. Neurology. 2013;80(1):39–46. doi: 10.1212/WNL.0b013e31827b1a8c. [DOI] [PMC free article] [PubMed] [Google Scholar]
- 15.Sun J, Song H, Yang Y, et al. Metabolic changes in normal appearing white matter in multiple sclerosis patients using multivoxel magnetic resonance spectroscopy imaging. Medicine (Baltimore) 2017;96(14):e6534. doi: 10.1097/MD.0000000000006534. [DOI] [PMC free article] [PubMed] [Google Scholar]
- 16.Fleischer V, Kolb R, Groppa S, et al. Metabolic Patterns in Chronic Multiple Sclerosis Lesions and Normal-appearing White Matter: Intraindividual Comparison by Using 2D MR Spectroscopic Imaging. Radiology. 2016;281(2):536–43. doi: 10.1148/radiol.2016151654. [DOI] [PubMed] [Google Scholar]
- 17.Klauser AM, Wiebenga OT, Eijlers AJC, et al. Metabolites predict lesion formation and severity in relapsing-remitting multiple sclerosis. Mult Scler J. 2018;24(4):491–500. doi: 10.1177/1352458517702534. [DOI] [PubMed] [Google Scholar]
- 18.Cao G, Edden RAE, Gao F, et al. Reduced GABA levels correlate with cognitive impairment in patients with relapsing-remitting multiple sclerosis. Eur Radiol. 2018;28(3):1140–8. doi: 10.1007/s00330-017-5064-9. [DOI] [PMC free article] [PubMed] [Google Scholar]
- 19.Srinivasan R, Ratiney H, Hammond-Rosenbluth KE, et al. MR spectroscopic imaging of glutathione in the white and gray matter at 7 T with an application to multiple sclerosis. Magn Reson Imaging. 2010;28(2):163–70. doi: 10.1016/j.mri.2009.06.008. [DOI] [PubMed] [Google Scholar]
- 20.Donadieu M, Le Fur Y, Lecocq A, et al. Metabolic voxel-based analysis of the complete human brain using fast 3D-MRSI: Proof of concept in multiple sclerosis. J Magn Reson Imaging. 2016;44(2):411–9. doi: 10.1002/jmri.25139. [DOI] [PMC free article] [PubMed] [Google Scholar]
- 21.Wang L, Lai H-M, Thompson AJ, Miller DH. Survey of the distribution of lesion size in multiple sclerosis: implication for the measurement of total lesion load. J Neurol Neurosurg Psychiatry. 1997;63(4):452–5. doi: 10.1136/jnnp.63.4.452. [DOI] [PMC free article] [PubMed] [Google Scholar]
- 22.Hangel G, Strasser B, Považan M, et al. Ultra-high resolution brain metabolite mapping at 7 T by short-TR Hadamard-encoded FID-MRSI. Neuroimage. 2018;168:199–210. doi: 10.1016/j.neuroimage.2016.10.043. [DOI] [PubMed] [Google Scholar]
- 23.Strasser B, Považan M, Hangel G, et al. (2 + 1)D-CAIPIRINHA accelerated MR spectroscopic imaging of the brain at 7T. Magn Reson Med. 2017;78(2):429–40. doi: 10.1002/mrm.26386. [DOI] [PMC free article] [PubMed] [Google Scholar]
- 24.Polman CH, Reingold SC, Banwell B, et al. Diagnostic criteria for multiple sclerosis: 2010 Revisions to the McDonald criteria. Annal Neurol. 2011;69(2):292–302. doi: 10.1002/ana.22366. [DOI] [PMC free article] [PubMed] [Google Scholar]
- 25.Kurtzke JF. On the origin of EDSS. Mult Scler Relat Disord. 2015;4(2):95–103. doi: 10.1016/j.msard.2015.02.003. [DOI] [PubMed] [Google Scholar]
- 26.Považan M, Strasser B, Hangel G, et al. Automated routine for MRSI data processing; Proceedings 2nd TRANSACT Meeting-Quality Issues in Clinical MR Spectroscopy; Bern, Switzerland. 2014. p. S2. [Google Scholar]
- 27.Považan M, Hangel G, Strasser B, et al. Mapping of brain macromolecules and their use for spectral processing of 1H-MRSI data with an ultra-short acquisition delay at 7T. Neuroimage. 2015;121:126–35. doi: 10.1016/j.neuroimage.2015.07.042. [DOI] [PubMed] [Google Scholar]
- 28.Xin L, Schaller B, Mlynarik V, et al. Proton T1 relaxation times of metabolites in human occipital white and gray matter at 7 T. Magn Reson Med. 2013;69(4):931–6. doi: 10.1002/mrm.24352. [DOI] [PubMed] [Google Scholar]
- 29.Li Y, Xu D, Ozturk-Isik E, et al. T1 and T2 metabolite relaxation times in normal brain at 3T and 7T. J Mol Imaging Dynam. 2012:S1-002 [Google Scholar]
- 30.Gruber S, Heckova E, Strasser B, et al. Mapping an Extended Neurochemical Profile at 3 and 7 T Using Accelerated High-Resolution Proton Magnetic Resonance Spectroscopic Imaging. Invest Radiol. 2017;52(10):631–639. doi: 10.1097/RLI.0000000000000379. [DOI] [PubMed] [Google Scholar]
- 31.Hingerl L, Strasser B, Moser P, et al. Towards Full-Brain FID-MRSI at 7T with 3D concentric circle readout trajectories. Vol. 1545. ISMRM; Paris, France: 2018. 4428 [Google Scholar]
- 32.Gracien RM, Reitz S, Hof SM, et al. Changes and variability of proton density and T1 relaxation times in early multiple sclerosis: MRI markers of neuronal damage in the cerebral cortex. Eur Radiol. 2016;26(8):2578–2586. doi: 10.1007/s00330-015-4072-x. [DOI] [PubMed] [Google Scholar]
Associated Data
This section collects any data citations, data availability statements, or supplementary materials included in this article.


