Summary
Haematopoiesis in the bone marrow (BM) maintains blood and immune cell production throughout postnatal life. Haematopoiesis first emerges in human BM at 11-12 post conception weeks1,2, yet almost nothing is known about how fetal BM (FBM) evolves to meet the highly specialised needs of the fetus and newborn. Here, we detail the development of FBM, including stroma, using multi-omic assessment of mRNA and multiplexed protein epitope expression. We find that the full blood and immune cell repertoire is established in FBM in a short time window of 6-7 weeks early in the second trimester. FBM promotes rapid and extensive diversification of myeloid cells, with granulocytes, eosinophils and dendritic cell subsets emerging for the first time. Substantial B-lymphocyte expansion in FBM contrasts with FL at the same gestational age. Haematopoietic progenitors from FL, FBM and cord blood (CB) exhibit transcriptional and functional differences that contribute to tissue-specific identity and cellular diversification. Endothelial cell types form distinct vascular structures that we demonstrate are regionally compartmentalized within FBM. Finally, we reveal selective disruption of B-lymphocyte, erythroid and myeloid development due to cell-intrinsic differentiation bias as well as extrinsic regulation through an altered microenvironment in Down syndrome (trisomy 21).
Keywords: human development, haematopoiesis, immunology, single cell RNA-sequencing, bone marrow, Down syndrome, trisomy 21
Introduction
Human bone marrow (BM) is established as the site of lifelong blood and immune cell production from 11-12 post conception weeks (PCW)1,2. By this time, fetal liver (FL) has initiated an immune repertoire, with further differentiation supported by spleen and thymus3,4. Priorities of fetal haematopoiesis are to generate erythrocytes for oxygen transport, platelets for haemostasis, macrophages for tissue remodelling and an immune system that is poised to respond to insult without risking tissue damage. Longer term haematopoiesis depends on a finite pool of haematopoietic stem cells (HSCs), supported by their niche. Perturbations of haematopoiesis in utero can have far reaching implications, including KMT2A fusions or Down syndrome (DS)-associated GATA1 mutations leading to increased risk of childhood leukaemia5,6. No systematic examination of FBM development or human BM stroma at any time point has been achieved to date.
In this study, we use single cell multi-omics to dissect the composition of disomic and trisomy 21 human FBM, as haematopoiesis emerges and develops during the early second trimester. We perform multi-omics profiling of FL and cord blood (CB) cells to compare tissue-specific differentiation landscapes. We validate: i) newly emerging cell states in FBM by FACS-based prospective isolation for single cell RNA sequencing (scRNA-seq) and morphology assessment; ii) FBM endothelial cell (EC) subset regional distribution by multiplex immunofluorescence (IF) imaging, and; iii) HSC differentiation potential using single cell clonogenic differentiation assays. Drawing upon existing scRNA-seq data from YS, FL, CB and adult BM (ABM), we show for the first time in humans how a complex multilineage blood and immune system is assembled in FBM within a matter of weeks.
Results
A single cell atlas of human FBM
We generated mRNA, TCR/BCR and CITE-seq data from single FBM mononuclear cells (CD45+/- enriched) and CITE-seq data from CD34+-selected cells following mechanical disruption of fetal femur (n=9; 12-19 PCW). We generated single cell mRNA profiles from DS FBM mononuclear cells (n=4) and CITE-seq data from CD34+ FL and CB cells. Reference scRNA-seq datasets (YS and FL4; CB and ABM (https://data.humancellatlas.org/) were used to investigate haematopoietic development (Extended Data Fig. 1; Supplementary Tables 1-5). Our data is available for exploration (https://fbm.cellatlas.io/).
From 115,993 FBM scRNA-seq cells, 103,228 passed quality control, revealing 64 transcriptionally distinct cell states that were manually grouped into 10 compartments (Fig. 1a-b; Extended Data Fig. 1; Supplementary Tables 1, 6-10). We constructed a continuous decision tree for supervised learning of cell-state discriminative protein combinations in FBM CITE-seq data (Extended Data Fig. 2; Supplementary Table 11-14). Between 12-19 PCW, the ratio of blood/immune cells to stromal cells expanded from 5:1 to 18:1. B-lymphopoiesis expanded, but total myeloid cell proportions remained consistent (Fig. 1c). Compared with age-matched disomic BM (12-13 PCW), in DS, megakaryocyte (MK) and B lineages were diminished (specifically pre pro-B and immature B cells, consistent with DS FL data7), while erythroid cells were significantly more abundant (mid/late erythroid cells) and more enriched in cell cycle genes (Fig. 1d; Extended Data Fig. 7). DS FBM exhibited genome-wide transcriptional differences in addition to increased expression of chromosome 21 genes (Fig. 1e). DS megakaryocyte-erythroid-mast cell progenitor (MEMP), MK and B-lineage cells overexpressed chromosome 21 TFs with documented roles in haematopoiesis including U2AF1 (MEMP), U2AF1 and ETS2 (MK) and ETS2 (B-lineage) (Extended Data Fig. 7).
Figure 1. A single cell atlas of human FBM.
1a) UMAP of FBM scRNA-seq data (n=9, k=103,228, 12-19 PCW) by broad categories (Supplementary Table 7).
1b) Gene expression dotplot of cell state-defining genes for broad categories in FBM scRNA-seq data. Dot colour indicates log-transformed, normalised and scaled gene expression value. Dot size indicates the percentage of cells in each category expressing a given gene.
1c) Frequency of broad cell categories in FBM scRNA-seq data. n=9 biologically independent samples are grouped into 4 developmental stages to facilitate statistical comparison over gestational stage. P-values resulting from quasibinomial regression model (subject to one-sided ANOVA; with correction for sort gates; computed at 95% CI and adjusted for multiple testing using Bonferroni correction) are shown in parentheses; *p<0.05, **p<0.01, ****p< 0.0001 (Supplementary Table 18, 19).
1d) Beeswarm plot of log fold-change in abundance between cells in equivalent broad categories in DS (n=4, k=16,743) and aged-matched non-DS FBM scRNA-seq (n=2, k=9,717) from biologically independent samples (Supplementary Tables 7, 20). Coloured dots indicate significant difference in abundance (p-value adjusted for multiple testing >10% FDR) estimated with a two-sided quasi-likelihood test (null hypothesis: no difference in abundance between the two conditions).
1e) Heatmap visualizing number of DEGs between equivalent cell states in DS vs. non-DS FBM scRNA-seq per chromosome, including correction for number of genes per chromosome (two-sided Wilcoxon rank-sum statistical test with Benjamini-Hochberg procedure for multiple testing correction; Supplementary Table 21).
1f) Cytospin images of FBM eosinophils, basophils and neutrophils (n=2 biologically independent samples; both 17 PCW, performed as 2 independent experiments) sorted according to gating strategy in Extended Data Fig. 1 and stained with Giemsa. 100x images were concatenated as shown by dotted lines. Scale bars; 10µm.
Granulocytes first emerge in FBM
Neutrophils, eosinophils and basophils were not detected in age-matched FL4. We validated their presence in FBM by morphology and prospective FACS-isolation for scRNA-seq (Smart-seq2) (Fig. 1f; Extended Data Fig. 1; Supplementary Table 15). Compared with YS and FL, FBM myeloid cells were significantly expanded in FBM (Fig. 2a). Detailed clustering revealed 18 monocyte, dendritic cell (DC), neutrophil and macrophage states from committed precursors to terminally-differentiated cells (Extended Data Fig. 3). In force-directed graph (FDG) embedding, monocyte and neutrophil signatures diverged at the granulocyte and monocyte progenitor (GMP) stage, consistent with mouse data8 (Extended Data Fig. 3). FBM GMPs expressed higher CEBPA (neutrophil specification), relative to SPI1 (monocyte specification)9, than FL GMPs (Extended Data Fig. 3). Across neutrophil differentiation (Monocle3-inferred), genes associated with leukaemia-risk congenital neutropenias (SBDS, HAX1, G6PC3) were expressed in early progenitors, while those without recognised leukaemia risk (AP3B1, CXCR4) were expressed in terminal differentiation stages (Extended Data Fig. 3).
Figure 2. Myeloid diversification, B-lineage expansion and tissue-specific properties of HSC/MPP.
2a) Left: frequency of monocytes (M), neutrophils (N) and DCs in YS (n=3), FL (n=14), FBM (n=9) and ABM (n=4) scRNA-seq datasets (n=biologically independent samples; line =median; *p<0.05,****p<0.0001 from one-way ANOVA with Tukey’s multiple comparison). Right: mean proportions of cell states within monocyte, neutrophil and DC lineages for above datasets (****p<0.0001 from quasibinomial regression model subject to one-sided ANOVA with 95% CI and Bonferroni correction; Supplementary Table 19,22).
2b) FDG of B-lineage cell states (k=28,583) in FBM scRNA-seq data. Grey ellipses highlight cycling cells. Dashed arrows denote i) cycling Pre B cell and ii) B cell differentiation branches.
2c) Frequency of B-lineage cells in YS, FL, FBM and ABM scRNA-seq datasets (replicates, measures of centre and statistical tests as per 2a; ***p<0.001,****p<0.0001; Supplementary Table 19,23).
2d) FDG visualisation of CD34+ FL (left), FBM (centre), and CB (right) cells on a CITE-seq gene expression landscape (Extended Data Fig. 5b). Colour indicates relative cell abundance per tissue by kernel density estimation (KDE).
2e) Colonies produced by DS (n=2, k=246, k*=64) and aged-matched non-DS (n=3, k=365, k*=73) HSC/MPPs where n=biologically independent samples, k=plated cells and k*=wells producing colonies). Bar graph shows proportions by colony type, with colony numbers provided in brackets. Statistical difference between DS and expected distribution based on non-DS tested by Chi square with **** p<10-15, 2-sided.
DC subsets diversify in FBM
Plasmacytoid DC (pDC), transitional DC (tDC) and DC3 emerged during FBM haematopoiesis, however, non-classical CD16+ monocytes and monocyte-DCs were not detected (Fig. 2a). DC1 and pDC, but not DC2 and DC3 signatures10, were conserved between fetal and adult peripheral blood subsets. FDG embedding revealed the tDC transcriptional state was intermediate between DC2 and pDC, as in adult blood10.. iRegulon analysis showed that TFs driving FBM pDC and tDC differentiation are shared (Extended Data Fig. 3).
Mature NK and T cells in FBM
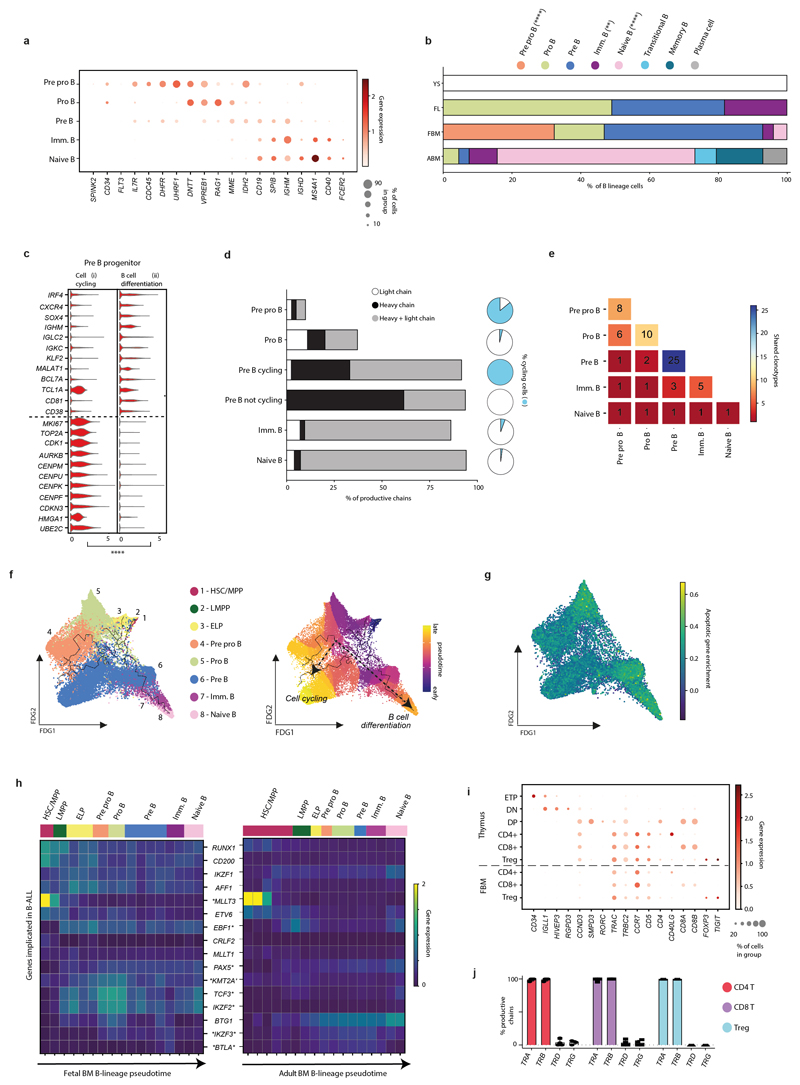
We identified NK cells, NKT-like cells and ILC precursors in FBM (Extended Data Fig. 3). FBM NK cells were enriched for NK cytotoxicity genes, relative to YS and FL (Extended Data Fig. 3). In contrast to ABM, FBM contained few T lymphocytes (naive only; Fig. 1a; Supplementary Table 5). As thymic lymphopoiesis is established before FBM is colonized3, these were single positive CD4, CD8 and T regulatory cells expressing productive TRA and TRB (Extended Data Fig. 4).
Expanded B-lymphopoiesis in FBM
We observed two bursts of proliferative activity during B cell development (in pre pro-B and pre-B progenitors; Fig. 2b). Heavy chain rearrangement was productive from the pre-B progenitor stage and heavy+light chain from the immature B cell stage. The emerging B cell repertoire was diverse, with a small number of shared clonotypes detected (Extended Data Fig. 4). The frequency of B-lineage cells was 10-fold higher in FBM than FL, and markedly skewed towards the earlier cell states, compared to ABM (Fig. 2c).
Differentiation trajectories predicted by Monocle3 branched at the Pre-B progenitor stage into ‘Cycling’ and ‘B cell differentiation’ paths. Apoptosis genes were most enriched in the non-cycling Pro-B and Pre-B cell stages, in keeping with programmed death of cells failing successful heavy chain recombination and integration into the Pre-B receptor (Extended Data Fig. 4).
Small deletions and translocations in a limited set of genes causing B-cell acute lymphoblastic leukaemia (B-ALL)11, which commonly presents in infancy and childhood, were highly expressed in early B lineage progenitors in FBM, but expression was less marked in equivalent ABM stages (Extended Data Fig. 4).
Tissue-specific properties of HSC/MPPs
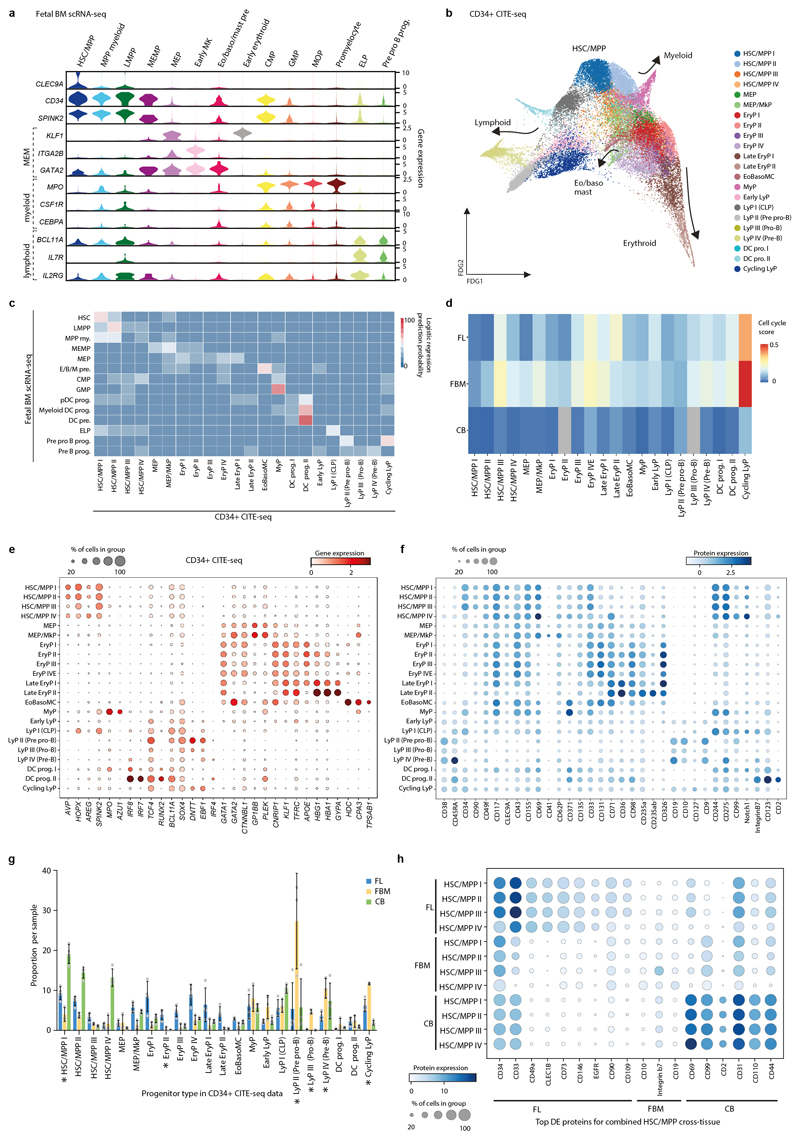
CD34+-selected CITE-seq data from FL, FBM and CB allowed us to explore the unique features of FBM progenitors (Extended Data Fig. 5; Supplementary Tables 1, 16-17). Erythroid precursors dominated FL, while lymphoid precursors were most prevalent in FBM. CB was enriched in HSC/MPPs, common lymphoid progenitors, and the earliest erythroid precursors (Fig. 2d). Cell cycle gene enrichment was lower in CB than fetal tissue HSC/MPPs (consistent with12), while FBM and FL HSC/MPPs showed similar cycling gene enrichment (Extended Data Fig. 5). Differentially expressed proteins in HSC/MPPs revealed tissue-specific patterns of adhesion molecules (CD49a and CD146 in FL; integrin β7 in BM), growth factor receptors (EGFR in FL) and molecules associated with HSC activation and recirculation (CD69 and CD31 in CB) (Extended Data Fig. 5).
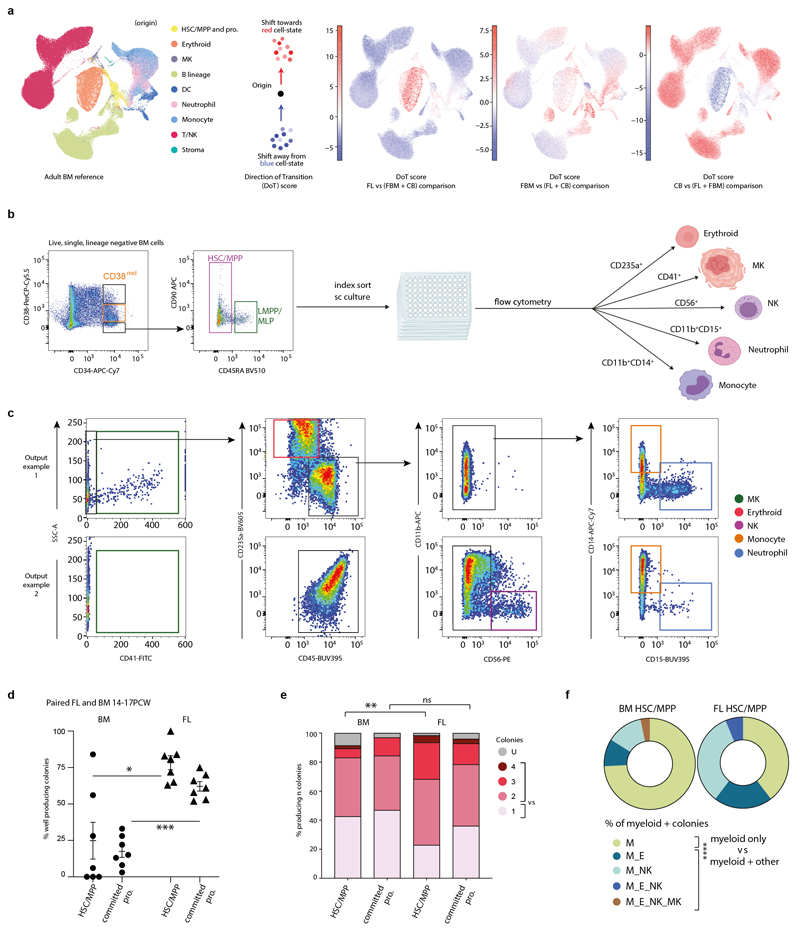
We used Direction of Transition (DoT) analysis to investigate tissue-specific HSC/MPP differentiation bias. FL was biased towards erythroid fate and away from lympho-myeloid fate, while FBM was biased towards neutrophil and B-lineage fate (Extended Data Fig. 6). We assessed differentiation potential in vitro via single cell clonal cultures of paired FL and FBM HSC/MPP. Myeloid colonies arose frequently from both HSC/MPP sources, but myeloid-restricted colonies were typical of FBM, supporting the myeloid bias of FBM HSC/MPPs from DoT analysis and myeloid cell diversity in FBM (Extended Data Fig. 6; Fig. 2a).
Erythroid bias of HSC/MPPs in DS
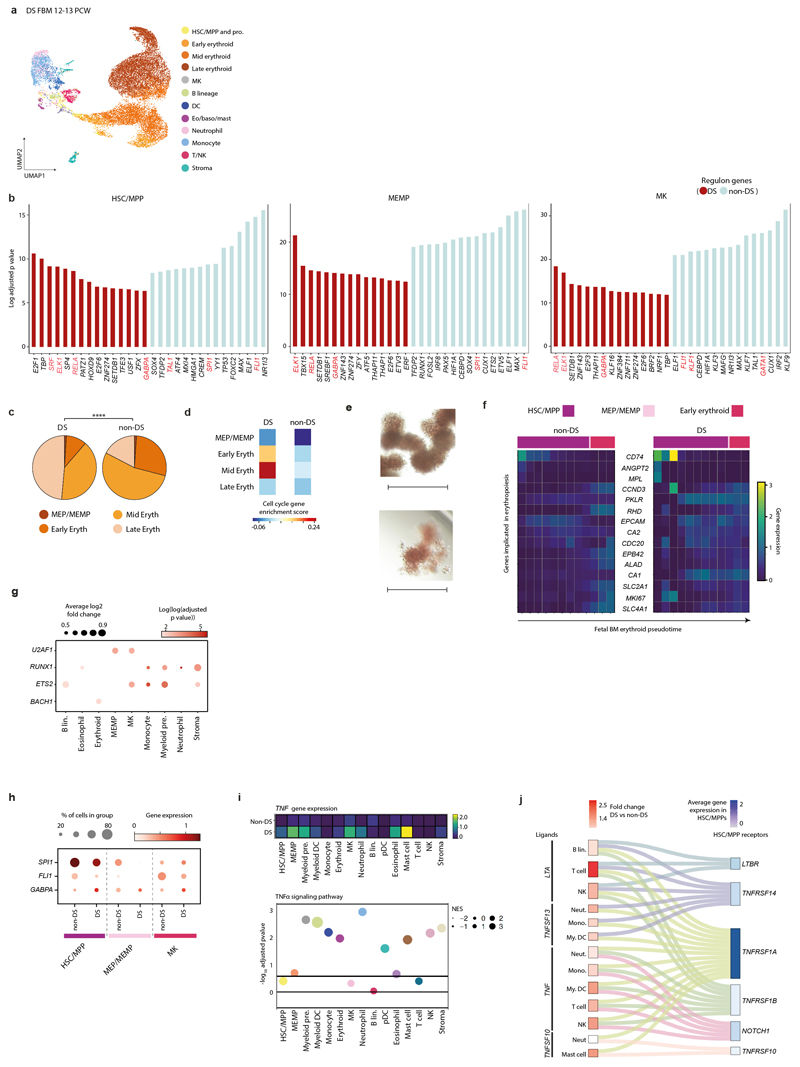
DS HSC/MPPs produced significantly more erythroid colonies and fewer myeloid colonies on methylcellulose compared to age-matched non-DS BM (Fig. 2e, Extended Data Fig. 7). Across DS erythroid differentiation pseudotime (Monocle3), increase in cell cycle genes (CCND3, MKI67) and elevated, sustained expression of glycolysis gene PKLR (Extended Data Fig. 7), suggested that rapid proliferation and metabolic adaptations compound the erythroid dominance.
TFs with well-defined roles in early haematopoietic programming (SPI1 and FLI1)13,14 were expressed at lower levels in DS than in non-DS HSC/MPPs and MEMPs, and PySCENIC inferred downregulation of corresponding regulons. DS MK cells expressed lower levels of FLI1, a driver of MK differentiation15, in keeping with recent data showing FLI1 promoter silencing in DS16. Regulons for chromosome-21-encoded GABPA, implicated in differentiation and maintenance of HSC/MPPs17, were over-represented in DS (Extended Data Fig. 7).
Most myeloid lineages in DS overexpressed TNF (in keeping raised circulating TNFα in DS18) and TNFα signalling pathway genes were over-represented in DS myeloid, erythroid, NK and stromal cells (Extended Data Fig. 7). CellPhoneDB analysis predicted statistically significant receptor-ligand interactions involving TNF-family proteins between DS FBM HSC/MPP and mature myeloid cells (Extended Data Fig. 7).
Stromal cell heterogeneity in FBM
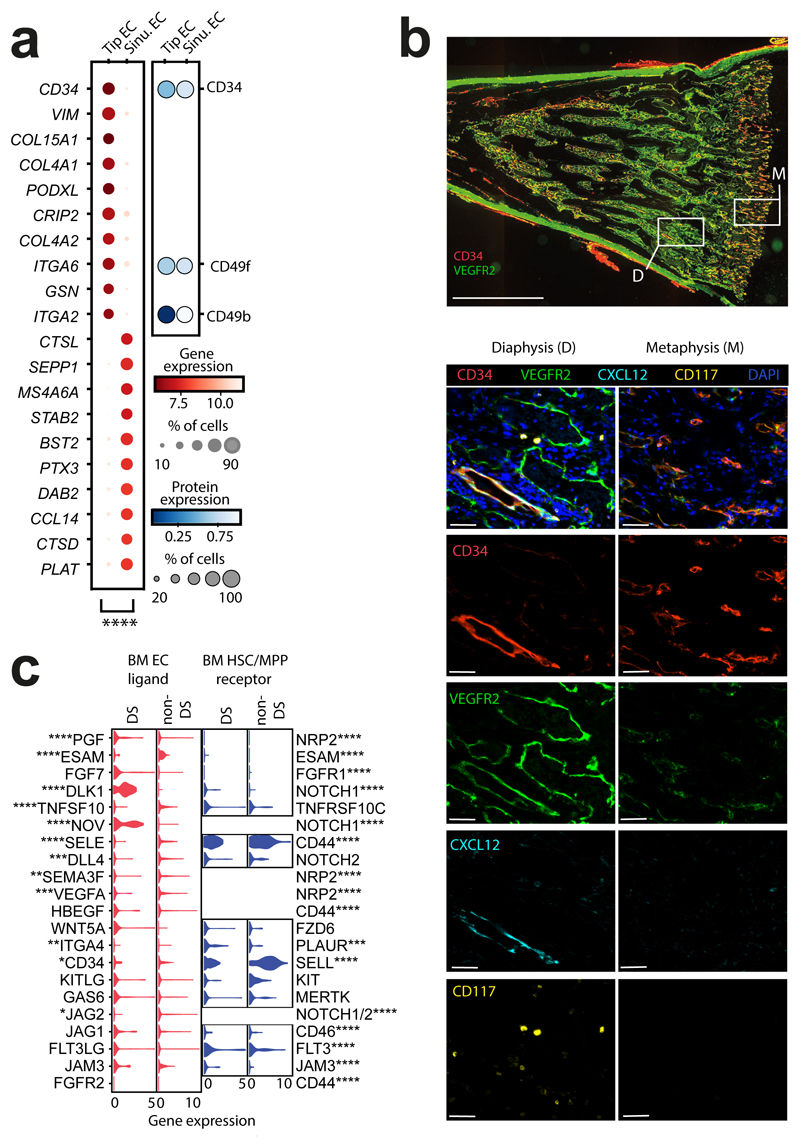
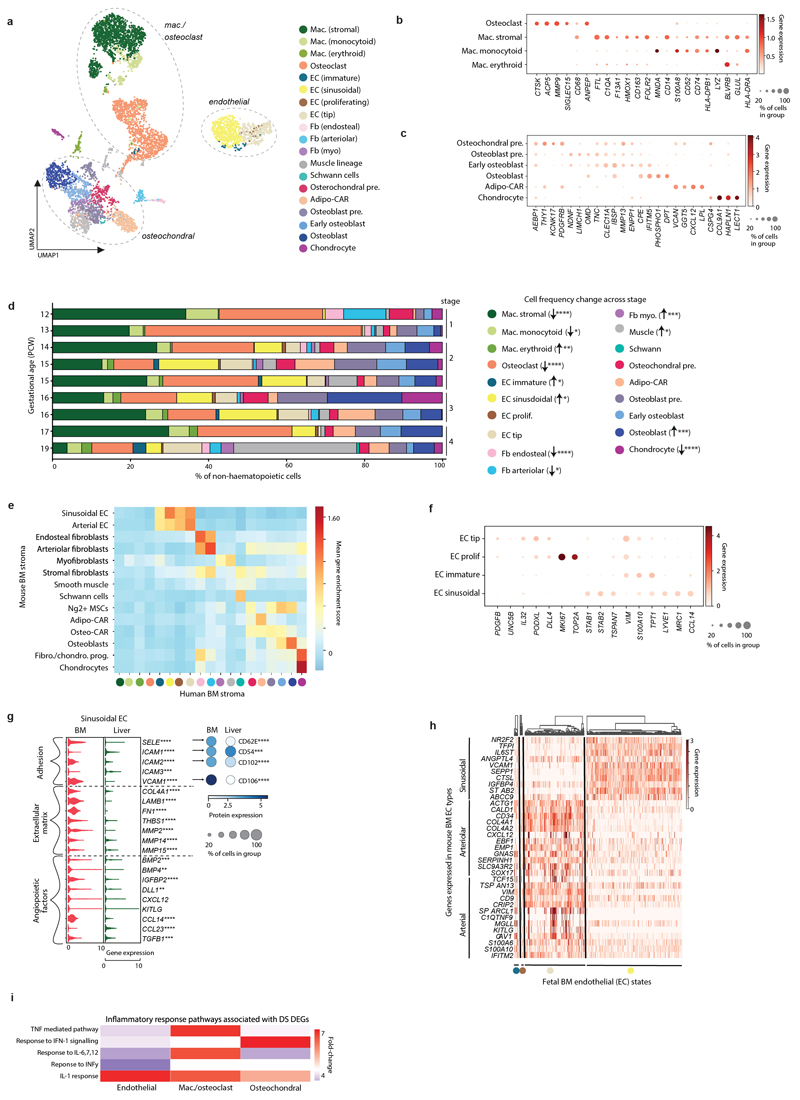
We identified 19 stromal cell states in FBM, closely correlated with post-natal mouse BM stroma19 (Extended Data Fig. 8). Two dominant EC clusters expressed KDR (VEGFR2) but with differential expression of CD34. One cluster expressed characteristic sinusoidal EC genes CTSL, STAB2, and SEPP1 and the other high levels of VIM and CD34, associated with non-sinusoidal EC in mouse19. The non-sinusoidal ‘tip EC’ cells expressed canonical markers for cells at the tips of growing vascular structures, PDGFB, UNC5B and DLL420 (Fig. 3a; Extended Data Fig. 8).
Figure 3. Stromal cell heterogeneity in FBM.
3a) Left: dotplot of top 10 genes (by p-value) differentially expressed between tip EC (k=362) and sinusoidal ECs (k=550) in FBM scRNA-seq data (n=9) (Methods/interpretation as in Fig. 1b; two-sided Wilcoxon rank-sum test with Benjamini-Hochberg correction; ****=p<0.0001, Supplementary Table 24). Right: dotplot of equivalent protein expression (where antibody present in CITE-seq panel) on tip and sinusoidal ECs in the FBM (total) CITE-seq dataset (n=3). Dot colour indicates DSB-normalised protein expression. Dot size indicates the percentage of cells in each category expressing a given protein.
3b) Top: longitudinal section of fetal femur with multiplex IF staining, showing CD34 (red) and VEGFR2 (green) channels to demonstrate regional differences in BM vasculature between metaphysis (M) and diaphysis (D). Scale bar; 2mm. White boxes locate regions of interest (ROI) shown below. Bottom: ROIs with all channels and single channels to demonstrate patterns of co-expression in CD34hiVEGFRlo metaphyseal vessels, VEGFR2hiCD34hi diaphyseal sinusoids and CD34hiCXCL12-associated arterioles. Scale bars; 50µm. Representative images from n=4 biologically independent FBM samples (14-15 PCW), with staining performed in 2 independent experiments.
3c) Violin-plots of gene expression in HSC/MPPs and pooled ECs from DS (n=4; k=105 HSC/MPPs; k=111 ECs) and non-DS (n=9; k=92 HSC/MPPs; k=938 ECs) FBM scRNA-seq datasets. Genes shown have a significant receptor-ligand interaction in non-DS FBM predicted by CellPhoneDB analysis (detailed in Extended Data Fig. 10a-b). Significance in expression difference between DS and non-DS calculated by two-sided Wilcoxon rank-sum test with Benjamini-Hochberg correction; *p<0.05,**p<0.01,***p<0.001,****p<0.0001; Supplementary Table 25).
Regional partitioning of EC subsets
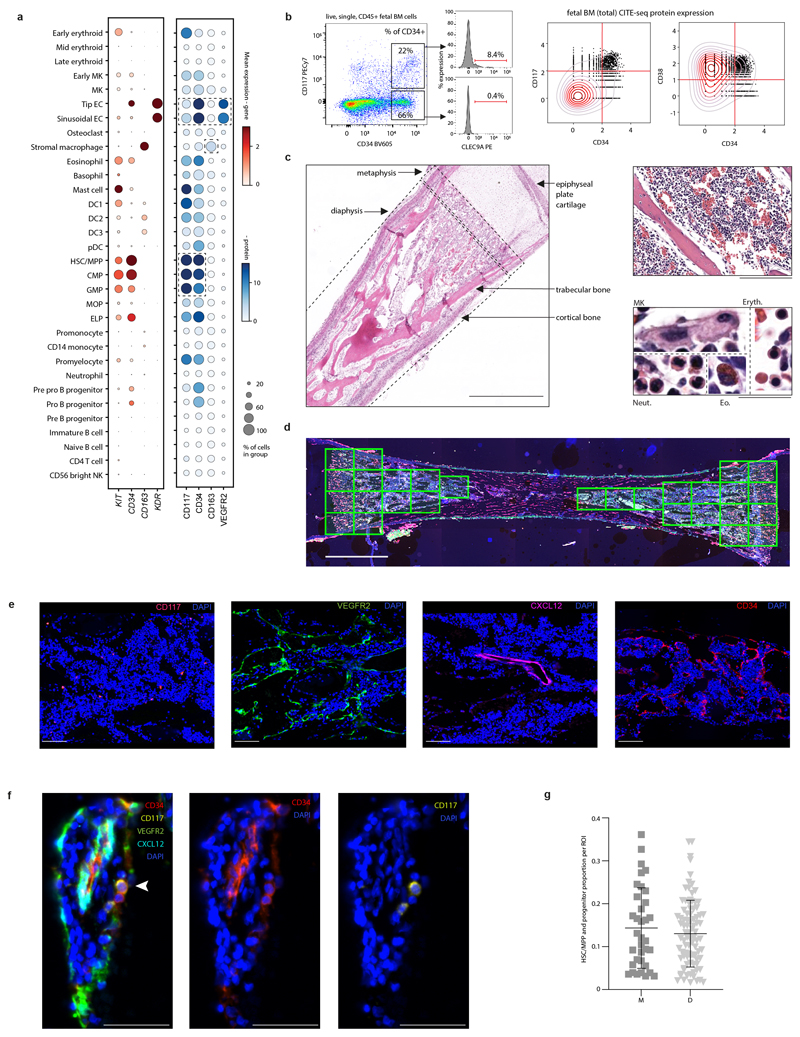
Using multiplex IF microscopy, we identified CD34hiVEGFR2lo, branching vessels adjacent to the epiphyseal cartilage (metaphysis). VEGFR2hiCD34lo cells formed convoluted structures in more distal regions (diaphysis). Thicker-walled CD34hi vessels, co-localizing with CXCL12+ cells, were present in both metaphysis and diaphysis (Fig. 3b; Extended Data Fig. 9). This regional compartmentalisation was reminiscent of L-type (sinusoids) and H-type (metaphyseal arterioles) vessels described in mouse BM, with distinct roles in supporting haematopoiesis21,22. Mouse sinusoidal and arteriolar EC genes were enriched in our FBM sinusoid and tip ECs respectively (Extended Data Fig. 8). The frequency of CD34+CD117+ HSC/MPP and progenitors relative to cellular density was similar in metaphyseal and diaphyseal areas (Wald test p-value = 0.431) (Extended Data Fig. 9).
EC across tissues and in DS
FBM sinusoidal ECs had significantly higher expression of SELE, VCAM1 and ICAM2 and concordant surface protein expression than analogous FL sinusoidal ECs. FBM sinusoidal ECs expressed more THBS1, which may facilitate HSC/MPP retention23 and matrix metalloproteinases, associated with mature cell egress24. FBM sinusoidal ECs also expressed more CCL14, implicated in myeloid progenitor proliferation25 (Extended Data Fig. 8).
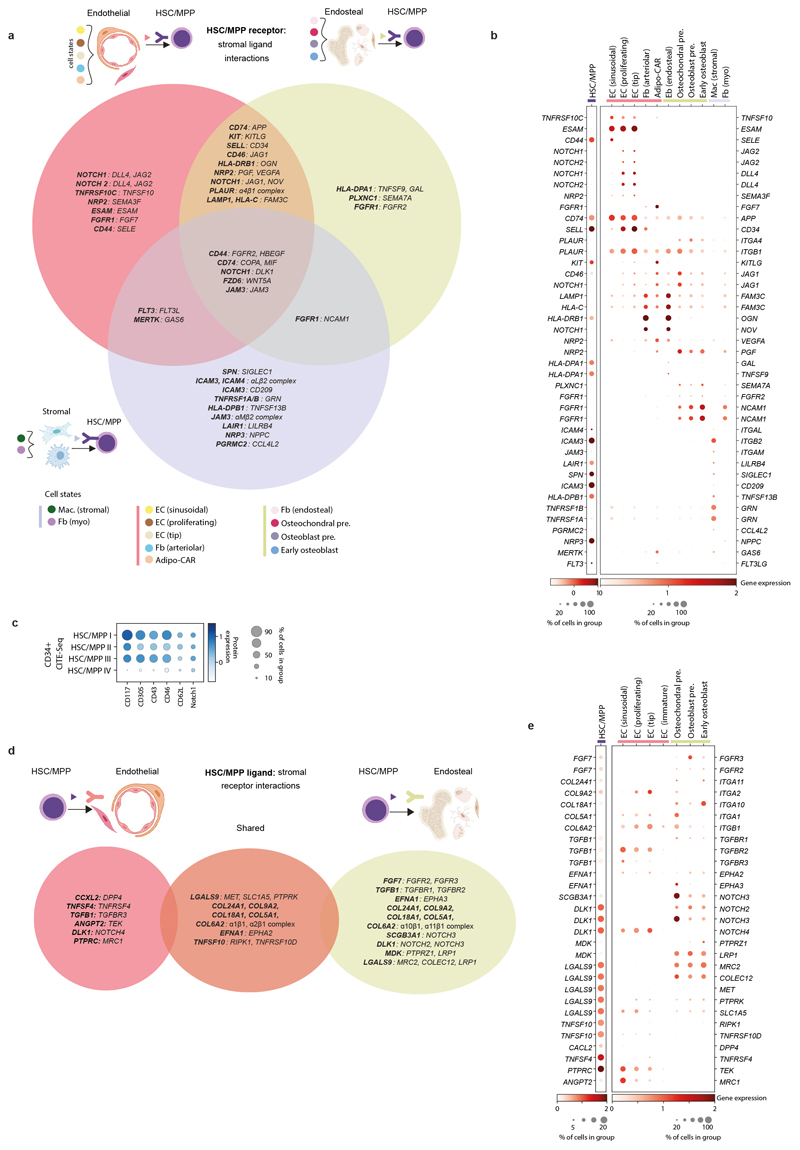
CellphoneDB predicted statistically significant haematopoiesis-supportive interactions between FBM HSC/MPP and stromal cells including FLT3/FLT3L and KIT/KITLG (confirmed at protein-level). CellPhoneDB analysis also predicted that HSC/MPPs signal to the tip (capillary metaphyseal) and proliferating ECs and the osteochondral precursor via ANGPT2, DLK1, EFNA1 and FGF7 (Extended Data Fig. 10).
The expression of NOTCH ligands NOV and DLK1, predicted by CellPhoneDB to mediate EC and HSC/MPP interactions (Extended Data Fig. 10), was significantly higher in DS than non-DS endothelium, and expression of NOTCH1 was increased on DS HSC/MPPs (Fig. 3c). NOTCH signalling has a critical role in HSC/MPP emergence as well as fetal HSC maintenance and response to proinflammatory signals, including TNFɑ26. Probing for inflammatory programmes in DS stroma, we found activation of multiple inflammatory pathways, including TNFα pathways, in DS versus non-DS macrophages/osteoclasts (Extended Data Fig. 7). Type I interferon, IFNɣ and other inflammatory cytokine (IL1, 6, 7, 12) response pathways were overexpressed in DS ECs and osteochondral cells (Extended Data Fig. 8). Our collective findings reveal an altered stromal environment in DS.
Discussion
Survival of the fetus depends on successful initiation of haematopoiesis in several organs across gestation. We reveal the complete establishment of haematopoiesis in the FBM within the first few weeks of the second trimester and identify the BM as a key site of neutrophil emergence, myeloid diversification and B lymphoid selection. We identify a unique intrinsic molecular profile of FBM HSC/MPPs, and an intrinsic bias of DS BM stem/progenitors underpinned by genome-wide transcriptional changes. A better understanding of human developmental haematopoiesis has the potential to inform regenerative and transplantation therapies, for example, through co-opting developmental programmes to accelerate reconstitution of haematopoietic stem cell transplants, and manipulating the lineage bias of differentiating progenitors to address specific deficiencies or for cellular therapy. For such endeavours to be successful, an initial phase of discovery science is critical. It is in this context that the current study provides the first comprehensive analysis of human FBM haematopoiesis to address a major previous knowledge gap.
Methods
Further methodological details (including dataset descriptions, methodological references and ‘Statistics and reproducibility’ information) are provided in ‘Supplementary Methods’.
Sample preparation
Fetal bone marrow tissue acquisition
Human developmental tissues were obtained from the Human Developmental Biology Resource (HDBR), following elective termination of pregnancy, with written informed consent and approval from the Newcastle and North Tyneside NHS Health Authority Joint Ethics Committee (08/H0906/21+5). HDBR is regulated by the UK Human Tissue Authority (HTA; www.hta.gov.uk) and operates in accordance with the relevant HTA Codes of Practice.
Dissociation of fetal bone marrow tissue
Adherent material was removed, and the fetal femur was cut into small pieces before grinding with a pestle and mortar. Flow buffer (PBS containing 5% (v/v) FBS and 2 mM EDTA) was added to reduce clumping. The suspension was filtered with a 70μm filter and red cells lysed with 1x RBC lysis buffer (eBioscience) according to the manufacturer's instructions.
Flow cytometry and FACS for scRNA-seq
Up to 1 million cells were stained with antibody cocktail, incubated for 30 minutes on ice, washed with flow buffer and resuspended at 10 million cells per ml, with DAPI (Sigma-Aldrich) added to a final concentration of 3μM immediately before FACS (Supplementary Table 26). FACS was performed on a BD FACSAria Fusion instrument running DIVA v.8 to formulate and execute sort decisions, and data were analysed post-sorting using FlowJo (v.10.6.2, BD Biosciences). For 10x Genomics scRNA-seq, cells were sorted into 500μl PBS in pre-chilled FACS tubes coated with FBS (Thermo Scientific). For Smart-seq2 scRNA-seq, index sorting was used to isolate single cells into 96-well LoBind plates (Eppendorf) containing 10μl lysis buffer (TCL (Qiagen) + 1% (v/v) β-mercaptoethanol) per well. Plates were centrifuged at 300g for 10 seconds and snap-frozen on dry ice for storage at -80° until further processing.
Droplet-based scRNA-seq
Single cell suspensions of disomic FBM (n=9; 12, 13+6, 14+3, 15, 15, 16+2, 16, 17 and 19 PCW) and trisomy 21 DS FBM (n=4; 12, 12, 12 and 13 PCW) were prepared for FACS-isolation, as above (Supplementary Table 26). Live, single, CD45+ and CD45- fractions from each sample were sorted and manually counted, then 7,000 cells were added to each channel of a Single Cell Chip before loading onto the 10x Chromium Controller (10x Genomics). Reverse transcription, cDNA amplification and sequencing libraries were generated using either the Single Cell 3’ v2 or Single Cell 5’ with V(D)J Reagent kits (10x Genomics) as per the manufacturer’s protocol. Libraries were sequenced using an Illumina HiSeq 4000 with v.4 SBS chemistry. For the gene expression libraries, the following parameters were used: Read 1: 26 cycles, i7 index: 8 cycles, i5 index: 0 cycles, Read 2: 98 cycles. For the V(D)J libraries the following parameters were used: Read 1: 150 cycles, Read 2: 150 cycles. All libraries were sequenced to achieve a minimum of 50,000 reads per cell.
Cytospins
From the 2 FBM suspensions prepared for plate-based SS2 scRNA-seq, target populations were sorted into FACS tubes containing chilled PBS. Slides were prepared using a Thermo Cytospin 4 cytocentrifuge and ShandonTM coated slides (Thermo, 5991059), dried at room temperature, then fixed with ice-cold methanol and stained using Giemsa (Sigma-Aldrich), according to manufacturer’s instructions. Slides were viewed using a Zeiss AxioImager microscope with 100X objective, and viewed using Zen (v.2.3) as previously described4.
CITE-seq experiments
Cryopreserved FBM (n=3, 14-17 PCW for CD34+ data generation; n=3 16-17 PCW for total mononuclear cell data generation), FL (n=4, 14-17 PCW) and CB cells (n=4, 40-42 PCW) (Supplementary Table 1) were thawed on the day of experiment and added to pre-warmed RF-10 (RPMI (Sigma-Aldrich) supplemented with 10% (v/v) heat-inactivated fetal bovine serum, FBS (Gibco), 100 U ml−1 penicillin (Sigma-Aldrich), 0.1 mg ml−1 streptomycin (Sigma-Aldrich), and 2 mM L-glutamine (Sigma-Aldrich). Cells were manually counted and pooled if cell numbers were low (pools noted in lane manifest; Supplementary Table 1). After incubation with Fc receptor blocking reagent (Biolegend), cells were labelled with CD34 APC/Cy-7 for CD34+ data generation or CD34-BUV395 for total mononuclear cell data generation (antibodies- Supplementary Table 26) for 10 mins in the dark and on ice. During the incubation, the CITE-seq antibody cocktail vial was centrifuged at 14,000 g for 1 min then reconstituted with Flow buffer. The vial was incubated for 5 mins at room temperature then centrifuged at 14,000 g for 10 mins at 4°C. The CITE-seq antibody cocktail (Supplementary Table 27) was then added to the cells along with a competition antibody mix (Supplementary Table 26) and incubated for 30 mins in the dark and on ice. The stained cells were then washed with Flow buffer before resuspension in Flow buffer supplemented with 50 µg/ml 7-AAD (Thermo Fisher).
Live, single cells (total mononuclear cell data generation) or live, single CD34+ cells (CD34+ data generation) were sorted by FACS into 500μl PBS in pre-chilled FACS tubes coated with FBS until the sample was exhausted. Sorted cells were then centrifuged at 500g for 5 mins before manual counting. Cells were then submitted to the CRUK CI Genomics Core Facility for 10x Chromium loading, library preparation and sequencing. Single cell 3’ version 3 (10x Genomics) kits were used and gene expression and cell surface protein libraries were generated as per manufacturer’s protocols. Libraries were sequenced using a NovaSeq (Illumina) to achieve a minimum of 20,000 reads per cell for gene expression and 5,000 reads per cell for cell surface protein.
Culture experiments
Single cell culture experiments on MS5 were performed on paired FBM and FL samples (n = 3; 14, 17, 17 PCW). MS5 was sourced from DSMZ and used in log-phase growth at passage 6–10. No additional verification or mycoplasma testing was performed. Cryopreserved single cell suspensions were thawed and sorted into HSC/MPP, LMPP/MLP and CD34+CD38mid fractions as previously described4: single, live, lineage-negative CD34+ cells were divided into CD34+CD38hi (top 20%), CD34+CD38mid (middle 60%) and CD34+CD38- (bottom 20%) fractions. CD34+CD38- cells were gated further into CD45RA- HSC/MPPs and CD45RA+ LMPP/MLP (Supplementary Table 26, Extended Data Fig. 6). Single cells were index-sorted into 96 well plates containing MS5, using culture conditions as previously described4. The proportion of wells producing colonies was calculated by individual well assessment under 4x magnification by light microscopy. The proportion was not correlated with gestational age. Proportions were calculated per plate (k=7 for n=3 independent biological samples per tissue), and significance between tissues tested by 2-sided Mann Whitney test. Single cell colonies were isolated after 14 days, and prepared for flow cytometry as above. Erythroid colonies were identified as CD45−GYPA+ ≥ 30 cells, megakaryocyte colonies as CD41+ ≥ 30 cells, myeloid colonies as [(CD45+CD14+) + (CD45+CD15+)] ≥ 30 cells, NK colonies as CD45+CD56+ ≥ 30 cells. LMPP/MLP and CD34+CD38mid cells were analysed as ‘committed progenitors’. Binomial tests with 2-tailed p-values were used for comparison of unipotential vs. multipotential colonies and ‘myeloid-only’ vs. ‘myeloid plus other’ colonies by tissue. Statistical tests were performed in GraphPad Prism (v8.1.0).
Single cell methylcellulose cultures were performed on HSC/MPP (sorted as per Extended Data Fig. 6) from DS (n=2; PCW=17, 19; k=246) and non-DS FBM (n=3; PCW=17, 19, 21; k=365). Methocult (Stem Cell Technologies, H4230) was supplemented with 20% IMDM (Gibco) including 1ng/ml Pen/Strep (Gibco), and human cytokines: 10ng/mL IL-6, IL-11, SCF, Flt3L, 50ng/mL GM-CSF and TPO, 20ng/mL IL-3 (all PeproTech), and 4 U/ml EPO (EPREX/Janssen) as described in Roy et al, PNAS 20127. Human FBM HSC/MPP subpopulations were index-sorted as viable single cells via FACS directly into 96 well TC plates (Sigma) containing supplemented methocult (50µl/well). Sorting was performed on a BD FACS Aria Fusion Cell Sorter (BD Biosciences). Plates were then incubated at 37° and 5% CO2 for 14 days, colony readout was performed at D14 and imaged for morphological characterisation using an EVOS XL Core Imaging System microscope. Colony type proportions were compared using Chi square with 2-sided p-value, using non-DS as expected distribution and DS as observed distribution (GraphPad Prism; v8.1.0).
Immunofluorescence microscopy
Specimens of FFPE fetal femur were decalcified in EDTA. 4μm sections were applied to adhesive slides (Trajan-3). Two multiplex panels were used: i) anti-CD34, anti-VEGFR2, anti-CD117 and anti-CXCL12 and ii) anti-CD34, anti-VEGFR2, anti-CD117 and anti-CD163, both with Opal-650, FAM, Rhodamine 6G and Red 610 fluorophores and DAPI counterstain (Antibody details and dilutions listed in Supplementary Table 26). Automated staining was performed on a Discovery Ultra System (Roche), and imaging with a Vectra-3 Automated Multispectral Imaging System (Akoya). Single-primary antibody controls were performed to determine staining specificity. A further secondary antibody with distinct emission profile was added after a denaturing step, to ensure that no protein complexes were retained between steps.
Regions containing haematopoietic tissue (predominantly sub-epiphyseal) were identified by matched tissue sections stained with H+E (Extended Data Fig. 9). Areas with non-haematopoietic tissue (i.e. the mid-point of femur, cortical bone and adjacent connective tissue and epiphyseal cartilage) and any areas with damaged tissue or non-uniform staining were excluded. 127 regions of interest (ROIs) were defined from images at 4x magnification, drawing from n=4 samples (14 and 15 PCW) (Extended Data Fig. 9). Within ROI images at 20x magnification, Inform v.2.4.8 (Akoya) was used to segment DAPI-stained nuclei and derive cartesian coordinates. CD34+CD117+ HSC/MPP and progenitors were manually annotated in QuPath v.0.2.3 by 4 independent reviewers under supervision of a hematopathologist. ROIs were assigned as metaphyseal if <1.3mm and diaphyseal if >1.3mm from the epiphyseal cartilage. We accounted for relative cellular density within each ROI by dividing HSC/MPP and progenitor counts by the total number of segmented cells in each ROI. Relative HSC/MPP and progenitor frequency between either metaphyseal or diaphyseal compartments was assessed by one-way ANOVA (Wald test) (Supplementary Table 28).
Data analysis
Alignment, quantification and quality control of scRNA-seq
The FBM scRNA-seq datasets described in this study (non-DS and DS) underwent pre-processing as detailed below. Droplet-based sequencing data was quantified with the CellRanger Single Cell Software Suite (10x Genomics, Inc) and aligned to a GRCh38 human reference genome (see details in Supplementary Table 29). Plate-based Smart-seq2 sequencing data was aligned with STAR (v2.7.3a) using the STAR index and aligned to the GRCh38 human reference genome. Gene-specific read counts for Smart-seq2 data were calculated using HTSeq-count (v0.10.0). Cells with fewer than 200 detected genes, genes expressed in fewer than 3 cells, and total mitochondrial gene expression exceeding 20% were removed from downstream analysis. The methodology for incorporation of external datasets (including: YS, FL, ABM, CB, blood, thymus, mouse BM) can be found in Statistics and Reproducibility, with methods used for any re-annotation described below.
Alignment, quantification and quality control of CITE-seq datasets
The FBM CITE-seq (including: CD34+, total) and FL/CB CD34+ CITE-seq datasets described in this study underwent pre-processing as detailed below. CITE-seq transcriptomic data was quantified with the CellRanger Single Cell Software Suite (10x Genomics, Inc) and aligned to a GRCh38 human reference genome, with cell surface protein data quantified using CITE-seq-Count (v1.4.3; see further details in Supplementary Table 29). CITE-seq cells from pooled lanes (Supplementary Table 1) were demultiplexed using SoupOrCell, using the singularity container provided by the authors of SoupOrCell on GitHub for reproducibility and with CellRanger human reference genome GRCh38 v3.0.0 for alignment. For the FBM CD34+ samples, the common variant option was also called (using the ‘common_variants_grch38.vcf’ file provided by SoupOrCell) in order to solve complex demultiplexing for these pooled samples.
Cells in CITE-seq transcriptome data with fewer than 200 detected genes, genes expressed in fewer than 3 cells, and total mitochondrial gene expression exceeding 20% were removed from downstream analysis. Cells in CITE-seq cell surface protein data with total counts higher than 5,000, or fewer than 30 antibodies, or antibodies expressed in fewer than 3 cells were removed from downstream analysis.
Doublet exclusion and transformation of GEX and protein matrices
We ran Scrublet (v0.2.1) on each 10x and CITE-seq RNA lane independently, obtaining per-cell scrublet scores. A doublet exclusion threshold of the median plus three times the median absolute deviation scrublet score was applied, as previously described4.
Raw gene expression matrices from RNA lanes (including those from both 10x and CITE-seq experiments) underwent correction for cell-to-cell variation via normalisation, using the normalize_per_cell function in Scanpy (v1.4.4). Data were then transformed using the log1p function in Scanpy to alleviate skewness of data and mean-variance relationship. Expression values of each gene were then scaled and centred using the scale function in Scanpy. Highly variable genes (HVGs) were detected using the highly_variable_genes function in Scanpy, with minimum mean variance, maximum mean variance and minimum dispersion set as 0.0125, 3 and 0.5, respectively.
Raw protein count matrices (from CITE-seq experiments) underwent correction for cell-to-cell variation via normalisation using the DSB (Denoised and Scaled by Background) normalisation method (Supplementary Methods; references). DSB normalisation quantified protein counts above background levels in individual cells, and allowed for improved interpretability of protein expression. We defined empty droplets by identifying cells that contained fewer counts than a specific threshold T, where T= μumi - (λσ umi), and μumi and σumi corresponded to the mean and the standard deviation of the ADT UMI counts, respectively. To separate background (or, empty cells) from non-background, λ was dynamically assigned based on the distribution of protein counts in a given CITE-seq dataset. Lower λ was selected for high-background data in order to select more data as background (including all empty cells within left hand-side peak in bimodal count distribution). Higher λ was selected for unimodal low-background data in order to select less data as background. DSB normalisation was then performed using the previously defined empty cells as input into ‘equation one’ defined by DSB authors (with pseudocount set at 5).
Dimensional reduction, batch correction and clustering of GEX and antibody matrices
Principal components were calculated using the pca function in Scanpy. Depending upon the plateau observed in the elbow curve from the pca_variance_ratio function in Scanpy, an informative number of PCs were selected for downstream analysis. Principal components were adjusted for sequencing type variation (i.e., 3’ and 5’ sequencing platforms), biological replicate, or tissue type using the Harmony package for batch correction (v1.0) (Supplementary Methods; references). Harmony parameter optimisation was performed using our novel FBM 10x as validation dataset and iterating through theta values 1-10. For each value of theta, we took the data substructure and technical variations (such as those introduced by FACs sorting) into consideration by calculating the mean kBET rejection rate and silhouette scores for all cell types post-Harmony correction (kBET package, v0.99.6, sklearn package v0.22). Optimum theta selection was then determined by the observation of lowest kBET rejection score vs. lowest silhouette score; theta was then set to 3 for Harmony batch correction. The neighbours function in Scanpy was used to calculate the neighbourhood graph. Uniform manifold approximation and projection (UMAP) embedding was calculated using the umap function in Scanpy (Supplementary Table 9). The neighbourhood graph was then clustered using the leiden function in Scanpy.
Differential expression analysis and annotation of single cell data
For the discovery FBM scRNA-seq dataset (as well as all other single cell datasets), cluster cell identity was assigned through DEG analysis of GEX matrices and their alignment with marker genes identified through literature search (Supplementary Table 6) and secondarily verified with logistic regression against the discovery FBM scRNA-seq dataset as reference (described below). DEGs were calculated in Scanpy using the rank_genes_groups function, which performed a two-sided Wilcoxon rank sum test restricted to genes expressed in at least 25% of cells in either of the two populations compared, and with a natural log fold change cut-off of 0.25. All p-values were adjusted for multiple testing using the Benjamini-Hochberg method. Following initial broad rounds of annotations, clusters of broad similarity (e.g., lymphoid cells) were subset for further rounds of feature selection, visualisation, clustering and annotation as described above. Clusters whose gene signatures indicated additional diversity were further investigated in an iterative manner, and those with unique signatures were selected for downstream analysis.
Differential expression analysis (both protein and RNA) was also used to compare cell states within/across datasets and across tissue, with these results provided in relevant Supplementary Tables. Prior to differential expression testing, DSB-normalised and log-transformed, normalised, scaled expression matrices (for protein and RNA single cell data, respectively) were scaled to a lower limit of zero. Two-sided Wilcoxon rank sum testing was then performed in either Scanpy or Seurat, with any additional filtering (such as for logfc or % cells) detailed in relevant Supplementary Table descriptions.
Extended Data
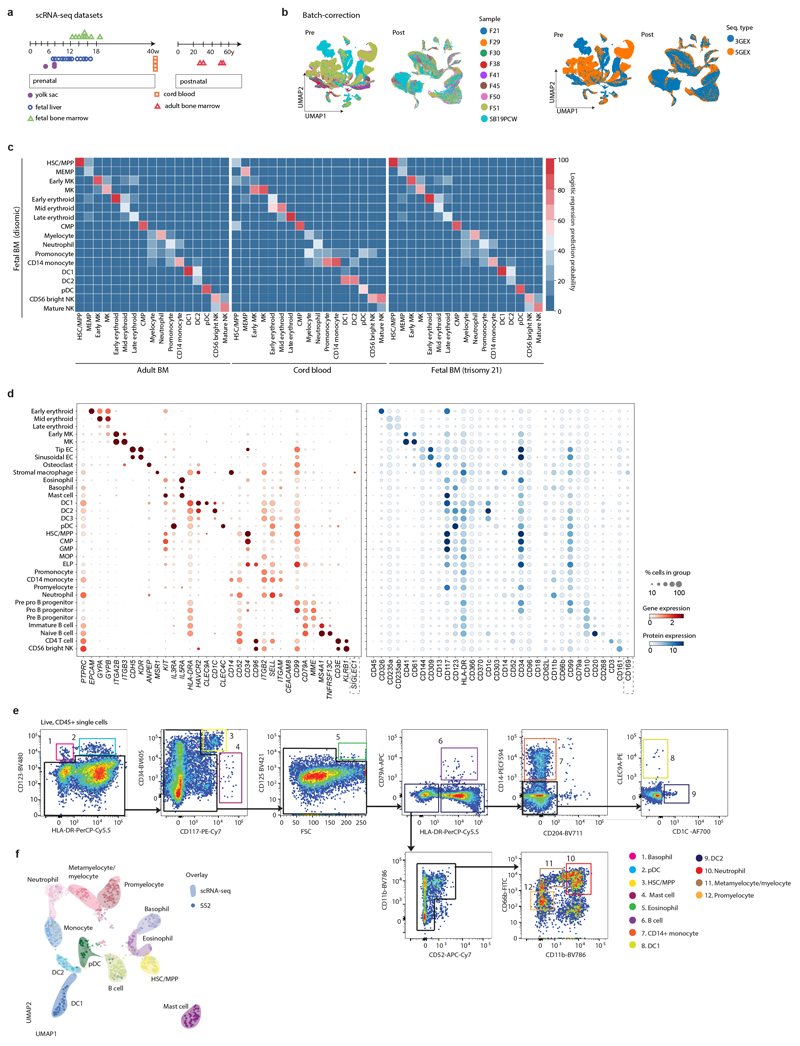
Extended Data Figure 1. A single cell atlas of human FBM.
1a) Summary of FBM scRNA-seq dataset and reference scRNA-seq datasets used in this study, including published YS/FL data4 and publicly available CB/ABM data from the Human Cell Atlas Data Coordination Portal.
1b) UMAP of FBM scRNA-seq data (as per Fig. 1a) pre- and post- Harmony batch correction. Sequencing type and sample is represented by colour.
1c) Logistic regression for intersecting cell states annotated in FBM, ABM, CB, and DS FBM scRNA-seq datasets. Prediction probability indicated by colour scale.
1d) Dotplots for expression of selected cell-state defining genes (left) in FBM CITE-seq data where corresponding protein was available in the ADT panel (right). Genes were selected from DE analysis (two-sided Wilcoxon rank-sum statistical test with Benjamini-Hochberg procedure for multiple testing correction; Supplementary Table 12). Markers used for FACS isolation are shown in bold type. Log-transformed, normalised and scaled gene expression values (upper limit 3) and DSB-normalised protein expression values (upper limit 15) are represented by the colour of the dots. Percentage of cells in each cell type expressing the marker is shown by the size of the dot. To contextualise dotplots shown in this panel, DE proteins were independently calculated for the FBM CITE-seq data (Supplementary Table 13), with method as described above for genes.
1e) FACS strategy used to isolate cell types for validation based on cell-state defining markers from scRNA-seq data. Representative plots from n=2 samples (17 PCW) are shown. Gating strategy is described in Methods.
1f) UMAP of FBM SS2 scRNA-seq data (n=2, k=486, 17 PCW; Supplementary Table 15) with a 50-cell per subset sample of predicted 10x scRNA-seq counterparts (n=9, k=600). 10x scRNA-seq data represented by coloured areas and SS2 data represented by dots of equivalent colour.
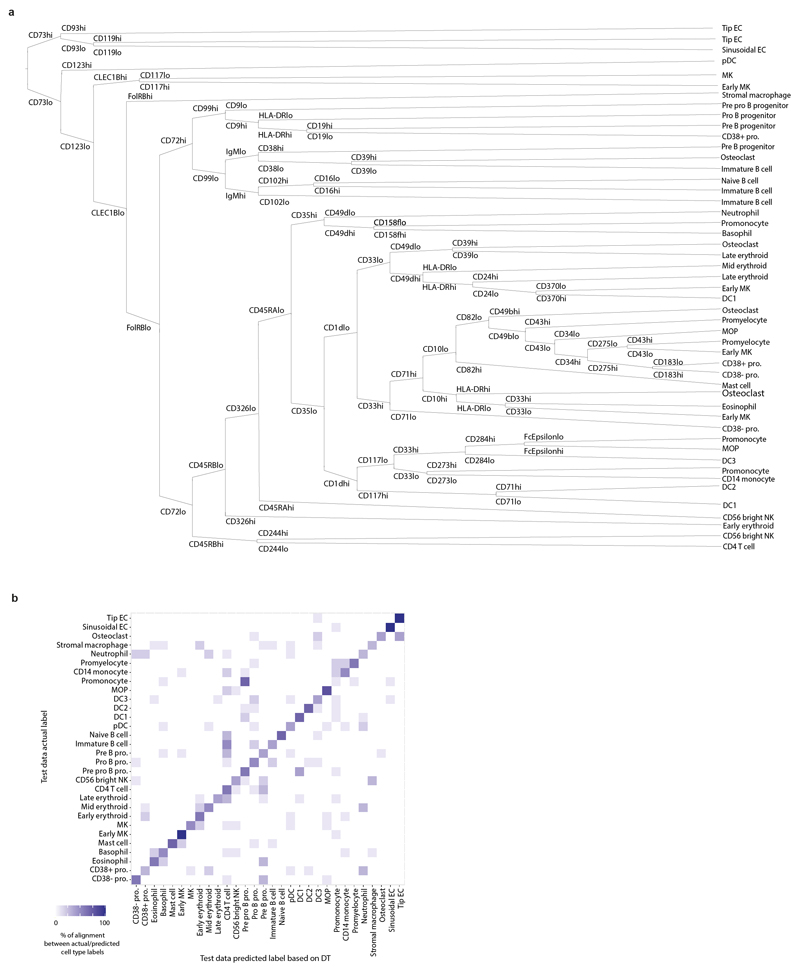
Extended Data Figure 2. A single cell atlas of human FBM.
2a) Continuous decision tree constructed using the Rpart package to distinguish between the lineage-committed immune cell types in FBM (total) CITE-seq data using the 198 epitopes detected (see Supplementary Methods). Node splits were labelled ‘lo’ or ‘hi’ for visualisation purposes. The branch rules of the tree operate on continuous protein expression values.
2b) Confusion matrix showing the actual cell type labels and the predicted cell type labels for the decision tree (in panel a) when run on the test data (see Methods). Sensitivity and specificity are illustrated in this heatmap, with complete statistics provided in Supplementary Table 14. Overall accuracy computed with 95% CI using a binomial test and checked with a one-sided test (see caret package documentation for confusionMatrix function).
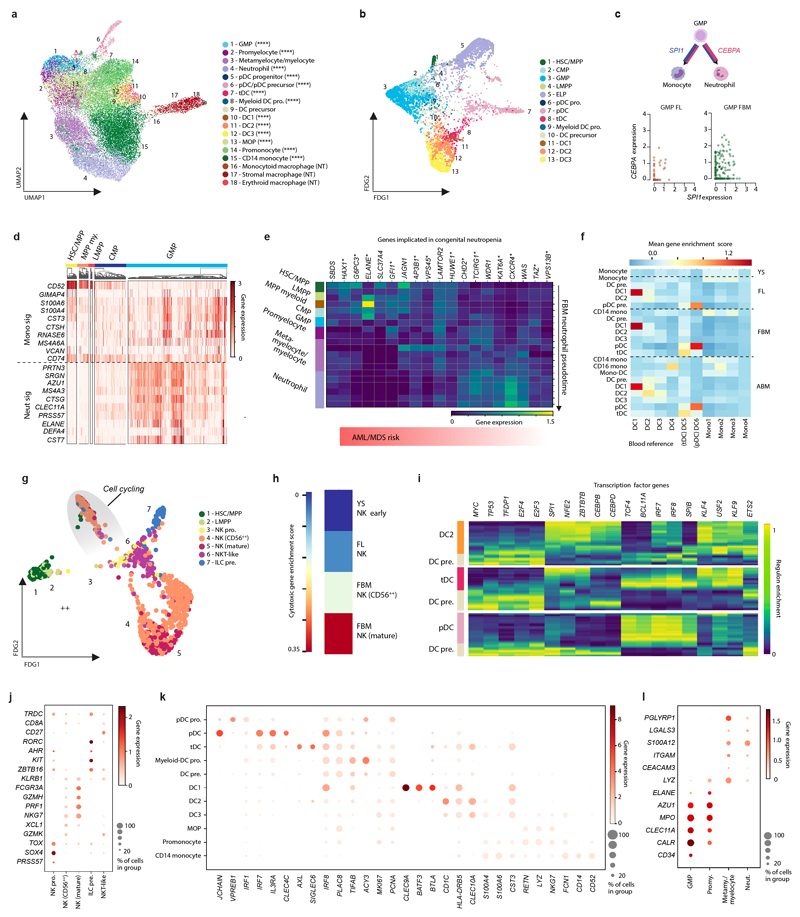
Extended Data Figure 3. Diversification of innate myeloid and lymphoid cells.
3a) UMAP of monocyte, DC, neutrophil and macrophage subsets (k=34,318) in the FBM scRNA-seq dataset.
3b) FDG of DC, myeloid progenitor and HSC/MPP subsets (k=5,702) in the FBM scRNA-seq dataset.
3c) Left: Illustration displaying role of SPI1 and CEBPA dosage in influencing monocyte and neutrophil differentiation from GMPs. Right: log-transformed, normalised and scaled expression of CEBPA and SPI1 in GMPs from FL and FBM scRNA-seq datasets.
3d) Heatmap showing gene expression (GEX) for early monocyte and neutrophil commitment markers (two-sided Wilcoxon rank-sum statistical test with Benjamini-Hochberg procedure for multiple testing correction; Supplementary Table 30) in FBM scRNA-seq progenitors. Hierarchical clustering of each cell type shown (see Methods). GEX values are log-transformed, normalised and scaled (upper limit of 3). Sig = signature.
3e) Heatmap showing expression of genes implicated in severe congenital neutropenia (Supplementary Table 31) across FBM scRNA-seq Monocle3-inferred neutrophil pseudotime (DEGs across pseudotime marked with asterisk; one-sided Moran’s I statistical test; Supplementary Tables 32, 33). GEX values are log-transformed, normalised and scaled (upper limit of 1.5).
3f) Heatmap showing gene enrichment (see Methods) of blood DC/monocyte signatures10 in developing and mature haematopoietic tissues (YS, FL4, FBM, ABM).
3g) FDG of NK/ILCs (k=915) in the FBM scRNA-seq dataset. Grey ellipse highlights proliferating cells.
3h) Heatmap showing NK cytotoxicity gene enrichment in NK cell states in YS, FL and FBM (See Methods). Relative enrichment is indicated by colour scale.
3i) Heatmap of predicted TF activity across inferred FBM DC pseudotime (FBM scRNA-seq DC-lineage cell states as input). TF activity inferred using iRegulon and pseudotime calculated using the Scanpy sc.tl.dpt function. GEX normalised to between 0-1 prior to plotting.
3j) Dotplot showing cell state-defining genes for NK and ILCs in the FBM scRNA-seq dataset. Methods/interpretation as in Fig. 1b.
3k) Dotplot showing expression of cell state-defining genes for DC and monocytes in the FBM scRNA-seq dataset. Methods/interpretation as in Fig. 1b.
3l) Dotplot showing expression of cell state-defining genes for myeloid precursors and neutrophils in the FBM scRNA-seq dataset. Methods/interpretation as in Fig. 1b.
Extended Data Figure 4. Expanded B-lymphopoiesis in FBM.
4a) Dotplot of cell state-defining genes for FBM scRNA-seq B-lineage. Methods/interpretation as in Fig. 1b. Abbreviations as in Fig. 2b.
4b) Barplot for mean proportions of B-lineage cell states in FL (n=14), FBM (n=9) and ABM (n=4) scRNA-seq datasets (n=biologically independent samples; B lineage absent in n=3 YS). P-values resulting from quasibinomial regression model (subject to one-sided ANOVA; with correction for sort gates; computed at 95% CI and adjusted for multiple testing using Bonferroni correction) are shown in parentheses; **p<0.01, ****p<0.0001; Supplementary Table 19, 23).
4c) Violin-plot of DEGs (computed using two-sided Wilcoxon rank-sum statistical test with Benjamini-Hochberg procedure for multiple testing correction; ****=p<0.0001; Supplementary Table 34) across FBM scRNA-seq Pre-B progenitor paths as in Fig. 2b; see Methods). GEX are log-transformed, normalised and scaled.
4d) Barplot showing mean proportion of productive heavy/light chains in FBM B-lineage cells present in both mRNA/BCR-enriched scRNA-seq (n=2, k=5,052). Pie-charts show the proportion of cycling cells (see Methods) per cell-type.
4e) Heatmap of shared clonotypes between FBM B-lineage cell types, as defined by CellRanger.
4f) FDG of B-cell development (k=30,066) in the FBM scRNA-seq dataset. Colour indicates state (left) and Monocle3 pseudotime value (right). Paths as in Fig. 2b.
4g) FDG of B-lineage (k=28,583) in the FBM scRNA-seq dataset. Colour indicates apoptotic gene enrichment score (see Methods/legend).
4h) Heatmap of B-ALL-implicated genes across Monocle3-inferred FBM/ABM B cell development pseudotime (see panel F; Supplementary Tables 32, 35-37; DEGs across pseudotime marked with asterisk; one-sided Moran’s I statistical test). Log-transformed, normalised and scaled GEX (upper limit of 2).
4i) Dotplot comparing expression of characteristic T-cell genes in cell states from thymus and FBM scRNA-seq datasets (see Methods). Interpretation as in Fig. 1b. Abbreviations: ETP = early thymocyte precursor; DN = double negative; DP = double positive.
4j) Barplot of productively rearranged TRA/B/G/D chains by T-cell state in n=4 biologically independent FBM samples at 14-17 PCW, k=194 cells. Chain rearrangements were as defined by CellRanger. Bars show mean and error bars SD. Mean±SD TCR productivity was 97±7%, 90±14% and 96±8% for CD4-T, CD8-T and Treg.
Extended Data Figure 5. Tissue-specific properties of HSC/MPP.
5a) Violin-plots showing GEX for MEM-, myeloid- and lymphoid- lineage genes in FBM scRNA-seq progenitors. GEX are log-transformed, normalised and scaled. Abbreviations: HSC/MPP = haematopoietic stem cell/ multipotent progenitor; CMP = common myeloid progenitor; eo/baso/mast pre. = eosinophil/basophil/mast cell precursor.
5b) FDG visualisation of CD34+ FBM/FL/CB CITE-seq cells on gene expression landscape (total k=35,273; FBM n=3, k=8,829, 14-17 PCW; FL n=4, k=18,904, 14-17 PCW; CB n=4, k=7,540, 40-42 PCW). Cell type is represented by colour, as shown in legend. HSC/MPP groups refer to unsupervised sub-clusters of the most immature compartment rather than functional MPP subpopulations. Abbreviations: MEP = megakaryocyte erythroid progenitor; MkP = megakaryocyte progenitor; EryP = erythroid progenitor; EoBasoMC = eosinophil/basophil/mast cell progenitor; MyP = myeloid progenitor; LyP = lymphoid progenitor.
5c) Logistic Regression for intersecting cell states in CD34+ CITE-seq data and FBM scRNA-seq data (see Methods). Prediction probability is indicated by colour scale. Cell type abbreviations as shown in panel a and b legend.
5d) Heatmap showing cell-cycle gene enrichment in CD34+ FBM/FL/CB CITE-seq progenitors. Colour indicates relative enrichment.
5e) Dotplot showing expression of genes used for progenitor characterisation in the CD34+ CITE-seq data. Methods/interpretation as in Fig. 1b.
5f) Dotplot showing expression of proteins used for progenitor characterization in CD34+ CITE-seq data. Methods/interpretation as in Extended Data Fig. 1d (protein expression upper limit of 4).
5g) Bar-graph showing proportion of progenitor subsets out of total progenitors in FL (n=4), FBM (n=3) and CB (n=4) CD34+ CITE-seq data (n= biologically independent samples). Proportions are normalised across donors. Bars indicate mean and error bars SD. Cell-type proportions across tissue were tested using a quasibinomial regression model (subject to one-sided ANOVA; with correction for sort gates; computed at 95% CI and adjusted for multiple testing using Bonferroni correction); *=p< 0.05 (Supplementary Table 38).
5h) Dotplot showing expression of protein markers significantly differentially expressed between HSC/MPP across tissues (FL, FBM, CB) in the CD34+ CITE-seq dataset. Top differentially expressed proteins by log(fold change) are shown for each tissue (Supplementary Table 39; two-sided Wilcoxon rank-sum statistical test with Benjamini-Hochberg procedure for multiple testing correction). Methods/interpretation as in Extended Data Fig. 1d.
Extended Data Figure 6. Tissue-specific properties of HSC/MPP.
6a) Direction of Transition (DoT)-scores computed between CD34+ CITE-seq HSC/MPP1 across tissue (using cross-tissue HSC/MPP1 DEGs as input - see Supplementary Table 40). ABM scRNA-seq was used as reference and the origin point was defined as HSC/MPP (see Methods). Red-coloured cells indicate a shift towards their state (blue colour vice versa).
6b) Sort gates for HSC culture experiments. HSC/MPP, LMPP/MLP and CD34+CD38mid cells were index-sorted for single-cell culture on an MS5 stromal layer, as described in Methods. LMPP/MLP and CD34+CD38mid cells were analysed as ‘committed progenitors’. Abbreviations: LMPP/MLP = lymphoid-primed multipotent progenitor/ multipotent lymphoid progenitor. Figure was created using BioRender.com.
6c) Examples of single-cell HSC culture outputs showing outputs for: i) MK (CD41+), erythroid (CD235a+) and myeloid (CD14+ monocyte and CD15+ neutrophil), ii) NK (CD56+) and myeloid (CD14+ monocyte and CD15+ neutrophil).
6d) Outputs from single-cell culture on MS5 stromal layer for paired FL and FBM HSC/MPPs. Proportion of culture wells producing colonies by cell-type/tissue (assessed by light microscopy under 4x magnification, analysed per plate- k=7 from n=3 biologically independent samples per tissue; lines display mean and error bars SEM). *p=0.011 by 2-sided Mann Whitney test of BM HSC/MPP vs. FL HSC/MPP and ***p=0.0006 BM committed progenitor vs. FL committed progenitor.
6e) Well contents analysed by flow cytometry and number of lineage outputs per well compared between HSC/MPP and committed progenitors from FL vs. FBM. U=colony present but lineage undefinable by this assay. Statistical comparison (binomial test) for unipotential vs. multipotential colonies: HSC/MPP FL vs. FBM *** p=0.0008, 2-sided; committed progenitor FL vs. BM ‘ns’ p=0.27, 2-sided.
6f) Proportion of FL and FBM HSC/MPPs producing myeloid-containing colonies in single-cell culture on MS5 stromal layer (paired FBM and FL from n=2 biologically independent samples). Statistical comparison is of ‘myeloid-only’ vs. ‘myeloid plus other’ in k=77 wells producing myeloid colonies; *** p=0.0001, 2-sided by binomial test. Abbreviations as follows: M = myeloid; E = erythroid; MK = megakaryocyte; NK = natural killer.
Extended Data Figure 7. Perturbed haematopoiesis in Down syndrome.
7a) UMAP of DS FBM scRNA-seq (n=4, k=16,743, 12-13 PCW) (Supplementary Table 20). Abbreviations as in Fig. 1a.
7b) Top 30 PySCENIC-inferred differentially active TFs in DS vs. non-DS FBM scRNA-seq HSC/MPPs, MEMPs and MKs (Supplementary Tables 7, 20). TFs (red) described in text.
7c) Proportions of erythroid lineage cell states in DS (n=4) and age-matched non-DS FBM scRNA-seq data (n=2, where n=biologically independent samples). **** p<10-15, 2-sided, by Chi-squared test. Abbreviations: eryth = erythroid.
7d) Heatmap showing cell-cycle gene enrichment in DS and age-matched non-DS FBM erythroid lineage cell states. Colour indicates relative enrichment.
7e) Representative images from single-cell HSC/MPP methylcellulose cultures, showing relative erythrocyte colony size/structure in DS (top; n=2 biological independent samples; PCW=17, 19; k=246) and non-DS (bottom; n=3 biologically independent samples; PCW=17, 19, 21; k=365) FBM; scale bar; 400µm.
7f) Heatmap of erythropoiesis-implicated genes across Monocle3-inferred erythroid development pseudotime in DS and non-DS FBM scRNA-seq datasets (all genes shown are DEGs across both pseudotime trajectories; one-sided Moran’s I statistical test; Supplementary Tables 32; 41-42). Log-transformed, normalised and scaled GEX (upper limit of 3).
7g) Dotplot showing chromosome 21 TFs differentially expressed in DS and non-DS FBM scRNA-seq datasets (two-sided Wilcoxon rank-sum statistical test with Benjamini-Hochberg procedure for multiple testing correction; adjusted-p-value=<0.05; Supplementary Table 21). Dot-size = average log2 fold-change in DS expression. Colour = log(log(adjusted-p-value)).
7h) Dotplot showing TFs for differentially active regulons in DS vs. non-DS FBM scRNA-seq (see panel b).
7i) Top: Heatmap showing TNF expression in DS and non-DS FBM scRNA-seq cell states. Bottom: TNFα-signalling pathway enrichment (see Methods, Supplementary Table 43). Dot-size = normalised enrichment score (NES) for TNFα-signalling pathway. Line = ±log10(0.25).
7j) Sankey-plot of putative TNF superfamily interactions in DS FBM scRNA-seq (see Methods; Supplementary Table 44). Fold-change expression in DS relative to non-DS (red scale). Combined expression in DS/non-DS (blue scale).
Extended Data Figure 8. Stromal cell heterogeneity in FBM.
8a) UMAP of FBM scRNA-seq stromal cells (k=6,287). Dotted lines indicate broad lineages. Abbreviations: mac = macrophage; Fb = fibroblast; pre. = precursor.
8b) Dotplot showing cell state-defining genes for osteoclasts and macrophages in the FBM scRNA-seq dataset. Methods/interpretation as in Fig. 1b.
8c) Dotplot showing cell state-defining genes for osteochondral-lineage cells in the FBM scRNA-seq dataset. Methods/interpretation as in Fig. 1b.
8d) Barplot showing frequency of stromal cell states in FBM scRNA-seq samples. Samples are grouped into 4 developmental stages to facilitate statistical comparison over gestational stage. P-values resulting from quasibinomial regression model (subject to one-sided ANOVA; with correction for sort gates; computed at 95% CI and adjusted for multiple testing using Bonferroni correction) are shown in parentheses; *p < 0.05, **p < 0.01, ***p < 0.001, ****p < 0.0001; Supplementary Table 19, 45).
8e) Heatmap showing gene enrichment (see Methods) of postnatal mouse BM stromal cell19 signatures in human FBM scRNA-seq stromal cells (coloured as in panel a).
8f) Dotplot showing cell state-defining genes for EC in the FBM scRNA-seq dataset. Methods/interpretation as in Fig. 1b.
8g) Left panel: Violin-plot showing expression of genes with documented role in sinusoidal EC function4in sinusoidal ECs from FBM and FL scRNA-seq datasets. Right panel: Equivalent protein dotplot where marker was present in CD34+ CITE-seq ADT panel. Asterisks indicate DEGs (two-sided Wilcoxon rank-sum statistical test with Benjamini-Hochberg procedure for multiple testing correction; *p<0.05, **p<0.01, ***p<0.001, ****p<0.0001; Supplementary Table 46-47). Methods/interpretation as in Fig. 3a, c (upper limit of 5.5 for protein dotplot).
8h) Heatmap showing expression of mouse BM EC DEGs from Baryawno et al (see Supplementary Methods) in FBM scRNA-seq ECs. GEX values are log-transformed, normalised and scaled (upper limit of 3). Hierarchical clustering for each cell type is shown (see Methods).
8i) Heatmap of differentially enriched inflammatory and cytokine production pathways in DS vs. non-DS FBM scRNA-seq stroma defined by a two-sided Wilcoxon rank-sum test with Benjamini-Hochberg procedure for multiple testing correction; Supplementary Tables 20, 43).
Extended Data Figure 9. Stromal cell heterogeneity in FBM.
9a) Expression of IF microscopy markers in the FBM (total) CITE-seq dataset; genes (left) and their protein equivalent (right). Methods/interpretation as in Extended Data Fig. 1d (upper limits of 3/15 applied for gene/protein expression).
9b) Left: Scatterplot of CD34 and CD117 co-expression in FBM leukocytes by flow cytometry and expression of CLEC9A in gated fractions (representative from n=2). Right: Scatterplots of CD34, CD38 and CD117 protein expression in the FBM (total) CITE-seq dataset (Supplementary Table 48). Values are ln(DSB-normalised) and scaled to a lower limit of 0. Quadrants denote manual ‘gating’ thresholds (see Methods). Kernel density gradient is overlaid.
9c) Longitudinal section of fetal bone stained with hematoxylin and eosin. Left: location of haematopoietic tissue (10x magnification), scale bar; 1mm. Right top: haematopoietic architecture (20x magnification), scale bar; 200µm. Right bottom: identification of morphologically distinct cell types (50x magnification), scale bar; 20µm. Abbreviations: Eryth. = erythroid Neut. = neutrophil lineage; Eo. = eosinophil. Representative from n=4 samples (14-15 PCW).
9d) Longitudinal section of fetal femur with multiplex IF staining. Yellow boxes = regions of interest. Representative image from n=4 samples (14-15 PCW) at 4x magnification. Scale bar; 3mm.
9e) Sections of fetal femur, each stained with a single primary antibody from the multiplex and co-stained with DAPI. Representative fields of view from n=2 samples (14-15 PCW) at 20x magnification. Scale bars; 100µm.
9f) Identification of HSC/MPP and progenitors as cells co-expressing CD34 and CD117 (white arrow): left = all multiplex channels, middle = CD117 only, right = CD34 only. Representative image at 100x magnification. Replicates as per panel g. Scale bars; 50µm.
9g) Scatterplot showing proportions of CD34+ CD117+ HSC/MPP and progenitors per nucleated cells in metaphyseal (M) versus diaphyseal (D) regions of interest. Bars display mean and error bars SD of 522 HSC/MPP locations across 127 regions of interest in n=4 biologically independent FBM samples (14-15 PCW). Difference in frequency of CD34+CD117+ HSC/MPP and progenitors relative to cellular density was assessed by Wald test (p= 0.431) (Supplementary Table 28).
Extended Data Figure 10. Stromal cell heterogeneity in FBM.
10a) Summary of receptor-ligand interactions predicted by CellPhoneDB (see Methods) between FBM stromal ligands and HSC/MPP receptors (Supplementary Table 49). Significant putative receptor-ligands across FBM neighbourhoods are indicated in Venn diagram overlapping regions. Figure was created using BioRender.com.
10b) GEX dotplot for FBM scRNA-seq stromal ligands and HSC/MPP receptors with role in CellPhoneDB-predicted receptor-ligand interactions shown in panel a. Methods/interpretation as shown in Fig. 1b (upper limit of 2 for both dotplots). Colours represent grouping of stromal cell types, as in panel a.
10c) Protein dotplot for CD34+ CITE-seq HSC/MPPs receptors with role in CellPhoneDB-predicted receptor-ligand interactions as per panels a-b. Methods/interpretation as in Extended Data Fig. 1f(upper limit of 1.5).
10d) Summary of receptor-ligand interactions predicted by CellPhoneDB between FBM HSC/MPP ligands and stromal receptors (Supplementary Table 49). Interpretation as detailed in panel a, and cell-type groupings detailed in Methods.
10e) GEX dotplot for FBM scRNA-seq stromal receptors and HSC/MPP ligands with role in CellPhoneDB-predicted receptor-ligand interactions shown in panel d. Methods/interpretation as shown in Fig. 1b (upper limit of 20% was placed on the HSC/MPP dotplot and upper limit of 2 was placed on both dotplots).
Supplementary Material
Acknowledgements
We acknowledge funding from the Wellcome Human Cell Atlas Strategic Science Support (WT211276/Z/18/Z), MRC Human Cell Atlas award and Wellcome Human Developmental Biology Initiative; M.H. is funded by Wellcome (WT107931/Z/15/Z), The Lister Institute for Preventive Medicine and NIHR and Newcastle-Biomedical Research Centre; S.A.T. is funded by Wellcome (WT206194), ERC Consolidator Grant ThDEFINE and EU FET-OPEN MRG-GRAMMAR awards; relevant research in the B.G. group was funded by Wellcome (206328/Z/17/Z) and MRC (MR/M008975/1 and MR/S036113/1); I.R. is funded by Blood Cancer UK and by the NIHR Oxford Biomedical Centre Research Fund; A.R is funded by Wellcome Trust Clinical Research Career Development Fellowship (216632/Z/19/Z) and supported by the NIHR Oxford Biomedical Centre Research Fund; L.J is funded by NIHR Academic Clinical Lectureship; S.W is funded by a Barbour Foundation PhD studentship; M.M. is funded by an Action Medical Research Clinical Fellowship (GN2779). E.L. is funded by a Sir Henry Dale fellowship from Wellcome/Royal Society (107630/Z/15/Z), BBSRC (BB/P002293/1), and core support grants to Wellcome and MRC to the Wellcome-MRC Cambridge Stem Cell Institute (203151/Z/16/Z). This research was funded in part by the Wellcome Trust [see above for grant numbers].
We thank the Newcastle University Flow Cytometry Core Facility, Bioimaging Core Facility, NovoPath, Genomics Facility, NUIT for technical assistance, School of Computing for access to the High-Performance Computing Cluster, CellGenIT, and Alison Farnworth for clinical liaison. We thank CRUK CI Genomics core for processing all Cambridge libraries/sequencing, Kristopher ‘Kit’ Nazor, Bertrand Yeung and Tse Shun Huang (Biolegend) for helpful discussions to optimise the TotalSeq™ panel and protocol. The human embryonic and fetal material was provided by the Joint MRC / Wellcome (MR/R006237/1) HDBR (www.hdbr.org). This publication is part of the Human Cell Atlas - www.humancellatlas.org/publications.
Footnotes
Author Contributions
M.H.; S.A.T; I.R. and B.G. conceived and directed the study. M.H.; S.A.T.; I.R.; B.G.; L.J.; and E.L. designed the experiments and data analysis approach. Samples were isolated by S.L.; R.A.B.; I.G.; J.E.; P.B.; K.A.; S.O.B.; N.E.; libraries prepared by E.P.; and E.S; and sequencing by J.C.; R.Q.; R.H.; and WSI core facility. Flow cytometry and FACS experiments were performed by R.A.B.; L.J. and D.M., supported by D.McD.; and A.F. Cytospins were performed by L.J. and D.D.; and in vitro culture differentiation experiments were performed by L.J.; C.M and D.M. Immunofluorescence microscopy was performed by C.J.; T.N.; R.C.; C.C.;. C.S.;. M.A., with analysis performed by M.M., B.O., C.S.; B.P.; and I.G. M.S.K.; B.L.; O.A.; M.T.; D.D.; T.L.T.; M.S.; O.R-R. and A.R. generated adult and cord blood scRNA-seq datasets. CITE-seq datasets were generated by E.S.; N.M.; and N.K.W. Computational analysis was performed by S.W.; I.G.; M.Q.L.; G.R.; E.D.; I.K.; M.M.; J.B.; M.S.J.; M.E.; and web portals were constructed by I.G.; D.H.; and J.McG., with disease information assembled by K.P. and T.C. M.H.; L.J.; S.W.; I.G. G.R.; B.O.; H.K.; K.B.M.; T.C.; N.M.; N.K.W.; K.B.M.; D.H.; D.M.P.; S.B.; A.R.; E.L.; B.G.; I.R.; and I.G.; and S.A.T. interpreted the data. M.H.; L.J.; S.W.; I.G.; G.R.; B.G.; I.R. and S.A.T. wrote the manuscript, with input from M.L.R.H and J.E.L. All authors read and accepted the manuscript.
Competing Interest statement
S.O.B is now an employee of Becton, Dickinson and Company (BD); S.O.B's contributions to the work were made prior to the commencement of employment at BD. O.R.R. is an employee of Genentech. O.R.R. is a co-inventor on patent applications filed at the Broad related to single cell genomics. All other authors declare no competing interests.
Additional Information statement
For additional information regarding reprints and permissions
Data Availability statement
There are no restrictions on data availability for novel data presented in this study. FASTQ and raw count matrices for DS and non-DS FBM droplet-based scRNA-seq data are deposited at EMBL-EBI ArrayExpress and ENA, with accession codes as follows: E-MTAB-9389 (DS and non-DS FBM), E-MTAB-10042 (DS FBM) and ERP125305 (non-DS FBM). FASTQ and raw count matrices for all other novel data in this study are deposited at EMBL-EBI ArrayExpress and GEO with accession codes E-MTAB-9801 (FBM Smart-seq2 scRNA-seq); E-MTAB-9389 (BCR-/TCR-enriched VDJ FBM scRNA-seq-FASTQs only); GSE166895 (CD34+ FBM, FL and CB CITE-seq) and GSE166895 (FBM total CITE-seq). The following data are also available to download as Scanpy h5ad objects with transformed counts via our interactive webportal: https://fbm.cellatlas.io/: i) DS FBM scRNA-seq, ii) non-DS FBM scRNA-seq, iii) CD34+ FBM, FL and CB CITE-seq, iv) FBM total CITE-seq. All source data are available in the accompanying source data file, unless manuscript or figure legend refers to a Supplementary Table.
External datasets incorporated in this study include: i) Human FL and YS scRNA-seq data4 (EMBL-EBI ArrayExpress accession: E-MTAB-7407); ii) Human blood monocyte-DC scRNA-seq data27 (NCBI GEO accession: GSE94820); iii) Mouse BM scRNA-seq data19 (NCBI GEO accession: GSE122467); iv) Fetal and paediatric thymus scRNA-seq data3 (EMBL-EBI ArrayExpress accession: E-MTAB-8581); v) Adult BM and CB scRNA-seq data from the Human Cell Atlas Data Coordination Portal ‘Census of Immune Cells’ project (https://data.humancellatlas.org/explore/projects/cc95ff89-2e68-4a08-a234-480eca21ce79). At the time of submission, there are no known accessibility restrictions on these external datasets.
Source data for graphs in main and extended figures are provided as excel files. These include Fig. 1c; Fig. 2a,c,e; Fig. 3c,d; Extended Data Fig. 3c; Extended Data Fig. 4b,d,j; Extended Data Fig. 5g; Extended Data Fig. 6d,e,f; Extended Data Fig. 7c; Extended Data Fig. 8d; Extended Data Fig. 9g.
Code Availability statement
Single-cell sequencing data were processed and analysed using publicly available software packages. Python/R code and notebooks for reproducing single-cell analyses are available at https://github.com/haniffalab/FCA_bone_marrow.
References
- 1.O’Byrne S, et al. Discovery of a CD10-negative B-progenitor in human fetal life identifies unique ontogeny-related developmental programs. Blood. 2019;134:1059–1071. doi: 10.1182/blood.2019001289. [DOI] [PubMed] [Google Scholar]
- 2.Charbord P, Tavian M, Humeau L, Péault B. Early ontogeny of the human marrow from long bones: an immunohistochemical study of hematopoiesis and its microenvironment. Blood. 1996;87:4109–4119. [PubMed] [Google Scholar]
- 3.Park J-E, et al. A cell atlas of human thymic development defines T cell repertoire formation. Science. 2020;367 doi: 10.1126/science.aay3224. [DOI] [PMC free article] [PubMed] [Google Scholar]
- 4.Popescu D-M, et al. Decoding human fetal liver haematopoiesis. Nature. 2019;574:365–371. doi: 10.1038/s41586-019-1652-y. [DOI] [PMC free article] [PubMed] [Google Scholar]
- 5.Wiemels JL, et al. Prenatal origin of acute lymphoblastic leukaemia in children. Lancet. 1999;354:1499–1503. doi: 10.1016/s0140-6736(99)09403-9. [DOI] [PubMed] [Google Scholar]
- 6.Muntean AG, Ge Y, Taub JW, Crispino JD. Transcription factor GATA-1 and Down syndrome leukemogenesis. Leuk Lymphoma. 2006;47:986–997. doi: 10.1080/10428190500485810. [DOI] [PubMed] [Google Scholar]
- 7.Roy A, et al. Perturbation of fetal liver hematopoietic stem and progenitor cell development by trisomy 21. Proc Natl Acad Sci U S A. 2012;109:17579–17584. doi: 10.1073/pnas.1211405109. [DOI] [PMC free article] [PubMed] [Google Scholar]
- 8.Olsson A, et al. Single-cell analysis of mixed-lineage states leading to a binary cell fate choice. Experimental Hematology. 2016;44:S24. doi: 10.1038/nature19348. [DOI] [PMC free article] [PubMed] [Google Scholar]
- 9.Dahl R, et al. Regulation of macrophage and neutrophil cell fates by the PU.1:C/EBPalpha ratio and granulocyte colony-stimulating factor. Nat Immunol. 2003;4:1029–1036. doi: 10.1038/ni973. [DOI] [PubMed] [Google Scholar]
- 10.Villani A-C, et al. Single-cell RNA-seq reveals new types of human blood dendritic cells, monocytes, and progenitors. Science. 2017;356 doi: 10.1126/science.aah4573. [DOI] [PMC free article] [PubMed] [Google Scholar]
- 11.Mullighan CG, et al. Genome-wide analysis of genetic alterations in acute lymphoblastic leukaemia. Nature. 2007;446:758–764. doi: 10.1038/nature05690. [DOI] [PubMed] [Google Scholar]
- 12.Summers YJ, Heyworth CM, de Wynter EA, Chang J, Testa NG. Cord blood G(0) CD34+ cells have a thousand-fold higher capacity for generating progenitors in vitro than G(1) CD34+ cells. Stem Cells. 2001;19:505–513. doi: 10.1634/stemcells.19-6-505. [DOI] [PubMed] [Google Scholar]
- 13.Pimanda JE, et al. Gata2, Fli1, and Scl form a recursively wired gene-regulatory circuit during early hematopoietic development. Proc Natl Acad Sci U S A. 2007;104:17692–17697. doi: 10.1073/pnas.0707045104. [DOI] [PMC free article] [PubMed] [Google Scholar]
- 14.Iwasaki H, et al. Distinctive and indispensable roles of PU.1 in maintenance of hematopoietic stem cells and their differentiation. Blood. 2005;106:1590–1600. doi: 10.1182/blood-2005-03-0860. [DOI] [PMC free article] [PubMed] [Google Scholar]
- 15.Palii CG, et al. Single-Cell Proteomics Reveal that Quantitative Changes in Co-expressed Lineage-Specific Transcription Factors Determine Cell Fate. Cell Stem Cell. 2019;24:812–820.:e5. doi: 10.1016/j.stem.2019.02.006. [DOI] [PMC free article] [PubMed] [Google Scholar]
- 16.Muskens IS, et al. The genome-wide impact of trisomy 21 on DNA methylation and its implications for hematopoiesis. Nat Commun. 2021;12:821. doi: 10.1038/s41467-021-21064-z. [DOI] [PMC free article] [PubMed] [Google Scholar]
- 17.Yu S, et al. GABP controls a critical transcription regulatory module that is essential for maintenance and differentiation of hematopoietic stem/progenitor cells. Blood. 2011;117:2166–2178. doi: 10.1182/blood-2010-09-306563. [DOI] [PMC free article] [PubMed] [Google Scholar]
- 18.Sullivan KD, et al. Trisomy 21 causes changes in the circulating proteome indicative of chronic autoinflammation. Sci Rep. 2017;7:1–11. doi: 10.1038/s41598-017-13858-3. [DOI] [PMC free article] [PubMed] [Google Scholar]
- 19.Baccin C, et al. Combined single-cell and spatial transcriptomics reveal the molecular, cellular and spatial bone marrow niche organization. Nat Cell Biol. 2020;22:38–48. doi: 10.1038/s41556-019-0439-6. [DOI] [PMC free article] [PubMed] [Google Scholar]
- 20.Suchting S, et al. The Notch ligand Delta-like 4 negatively regulates endothelial tip cell formation and vessel branching. Proc Natl Acad Sci U S A. 2007;104:3225–3230. doi: 10.1073/pnas.0611177104. [DOI] [PMC free article] [PubMed] [Google Scholar]
- 21.Kusumbe AP, Ramasamy SK, Adams RH. Coupling of angiogenesis and osteogenesis by a specific vessel subtype in bone. Nature. 2014;507:323–328. doi: 10.1038/nature13145. [DOI] [PMC free article] [PubMed] [Google Scholar]
- 22.Itkin T, et al. Distinct bone marrow blood vessels differentially regulate haematopoiesis. Nature. 2016;532:323–328. doi: 10.1038/nature17624. [DOI] [PMC free article] [PubMed] [Google Scholar]
- 23.Long MW, Briddell R, Walter AW, Bruno E, Hoffman R. Human hematopoietic stem cell adherence to cytokines and matrix molecules. Journal of Clinical Investigation. 1992;90:251–255. doi: 10.1172/JCI115844. [DOI] [PMC free article] [PubMed] [Google Scholar]
- 24.Lane WJ, et al. Stromal-derived factor 1–induced megakaryocyte migration and platelet production is dependent on matrix metalloproteinases. Blood. 2000;96:4152–4159. [PubMed] [Google Scholar]
- 25.Schulz-Knappe P, et al. HCC-1, a novel chemokine from human plasma. J Exp Med. 1996;183:295–299. doi: 10.1084/jem.183.1.295. [DOI] [PMC free article] [PubMed] [Google Scholar]
- 26.Butko E, Pouget C, Traver D. Complex regulation of HSC emergence by the Notch signaling pathway. Dev Biol. 2016;409:129–138. doi: 10.1016/j.ydbio.2015.11.008. [DOI] [PMC free article] [PubMed] [Google Scholar]
- 27.Villani A-C, et al. Single-cell RNA-seq reveals new types of human blood dendritic cells, monocytes, and progenitors. Science. 2017;356 doi: 10.1126/science.aah4573. [DOI] [PMC free article] [PubMed] [Google Scholar]
Associated Data
This section collects any data citations, data availability statements, or supplementary materials included in this article.
Supplementary Materials
Data Availability Statement
There are no restrictions on data availability for novel data presented in this study. FASTQ and raw count matrices for DS and non-DS FBM droplet-based scRNA-seq data are deposited at EMBL-EBI ArrayExpress and ENA, with accession codes as follows: E-MTAB-9389 (DS and non-DS FBM), E-MTAB-10042 (DS FBM) and ERP125305 (non-DS FBM). FASTQ and raw count matrices for all other novel data in this study are deposited at EMBL-EBI ArrayExpress and GEO with accession codes E-MTAB-9801 (FBM Smart-seq2 scRNA-seq); E-MTAB-9389 (BCR-/TCR-enriched VDJ FBM scRNA-seq-FASTQs only); GSE166895 (CD34+ FBM, FL and CB CITE-seq) and GSE166895 (FBM total CITE-seq). The following data are also available to download as Scanpy h5ad objects with transformed counts via our interactive webportal: https://fbm.cellatlas.io/: i) DS FBM scRNA-seq, ii) non-DS FBM scRNA-seq, iii) CD34+ FBM, FL and CB CITE-seq, iv) FBM total CITE-seq. All source data are available in the accompanying source data file, unless manuscript or figure legend refers to a Supplementary Table.
External datasets incorporated in this study include: i) Human FL and YS scRNA-seq data4 (EMBL-EBI ArrayExpress accession: E-MTAB-7407); ii) Human blood monocyte-DC scRNA-seq data27 (NCBI GEO accession: GSE94820); iii) Mouse BM scRNA-seq data19 (NCBI GEO accession: GSE122467); iv) Fetal and paediatric thymus scRNA-seq data3 (EMBL-EBI ArrayExpress accession: E-MTAB-8581); v) Adult BM and CB scRNA-seq data from the Human Cell Atlas Data Coordination Portal ‘Census of Immune Cells’ project (https://data.humancellatlas.org/explore/projects/cc95ff89-2e68-4a08-a234-480eca21ce79). At the time of submission, there are no known accessibility restrictions on these external datasets.
Source data for graphs in main and extended figures are provided as excel files. These include Fig. 1c; Fig. 2a,c,e; Fig. 3c,d; Extended Data Fig. 3c; Extended Data Fig. 4b,d,j; Extended Data Fig. 5g; Extended Data Fig. 6d,e,f; Extended Data Fig. 7c; Extended Data Fig. 8d; Extended Data Fig. 9g.
Single-cell sequencing data were processed and analysed using publicly available software packages. Python/R code and notebooks for reproducing single-cell analyses are available at https://github.com/haniffalab/FCA_bone_marrow.


