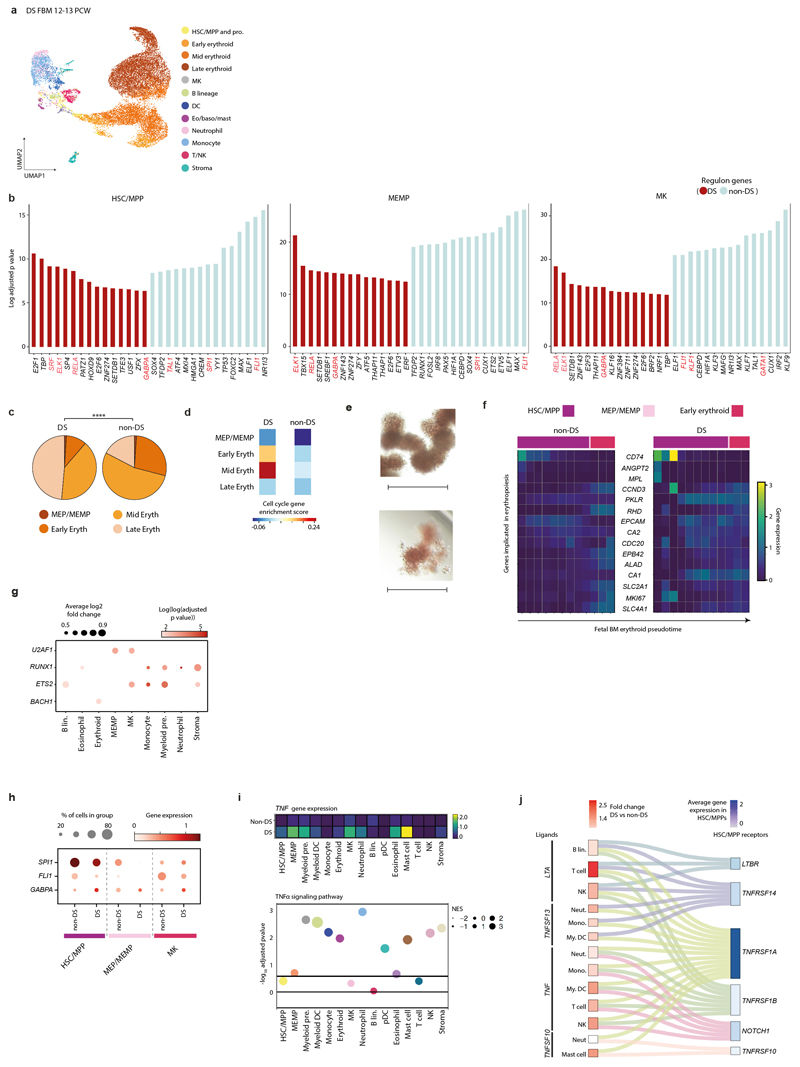
Extended Data Figure 7. Perturbed haematopoiesis in Down syndrome.
7a) UMAP of DS FBM scRNA-seq (n=4, k=16,743, 12-13 PCW) (Supplementary Table 20). Abbreviations as in Fig. 1a.
7b) Top 30 PySCENIC-inferred differentially active TFs in DS vs. non-DS FBM scRNA-seq HSC/MPPs, MEMPs and MKs (Supplementary Tables 7, 20). TFs (red) described in text.
7c) Proportions of erythroid lineage cell states in DS (n=4) and age-matched non-DS FBM scRNA-seq data (n=2, where n=biologically independent samples). **** p<10-15, 2-sided, by Chi-squared test. Abbreviations: eryth = erythroid.
7d) Heatmap showing cell-cycle gene enrichment in DS and age-matched non-DS FBM erythroid lineage cell states. Colour indicates relative enrichment.
7e) Representative images from single-cell HSC/MPP methylcellulose cultures, showing relative erythrocyte colony size/structure in DS (top; n=2 biological independent samples; PCW=17, 19; k=246) and non-DS (bottom; n=3 biologically independent samples; PCW=17, 19, 21; k=365) FBM; scale bar; 400µm.
7f) Heatmap of erythropoiesis-implicated genes across Monocle3-inferred erythroid development pseudotime in DS and non-DS FBM scRNA-seq datasets (all genes shown are DEGs across both pseudotime trajectories; one-sided Moran’s I statistical test; Supplementary Tables 32; 41-42). Log-transformed, normalised and scaled GEX (upper limit of 3).
7g) Dotplot showing chromosome 21 TFs differentially expressed in DS and non-DS FBM scRNA-seq datasets (two-sided Wilcoxon rank-sum statistical test with Benjamini-Hochberg procedure for multiple testing correction; adjusted-p-value=<0.05; Supplementary Table 21). Dot-size = average log2 fold-change in DS expression. Colour = log(log(adjusted-p-value)).
7h) Dotplot showing TFs for differentially active regulons in DS vs. non-DS FBM scRNA-seq (see panel b).
7i) Top: Heatmap showing TNF expression in DS and non-DS FBM scRNA-seq cell states. Bottom: TNFα-signalling pathway enrichment (see Methods, Supplementary Table 43). Dot-size = normalised enrichment score (NES) for TNFα-signalling pathway. Line = ±log10(0.25).
7j) Sankey-plot of putative TNF superfamily interactions in DS FBM scRNA-seq (see Methods; Supplementary Table 44). Fold-change expression in DS relative to non-DS (red scale). Combined expression in DS/non-DS (blue scale).

