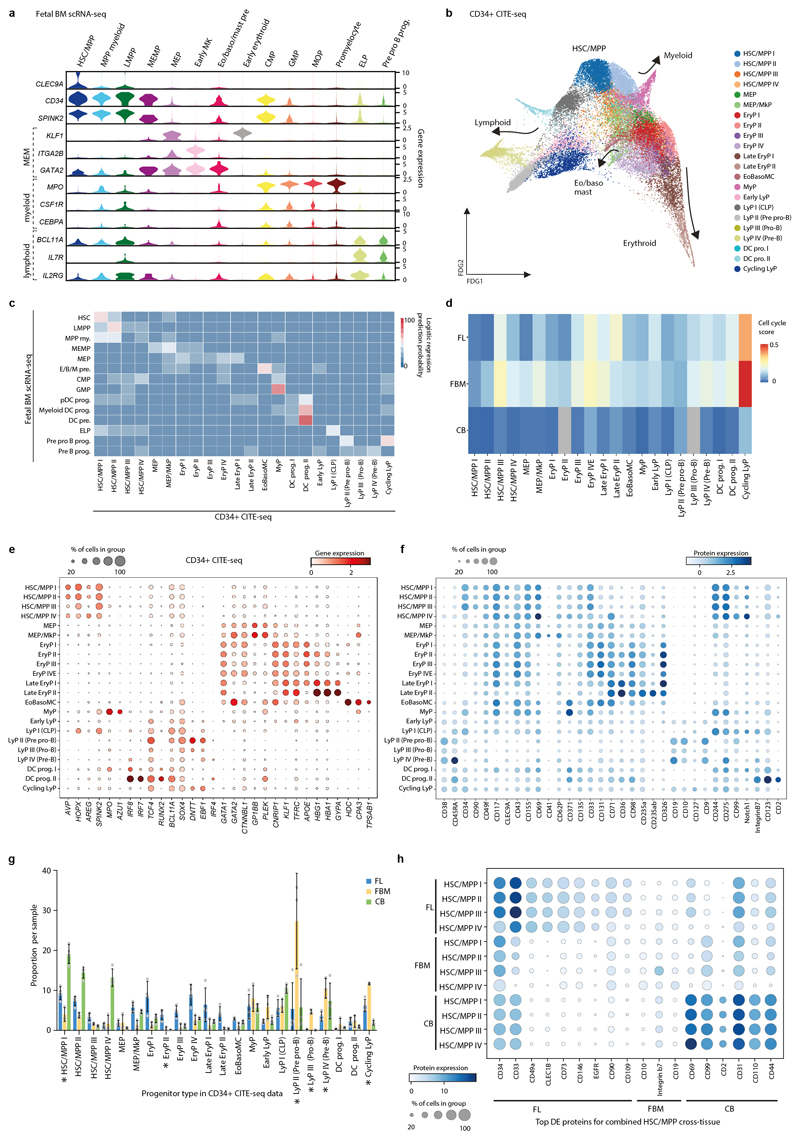
Extended Data Figure 5. Tissue-specific properties of HSC/MPP.
5a) Violin-plots showing GEX for MEM-, myeloid- and lymphoid- lineage genes in FBM scRNA-seq progenitors. GEX are log-transformed, normalised and scaled. Abbreviations: HSC/MPP = haematopoietic stem cell/ multipotent progenitor; CMP = common myeloid progenitor; eo/baso/mast pre. = eosinophil/basophil/mast cell precursor.
5b) FDG visualisation of CD34+ FBM/FL/CB CITE-seq cells on gene expression landscape (total k=35,273; FBM n=3, k=8,829, 14-17 PCW; FL n=4, k=18,904, 14-17 PCW; CB n=4, k=7,540, 40-42 PCW). Cell type is represented by colour, as shown in legend. HSC/MPP groups refer to unsupervised sub-clusters of the most immature compartment rather than functional MPP subpopulations. Abbreviations: MEP = megakaryocyte erythroid progenitor; MkP = megakaryocyte progenitor; EryP = erythroid progenitor; EoBasoMC = eosinophil/basophil/mast cell progenitor; MyP = myeloid progenitor; LyP = lymphoid progenitor.
5c) Logistic Regression for intersecting cell states in CD34+ CITE-seq data and FBM scRNA-seq data (see Methods). Prediction probability is indicated by colour scale. Cell type abbreviations as shown in panel a and b legend.
5d) Heatmap showing cell-cycle gene enrichment in CD34+ FBM/FL/CB CITE-seq progenitors. Colour indicates relative enrichment.
5e) Dotplot showing expression of genes used for progenitor characterisation in the CD34+ CITE-seq data. Methods/interpretation as in Fig. 1b.
5f) Dotplot showing expression of proteins used for progenitor characterization in CD34+ CITE-seq data. Methods/interpretation as in Extended Data Fig. 1d (protein expression upper limit of 4).
5g) Bar-graph showing proportion of progenitor subsets out of total progenitors in FL (n=4), FBM (n=3) and CB (n=4) CD34+ CITE-seq data (n= biologically independent samples). Proportions are normalised across donors. Bars indicate mean and error bars SD. Cell-type proportions across tissue were tested using a quasibinomial regression model (subject to one-sided ANOVA; with correction for sort gates; computed at 95% CI and adjusted for multiple testing using Bonferroni correction); *=p< 0.05 (Supplementary Table 38).
5h) Dotplot showing expression of protein markers significantly differentially expressed between HSC/MPP across tissues (FL, FBM, CB) in the CD34+ CITE-seq dataset. Top differentially expressed proteins by log(fold change) are shown for each tissue (Supplementary Table 39; two-sided Wilcoxon rank-sum statistical test with Benjamini-Hochberg procedure for multiple testing correction). Methods/interpretation as in Extended Data Fig. 1d.

