Abstract
Cryo-electron microscopy (cryo-EM) has the capacity to capture molecular machines in action1–3. ATP-binding cassette (ABC) exporters are highly dynamic membrane proteins that extrude a wide range of substances from the cytosol4–6 and thereby contribute to essential cellular processes, adaptive immunity, and multidrug resistance7,8. Despite their vital importance, the coupling of nucleotide binding, hydrolysis, and release to the conformational dynamics remains poorly resolved, especially for heterodimeric/asymmetric ABC exporters that abound in humans. Here, we present eight high-resolution cryo-EM structures that delineate the full functional cycle of an asymmetric ABC exporter in lipid environment. Cryo-EM analysis under active turnover conditions reveals distinct inward-facing (IF) conformations, one of them with bound peptide substrate, and previously undescribed asymmetric post-hydrolysis states with dimerized nucleotide-binding domains (NBDs) and a closed extracellular gate. Capturing an outward-facing (OF) open conformation requires a slow-down in ATP hydrolysis, indicating the transient nature of this state vulnerable to substrate re-entry. ATP-bound pre-hydrolysis and vanadate-trapped states are conformationally equivalent and both comprise co-existing OF conformations with open and closed extracelluar gates. In contrast, the post-hydrolysis states from the turnover experiment exhibit asymmetric ADP/ATP occlusion after phosphate release from the canonical site and display a progressive separation of the nucleotide-binding domains and unlocking of the intracellular gate. Our findings reveal that phosphate release, not ATP hydrolysis, triggers the return of the exporter to the IF conformation. By mapping the conformational landscape during active turnover, aided by mutational and chemical modulation of kinetic rates to trap the key intermediates, we resolved fundamental and so-far hidden steps of the substrate translocation cycle of asymmetric ABC transporters.
ABC transporters constitute a ubiquitous superfamily of membrane proteins that shuttle a multitude of chemically diverse substrates across cell membranes4–6. In humans, ABC transporters typically act as promiscuous exporters, responsible for many physiological processes, multidrug resistance, and severe diseases, such as cystic fibrosis, hypercholesterolemia, lipid trafficking disorders, and immunodeficiency9. In all ABC transporters, two highly conserved NBDs mechanochemically couple ATP binding and hydrolysis to two transmembrane domains (TMDs) that provide a framework for substrate uptake and release on opposite sides of the membrane4–6. Substrate transport necessitates major conformational changes between IF and OFopen states. Presently available high-resolution data are dominated by snapshots of different homodimeric ABC exporters in a single nucleotide-free IF state, which cannot reveal the highly dynamic nature of individual ABC exporters. Moreover, structural information is especially limited for heterodimeric/asymmetric systems with a canonical (catalytically active) and non-canonical (inactive) ATP-binding site, which are typically found in higher eukaryotes. Major open questions concern the ATP-bound and hydrolysis transition states as well as the mechanochemical events that trigger the large-scale conformational changes during the translocation cycle.
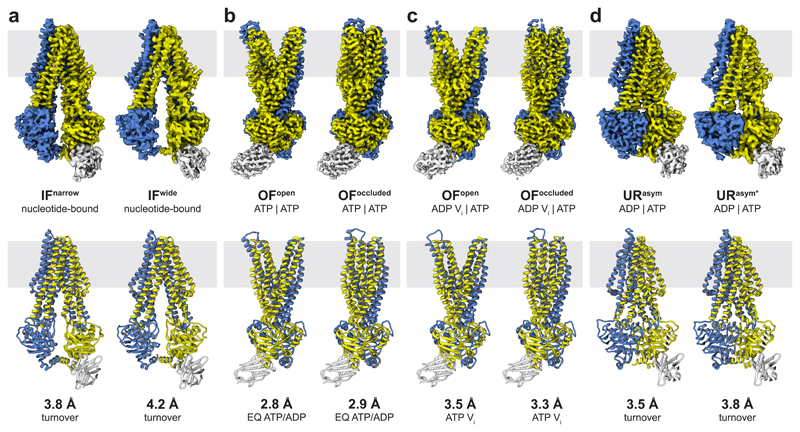
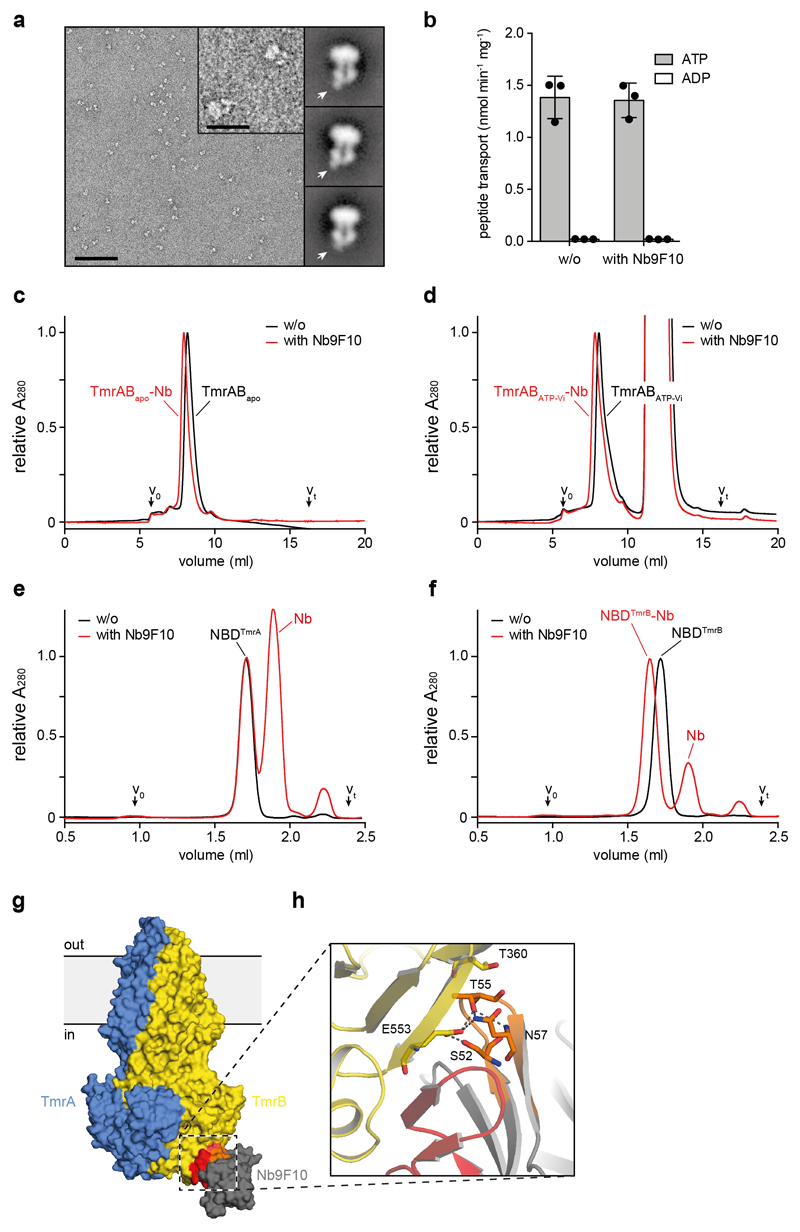
We used cryo-EM to delineate the conformational space of a heterodimeric ABC exporter under turnover conditions (Fig. 1 and Supplementary Video 1 and 2). We examined Thermus thermophilus multidrug resistance proteins A and B (TmrAB) as a model system of human transporter associated with antigen processing (TAP1/2). TmrAB exhibits a broad substrate spectrum and can restore antigen presentation in human TAP-deficient cells10–12. For the turnover experiment (designated TmrABturnover), TmrAB was reconstituted in lipid nanodiscs (Extended Data Fig. 1) and incubated with Mg-ATP and a fluorescent peptide (RRY(CFluorescein)KSTEL, C4F) as substrate. To break the pseudo-twofold symmetry of TmrAB, we selected a high-affinity conformationally non-selective nanobody, which forms a stable complex with the NBD of TmrB without affecting the transport rates (Fig. 1 and Extended Data Fig. 2).
Figure 1. The conformational space of TmrAB.
a, Two distinct IF conformations from TmrABturnover. In IFwide, the intracellular gate has opened by 4.4 Å, allowing access for bulky substrates. Wide and narrow IF conformations were also found in the control datasets and in absence of nucleotides and/or substrate. Densities for nucleotides were observed in all IF conformations in TmrABturnover and TmrAEQBATP-ADP datasets, but not in TmrABapo and TmrABC4F, as no nucleotides were added in the latter cases. b, In the ATP-bound state, the NBDs are tightly dimerized and the exporter exhibits either an OFopen or OFoccluded conformation. The same two OF conformations are observed in both TmrAEQBATP and TmrAEQBATP-ADP datasets (E523Q mutation in TmrA); therefore, only maps from TmrAEQBATP-ADP are shown here due to the higher resolution. c, OFopen and OFoccluded conformations also dominate in the vanadate-trapped state. d, The asymmetric states from TmrABturnover resemble an OFoccluded conformation with a slightly separated NBD interface. In contrast to the OFoccluded conformations of TmrAEQBATP-ADP and TmrABATP-Vi, the intracellular gate is opened by 1.5 Å and 3.0 Å in URasym and URasym*, respectively, while the extracellular gate is tightly sealed. The top and bottom rows show experimental maps and deposited models, respectively. OF densities and models in b and c are rotated by 90° with respect to panel a and d to illustrate the opening of the extracellular gate. TmrA is blue, TmrB yellow, and the nanobody light grey. All structures and morphs between conformers are highlighted in the Supplementary Video 1 and 2.
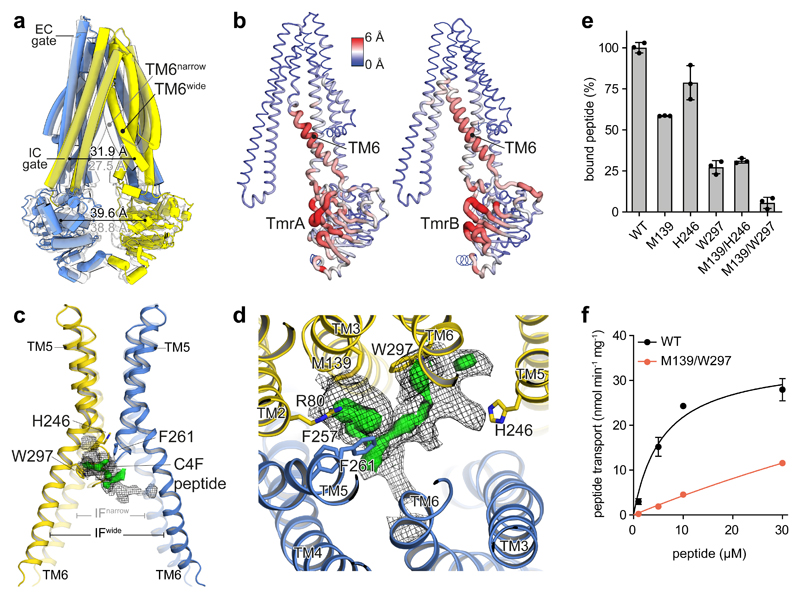
Cryo-EM analysis of TmrABturnover revealed a set of two distinct IF conformations (IFwide and IFnarrow; Fig. 1a) as well as two asymmetric conformations with dimerized NBDs and a tightly sealed extracellular gate (URasym and URasym*; Fig. 1d). Both IF conformations contain two nucleotides, but free ATP/ADP exchange prevents a clear assignment. In IFwide, the intracellular gate widened by 4.4 Å compared to IFnarrow, and the intracellular cavity increased from 4,650 to 5,900 Å3, largely because transmembrane helix six (TM6) moved (Fig. 2a-c; Supplementary Video 2). The NBDs retain their center distance despite a small sliding motion. Molecular dynamics (MD) simulations indicate a dynamic equilibrium between IFnarrow and IFwide, showing two full transitions from IFwide to IFnarrow and transient excursions from IFnarrow towards IFwide (Extended Data Fig. 7d).
Figure 2. Conformational plasticity in IF conformations translates to substrate binding.
a, Superposition of the IFnarrow (grey) and IFwide conformation illustrating the displacement of TM6. In IFwide, the intracellular (IC) gate opens by 4.4 Å, while the inter-NBD distance (center of mass) changes only marginally. TmrA is blue, TmrB yellow. b, The TM6 gatekeeper helix and the NBD interface show highest conformational variability in the IF state. Red color and wide tubes indicate large Cα distances between IFnarrow and IFwide in a backbone superposition, excluding the N-terminal elbow and C-terminal helices. c, Superposition of IFwide and IFnarrow (transparent) and focussed representation of the substrate-binding region of TmrAB highlights the widening of the binding cavity upon displacement of TM6. The helix acts as a gatekeeper for substrate uptake, blocking binding of bulky substrates in the narrow conformation. The calculated difference map (Fobs – Fcalc, green) is overlaid with the experimental density (mesh) at a lower threshold to illustrate the extent of the putative peptide density. d, Focussed top view with cryo-EM density (mesh) and positive difference density (green surface) in the binding site of IFwide (TmrABC4F), as also identified in TmrABturnover, but not in TmrABapo. Nearby residues are depicted as sticks colored by heteroatoms. e, Alanine substitutions in TmrB reduce substrate binding, as analyzed by fluorescence polarization of 50 nM C4F peptide and 2 μM TmrAB. f, Peptide transport kinetics of TmrABWT (black) and double alanine mutant (red) show an additive effect. Binding and transport data represent mean ± SD from three experiments.
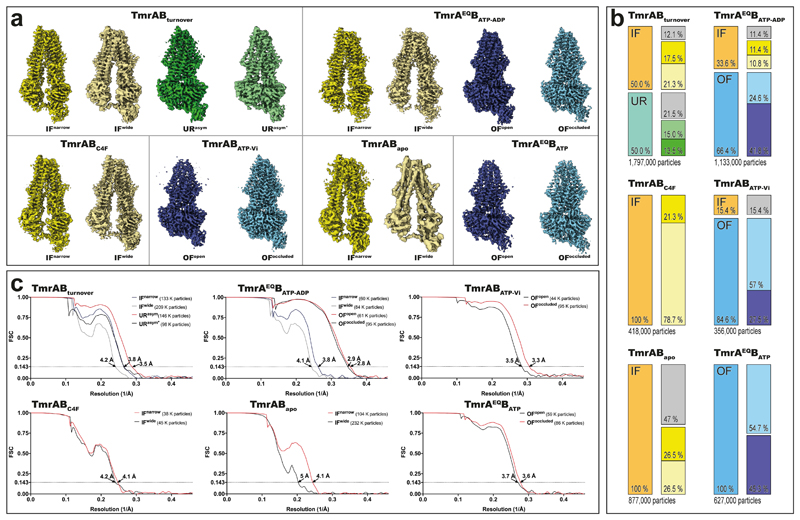
Intriguingly, a weak additional density close to residues M139TmrB and W297TmrB in IFwide indicates the presence of substrate. No such density was found in IFnarrow, where, due to the inward movement of TM6, the smaller volume of the cavity prevents binding of bulky substrates. A prominent extra density was present at the same position in IFwide from an experiment in the absence of ATP and with ten-fold higher C4F concentration (TmrABC4F) compared to TmrABturnover (Fig. 2c,d). The higher substrate concentration increased the population ratio IFwide:IFnarrow from 1:1 to 4:1 (Extended Data Fig. 3b), indicating that peptide binding stabilizes the IFwide conformation. The extra density in the central cavity is framed by the tightly sealed extracellular gate and flanked by hydrophobic and basic residues (F257TmrA, F261TmrA, and R80TmrB) (Fig. 2d). Although almost all transmembrane helices cradle the binding pocket, the bimodal TM6 appears to be the gatekeeper for substrate binding (Fig. 2a,c). We did not model the peptide into the substrate density, as it is not fully defined, perhaps reflecting peptide flexibility, partial occupancy, or multiple binding modes, consistent with the function of multidrug transporters13,14. To verify that this density corresponds to C4F, we performed single-alanine substitutions of M139TmrB and W297TmrB, leading to a strong reduction in substrate binding (Fig. 2e). Replacement of both residues reduced the peptide affinity in binding and transport, indicating an additive effect (Fig. 2e,f). As expected, no density for C4F was present in an apo control experiment (TmrABapo) (Extended Data Fig. 3), while both IF conformations were still found. In summary, this suggests conformation-selective but not conformation-inducing substrate binding.
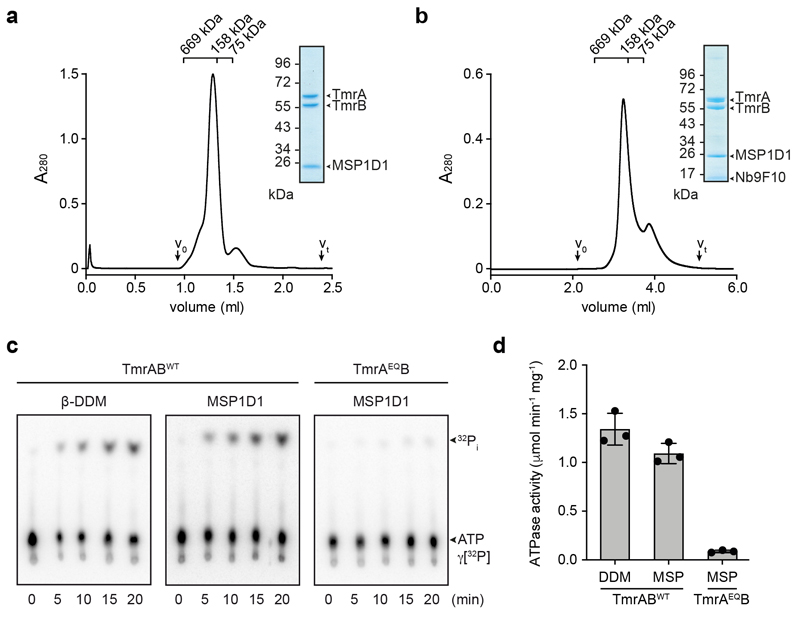
Substrate release requires an OFopen conformation. However, we were unable to resolve this state in TmrABturnover, which indicates that the OFopen conformation must be highly transient, possibly to prevent substrate re-entry at the extracellular gate after release15. We stabilized the OFopen conformation by mutating the catalytic base (E523QTmrA), thereby allowing ATP binding but reducing the rate of ATP hydrolysis (Extended Data Fig. 1c,d) and accordingly increasing the half-life of the exporter in the ATP-bound state upon addition of Mg-ATP (TmrAEQBATP). Remarkably, within the same dataset, we resolved two different OF conformations, OFopen and OFoccluded, both with bound ATP (Fig. 1b and Fig. 3a). OFoccluded is related to the previously reported structure of homodimeric McjD in the presence of the non-hydrolysable ATP-analog AMP-PNP16 (Extended Data Fig. 7), albeit with a significantly smaller cavity for substrate binding (~3,400 Å3) that is insufficient to accomodate bulky peptides. The second conformation displays a wide opening of the TMDs into the extracellular space, resembling the reported structure for homodimeric Sav186617,18 (Fig. 1 and Extended Data Fig. 7), suggesting that binding of two ATP molecules is sufficient to drive the large-scale conformational change from IF to OFopen.
Figure 3. Nucleotide states in the sandwiched NBD dimer and opening of the intracellular gate.
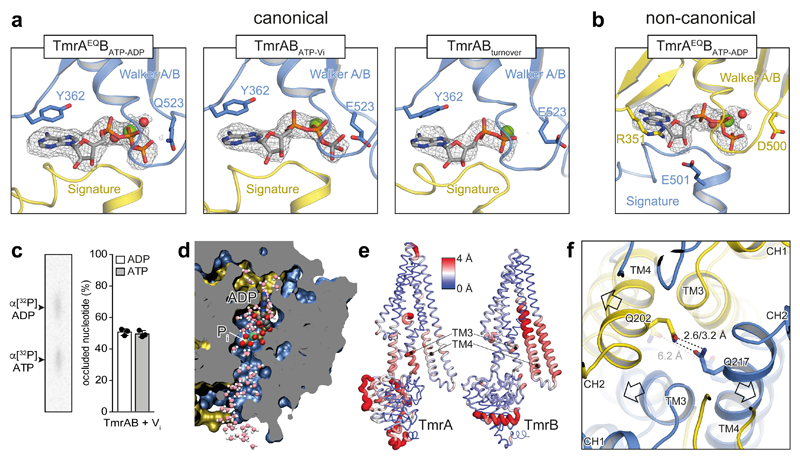
a, Different nucleotide states were observed at the canonical nucleotide-binding site in the conformations with dimerized NBDs from TmrAEQBATP-ADP, TmrABATP-Vi, and TmrABturnover (highest resolution map presented). In all cases, the nucleotide-binding pocket is aligned by the conserved Walker A/B motives and the signature motif. Mg2+ and water molecules are shown as green and red spheres, respectively. TmrA is blue, TmrB yellow. b, The non-canonical site is occupied by ATP in all examples, as hydrolysis cannot proceed. OFopen from TmrAEQBATP-ADP is shown as an example. In the non-canonical site, the sugar moiety of the bound nucleotide interacts with R351TmrB and E501TmrA, while a tyrosine residue (Y362TmrA) makes π-π stacking contacts with the purine base in the canonical site. c, The stoichiometric occlusion of ADP and ATP was validated by thin-layer chromatography upon vanadate-trapping of TmrABWT (mean ± SD from three experiments). d, MD snapshot showing two possible exit pathways for inorganic phosphate (Pi) after hydrolysis in a cut through the NBD dimer. Pi can escape through hydrated channels directed towards the C-terminal helices (bottom) and the coupling helix (top). The OFoccluded conformation of TmrABATP-Vi was simulated with bound ADP and Pi (HPO42–). e, The NBD dimer, TM3, and TM4 show the largest differences between OFoccluded and URasym* conformations. Red color and wide tubes indicate large Cα distances. The distances were averaged over two OFoccluded (from TmrAEQBATP-ADP and TmrABATP-Vi) and the URasym* conformation in a backbone superposition excluding the N-terminal elbow and C-terminal helices. The TM3 and TM4 motions from OF to URasym* progressively separate the intracellular gate. f, After Pi release, the intracellular gate lined by TM4 and TM3 of each subunit is unlocked, forming the asymmetric turnover state URasym*. OFoccluded is transparent.
To explore the effect of nucleotide hydrolysis on the conformation space, we trapped TmrAB by orthovanadate (Vi), mimicking the hydrolysis transition state (TmrABATP-Vi). As for TmrAEQBATP, we observed two populations, representing the OFopen and OFoccluded conformations (Fig. 1c). In both maps, ATP was occluded at the non-canonical site, while the canonical site contained ADP-vanadate (Fig. 3a,b). The simultaneous occlusion of one ATP and one ADP in the Vi-trapped state was further demonstrated by radiotraced [α-32P]ATP (Fig. 3c). We identified possible pathways for inorganic phosphate (Pi) release and Vi entry in MD simulations of OFoccluded with ADP+Pi in the canonical site (see Methods). Two water-filled tunnels connected Pi to the bulk solvent independent of its protonation state (Fig. 3d). The pathway towards the coupling helix has been previously reported19; however, a detailed characterization of the Pi release mechanism requires further studies. Within the same dataset, the organization of the NBDs in OFopen and OFoccluded is identical, indicating that the motion of the extracellular gate is uncoupled from NBDs in the nucleotide-bound state. Furthermore, no significant differences for the individual conformers were observed between the two different TmrABATP-Vi and TmrAEQBATP datasets (Extended Data Table 2), suggesting the equivalence of the ATP-bound and vanadate-trapped states as shown for type I/II ABC importers MalFGK2, BtuC2D2, and human P-gp20–22.
Intriguingly, the two TmrABturnover conformations with dimerized NBDs are markedly different from all other structures. Here, the canonical site is slightly wider and contains ADP, while ATP is still bound at the non-canonical site, demonstrating an asymmetric post-hydrolysis state (Fig. 1d and Fig. 3a). In these new asymmetric unlocked-return conformations (URasym and URasym*), 1.5–3.0 Å motions of TM3 and TM4 unlocked the intracellular gate, indicating a progressive return to the IF conformation (Fig. 3e,f). To exclude that the asymmetric state can be induced through a backward reaction from an IF conformation by simultaneous binding of ATP and ADP, we performed an experiment using an equimolar ratio of ATP and ADP on the TmrAEQB mutant (TmrAEQBATP-ADP). The cryo-EM analysis of this sample resulted in a set of four structures: OFopen and OFoccluded with symmetrical ATP occupancy, as well as IFwide and IFnarrow with bound ADP; however, no URasym was detected. As ATP hydrolysis at the non-canonical site is unlikely10, the observed URasym conformations of TmrABturnover must therefore represent post-ATP-hydrolysis states. This in turn suggests that the trigger to reset the transporter to an IF conformation is Pi release, in analogy to the ATP synthase rotation and SecA-dependent protein translocation23–25. The dilation of the intracellular gate in URasym and URasym* prohibits the opening of the extracellular gate and sets the transporter on path to the IF conformations.
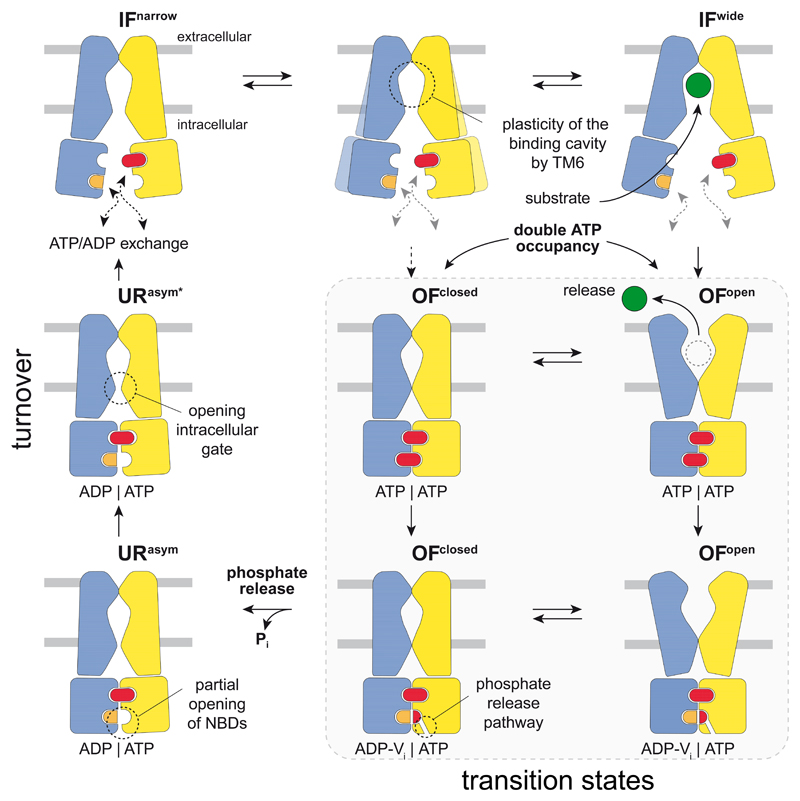
Our eight high-resolution structures reveal the translocation and ATP hydrolysis cycle of a heterodimeric ABC exporter in unprecedented detail (Fig. 4). In the IF state, TM6 acts as a gatekeeper controlling access to the intracellular cavity for conformation-specific substrate uptake. ATP binding to the NBDs and the resulting NBD dimerization allow the extracellular gate to open. In the resulting OF state, the transporter can transition between OFopen and OFoccluded conformations until the release of Pi from the canonical site weakens the NBD interactions. In turn, the intracellular gate unlocks, and the transporter transitions from an OF to an IF conformation via URasym. The high abundance of the asymmetric ADP/ATP-bound URasym state under turnover conditions with excess of ATP suggests that the separation of the sandwiched NBD dimer, which requires dissociation of the ATP-bound non-canonical site, constitutes the rate-limiting step during the translocation cycle. Our cryo-EM approach under turnover conditions extends the mechanistic understanding of heterodimeric ABC export systems and may serve as a general template for the analysis of ABC transporters and other molecular machines.
Figure 4. Translocation cycle of the heterodimeric ABC exporter TmrAB.
TmrAB fluctuates between IFnarrow and IFwide with TM6 acting as gatekeeper, controlling access and volume of the substrate-binding cavity. Therefore, bulky substrates can only bind to the IFwide conformation. Independent of substrate binding and IF conformation, ATP binding to both NBDs induces NBD dimerization, which closes the intracellular gate and allows the extracellular gate t0 open. After substrate release, TmrAB can isomerize between OFopen and OFoccluded conforoations in the ATP-bound state until Pi is discharged from the canonical site. Pi release via a phosphate channel results in an asymmetric URasym conformation and triggers partial opening of the NBDs and the intracellular gate, which advances the exporter towards the IF conformation. Separation of the NBD dimer by dissociation of the ATP-bound non-canonical site represents the rate-limiting step during the cycle. Conceivably, ATP binding can also lead directly to an OFoccluded conformation. In this case bulky substrates cannot be transported, indicating either a futile cycle or one designated for small, amphipathic molecules, that do not require opening of the extracellular gate for transport. TmrA and TmrB are shown in blue and yellow, respectively.
Methods
No statistical methods were used to predetermine sample size. The experiments were not randomized. The investigators were not blinded to allocation during experiments and outcome assessment.
Production and purification of TmrAB
Expression and purification of TmrAB was performed as described10. TmrAB was produced in E. coli BL21(DE3) grown in LB high salt media at 37 °C and induced with 0.5 mM IPTG. Harvested cells, resuspended in lysis buffer (20 mM HEPES-NaOH pH 7.5, 300 mM NaCl, 50 μg/ml lysozyme, 0.2 mM PMSF), were disrupted by sonication and membranes pelleted at 100,000 x g for 45 min at 4 °C. To extract TmrAB, crude membranes were solubilized with 20 mM of β-n-dodecyl β-D-maltoside (β-DDM) in purification buffer (20 mM HEPES-NaOH pH 7.5, 300 mM NaCl, 0.2 mM PMSF). The C-terminally His10-tagged TmrAB was captured using Ni-NTA agarose (Qiagen) for 60 min at 4 °C, followed by size exclusion chromatography (SEC) (TSKgel® G3000SWXL, Tosoh Bioscience LLC) in SEC buffer (20 mM HEPES-NaOH pH 7.5, 150 mM NaCl, 1 mM β-DDM). Peak fractions were pooled for functional and structural studies.
Production and purification of MSP1D1
pMSP1D1 was a gift by Stephen Sligar (Addgene plasmid #20061). Membrane scaffold protein MSP1D1 was expressed and purified as described26. In brief, MSP1D1 was expressed in E. coli BL21(DE3) grown in LB media supplemented with 0.5% glucose at 37 °C. At an OD600 of 1, expression was induced with 1 mM IPTG and cells were grown for 1 h at 37 °C. Subsequently, the temperature was lowered to 28 °C and cells were grown for additional 4 h. Cells were disrupted by sonication in lysis buffer (40 mM Tris-HCl pH 8.0, 300 mM NaCl, 1% Triton X-100). The protein was purified via its N-terminal His7-tag.
Generation and purification of nanobodies
TmrAB-specific nanobodies were generated as described27,28. In brief, one alpaca (Vicugna pacos) was immunized six times with 100 μg of MNG-3-solubilized TmrAB at the Nanobody Service Facility, University of Zurich. Four days after the final antigen boost, peripheral blood lymphocytes were isolated, and their RNA was purified and converted into cDNA by reverse-transcription PCR. The nanobody repertoire was cloned into phage-display vector pDX, a derivative of pMESy429. Nb9F10 was identified after two rounds of biopanning using neutravidin-captured biotinylated TmrAB. E. coli TG1/pDX_Nb9F10 were cultivated in TB medium supplemented with ampicillin. Cells were grown at 37 °C until an OD600 of 1.0 was reached. Temperature was reduced to 25 °C and overnight expression was induced by the addition of 0.5 mM IPTG. Cell pellets were resuspended in 20 mM HEPES-NaOH pH 7.5, 150 mM NaCl, and 1 mM MgCl2, and incubated for 1 h at 4 °C in the presence of 1 mg/ml lysozyme and traces of DNase I before disruption with a Stansted Homogenizer EP (Stansted Fluid Power LTD). The lysate was cleared by centrifugation, and nanobodies were purified by Ni-NTA agarose and SEC (Superdex™ 75 10/300 GL, GE Healthcare).
Reconstitution into MSP1D1 nanodiscs
Purified TmrAB and MSP1D1 were mixed with bovine brain lipid extract (Sigma-Aldrich) solubilized in 20 mM of β-DDM at a TmrAB:MSP1D1:lipid molar ratio of 1:7.5:100 in SEC buffer without detergent. After incubation at RT for 30 min, SM-2 Bio-beads™ (Bio-Rad) were added in two consecutive incubation steps to remove the detergent (1 h, overnight). TmrAB-containing nanodiscs were separated from empty discs by SEC (Superdex™ 200 Increase 3.2/300, GE Healthcare) in SEC buffer without detergent and concentrated to 5 mg/ml at 1,500 x g using Amicon® Ultra-0.5 ml centrifugal filters with a 50 kDa cut-off (Millipore). For EM, a 1.25-fold molar excess of Nb9F10 was added and incubated for 15 min on ice. TmrAB-Nb-complexes were separated from unbound Nb by SEC (KW404-4F, Shodex) in SEC buffer without detergent.
ATPase assay
TmrAB (0.2 μM) in 1 mM of β-DDM or reconstituted into nanodiscs was incubated with 3 mM MgCl2 and 1 mM ATP (supplemented with tracer amounts of [γ-32P]ATP) in SEC buffer with and without detergent, respectively. Release of inorganic phosphate was monitored over a time course of 20 min at 68 °C. Reaction mixtures were analyzed by thin layer chromatography on polyethyleneimine cellulose. Data were presented as mean ± SD (n=3).
Nucleotide occlusion
Bound nucleotides were identified by trapping experiments as described10. In brief, TmrAB (5 μM) was incubated with 3 mM MgCl2, 1 mM ATP (supplemented with tracer amounts of [α-32P]ATP), and 5 mM orthovanadate for 3.5 min at 68 °C. Subsequently, 2 mM ATP were added and incubated for 2 min at RT. Unbound nucleotides were removed by rapid gel filtration (Micro Bio-Spin® 30, Bio-Rad). The identity of bound nucleotides was analyzed by thin layer chromatography on polyethyleneimine cellulose. Data were presented as mean ± SD (n=3).
Substrate binding
Binding of fluorescent substrate was analyzed by fluorescence polarization as described12. In a total volume of 20 μl, TmrAB (2 μM) was added to 50 nM of RRY(CFluorescein)KSTEL (C4F) in SEC buffer. After 15 min incubation at 4 °C, fluorescence polarization was measured using a microplate reader (CLARIOstar®, BMG LABTECH) at λex/em=485/520 nm. Data were presented as mean ± SD (n=3).
Reconstitution and substrate transport
For substrate translocation studies, TmrAB was reconstituted into liposomes composed of E. coli polar lipids/DOPC in a 7:3 ratio (w/w), similar to the previously described protocol12. In brief, SEC-purified, detergent-solubilized TmrAB was added to Triton X-100-destabilized liposomes in a 1:50 (w/w) ratio and incubated for 30 min at 4 °C. For detergent removal, SM-2 Bio beads (Bio-Rad) were added in four consecutive steps. Proteoliposomes were harvested by ultracentrifugation for 30 min at 270,000 x g and resuspended in transport buffer (20 mM HEPES-NaOH pH 7.5, 150 mM NaCl, 5% glycerol) to a final lipid concentration of 5 mg/ml. To analyze ATP-dependent transport, TmrAB-containing proteoliposomes were incubated with 0-30 μM C4F peptide, 1 mM ATP, and 3 mM MgCl2 for 6 min at 68 °C in transport buffer. Transport was stopped by the addition of four volumes of ice-cold stop buffer (1x PBS pH 7.5, 10 mM EDTA) and transferred onto 96-well MultiScreen® microfilter plates (0.65 μm diameter, Millipore) pre-treated with 0.3% (w/v) polyethyleneimine. To remove excess of fluorescent substrate, proteoliposomes were washed twice with 250 μl of ice-cold stop buffer. To disrupt the liposomes, 250 μl of liposome lysis buffer (1x PBS pH 7.5, 1% SDS) were added and incubated for 10 min at RT. To quantify transported substrate, samples were measured using a microplate reader (CLARIOstar®, BMG LABTECH) at λex/em=485/520 nm. Samples without ATP were used as negative control and subtracted as background. Data were measured in triplicates and presented as mean ± SD. For the determination of transport kinetics, data were fitted according to the Michaelis-Menten equation.
Cryo-EM sample preparation and data acquisition
Sample quality was routinely tested by negative-stain EM, using 2% (w/v) uranyl formate solution as previously described30. Negative-stain micrographs were recorded automatically, using Leginon31, on a Tecnai-Spirit transmission electron microscope (Thermo Fisher), operating at 120 kV and equipped with Gatan 4x4K CCD camera at a nominal magnification of 42,000, corresponding to a pixel size of 2.68 Å/pix. For cryo-EM grid preparation, 3 μl of 0.8-1.2 mg/ml TmrAB-Nb or TmrAEQB-Nb complex (with or without nucleotides and substrate) were applied onto freshly glow-discharged Quantifoil grids with gold support (R2/2 or R1.2/1.3) and plunge-frozen in liquid ethane using a Vitrobot Mark IV (Thermo Fisher) with the environmental chamber set to 100% humidity and 4°C. For the turnover experiment, TmrAB-Nb was incubated at 45 °C with 5 mM ATP, 6 mM MgCl2 and 50 μM C4F peptide for 1 min and immediately plunge-frozen. For the TmrAEQBATP experiment, 1 mM of ATP and 3 mM MgCl2 was used and activation at 45 °C was extended to 5 min. The same ATP concentration and incubation time was used in the TmrABATP-Vi experiment with addition of orthovanadate (1 mM). TmrAEQBATP-ADP experiment was carried out in an identical manner with addition of 1 mM ATP and 1 mM ADP. For the TmrAEQBC4F dataset, TmrAEQB was incubated with 500 μM of C4F peptide for 5 min at 20 °C before plunge freezing, while the apo control was obtained by freezing TmrAEQB without any additives. Micrographs (Extended Data Fig. 4) were recorded automatically with EPU, using a Titan Krios microscope (Thermo Fisher), operated at 300 kV, and equipped with a BioQuantum energy filter and a K2 camera (Gatan), at a nominal magnification of 130,000, corresponding to a pixel size of 1.077 Å. Dose-fractionated movies were acquired at an electron flux of 9-9.5 e-/pixel/s over 8 s with 0.2 s exposures per frame (40 frames in total), corresponding to a total electron dose of ~62 e-/Å2. Images were recorded in the defocus range from -0.8 to -2.8 μm. Data collection quality was monitored through Warp32.
Cryo-EM image processing
Frame-based motion correction was performed using the RELION-333 implementation of MotionCor234 with a dose filter of 1.5 or 1.6 e-/Å2/frame. The contrast transfer function (CTF) was estimated from non-dose weighted images, using Gctf35 within RELION-3. Small subsets of images were initially pre-processed in either cisTEM33 or Warp32, following data collection, and obtained particles were subjected to a likelihood based 2D classification to generate templates for automated particle selection in RELION-3. Picked particles were extracted at a box size of 64 pixels with 4.308 Å/pixel and directly subjected to a single round of multi-model 3D classification to eliminate bad picks. The cryo-EM map of TmrAB in IF conformation (EMDB 6085) was used as a starting reference11. Selected maps at 8.6 Å resolution (Nyquist for the binned data) readily revealed multiple conformations (Extended Data Fig. 5, processing workflow). The selected particles from each conformation were re-centered, re-extracted at full pixel size, and subjected to another round of 3D-classification to further clean the stacks. Each conformation was then refined individually. Particles were polished and ctf refined as implemented in RELION-3. To further sort out conformational variability, refined particles were subjected to the next round of 3D classification with no alignment or using local searches. The resulting best classes were then refined and post-processed in RELION-3. In cases, where flexibility was observed, CryoSPARC36 non-uniform refinement provided better resolved final maps. All FSC curves were generated in RELION-3, using unfiltered half maps either from RELION-3 or from CryoSPARC. Local resolution estimation was performed in CryoSPARC for all maps. The quality of all maps is demonstrated in Extended Data Fig. 6. No symmetry was applied at any step of processing. An exemplary processing workflow is provided in Extended Data Fig. 5 and dataset statistics in Extended Data Table 1.
Model building
To build the structural models, we used three initial models: (i) the equilibrated X-ray structure of TmrAB (PDB ID: 5MKK)12 was used for the fitting of the IF maps. (ii) An OFoccluded model obtained by targeted MD to the McjD-like conformation16 (see below). This model was used for the fitting of the OFoccluded maps. (iii) An OFopen model obtained by targeted MD to the Sav1866-like conformation18 (see below). This model was used for the fitting of the OFopen maps. Pairwise sequence alignments of TmrAB with the target models in the respective transporter state (OFoccluded: McjD with PDB ID: 4PL0; OFopen: Sav1866 with PDB ID: 2ONJ) were generated using CLUSTALW37 and applied together with the target structures to build 100 candidate models of TmrAB using Modeller 9v1438. The sequence similarity between Sav1866 and TmrA and TmrB is 55% and 49%, respectively, and between McjD and TmrA and TmrB it is 37% and 40%, respectively. Extended Data Figure 7 illustrates the structural similarities of TmrAB in different states to other ABC transporters, including the homology model targets. The OFoccluded and OFopen models with the respectively highest MODELLER score and best PROCHECK profile were then equilibrated in a membrane and used as target structures for targeted MD simulations using NAMD v2.939. Starting from the IF structure of TmrAB, a bias potential with a force constant of 500 kcal mol-1 Å-2 acting on the Cα RMSD pushed the initial structure toward the target structure. We monitored the intracellular and extracellular gate angles to ensure that the NBDs dimerize first, before the extracellular gate opens, without forming an intermediate structure open to both intracellular and extracellular side. After this 10-ns targeted MD run, two ATP nucleotides and two Mg2+ ions were placed in the nucleotide-binding site and the systems were equilibrated in a 10-ns run with restraints on the Cα positions to relax the lipids and water molecules around the protein. Afterwards, a 50-ns unbiased production MD run was performed for each system. The resulting structures were used as initial models for the cMDFF analysis.
Cascade MD flexible fitting (cMDFF)40 simulations were used for the initial fit, set up with the MDFF plugin v0.4 in VMD1.9.2. The cMDFF simulations were performed in vacuum with a gscale factor of 0.3 describing the strength of the external potential derived from the EM density map. In the cMDFF simulations, the cryo-EM density maps were smoothened by applying Gaussian blurs (half-widths σ = 0.5, 1, …, 5 Å) to obtain a set of theoretical maps with gradually decreasing resolution. First, the models were docked rigidly into the cryo-EM density maps with Situs 2.7.2 (colores module). Afterwards, the initial docked models were fitted to the maps with σ = 5 Å. Then, the resulting adjusted models were flexibly adapted to the next higher-resolution maps in the series, ending with a fit to the unblurred cryo-EM density maps. At each step, 200 ps MDFF simulation was performed followed by 1000 steps of minimization. Restraints were used during the cMDFF simulations to enforce the original secondary structure, chirality, and isomerism. The models obtained from the cMDFF simulations were manually edited in Coot41, refined in Phenix42 using real-space refinement, and validated with built-in functions of Coot, with MolProbity43, and PROCHECK44. The difference density between map and model (Fobs – Fcalc, Phiobs) was calculated with the real_space_diff_map tool of the Phenix software suite. The nucleotide density was extracted with the vop zone command in Chimera using a cutoff distance of 2 Å.
MD simulations
All-atom explicit solvent MD simulation was performed for the lipid-membrane embedded TmrAB structures. The TmrAB structures were embedded in a bilayer containing an equimolar mixture of POPE and POPG lipids45, which are abundant in both, the E. coli expression system and the native T. thermophilus. The IF, OFoccluded, and OFopen systems contained 253PE/253PG, 298PE/298PG and 250PE/252PG lipids, respectively. All systems were hydrated with 150 mM NaCl electrolyte. The modified all-atom CHARMM3646 force field was used for protein, lipids, and ions, together with TIP3P water. The MD trajectories were analyzed with Visual Molecular Dynamics (VMD). All simulations were performed using GROMACS 5.0.647. The starting systems were energy minimized for 5,000 steepest-descent steps, first equilibrated for 500 ps of MD in an NVT ensemble and later for 8 ns in an NPT ensemble under periodic boundary conditions. During equilibration, the restraints on the positions of non-hydrogen protein atoms of initially 4000 kJ·mol−1·nm-2 were gradually released. Particle-mesh Ewald summation with cubic interpolation and a 0.12 nm grid spacing was used to treat long-range electrostatic interactions. The time step was initially 1 fs and then increased to 2 fs. The LINCS algorithm was used to fix all bond lengths. Constant temperature was set initially with a Berendsen thermostat with a coupling constant of 1.0 ps. A semiisotropic Berendsen barostat was used to maintain a pressure of 1 bar. During the production runs, a Nosé-Hoover thermostat and a Parrinello-Rahman barostat replaced the Berendsen thermostat and barostat. Analysis was carried out on the basis of the unconstrained simulations.
IFwide and IFnarrow from TmrABturnover were each simulated at 310 K with ATP/ATP, ADP/ADP, and ADP/ATP in canonical/non-canonical sites (2x500 ns, 2x500 ns, and 2x450 ns, respectively). Hydration has been shown to affect transporter conformational equilibria48–50, yet may relax only slowly on the MD time scale. However, in the IF conformations, rapid water exchange with bulk ensures ready equilibration of the cavity hydration already during the initial equilibration phase, with ~190 and ~140 water molecules in IFwide and IFnarrow, respectively.
To study phosphate release by MD simulation, we replaced the vanadate molecule in the OFoccluded structure from the TmrABATP-Vi dataset by phosphate. We identified possible phosphate release pathways by MD simulation of OFoccluded with vanadate replaced by Pi. We performed simulations at 310 K in three different protonation states: ADP+HPO42– (610 ns), ADP+H2PO4– (400 ns), ADP+H2PO4– +D522TmrA protonated (500 ns). To test for possible force-field dependencies, we also simulated the ADP+H2PO4– and ADP+HPO42– systems with the AMBER99-SB*-ILDN-Q force field (2x500 ns). Pi remained bound during all simulations.
The OFoccluded and OFopen structures from the TmrAEQBATP-ADP and TmrABATP-Vi datasets were simulated at 310 K with ATP in both nucleotide sites (4x500 ns). The two URasym structures from the TmrABturnover dataset were simulated with ADP/ATP in canonical/non-canonical sites, respectively (2x500 ns).
Extended Data
Extended Data Figure 1. Reconstitution of TmrAB in lipid nanodiscs.
a, SEC and SDS-PAGE (Coomassie) illustrating reconstitution of TmrAB in MSP1D1 nanodiscs. Column: Superdex 200 Increase 3.2/300. b, Isolation of TmrAB-MSP-Nb-complex for cryo-EM. Column: Shodex KW404-4F. c, Time course of [γ-32P]ATP hydrolysis of detergent-solubilized and nanodisc-reconstituted TmrABWT and TmrAEQB. d, ATPase activity of detergent-solubilized and nanodisc-embedded TmrAB (background corrected). TmrAEQB displays a drastically decreased ATPase activity in comparison to TmrABWT. The mean ± SD is calculated based on three different data points (time points in Figure 1c).
Extended Data Figure 2. TmrAB-nanobody interaction.
a, Expanded view of a representative negative-stain raw micrograph and 2D class averages of TmrAB-Nb complexes. In the 2D class averages, note the clear density for Nb9F10 bound to the intracellular side of TmrAB. The scale bar is 100 nm in the micrograph and 25 nm in the inset (magnified 4x). b, Peptide transport of TmrAB in proteoliposomes with and without addition of Nb9F10. Proteoliposomes were incubated with Nb9F10 (100 nM) for 15 min on ice and peptide import into proteoliposomes was subsequently followed for 8 min at 45 °C, mean ± SD from three experiments. c and d, Nb9F10 binds the apo (c) and vanadate-trapped (d) TmrAB. Data are normalized to apo TmrAB without Nb. Column: TSKgel G3000SWXL. e and f, Nb9F10 forms a stable complex with NBD of TmrB (f), but not TmrA (e). In order to illustrate stoichiometric binding, data were normalized to the NBDTmrA chromatogram without Nb. Column: Superdex 200 Increase 3.2/300. g, Surface representation of TmrAB and Nb9F10 colored as in Fig. 1. CDR2 and CDR3 are indicated by orange and red, respectively. h, Close-up view of the TmrAB-Nb9F10 interface, colored as in g. Polar interactions include a short β-sheet between the CDR3 loop and a β-strand of the NBD, as well as several residues of CDR2, which are shown as sticks.
Extended Data Figure 3. Cryo-EM densities and conformational distribution from all datasets.
a, Final maps from all datasets. In all cases, at least two conformations were observed, in accordance with the highly dynamic nature of the transporter. b, Particle distribution in each dataset. The first column represents the total amount of particles after two rounds of 3D classification to remove false positives. At this stage, the main OF and IF conformations were already distinguishable (IF particles, orange; OF, blue; UR, teal; also see Extended Data Fig. 5); however, no safe assignment about the sub-conformation could be made. The second column represents the distribution of each specific conformation after further sub-classification. Color code as in a (the two URasym conformations are colored in light and dark green, poor-quality particles in grey). c, FSC curves for all maps in each dataset, along with the number of particles used during the final refinement.
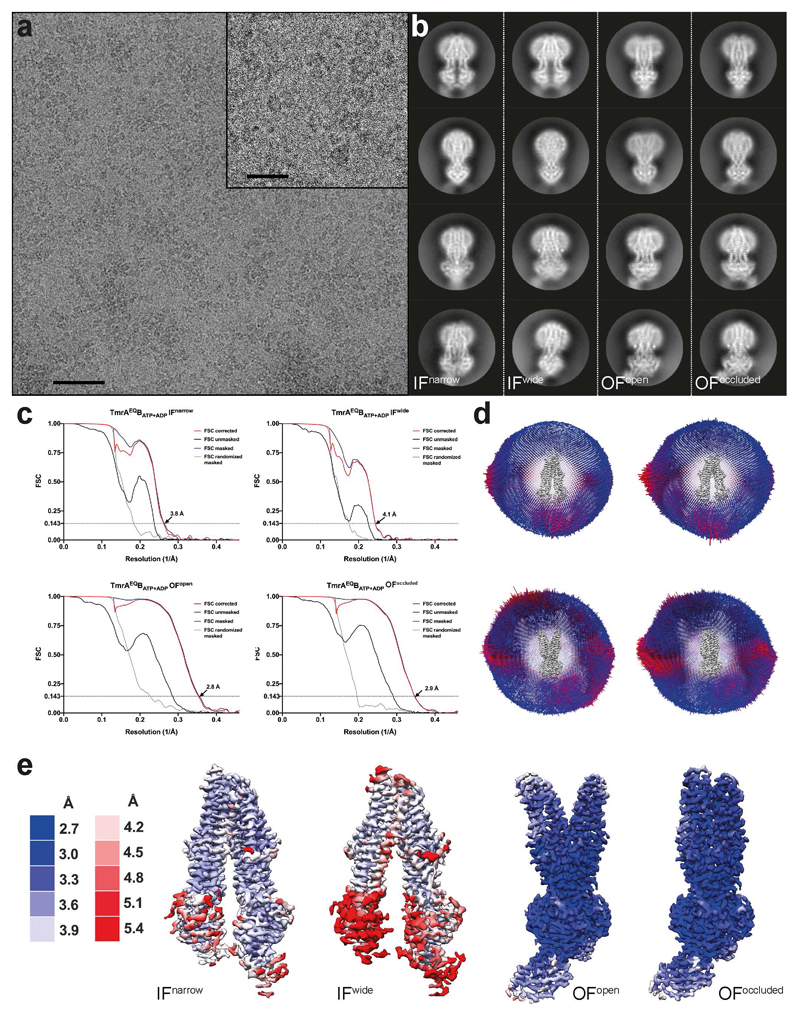
Extended Data Figure 4. Cryo-EM analysis of TmrAEQBATP-ADP.
a, Typical cryo-EM micrograph. Scale bars, 50 nm in the micrograph and 20 nm in the zoom-in. b, Representative 2D class averages for each conformation, observed in the dataset. c, Fourier shell correlation (FSC) curves, generated in RELION-3, for all TmrAEQBATP-ADP maps. d, Angular assignment for each map. The height of individual cylinder bars is proportional to the number of particles in each view. The most frequent views are colored in red. e, Local resolution estimation for the four densities as estimated in CryoSPARC.
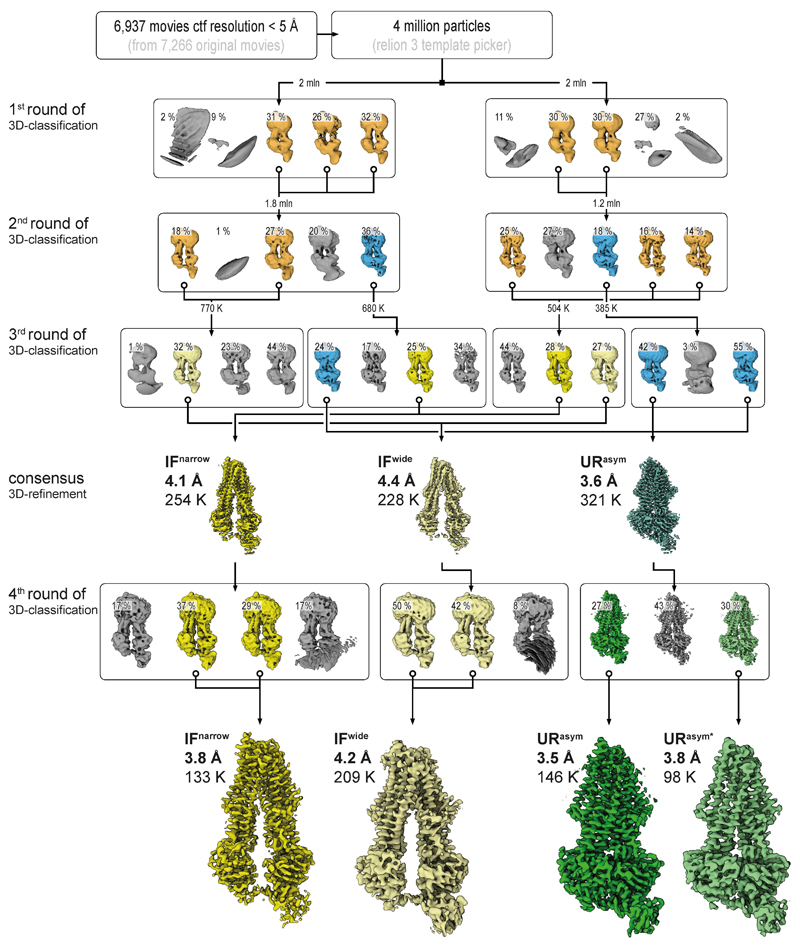
Extended Data Figure 5. Image processing workflow for TmrABturnover.
From 7,266 original motion-corrected movies, 6,937 micrographs, containing signal better than 5 Å (with the majority around 3.5 Å) as estimated by Gctf35, were used in processing. Four million particles were generously auto picked in RELION-3 using 2D templates, extracted at a box size of 64 pixels with 4.3 Å/pixel and directly subjected to multi-model 3D classification to eliminate false positives. To speed up the calculations and overcome large memory demands, the stack was divided into two subsets, containing two million particles each, which were processed in parallel. All maps that reached 8.6 Å resolution (Nyquist for the binned data) were kept (orange) and the corresponding particles were re-centered, re-extracted at full pixel size and subjected to a second round of 3D classification. The selected IF (orange) and URasym (blue) particles were further subclassified. The resulting IFwide, IFnarrow, and URasym particles were pooled and each conformation was refined separately. Particles were polished and ctf refined as implemented in RELION-3, resulting in 4.4 Å, 4.1 Å, and 3.6 Å maps, respectively. Despite the overall high-quality of the obtained densities, visual inspection still revealed significant anisotropy in the resulting volumes. We interpreted this as the result of remaining conformational variance and therefore re-classified the individual stacks to sort out conformational flexibility. To do this, the refined URasym particles were subjected to a fourth round of 3D classification with no alignment, which revealed two different URasym conformations. Both conformations were further refined using non-uniform refinement in CryoSPARC36, resulting in 3.5 Å and 3.8 Å resolution maps for URasym and URasym*, respectively (shown in green). In parallel, IF particles were subjected to heterogenous refinement, followed by non-uniform refinement in CryoSPARC, which further improved the resolution to 3.8 and 4.2 Å for IFnarrow and IFwide, respectively. Color code as in Extended Data Fig. 4. Processing workflows for all other datasets followed the same scheme with only minor modifications at the last steps of 3D classification.
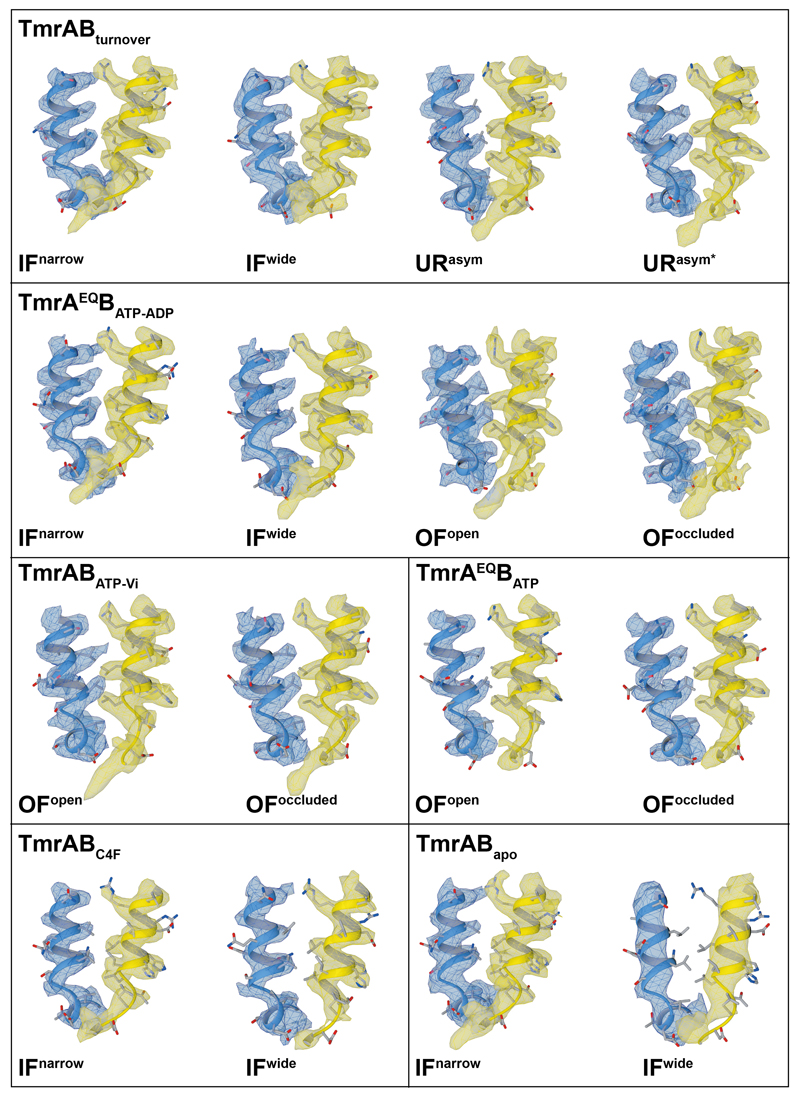
Extended Data Figure 6. Map quality.
To demonstrate the quality of each map, a selected region, spanning residues 213-235 of TmrA and 94-106 of TmrB, was extracted from each corresponding experimental map. All maps display clear side-chain densities, except for the IFwide map of the TmrABapo control, which is also the smallest dataset in size.
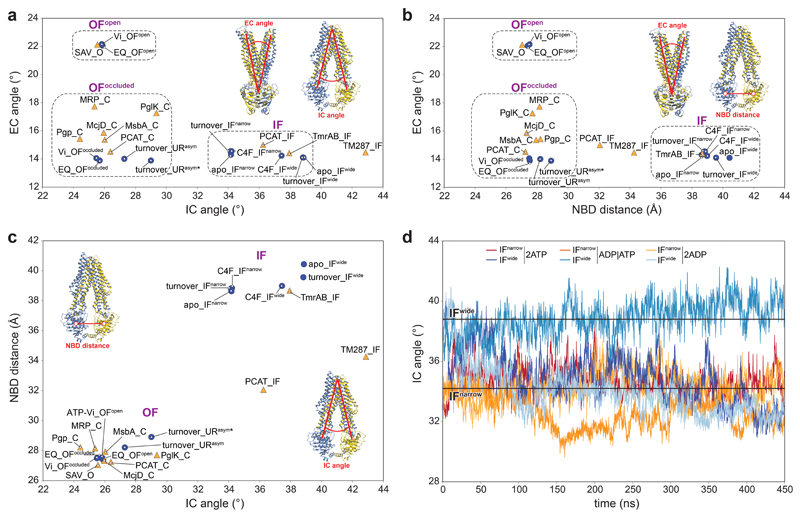
Extended Data Figure 7. Conformation space of type I ABC exporters.
a-c, Conformation space of the EM structures from this study and previously published ABC tranporter structures is shown based on three parameters: the intracellular gate angle (IC angle), the extracellular gate angle (EC angle), and the distance between two nucleotide-binding domains (NBD distance). The EM structures, obtained in this study, are shown as blue circles, and previously published structures as orange triangles. The clustering of structures in three major conformations (IF, OFopen, and OFoccluded) is highlighted by dashed rectangles in a and b. The EM structures, obtained in this study, cover all main conformations. The new URasym conformations have closest resemblance to OFoccluded. The IC angle is defined as the angle between two vectors: vector 1 between the center of mass of the whole extracellular part of the TMD region and the center of mass of the intracellular parts of TM1TmrA, TM2TmrA, TM3TmrA, TM6TmrA, TM4TmrB, and TM5TmrB; and vector 2 between the center of mass of the whole extracellular part of the TMD region and the center of mass of the intracellular parts of TM1TmrB, TM2TmrB, TM3TmrB, TM6TmrB, TM4TmrA, and TM5TmrA. The EC angle is defined as the angle between two vectors: vector 3 between the centers of mass of the NBDs and the extracellular parts TM1TrmA, TM2TrmA, TM3TrmB, TM4TrmB, TM5TrmB, and TM6TrmB; and vector 4 between the center of mass of the NBDs and of the extracellular parts TM1TmrB, TM2TmrB, TM3TmrA, TM4TmrA, TM5TmrA, and TM6TmrA. The NBD distance is defined by the centers of mass of two NBDs (N-terminal loops and C-terminal helices were excluded). IF: IF conformation; O: OFopen conformation; C: OFoccluded conformation; Vi: TmrABATP-Vi; EQ: TmrAEQB. PDB IDs: PCAT: 4RY2 and 4S0F for the IF and OFoccluded conformation, respectively51; McjD: 4PL016; Pgp: 6C0V52; MsbA: 5TTP53; PglK: 5C7354; MRP: 6BHU55; Sav: 2ONJ18; TmrAB: 5MKK12; TM287 (TM287/288): 4Q4A56. d, Time-dependent IC angle in independent MD simulations of IFwide and IFnarrow with ATP/ATP, ADP/ATP, and ADP/ADP in the canonical/non-canonical site, respectively.
Extended Data Table 1. Cryo-EM data collection, refinement and validation statistics.
* Number of particles after two rounds of 3D classification to remove false positives
| Turnover IFnarrow |
Turnover IFwide |
EQ OFopen |
EQ OFoccluded |
ATP-Vi OFopen |
ATP-Vi OFoccluded |
Turnover URasym |
Turnover URasym* |
|
|---|---|---|---|---|---|---|---|---|
| Turnover IFnarrow |
0.00 | 2.78 | 8.00 | 7.08 | 8.08 | 7.13 | 6.82 | 6.48 |
| Turnover IFwide |
2.27 | 0.00 | 7.54 | 6.51 | 7.61 | 6.55 | 6.15 | 5.74 |
| EQ OFopen |
5.85 | 6.33 | 0.00 | 3.71 | 0.71 | 3.65 | 3.72 | 3.98 |
| EQ OFoccluded |
3.83 | 4.39 | 4.61 | 0.00 | 3.79 | 0.64 | 0.82 | 1.32 |
| ATP-Vi OFopen |
5.86 | 6.35 | 0.70 | 4.64 | 0.00 | 3.70 | 3.83 | 4.05 |
| ATP-Vi OFoccluded |
3.88 | 4.44 | 4.54 | 0.64 | 4.57 | 0.00 | 0.92 | 1.42 |
| Turnover URasym |
3.46 | 3.98 | 4.62 | 0.75 | 4.65 | 0.85 | 0.00 | 0.90 |
| Turnover URasym* |
3.04 | 3.53 | 4.78 | 1.18 | 4.80 | 1.25 | 0.78 | 0.00 |
Extended Data Table 2. RMSD of overall structure (blue) and TMD region (orange).
Superposition was performed at backbone level and RMSD was calculated at the Cα level. Nterm elbow and Cterm zipper helices were excluded from the superimposition and RMSD calculation. RMSD values of 0.64 Å and 0.70 Å show that the OFopen and OFoccluded conformations determined from the TmrABATP-Vi and TmrAEQBATP datasets, respectively, are very similar.
| Tm rABturnover IFnarrow (EMD-4773) (PDB 6RAF) |
TmrABturnover IFwide (EMD-4774) (PDB 6RAG) |
TmrABturnover URasym (EMD-4779) (PDB 6RAL) |
TmrABturnover URasym* (EMD-4780) (PDB 6RAM) |
TmrAEQBC4F IFwide (EMD-4781) (PDB 6RAN) |
TmrAEQBATP-ADP OFopen (EMD-4775) (PDB 6RAH) |
TmrAEQBATP-ADP OFoccluded (EMD-4776) (PDB 6RAI) |
TmrABATPvi OFopen (EMD-4777) (PDB 6RAJ) |
TmrABATPvi OFoccluded (EMD-4778) (PDB 6RAK) |
|
|---|---|---|---|---|---|---|---|---|---|
| Data collection and processing | |||||||||
| Microscope | Titan Krios G2 | Titan Krios G2 | Titan Krios G2 | Titan Krios G2 | Titan Krios G2 | Titan Krios G2 | Titan Krios G2 | Titan Krios G2 | Titan Krios G2 |
| Camera | GIF Quantum K2 | GIF Quantum K2 | GIF Quantum K2 | GIF Quantum K2 | GIF Quantum K2 | GIF Quantum K2 | GIF Quantum K2 | GIF Quantum K2 | GIF Quantum K2 |
| Magnification | 130,000 | 130,000 | 130,000 | 130,000 | 130,000 | 130,000 | 130,000 | 130,000 | 130,000 |
| Voltage (kV) | 300 | 300 | 300 | 300 | 300 | 300 | 300 | 300 | 300 |
| Electron exposure (e−/Å2) | 62 | 62 | 62 | 62 | 62 | 64 | 64 | 64 | 64 |
| Defocus range (μm) | -0.8 to -2.8 | -0.8 to -2.8 | -0.8 to -2.8 | -0.8 to -2.8 | -0.8 to -2.8 | -0.8 to -2.8 | -0.8 to -2.8 | -0.5 to -2.5 | -0.5 to -2.5 |
| Pixel size (Å) | 1.077 | 1.077 | 1.077 | 1.077 | 1.077 | 1.077 | 1.077 | 1.077 | 1.077 |
| Symmetry imposed | CI | CI | CI | CI | CI | CI | CI | CI | CI |
| Initial particle images (no.) | 4,043,869 | 4,043,869 | 4,043,869 | 4,043,869 | 2,126,064 | 2,355,206 | 2,355,206 | 1,304,264 | 1,304,264 |
| (2,340,747)* | (2,340,747)* | (2,340,747)* | (2,340,747)* | (418,392)* | (1,420,676)* | (1,420,676)* | (358,656)* | (358,656)* | |
| Final particle images (no.) | 133,527 | 208,674 | 145,913 | 97,763 | 44,733 | 60,950 | 94,621 | 44,051 | 109,080 |
| Map resolution (Å) | 3.8 | 4.2 | 3.5 | 3.8 | 4.2 | 2.8 | 2.9 | 3.5 | 3.3 |
| FSC threshold | 0.143 | 0.143 | 0.143 | 0.143 | 0.143 | 0.143 | 0.143 | 0.143 | 0.143 |
| Map resolution range (Å) | 3.4-6.5 | 3.6-7.8 | 3.0-5.0 | 3.4-6.4 | 3.8-7.1 | 2.7-4.0 | 2.7-4.0 | 3.2-5.5 | 2.9-4.0 |
| Refinement | |||||||||
| Initial model used (PDB code) | 5MKK | 5MKK | 5MKK/4PL0 | 5MKK/4PL0 | 5MKK | 5MKK/2ONJ | 5MKK/4PL0 | 5MKK/2ONJ | 5MKK/4PL0 |
| Model resolution (Å) | 3.8 | 4.2 | 3.5 | 3.8 | 4.2 | 2.8 | 2.9 | 3.5 | 3.3 |
| FSC threshold | 0.143 | 0.143 | 0.143 | 0.143 | 0.143 | 0.143 | 0.143 | 0.143 | 0.143 |
| Map sharpening B factor (Å2) | -110 | -100 | -100 | -106 | -100 | -46 | -54 | -100 | -95 |
| Model composition | |||||||||
| Non-hydrogen atoms | 10174 | 10188 | 10127 | 10186 | 10173 | 10161 | 10191 | 10198 | 10180 |
| Protein residues | 1280 | 1282 | 1275 | 1281 | 1287 | 1278 | 1281 | 1282 | 1280 |
| Nucleotides | 2 | 2 | 2 | 2 | - | 2 | 2 | 2 | 2 |
| Water molecules | - | - | - | - | - | 4 | 6 | - | - |
| B factors (Å2) | |||||||||
| Protein | 81.4 | 112.6 | 58.8 | 110.0 | 107.4 | 73.9 | 55.7 | 72.5 | 41.9 |
| Nucleotides | 99.2 | 150.4 | 56.4 | 113.3 | - | 52.4 | 44.1 | 56.6 | 32.6 |
| Water molecules | - | - | - | - | - | 49.4 | 43.5 | --- | --- |
| R.m.s. deviations | |||||||||
| Bond lengths (Å) | 0.0078 | 0.0096 | 0.0063 | 0.0164 | 0.0167 | 0.0078 | 0.0084 | 0.0079 | 0.0054 |
| Bond angles (°) | 1.55 | 1.38 | 1.15 | 1.94 | 2.08 | 1.53 | 1.35 | 1.08 | 1.02 |
| Validation | |||||||||
| MolProbity score | 1.59 | 1.84 | 1.77 | 1.72 | 1.76 | 1.58 | 1.71 | 1.48 | 1.48 |
| Clashscore | 6.17 | 10.72 | 8.15 | 10.48 | 9.74 | 10.02 | 9.27 | 4.94 | 5.19 |
| Poor rotamers (%) | 0.10 | 0.67 | 0.00 | 0.10 | 0.09 | 0.00 | 0.00 | 0.19 | 0.00 |
| Ramachandran plot | |||||||||
| Favored (%) | 96.23 | 95.85 | 95.35 | 96.94 | 96.25 | 97.72 | 96.63 | 96.55 | 96.78 |
| Outliers (%) | 0.31 | 0.00 | 0.08 | 0.24 | 0.08 | 0.16 | 0.00 | 0.00 | 0.00 |
Supplementary Material
Supplementary Information is available in the online version of the paper.
Acknowledgements
This research was supported by the German Research Foundation (Mo2752/2 to A.M., SFB 807 – Membrane Transport and Communication to E.R.G., G.H., A.M. and R.T., and Cluster of Excellence Frankfurt EXC 115 – Macromolecular Complexes to E.R.G., G.H., A.M. and R.T.). D.J., A.R.M., G.H., and A.M. acknowledge support by the Max Planck Society. R.T. is grateful for the support by an ERC Advanced Grant. We acknowledge W. Kühlbrandt and D. Mills for access to the excellent cryo-EM facility at the MPI of Biophysics funded by the Max Planck Society. We acknowledge K. Holzhüter for creating the nanobody libraries, S. Štefanić from the Nanobody Service Facility (University of Zurich) for alpaca immunization and lymphocyte isolation. We thank all members of the Institute of Biochemistry (Goethe University Frankfurt) and the staff at the Department of Structural Biology (MPI of Biophysics) for discussions and comments on the manuscript.
Footnotes
Data availability. All nine three-dimensional cryo-EM density maps of the heterodimeric/asymmetric ABC transproter TmrAB in nanodiscs have been deposited in the Electron Microscopy Data Bank under accession numbers EMD-4773-81 (see ED Table 1). Atomic coordinates for the atomic models have been deposited in the Protein Data Bank under accession numbers 6RAF, 6RAG, 6RAH, 6RAI, 6RAJ, 6RAK, 6RAL, 6RAM, 6RAN. All other data are available from the corresponding authors upon reasonable request.
Author contributions. S.H. prepared all TmrAB samples and performed nucleotide occlusion, ATP hydrolysis, and transport experiments. S.H. and D.J. performed the negative-stain EM analyses. D.J. and A.M. carried out all cryo-EM imaging and single-particle analyses. A.R.M. and G.H. performed and analyzed the MD simulations. A.R.M. and C.T. built the structural models. B.T.K. and E.G. generated and selected nanobodies, and performed their characterization together with S.B., E.S. and S.H.. S.H. and S.B. generated, purified and characterized all mutants. S.H., D.J., A.R.M., G.H., R.T and A.M. interpreted the data and wrote the manuscript with contributions from all authors. R.T. and A.M. conceived the study, designed the research, and planned the experiments. R.T. initiated, planned, and coordinated the project.
Author information. Reprints and permissions information is available at www.nature.com/reprints.
The authors declare that no competing interests exist.
Readers are welcome to comment on the online version of the paper.
Publisher’s note: Springer Nature remains neutral with regard to jurisdictional claims in published maps and institutional affiliations.
References
- 1.Henderson R. Realizing the potential of electron cryo-microscopy. Q Rev Biophys. 2004;37:3–13. doi: 10.1017/s0033583504003920. [DOI] [PubMed] [Google Scholar]
- 2.Frank J. New opportunities created by single-particle cryo-EM: the mapping of conformational space. Biochemistry. 2018;57:888–888. doi: 10.1021/acs.biochem.8b00064. [DOI] [PMC free article] [PubMed] [Google Scholar]
- 3.Cheng Y. Single-particle cryo-EM-How did it get here and where will it go. Science. 2018;361:876–880. doi: 10.1126/science.aat4346. [DOI] [PMC free article] [PubMed] [Google Scholar]
- 4.Rees DC, Johnson E, Lewinson O. ABC transporters: the power to change. Nat Rev Mol Cell Biol. 2009;10:218–227. doi: 10.1038/nrm2646. [DOI] [PMC free article] [PubMed] [Google Scholar]
- 5.Locher KP. Mechanistic diversity in ATP-binding cassette (ABC) transporters. Nat Struct Mol Biol. 2016;23:487–493. doi: 10.1038/nsmb.3216. [DOI] [PubMed] [Google Scholar]
- 6.Thomas C, Tampé R. Multifaceted structures and mechanisms of ABC transport systems in health and disease. Curr Opin Struct Biol. 2018;51:116–128. doi: 10.1016/j.sbi.2018.03.016. [DOI] [PubMed] [Google Scholar]
- 7.Robey RW, et al. Revisiting the role of ABC transporters in multidrug-resistant cancer. Nat Rev Cancer. 2018;18:452–464. doi: 10.1038/s41568-018-0005-8. [DOI] [PMC free article] [PubMed] [Google Scholar]
- 8.Trowitzsch S, Tampé R. ABC transporters in dynamic macromolecular assemblies. J Mol Biol. 2018;430:4481–4495. doi: 10.1016/j.jmb.2018.07.028. [DOI] [PubMed] [Google Scholar]
- 9.Dean M, Annilo T. Evolution of the ATP-binding cassette (ABC) transporter superfamily in vertebrates. Annu Rev Genomics Hum Genet. 2005;6:123–142. doi: 10.1146/annurev.genom.6.080604.162122. [DOI] [PubMed] [Google Scholar]
- 10.Zutz A, et al. Asymmetric ATP hydrolysis cycle of the heterodimeric multidrug ABC transport complex TmrAB from Thermus thermophilus. J Biol Chem. 2011;286:7104–7115. doi: 10.1074/jbc.M110.201178. [DOI] [PMC free article] [PubMed] [Google Scholar]
- 11.Kim J, et al. Subnanometre-resolution electron cryomicroscopy structure of a heterodimeric ABC exporter. Nature. 2015;517:396–400. doi: 10.1038/nature13872. [DOI] [PMC free article] [PubMed] [Google Scholar]
- 12.Nöll A, et al. Crystal structure and mechanistic basis of a functional homolog of the antigen transporter TAP. Proc Natl Acad Sci U S A. 2017 doi: 10.1073/pnas.1620009114. [DOI] [PMC free article] [PubMed] [Google Scholar]
- 13.Alam A, Kowal J, Broude E, Roninson I, Locher KP. Structural insight into substrate and inhibitor discrimination by human P-glycoprotein. Science. 2019;363:753–756. doi: 10.1126/science.aav7102. [DOI] [PMC free article] [PubMed] [Google Scholar]
- 14.Dey S, Ramachandra M, Pastan I, Gottesman MM, Ambudkar SV. Evidence for two nonidentical drug-interaction sites in the human P-glycoprotein. Proc Natl Acad Sci U S A. 1997;94:10594–10599. doi: 10.1073/pnas.94.20.10594. [DOI] [PMC free article] [PubMed] [Google Scholar]
- 15.Grossmann N, et al. Mechanistic determinants of the directionality and energetics of active export by a heterodimeric ABC transporter. Nat Commun. 2014;5:5419. doi: 10.1038/ncomms6419. [DOI] [PMC free article] [PubMed] [Google Scholar]
- 16.Choudhury HG, et al. Structure of an antibacterial peptide ATP-binding cassette transporter in a novel outward occluded state. Proc Natl Acad Sci U S A. 2014;111:9145–9150. doi: 10.1073/pnas.1320506111. [DOI] [PMC free article] [PubMed] [Google Scholar]
- 17.Dawson RJ, Locher KP. Structure of a bacterial multidrug ABC transporter. Nature. 2006;443:180–185. doi: 10.1038/nature05155. [DOI] [PubMed] [Google Scholar]
- 18.Dawson RJ, Locher KP. Structure of the multidrug ABC transporter Sav1866 from Staphylococcus aureus in complex with AMP-PNP. FEBS Lett. 2007;581:935–938. doi: 10.1016/j.febslet.2007.01.073. [DOI] [PubMed] [Google Scholar]
- 19.Zaitseva J, et al. A structural analysis of asymmetry required for catalytic activity of an ABC-ATPase domain dimer. EMBO J. 2006;25:3432–3443. doi: 10.1038/sj.emboj.7601208. [DOI] [PMC free article] [PubMed] [Google Scholar]
- 20.Oldham ML, Chen J. Snapshots of the maltose transporter during ATP hydrolysis. Proc Natl Acad Sci U S A. 2011;108:15152–15156. doi: 10.1073/pnas.1108858108. [DOI] [PMC free article] [PubMed] [Google Scholar]
- 21.Yang M, et al. Single-molecule probing of the conformational homogeneity of the ABC transporter BtuCD. Nat Chem Biol. 2018;14:715–722. doi: 10.1038/s41589-018-0088-2. [DOI] [PubMed] [Google Scholar]
- 22.Verhalen B, et al. Energy transduction and alternating access of the mammalian ABC transporter P-glycoprotein. Nature. 2017;543:738–741. doi: 10.1038/nature21414. [DOI] [PMC free article] [PubMed] [Google Scholar]
- 23.Watanabe R, Iino R, Noji H. Phosphate release in F1-ATPase catalytic cycle follows ADP release. Nat Chem Biol. 2010;6:814–820. doi: 10.1038/nchembio.443. [DOI] [PubMed] [Google Scholar]
- 24.Okazaki K, Hummer G. Phosphate release coupled to rotary motion of F1-ATPase. Proc Natl Acad Sci U S A. 2013;110:16468–16473. doi: 10.1073/pnas.1305497110. [DOI] [PMC free article] [PubMed] [Google Scholar]
- 25.Catipovic MA, Bauer BW, Loparo JJ, Rapoport TA. Protein translocation by the SecA ATPase occurs by a power-stroke mechanism. EMBO J. 2019;38 doi: 10.15252/embj.2018101140. [DOI] [PMC free article] [PubMed] [Google Scholar]
- 26.Roos C, et al. Characterization of co-translationally formed nanodisc complexes with small multidrug transporters, proteorhodopsin and with the E. coli MraY translocase. Biochim Biophys Acta. 2012;1818:3098–3106. doi: 10.1016/j.bbamem.2012.08.007. [DOI] [PubMed] [Google Scholar]
- 27.Ehrnstorfer IA, Geertsma ER, Pardon E, Steyaert J, Dutzler R. Crystal structure of a SLC11 (NRAMP) transporter reveals the basis for transition-metal ion transport. Nat Struct Mol Biol. 2014;21:990–996. doi: 10.1038/nsmb.2904. [DOI] [PubMed] [Google Scholar]
- 28.Pardon E, et al. A general protocol for the generation of Nanobodies for structural biology. Nat Protoc. 2014;9:674–693. doi: 10.1038/nprot.2014.039. [DOI] [PMC free article] [PubMed] [Google Scholar]
- 29.Zimmermann I, et al. Synthetic single domain antibodies for the conformational trapping of membrane proteins. Elife. 2018;7 doi: 10.7554/eLife.34317. [DOI] [PMC free article] [PubMed] [Google Scholar]
- 30.Gewering T, Januliene D, Ries AB, Moeller A. Know your detergents: A case study on detergent background in negative stain electron microscopy. J Struct Biol. 2018;203:242–246. doi: 10.1016/j.jsb.2018.05.008. [DOI] [PubMed] [Google Scholar]
- 31.Suloway C, et al. Automated molecular microscopy: the new Leginon system. J Struct Biol. 2005;151:41–60. doi: 10.1016/j.jsb.2005.03.010. [DOI] [PubMed] [Google Scholar]
- 32.Tegunov D, Cramer P. Real-time cryo-EM data pre-processing with Warp. bioRxiv. 2018 [Google Scholar]
- 33.Zivanov J, et al. New tools for automated high-resolution cryo-EM structure determination in RELION-3. Elife. 2018;7 doi: 10.7554/eLife.42166. [DOI] [PMC free article] [PubMed] [Google Scholar]
- 34.Zheng SQ, et al. MotionCor2: anisotropic correction of beam-induced motion for improved cryo-electron microscopy. Nat Methods. 2017;14:331–332. doi: 10.1038/nmeth.4193. [DOI] [PMC free article] [PubMed] [Google Scholar]
- 35.Zhang K. Gctf: Real-time CTF determination and correction. J Struct Biol. 2016;193:1–12. doi: 10.1016/j.jsb.2015.11.003. [DOI] [PMC free article] [PubMed] [Google Scholar]
- 36.Punjani A, Rubinstein JL, Fleet DJ, Brubaker MA. cryoSPARC: algorithms for rapid unsupervised cryo-EM structure determination. Nat Methods. 2017;14:290–296. doi: 10.1038/nmeth.4169. [DOI] [PubMed] [Google Scholar]
- 37.Larkin MA, et al. Clustal W and Clustal X version 2.0. Bioinformatics. 2007;23:2947–2948. doi: 10.1093/bioinformatics/btm404. [DOI] [PubMed] [Google Scholar]
- 38.Sali A, Blundell TL. Comparative protein modelling by satisfaction of spatial restraints. J Mol Biol. 1993;234:779–815. doi: 10.1006/jmbi.1993.1626. [DOI] [PubMed] [Google Scholar]
- 39.Phillips JC, et al. Scalable molecular dynamics with NAMD. J Comput Chem. 2005;26:1781–1802. doi: 10.1002/jcc.20289. [DOI] [PMC free article] [PubMed] [Google Scholar]
- 40.Singharoy A, et al. Molecular dynamics-based refinement and validation for sub-5 A cryo-electron microscopy maps. Elife. 2016;5 doi: 10.7554/eLife.16105. [DOI] [PMC free article] [PubMed] [Google Scholar]
- 41.Emsley P, Lohkamp B, Scott WG, Cowtan K. Features and development of Coot. Acta Crystallogr D Biol Crystallogr. 2010;66:486–501. doi: 10.1107/S0907444910007493. [DOI] [PMC free article] [PubMed] [Google Scholar]
- 42.Adams PD, et al. PHENIX: a comprehensive Python-based system for macromolecular structure solution. Acta Crystallogr D Biol Crystallogr. 2010;66:213–221. doi: 10.1107/S0907444909052925. [DOI] [PMC free article] [PubMed] [Google Scholar]
- 43.Chen VB, et al. MolProbity: all-atom structure validation for macromolecular crystallography. Acta Crystallogr D Biol Crystallogr. 2010;66:12–21. doi: 10.1107/S0907444909042073. [DOI] [PMC free article] [PubMed] [Google Scholar]
- 44.Laskowski RA, MacArthur MW, Moss DS, Thronton JM. PROCHECK: a program to check the stereochemical quality of protein structures. J Appl Crystallogr. 1993;26:283–291. [Google Scholar]
- 45.Wu EL, et al. CHARMM-GUI Membrane Builder toward realistic biological membrane simulations. J Comput Chem. 2014;35:1997–2004. doi: 10.1002/jcc.23702. [DOI] [PMC free article] [PubMed] [Google Scholar]
- 46.Best RB, et al. Optimization of the additive CHARMM all-atom protein force field targeting improved sampling of the backbone phi, psi and side-chain chi(1) and chi(2) dihedral angles. J Chem Theory Comput. 2012;8:3257–3273. doi: 10.1021/ct300400x. [DOI] [PMC free article] [PubMed] [Google Scholar]
- 47.Abraham MJ, et al. GROMACS: High performance molecular simulations through multi-level parallelism from laptops to supercomputers. SoftwareX. 2015;1:19–25. [Google Scholar]
- 48.Han W, Cheng RC, Maduke MC, Tajkhorshid E. Water access points and hydration pathways in CLC H+/Cl- transporters. Proc Natl Acad Sci U S A. 2014;111:1819–1824. doi: 10.1073/pnas.1317890111. [DOI] [PMC free article] [PubMed] [Google Scholar]
- 49.Khelashvili G, et al. Conformational dynamics on the extracellular side of LeuT controlled by Na+ and K+ ions and the protonation state of Glu290. J Biol Chem. 2016;291:19786–19799. doi: 10.1074/jbc.M116.731455. [DOI] [PMC free article] [PubMed] [Google Scholar]
- 50.Zhao C, Noskov SY. The role of local hydration and hydrogen-bonding dynamics in ion and solute release from ion-coupled secondary transporters. Biochemistry. 2011;50:1848–1856. doi: 10.1021/bi101454f. [DOI] [PubMed] [Google Scholar]
- 51.Lin DY, Huang S, Chen J. Crystal structures of a polypeptide processing and secretion transporter. Nature. 2015;523:425–430. doi: 10.1038/nature14623. [DOI] [PubMed] [Google Scholar]
- 52.Kim Y, Chen J. Molecular structure of human P-glycoprotein in the ATP-bound, outward-facing conformation. Science. 2018;359:915–919. doi: 10.1126/science.aar7389. [DOI] [PubMed] [Google Scholar]
- 53.Mi W, et al. Structural basis of MsbA-mediated lipopolysaccharide transport. Nature. 2017;549:233–237. doi: 10.1038/nature23649. [DOI] [PMC free article] [PubMed] [Google Scholar]
- 54.Perez C, et al. Structure and mechanism of an active lipid-linked oligosaccharide flippase. Nature. 2015;524:433–438. doi: 10.1038/nature14953. [DOI] [PubMed] [Google Scholar]
- 55.Johnson ZL, Chen J. ATP binding enables substrate release from multidrug resistance protein 1. Cell. 2018;172:81–89 e10. doi: 10.1016/j.cell.2017.12.005. [DOI] [PubMed] [Google Scholar]
- 56.Hohl M, et al. Structural basis for allosteric cross-talk between the asymmetric nucleotide binding sites of a heterodimeric ABC exporter. Proc Natl Acad Sci U S A. 2014;111:11025–11030. doi: 10.1073/pnas.1400485111. [DOI] [PMC free article] [PubMed] [Google Scholar]
Associated Data
This section collects any data citations, data availability statements, or supplementary materials included in this article.


