Abstract
Multiple myeloma (MM) is a neoplastic plasma-cell disorder characterized by clonal proliferation of malignant plasma cells. Despite extensive research, disease heterogeneity within and between treatment-resistant patients is poorly characterized. In the present study, we conduct a prospective, multicenter, single-arm clinical trial (NCT04065789), combined with longitudinal single-cell RNA-sequencing (scRNA-seq) to study the molecular dynamics of MM resistance mechanisms. Newly diagnosed MM patients (41), who either failed to respond or experienced early relapse after a bortezomib-containing induction regimen, were enrolled to evaluate the safety and efficacy of a daratumumab, carfilzomib, lenalidomide and dexamethasone combination. The primary clinical endpoint was safety and tolerability. Secondary endpoints included overall response rate, progression-free survival and overall survival. Treatment was safe and well tolerated; deep and durable responses were achieved. In prespecified exploratory analyses, comparison of 41 primary refractory and early relapsed patients, with 11 healthy subjects and 15 newly diagnosed MM patients, revealed new MM molecular pathways of resistance, including hypoxia tolerance, protein folding and mitochondria respiration, which generalized to larger clinical cohorts (CoMMpass). We found peptidylprolyl isomerase A (PPIA), a central enzyme in the protein-folding response pathway, as a potential new target for resistant MM. CRISPR-Cas9 deletion of PPIA or inhibition of PPIA with a small molecule inhibitor (ciclosporin) significantly sensitizes MM tumor cells to proteasome inhibitors. Together, our study defines a roadmap for integrating scRNA-seq in clinical trials, identifies a signature of highly resistant MM patients and discovers PPIA as a potent therapeutic target for these tumors.
MM is a plasma-cell malignancy, characterized by expansion of malignant plasma cells (PCs) in the bone marrow (BM), leading to destruction of the function of major organs1,2. MM remains an incurable malignancy, with most patients relapsing and dying from the disease3. Introduction of novel anti-myeloma drugs and combinations has considerably improved prognosis in myeloma4,5. Despite these advances, primary treatment resistance6,7, as well as early relapse after upfront therapy8–10, are strongly associated with poor outcomes and reduced survival. These patients with ‘induction failure’, primary refractory MM (PRMM) patients, are typically under-represented in clinical trials and no evidence-based treatment strategy for their management has been established11. These patients comprise a highly unmet need for MM therapies. Trials comparing the heterogeneity and druggable pathways relevant for these patients could drive toward discovery of new agents in relapsed/refractory myeloma, and thus are urgently needed.
Ultimately, all malignant PCs acquire resistance or escape mechanisms, avoiding even the most advanced treatments12–15. PCs and malignant PCs secrete high levels of immunoglobulins, activating the endoplasmic reticulum (ER) and unfolded protein-stress response (UPR) pathways. MM resistance is associated with perturbation of several genes and proteins in the ER, UPR, protein homeostasis and proteasome pathways16–20. These studies, therefore, lend support to a therapeutic approach involving the combination of proteasome inhibitors (PIs) with an ER stress-inducing agent to enhance the effectiveness of proteasome inhibition and overcome PI resistance. The mechanisms of PC resistance pre- and post-treatment have been only partly resolved. Current technologies for characterizing MM lack the depth, resolution and accuracy needed to molecularly define the malignant cells and pathways driving MM residual disease progression, resistance and relapse21,22. The progressive and constantly evolving nature of the tumor cells and the microenvironment makes it essential to develop new tools for risk stratification and accurate prediction of patient therapeutic response, which may substantially improve therapeutic management. Thus, new treatment strategies and molecular biomarkers for more successful patient stratification and effective clinical care are needed.
Single-cell technologies are extending our ability to define the complete cellular and molecular makeup of patients, enabling detailed characterization of the tumor cells and their microenvironments22–25. These studies demonstrate the potential of applying single-cell sequencing to clinically defined patients’ cohorts for identifying biomarkers for diagnosis and stratification, and potential new pathways and targets for therapy. In the present study, we report a comprehensive scRNA-seq analysis of a prospective clinical trial of PRMM patients treated with a combined regimen, including daratumumab, carfilzomib, lenalidomide and dexamethasone (DARA−KRD)—the KYDAR study. Newly diagnosed PRMM patients (41), who either failed to respond or experienced early relapse after a bortezomib-containing induction regimen, were enrolled to receive a quadruple regimen of DARA-KRD. Treatment was safe and well tolerated; deep and durable responses were achieved with an overall response rate (ORR) of 88%. Analysis of the newly diagnosed MM (NDMM) patients compared with the PRMM group highlighted major gene signatures that are differentially expressed between the groups. These signatures designate several pathways that are perturbed in the relapsed refractory patients, including hypoxia adaptation, protein folding and mitochondrial respiration. Using the CoMMpass database, we validated that our signature defines a prognostic signature for MM progression with a very high clinical predictive value, which outperforms currently established risk predictors. Furthermore, this high-risk signature progressively increased in prevalence in later treatment lines. As many of the genes within our resistance signature fall into pathways that potentially may synergize with current first-line treatments, we evaluated the causality of one of the enzymes in the protein-folding pathway, PPIA. Both CRISPR (clustered regularly interspaced short palindromic repeats)−Cas9 deletion of the PPIA gene from MM cell lines, and a PPIA small molecule inhibitor (ciclosporin or cyclo-sporine A (CsA)), defined a direct effect of PPIA in PI resistance and demonstrated a robust and synergistic tumor killing, achieved by combining carfilzomib (CFZ) with CsA, both in MM cell lines and in an ex vivo PI-refractory MM patient sample. In summary, our work defines a roadmap for combining scRNA-seq with clinical trials, and demonstrates the impact of our approach to identify new pathways and potential targets, as we show for relapsed and refractory MM patients.
Results
NDMM and PRMM patients display similar signatures that converge into predefined malignant drivers
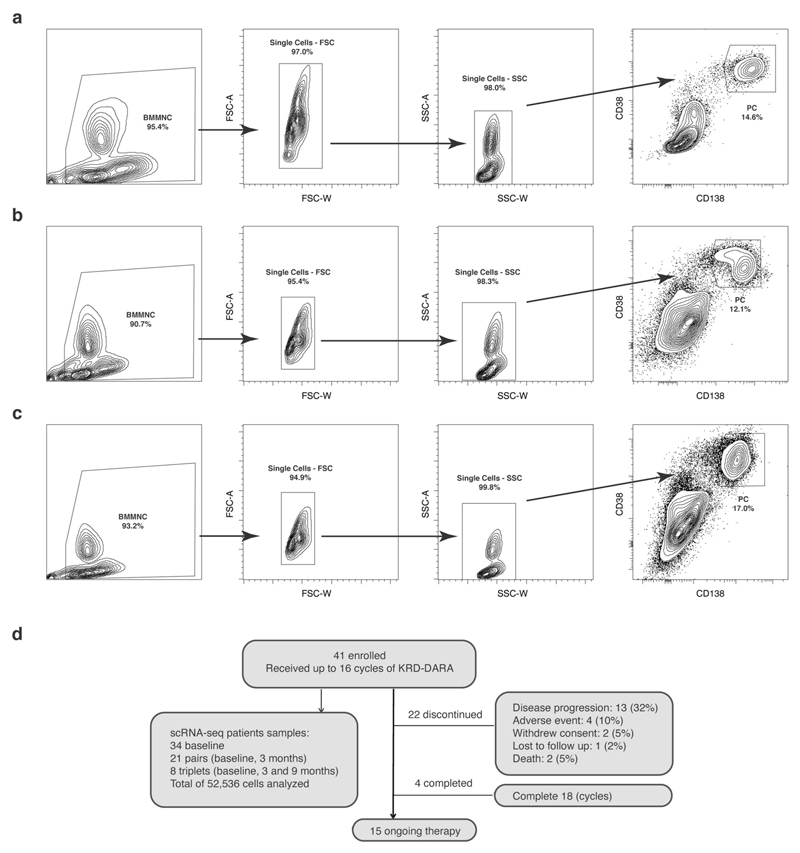
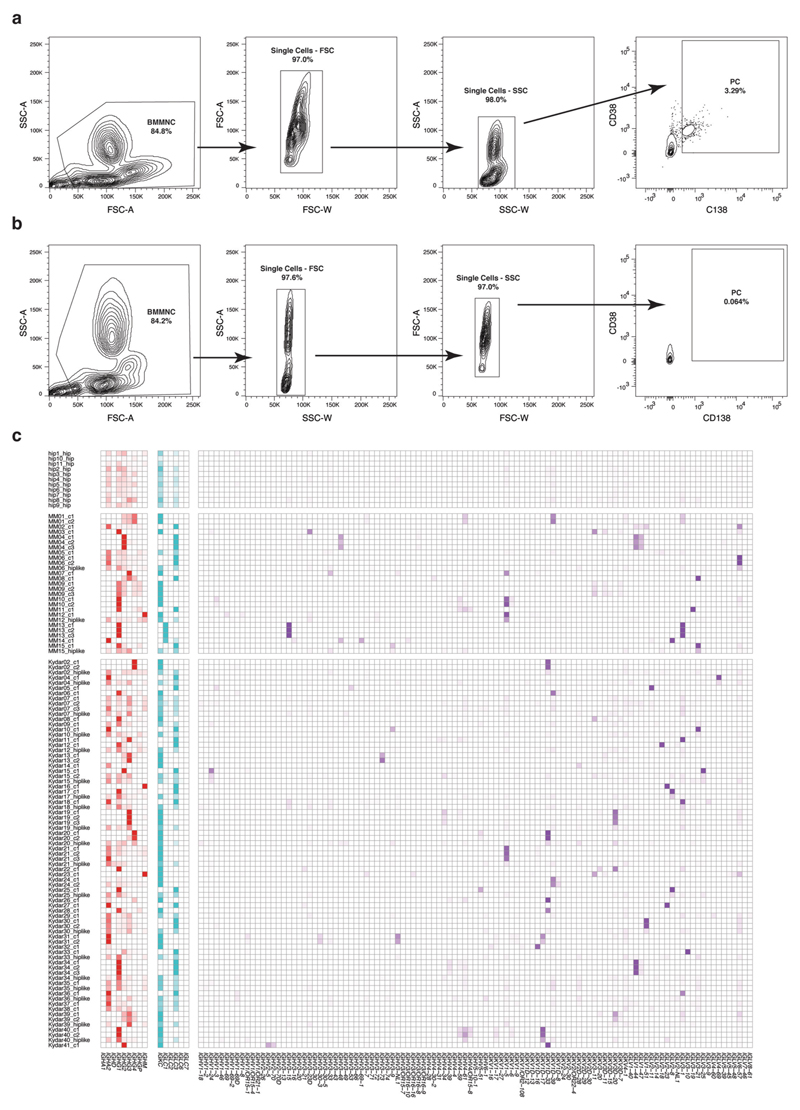
To better understand early resistance mechanisms of PRMM patients, we designed an open-label, single-arm, prospective clinical and translational trial combined with comprehensive scRNA-seq. We recruited patients with MM who received a bortezomib-based induction and either failed to achieve a timely response (<4 months (cohort A)) or progressed early (<18 months (cohort B)). The designed therapeutic treatment includes a quadruple DARA-KRD regimen (see KYDAR clinical trial). Detailed patient characteristics are listed in Table 1. To characterize the full spectrum of healthy and malignant PC states and pathways of these patients before treatment and longitudinally (baseline, cycles 4 and 10), we designed a robust protocol for massively parallel scRNA-seq (MARS-seq) characterization of the BM PCs using a validated antibody panel22 (Extended Data Fig. 1a−c). The 41 patients enrolled in the study between 12 June 2018 and 28 August 2019. At time of data cutoff (20 April 2020), median follow-up was 14.6 months; 15 patients had ongoing treatment, 4 had completed 18 cycles (10%) and 22 had discontinued treatment due to: disease progression 13 (32%), adverse events (AEs) 4 (10%), withdrawal of consent 2 (5%), lost to follow-up 1 (2%) or death 2 (5%) (Extended Data Fig. 1d).
Table 1. Patient characteristics.
| Parameter | n (%) |
|---|---|
| Age (years) (median, range) | 70 (40-85) |
| Male:female | 23 (56):18 (44) |
| Myeloma type | |
| IgG | 18 (44) |
| IgA | 6 (15) |
| Light chain only | 17 (41) |
| ISS (n = 26) | |
| I | 6 (23) |
| II | 9 (35) |
| III | 11 (42) |
| R-ISS (n = 24) | |
| I | 5 (21) |
| II | 9 (38) |
| III | 10 (42) |
| FISH cytogenetics (n = 37) | |
| t(4:14) | 3 (8) |
| Del17p | 14 (39) |
| t(14:16) | 3 (8) |
| t(14:20) | 1 (3) |
| +1q21 | 16 (44) |
| −1p | 3 (8) |
| t(11:14) | 11 (31) |
| No adverse cytogenetics | 6 (17) |
| Any intermediate-/high-risk FISH | 24 (67) |
| Any high-risk FISH | 16 (44) |
| Double-hit myeloma | 11 (27) |
| Primary refractory (cohort A) | 20 (49) |
| Early relapse (cohort B) | 21 (51) |
| EMD at diagnosis (n = 36) | 18 (44) |
| Bone adjacent | 9 (22) |
| Nonbone | 9 (22) |
| Time since myeloma diagnosis (months) (median, range) | 8 (3-17.9) |
| Frailty | |
| Fit | 18 (44) |
| Intermediate fit | 9 (22) |
| Frail | 14 (34) |
| Induction regimen | |
| VCD | 20 (49) |
| VTD/VCDT | 7 (17) |
| VRD | 9 (22) |
| VD-PACE | 2 (5) |
| Othera | 3 (7) |
| Post-ASCT | 16 (39) |
ISS, international staging system; R-ISS, revised-ISS; EMD, extramedullary disease; Intermediate/high risk: t(4:14), Del17p, t(14:16), t(14:20), +1q21; double hit: >1 intermediate-/high-risk aberration; VCD, bortezomib/cyclophosphamide/dexamethasone; VTD, bortezomib/thalidomide/dexamethasone; VRD, bortezomib/lenalidomide/dexamethasone; VD-PACE, bortezomib/dexamethasone/cis-platinum/Adriamycin (doxorubicin)/cyclophosphamide/etoposide; ASCT, autologous stem cell transplant.
Other: bortezomib/melphalan/prednisone (n = 1), bortezomib/dexamethasone (n = 2).
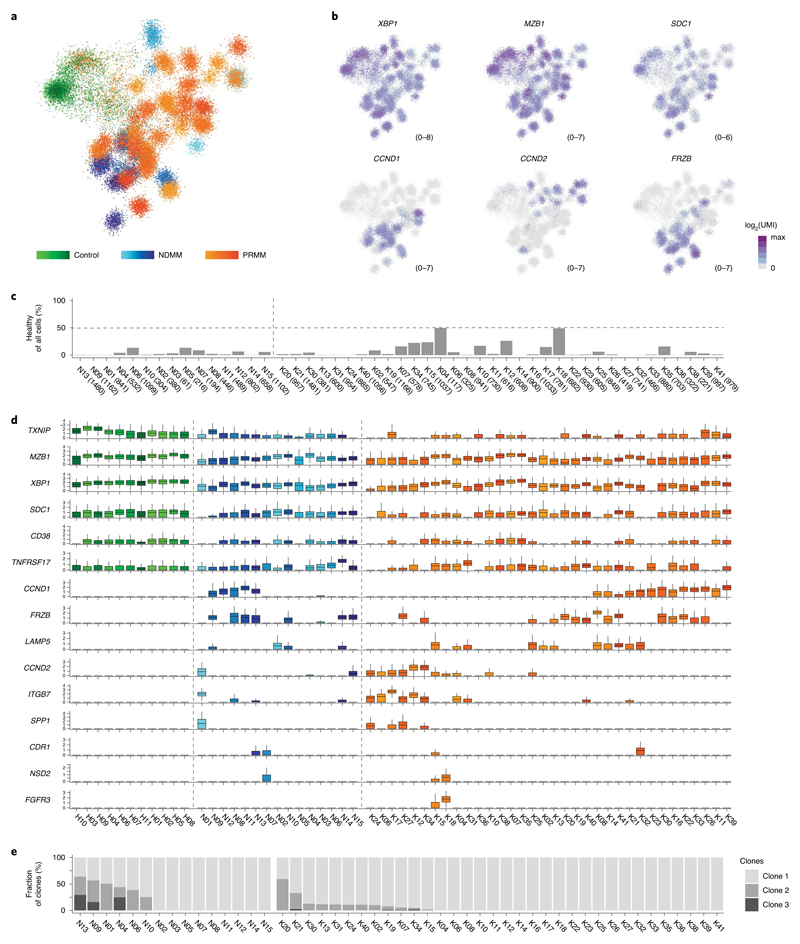
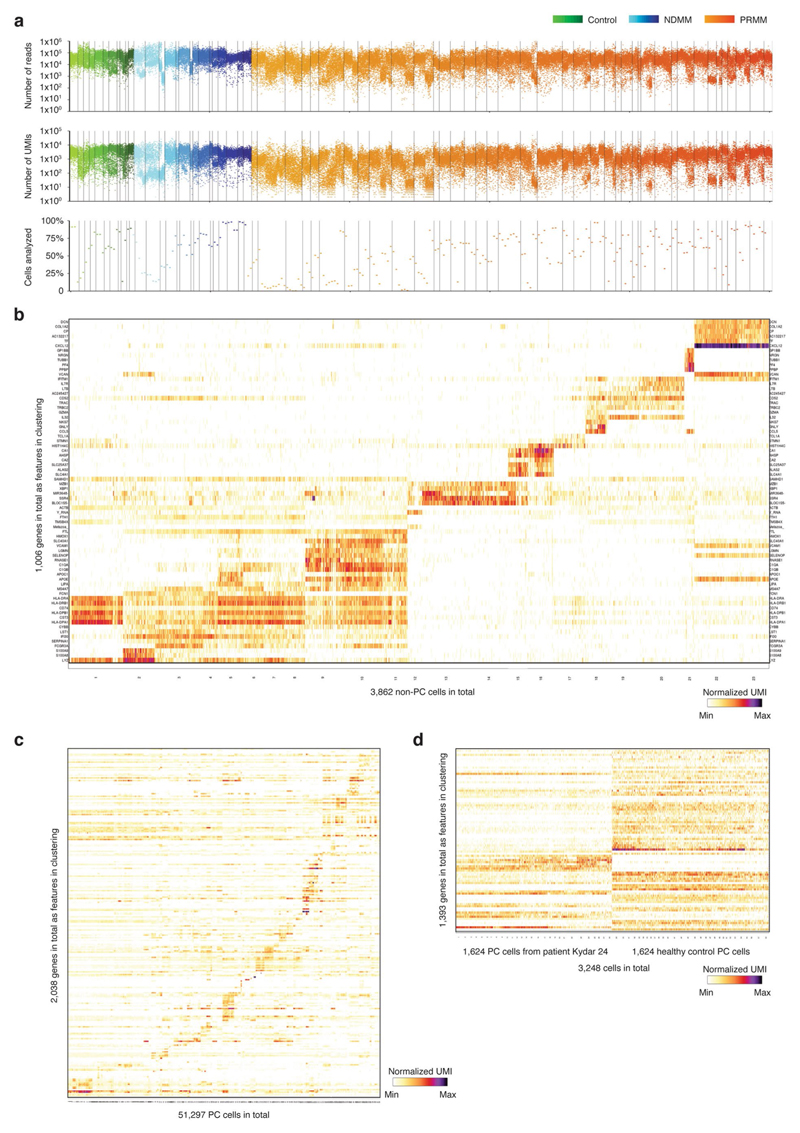
We sequenced BM PCs from a total of 41 KYDAR patients: 34 baseline, 27 cycle 4 (3 months) and 10 cycle 10 (9 months). In addition, we combined these patients with MARS-seq data from 15 NDMM patients and 11 healthy, age-matched controls undergoing hip replacement surgery22 (Supplementary Table 1). We collected data on a total of 95,380 cells, covering 51,297 quality control (QC)-positive PCs (Extended Data Fig. 2a,b). We used the MetaCell algorithm26 to identify homogeneous and robust groups of cells (metacells; see Methods) from scRNA-seq data, resulting in a detailed map of 260 metacells comprising the transcriptional subpopulations covering the spectrum of PC diversity: healthy PCs, NDMM and PRMM patients pre- and post-treatment (Fig. 1a). PC subpopulations were based on cluster-specific expression patterns of the 2,038 most variable genes, discarding immunoglobulin (Ig) genes (Extended Data Fig. 2c). Each patient was characterized by a unique PC transcriptional program whereas signature PC genes XBP1, MZB1, SDC1 (CD138) and TNFRSF17 (BCMA) were expressed in variable intensity among patients of all cohorts, including healthy controls (Fig. 1b and Extended Data Fig. 2c). Although every patient displayed a unique transcriptional state, we detected common overexpressed driver genes shared across subgroups of patients, such as CCND1, CCND2 and FRZB27. Aside from the malignant PCs, we detected a small fraction of seemingly healthy polyclonal PCs in most patients, with higher variability in the PRMM cohort after the first line of treatment (Fig. 1c). To further characterize the transcriptional heterogeneity of the malignant PCs of each patient, we applied the metacell clustering on the PCs from each patient separately, together with a control dataset of healthy PCs, and defined transcriptionally homogeneous clones for each patient (Extended Data Fig. 2d and Methods). We further validated that each clone homogeneously expresses a single VDJ arrangement. We analyzed whether common driver genes are associated with malignant PCs of a specific patient group and found no significant differences (P > 0.05, Fisher’s exact test) in the expression of previously described driver genes across the NDMM and PRMM patient groups (Fig. 1d). In addition, we observed no significant difference in the clonality of the NDMM and PRMM groups, with 6/15 of the NDMM and 12/34 of the PRMM malignant PCs containing more than one transcriptional subclone (Fig. 1e and Methods). Together, our data define the molecular signature and driver genes of malignant PCs within NDMM and PRMM patients showing no significant difference between the two groups.
Fig. 1. Single-cell atlas of PCs derived from NDMM and PRMM patients.
a, The 2D projection showing expression profiles of 51,297 QC-positive single BM PCs derived from 60 patients: 11 controls, 15 NDMM and 34 PRMM patients. b, The 2D projection of a selected set of key PC genes and main MM driver genes over the metacell model. c, Barplot depicting percentage of seemingly healthy PCs within total collected PCs among 15 individual NDMM (N) and 34 PRMM (K) patients, with the total number of collected PCs from each patient in the brackets of the labels on the x axis. d, Boxplots showing normalized expression (Methods) of canonical PC genes and common MM driver genes in 11 controls (H), and 15 NDMM (N) and 34 PRMM (K) individual patients. The center line represents the median, the box limits the upper and lower quartiles, and the whiskers 1.5× the interquartile range. e, Barplot depicting malignant PC clonality in individual NDMM and PRMM patients.
Refractory and resistant MM patients are characterized by unique stress pathways
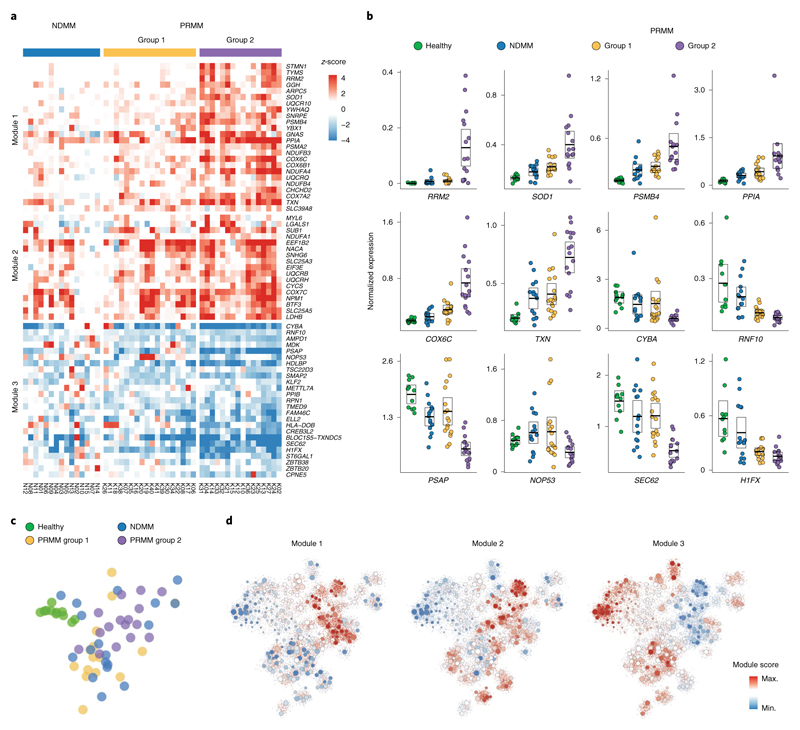
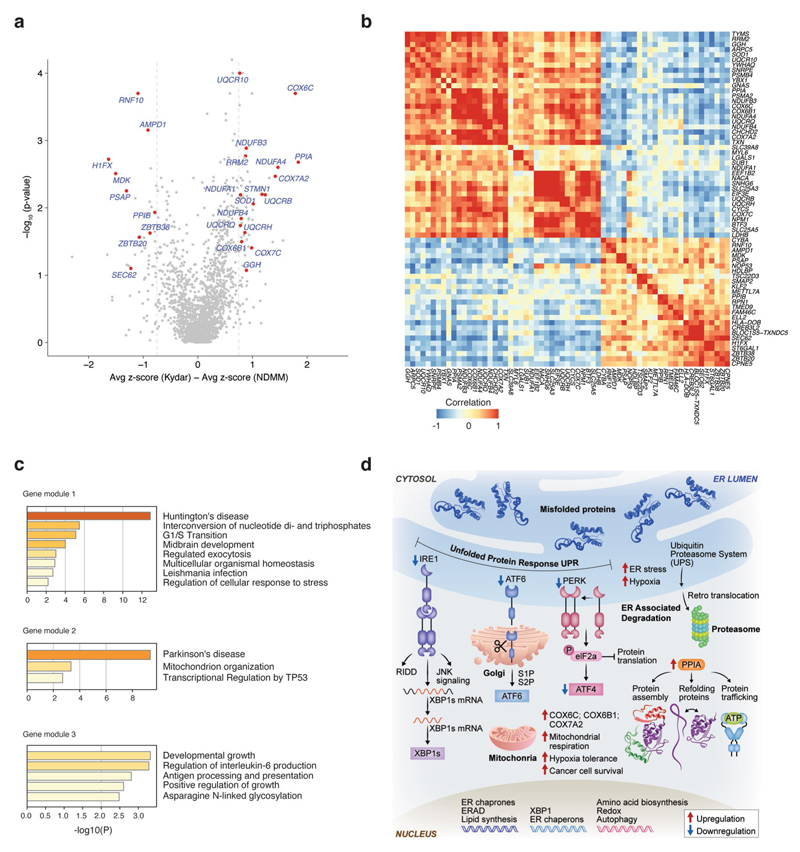
We hypothesized that dedicated molecular pathways define the resistance mechanisms of malignant PCs of PRMM patients, and used a bootstrapping approach to quantify the expression between MM cells in a specific clone and the healthy control group (Fig. 2a, Extended Data Fig. 3a−f, Supplementary Table 2 and Methods). We found 66 deferentially expressed genes after controlling the false discovery rate (FDR; see Methods); hierarchical clustering of these genes resulted in a clustering structure consisting of three gene modules, distinguishing the NDMM and PRMM malignant PC state. The module-1 signature is defined by low expressed genes in the NDMM cohort and divides the PRMM patients into two groups: patients with low expression of module 1 (group 1) versus patients with high expression (group 2; Fig. 2a−d and Extended Data Fig. 4a,b). The genes in module 1 include some previously described high-risk MM factors such as STMN1, PSMB4, RRM2 and TYMS28–32, as well as new genes not previously associated with high-risk MM, for example PPIA. Module 1 is highly enriched for specific pathways: mitochondrial stress genes COX6C, COX7A2, ER and UPR pathway genes PPIA, STMN1, oxidative stress SOD1, TXN and the proteasome pathway PSMB4 and PSMA2 (Fig. 2a,b and Extended Data Fig. 4c,d). Projection of the modules score on the two-dimensional (2D) patient map defines a specific location for the PRMM patients expressing a high level of module 1 (Fig. 2c,d). These PRMM patients overexpressing module 1 are also characterized by downregulation of module 3. Together, our results describe a novel MM resistance signature that defines a subset of PRMM patients, including perturbation in mitochondrial stress genes, the ER and UPR pathway, and proteasome machinery.
Fig. 2. New MM gene modules define subsets of PRMM patients.
a, Heatmap depicting the z-score of 66 differential genes with an FDA-adjusted P <0.05 (statistical test, see Methods) between the malignant PCs of NDMM and PRMM patients. b, Dot plots showing average expression of a selected set of highly differential genes between NDMM and PRMM patients, in four different patient groups: healthy, NDMM patients, PRMM group 1 and PRMM group 2. The center line represents the mean, the box limits the 95% confidence intervals, and the points all the data. c, The 2D projection of the same patient groups in b over the metacell model. Individual patients are located in the mean coordinates of their corresponding cells. d, The 2D projection of gene module scores of the three gene modules in a over the metacell model. Individual cells are represented by small dots, whereas metacells are represented by bigger dots proportional to the cell number of each metacell.
Favorable clinical outcomes of DARA−KRD in PRMM patients
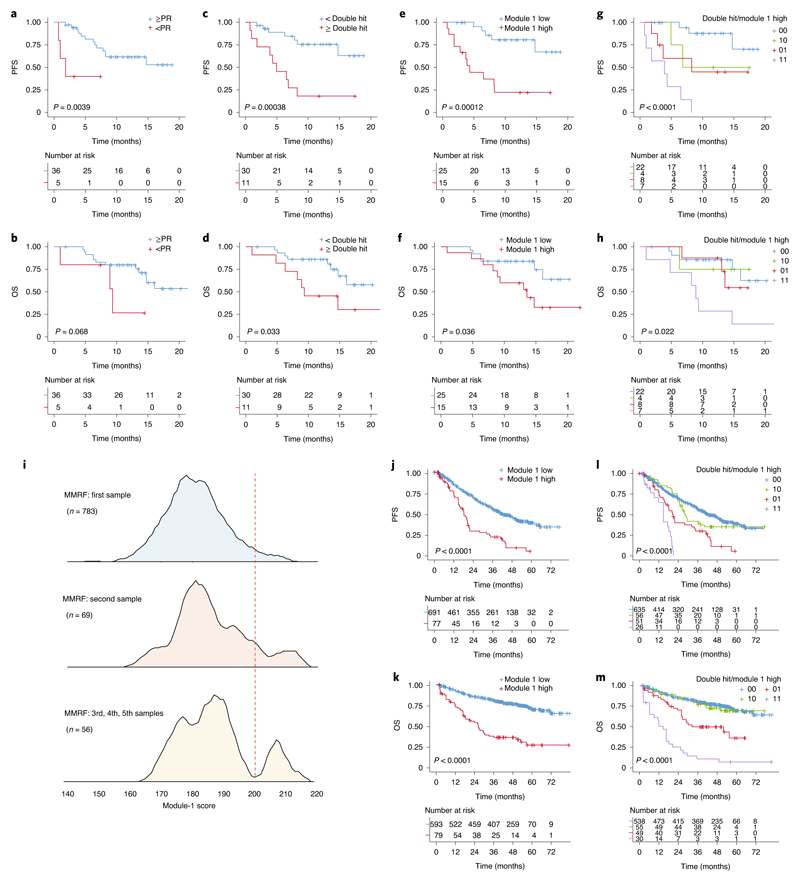
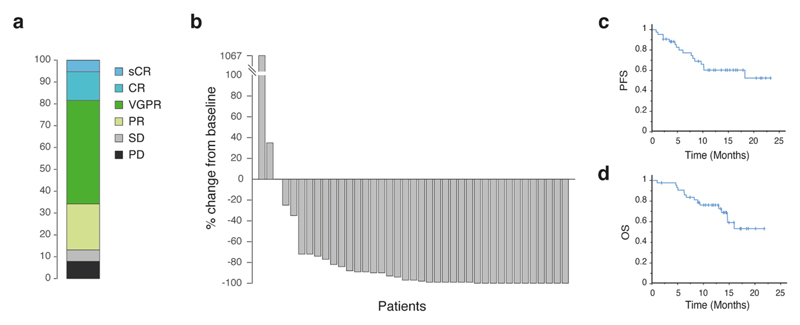
The DARA-KRD combination is a highly effective, quadruple anti-myeloma regimen33–35. In the KYDAR study, treatment-emergent adverse events (TEAEs) occurred in 40 (98%) of the patients and 4 (10%) discontinued the study regimen due to TEAEs. The most frequent TEAEs are detailed in Supplementary Table 3. The ORR was 88% (cohort A: 90%; cohort B: 86%), 13% achieved a complete response (CR) or better, 50% achieved a very good partial response (VGPR) and 25% achieved a partial response (PR) (Extended Data Fig. 5a,b). Median progression-free survival (PFS) was 14.7 months for the entire cohort (Extended Data Fig. 5c) and was not reached for patients who achieved best response of PR or better and was 1.8 months for patients who achieved less than PR (hazard ratio (HR) = 5.7, 95% confidence interval (CI) = 1.5−21.7, P = 0.04, logrank test, two sided) (Fig. 3a). Median overall survival (OS) was not reached for the entire cohort (Extended Data Fig. 5d). The median OS was not reached for patients who achieved PR and better as compared with a median OS of 9.3 (95% CI = 2.4−16.3) months for patients who failed to achieve PR (HR = 3.2, 95% CI = 0.85−11.9, P = 0.068, logrank test, two sided) (Fig. 3b).
Fig. 3. Gene signatures of PRMM patients can predict clinical response to DARA treatment.
a, KM plot and analysis of PFS comparing patients who achieved PR and better with patients who did not achieve PR (logrank test, two-sided P = 0.0039, HR = 5.7, 95% CI = 1.5−21.7). b, KM plot and analysis as in a for OS (logrank test, two-sided P = 0.068, HR = 3.2, 95% CI = 0.9−11.9). c, KM plot and analysis of PFS for patients with double high-risk cytogenetic aberration on FISH analysis compared with single or no high-risk aberration (logrank test, two-sided P = 0.00038, HR = 5.1, 95% CI = 1.9−14.1). d, KM plot and analysis as in c for OS (logrank test, two-sided P = 0.033, HR = 2.9, 95% CI = 1.1−7.9). e, KM plot and analysis of PFS for patients with high module-1 genes score compared with low module-1 score (logrank test, two-sided P = 0.00012, HR = 6.4, 95% CI = 2.2−18.6). f, KM plot and analysis as in e for OS (logrank test, two-sided P = 0.0036, HR = 2.9, 95% CI = 1.02−8.2). g, KM plot and analysis comparing PFS of patients with no double hit and low module-1 score (00, blue), patients with double hit and low module-1 score (10, red), patients with no double hit and high module-1 score (01, green) and patients with double hit and high module-1 score (11, orange) (logrank test, two-sided P = 0.000004). h, KM plot and analysis as in g for OS (logrank test, two-sided P = 0.022). i, Histogram of the log2(average module-1 gene expression) in the MMRF’s CoMMpass data for 783 NDMM patients (upper panel), 69 patients after first line of treatment (middle panel) and 56 patients after at least two lines of treatment (lower panel). j, KM plot and analysis for PFS comparing NDMM patients in the CoMMpass data with high module-1 score (red) and patients with low module-1 gene score (blue) (logrank test, two-sided P = 8.12 × 10⁻⁷, HR = 2.9, 95% CI = 1.9−4.5). k, KM plot and analysis as in j for OS (logrank test, two-sided P = 4.57 × 10⁻¹⁷, HR = 3.9, 95% CI = 2.22−6.87). l, Multivariate KM plot and analysis for PFS of CoMMpass data with module-1 high and FISH double-hit genetic risk (logrank test, two-sided P = 3.72 × 10⁻¹⁵). m, KM plot and analysis as in l for OS (logrank test, two-sided P = 1.8 × 10⁻³¹).
Signatures of PRMM patients can predict clinical response to DARA−KRD treatment
KYDAR participants are at high risk for progression by virtue of their suboptimal induction outcomes; 67% also demonstrated high-risk cytogenetic aberrations and 27% had more than one high-risk aberration (that is, double-hit myeloma). To test the effect of genetic aberrations, as detected by FISH, on patient outcome, we divided the patients into double-hit myeloma and patients with no more than one high-risk aberration. Median PFS was not reached for patients with up to one genetic risk aberration and was 4.9 months for patients with at least two genetic hits (HR = 5, 95% CI = 1.89−14.38, P = 0.000379, logrank test, two sided) (Fig. 3c,d). We analyzed whether the molecular signatures that differentiate our PRMM cohort from NDMM patients is correlated to patient outcome. We found that module 1 is a highly predictive molecular signature of PRMM patients, exceeding the genetic risk stratification, with PFS 4.3 months and OS 9.3 months for patients with high module-1 score, and both not reached for patients with low module-1 score (Fig. 3e,f). The integration of double-hit MM and the module-1 signature in a multivariate model significantly improved the predictive power (logrank test, two-sided P = 0.000004 and 0.022 for PFS and OS, respectively; Fig. 3g,h and Supplementary Table 4). Finally, we analyzed the average RNA expression of module-1 genes in 908 MM patients from the independent Multiple Myeloma Research Foundation (MMRF) CoMMpass dataset. We found that in MMRF patients, before treatment, or patients after multiple relapses, we detected a gradient increase in module 1 with a clear bimodal distribution (Fig. 3i). Survival analysis on CoMMpass patients with module 1 high (n = 77 for PFS and 79 for OS analysis), compared with the rest of the population (n = 691 for PFS and 593 for OS), revealed a striking HR of 3.9 (2.22−6.87) with P = 4.57 × 10⁻¹⁷, logrank test, two sided, for these patients (Fig. 3j,k). CoMMpass patients with module-1 high expression had several clinical and biological poor risk factors. Strikingly, early (<18 months) progression occurred in 72% versus 41% in patients with high versus low module-1 patients, respectively (Supplementary Table 4).
Furthermore, we validated the significant contribution of module 1 beyond that of double-hit cytogenetics in the CoMMpass dataset and revised international staging system (R-ISS; Supplementary Table 4). In a multivariate model, including age, ISS, creatinine and high-risk FISH, module 1 remained a significant predictor of OS (HR = 4.2, P = 3.5 × 10⁻¹⁴, logrank test, two sided) and PFS (HR = 2.9, P = 2.9 × 10⁻¹⁰, logrank test, two sided; Fig. 3l,m and Supplementary Table 4). These results highlight the prognostic power of the module-1 gene signature in stratifying high-risk MM patients into ultraresistant myeloma patients, both in PRMM and in advanced relapses.
Molecular pathways of broadly resistant MM patients
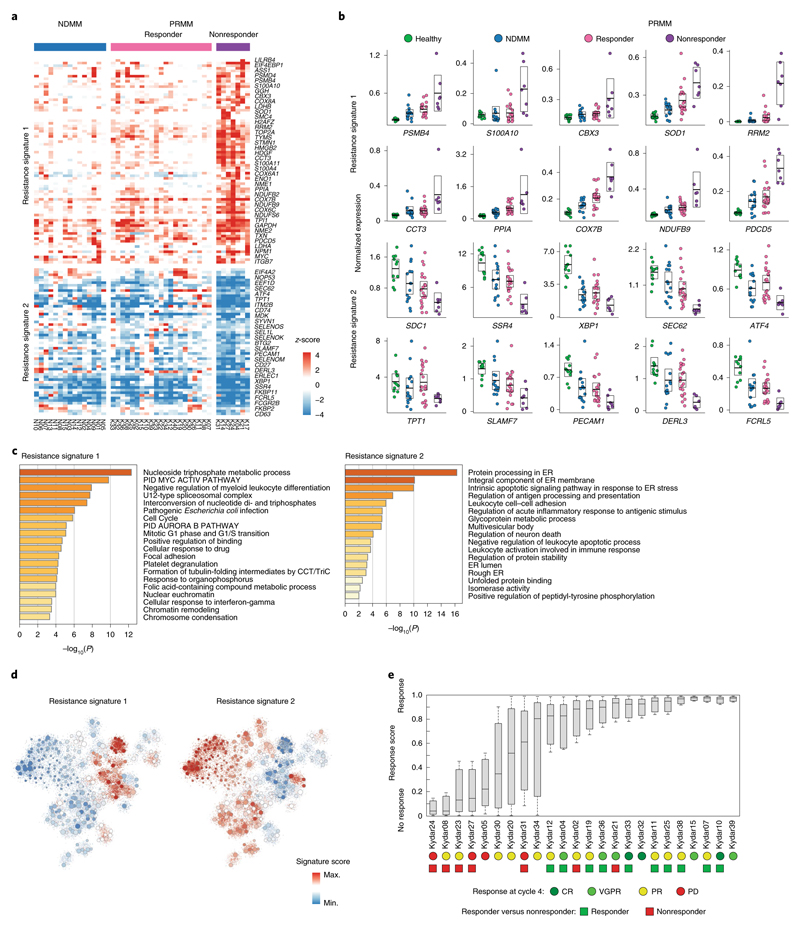
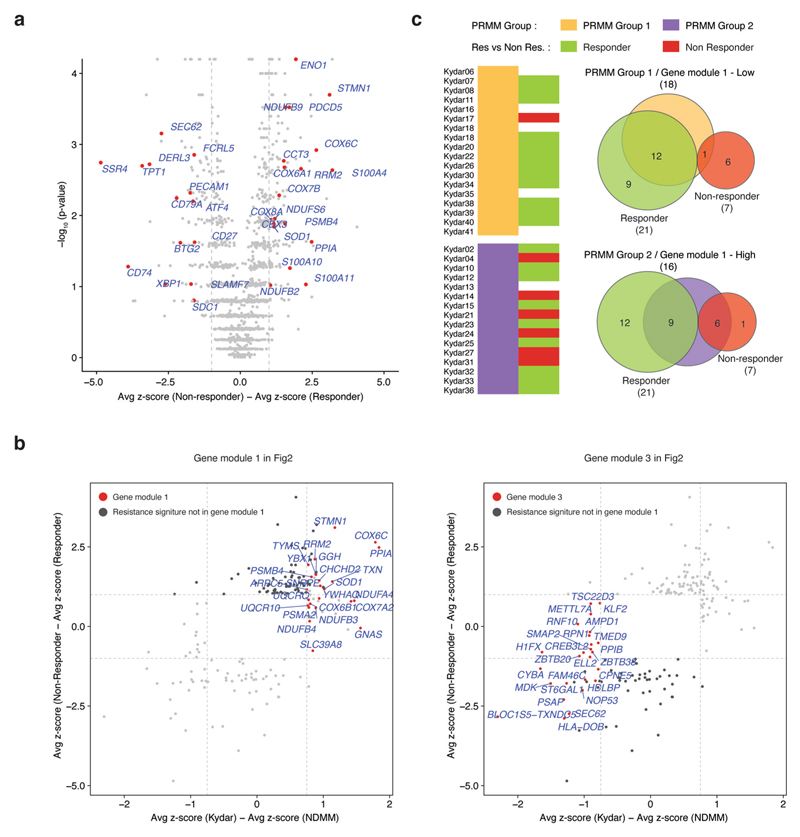
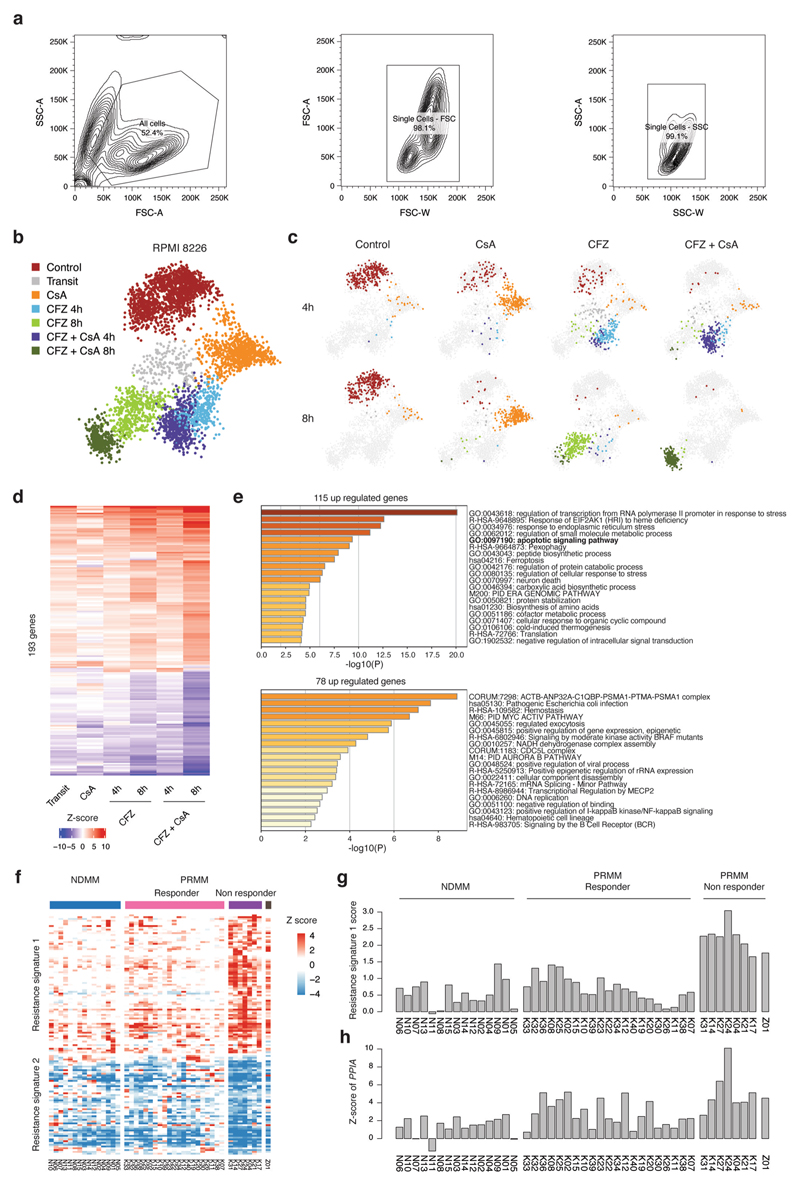
Although all PRMM patients have high-risk myeloma, only 7 out of 34 showed poor or transient response to the quadruple treatment. We defined nonresponders as patients who failed to achieve PR at 6 months from study enrollment. To better characterize the molecular pathways associated with these broadly resistant MM patients, we compared the z-scores of differentially expressed genes between the KRD-DARA responder and nonresponder patients (Supplementary Table 5 and Methods). We found 133 deferentially expressed genes after controlling the FDR (Methods), which can be separated into two major clusters, distinguishing PRMM responder and nonresponder patient groups, with NDMM patients showing a similar pattern to the PRMM responder group (Fig. 4a and Extended Data Fig. 6a). These gene signatures highlight putative MM resistance pathways, including upregulation of genes associated with immune regulation, proteasome, apoptotic and ER stress pathways, for example, cyclophilin A (PPIA), and the programmed cell death protein 5 (PDCD5), creating an elaborated signature and potential target list of pathways and escape mechanisms from the advanced combination therapy (Fig. 4b,c). We detected several candidate markers that are highly differential between the responder and the nonresponder patients, including the downregulation of multiple genes associated with PC function: ATF4, CD38 and FCRL5 (Fig. 4b and Supplementary Table 5). As expected, CD38, the target of daratumumab, the immunotherapy used in this clinical trial, is downregulated in the nonresponsive patient cohort36,37. In addition, we observed that the nonresponder group had significantly upregulated the proteasome genes PSMD4 and PSMB4 (Fig. 4a), highlighting potential escape mechanisms from the proteasome inhibitor in these patients14,16,38. We also observed significant upregulation of mitochondrial stress genes (for example, COX8A, COX6A1 and COX6C) in the nonresponder compared with the responder patients (Fig. 4a), suggesting that perturbation of respiratory activity of the mitochondria may increase survival of the malignant PCs39.
Fig. 4. Molecular pathways of broadly resistant MM patients.
a, Heatmap depicting the z-scores of 133 differential genes in NDMM and PRMM patients. The gene list is obtained by comparing the malignant PCs of the PRMM responder and nonresponder patient groups with an FDA-adjusted P < 0.05 (for statistical test, see Methods). b, Dot plots showing expression of a selected set of highly differential genes between PRMM responder and nonresponder patients. The center line represents the mean, the box limits 95% CIs and the points all the data. c, GO enrichment analysis of resistance signature 1 on the left and signature 2 on the right. d, The 2D projection of resistance signature scores over the metacell model. Individual cells are represented by small dots, whereas metacells are represented by bigger dots proportional to the cell number of each metacell. e, Boxplot showing the response score of individual cells from 24 individual patients using a shallow neural network classifier predicting the response to treatment after 4 months. The center line represents the median, the box limits the upper and lower quartiles, and the whiskers 1.5× the interquartile range. PD, progressive disease.
Gene ontology (GO) enrichment analysis revealed an increase in nucleoside metabolism (resistance signature 1, upregulated) and a decrease in protein processing in the ER, including intrinsic apoptotic signaling in response to ER stress (resistance signature 2, down-regulated) (Fig. 4c). The 2D projection of these signatures on the PC patient map largely overlap the territory of the PRMM-resistant signature, suggesting that the two sets of genes and patients overlap (Fig. 4d). Statistical analysis shows that this signature significantly overlaps the tumor-resistant signature of the PRMM patients (P = 3.5 × 10⁻⁷, hypergeometric test; Extended Data Fig. 6b), as well as a significant overlap (6 of 7, P = 0.029, hypergeometric test) in the KYDAR nonresponder patient group and the PRMM patients expressing the module-1 signature (Extended Data Fig. 6c). A regression analysis, using a shallow neural network classifier with 10 hidden layers, successfully predicted patient response to treatment after 4 months, highlighting that the resistance mechanisms we detected are shared between patients and can be generalized to larger patient cohorts (Fig. 4e and Methods). Our results demonstrate that the scRNA-seq data are highly correlated with clinical outcome and hold potential for use as a companion diagnostic for MM and especially PRMM patients.
Longitudinal single-cell clonal dynamics of MM patients’ response to treatment
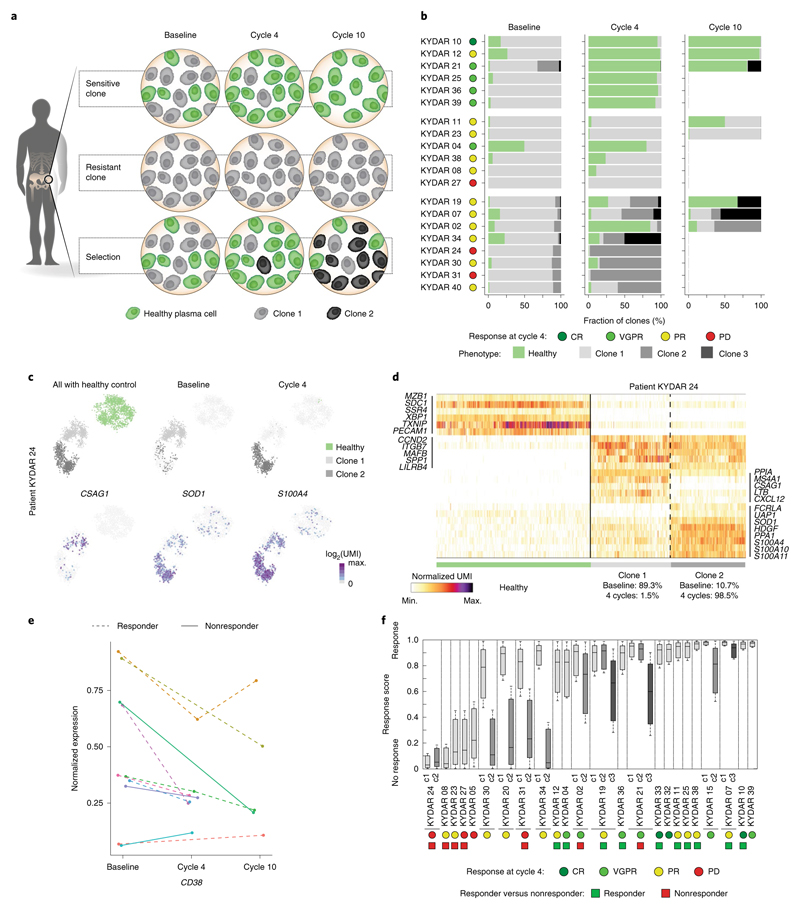
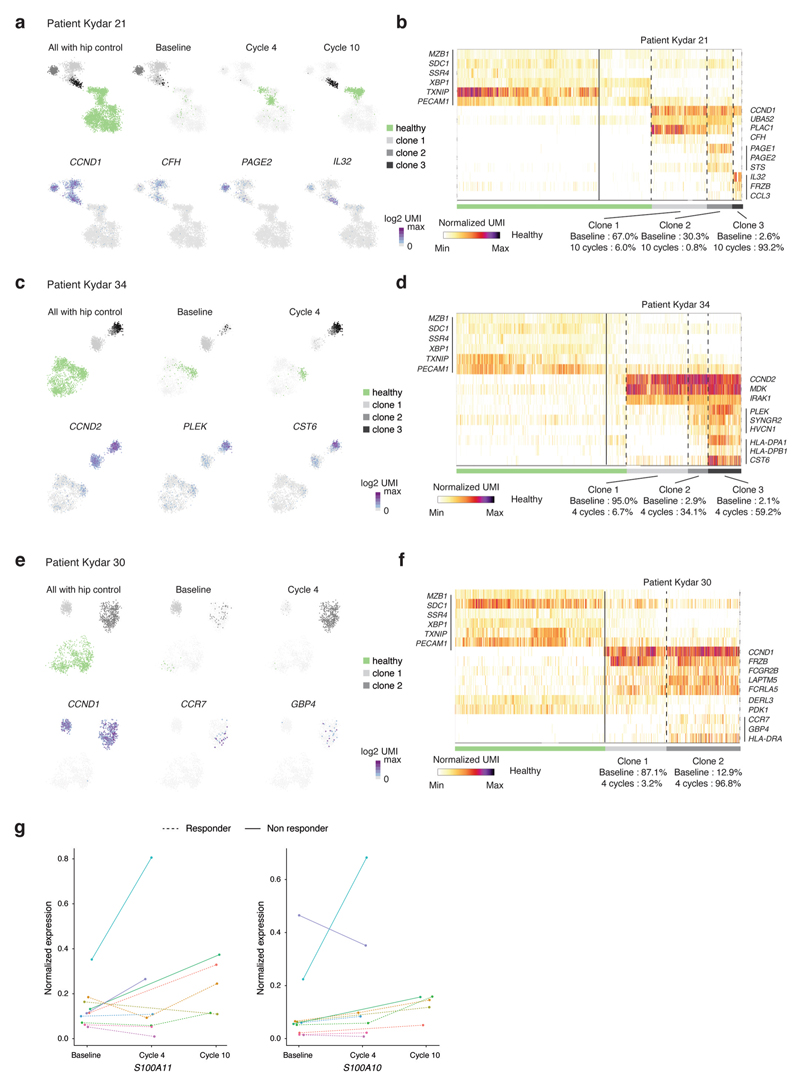
In addition to patients who failed to achieve PR, several others who showed initial response later relapsed. Clonal evolution is a major driving force in tumor resistance and progression40,41. To address this important question, we performed a longitudinal single-cell analysis on PRMM patients’ PCs before and after treatment (at cycles 4 and 10; Extended Data Fig. 7a,b) combined with clonal analysis using the B-cell receptor sequence of each transcriptional clone. Our analysis of the transcriptional clonal dynamics in patients identifies three main trajectories: patients with sensitive PC clones or clone that responds to treatment with >90% of the malignant PCs replaced with seemingly health PCs (6 patients, 30%); in patients with a resistant clone that did not respond or only very partly responded to treatment, >50% of the malignant PCs were found in the BM post-treatment (6 patients, 30%); and patients with clonal selection, indicating that the major clone has been replaced by a small or undetectable clone at baseline (8 patients, 40%) (Fig. 5a,b). These results are on a par with the clinical response of the patients. Patient KYDAR 24, a clinical nonresponder, is an example of selective clonal evolution dynamics with an evolving transcriptional state throughout the clinical trial. A 2D map of the patient’s malignant PCs, including healthy PCs as a reference, shows the transition from clone 1 at baseline with high expression of CSAG1 and MS4A1 genes to clone 2 at cycle 4 that downregulated CSAG1 and MS4A1 and upregulated SOD1 and S100A4 (10.7% in baseline versus 98.5% in cycle 4) (Fig. 5c,d). These clones share the same B-cell receptor and MM drivers such as CCND2, ITGB7 and MAFB, suggesting a shared ancestor (Extended Data Fig. 7c). Our longitudinal analysis revealed clonal dynamics and transcriptional changes in 9 of 20 patients; in all cases the main MM drivers were shared between the different clones with unique gene expression alterations for each patient (Extended Data Fig. 8a−f).
Fig. 5. Longitudinal single-cell analysis of MM patients pre- and post-treatment.
a, Graphical illustration of clonal evolution and dynamics of malignant PCs into three main trajectories during DARA-KDR treatment: sensitive, resistant and selection. b, Barplots depicting longitudinal malignant PC clonality in pre-treatment (baseline) and post-treatment (cycle 4, 3 months; cycle 10, 9 months) of individual PRMM patients. Healthy PCs are shown in green, whereas different clones of malignant PCs are shown in different shades of gray. Patient outcome at 4 months is indicated on the right of the patient labels. c, Top: 2D projection of malignant PCs of patient KYDAR 24, including healthy PCs as a reference, highlighting all cells (left), cells collected from baseline (middle) and cells collected from cycle 4 (right). The color of the cells represents healthy PCs, and malignant clones 1 and 2. Bottom: 2D projection of expression of a selected set of differential genes over the metacell model. d, Heatmap showing expression of selected differential genes between the two malignant PC clones of patient KYDAR 24, with healthy PCs as a reference. e, The dynamics of CD38 expression in individual patients during DARA−KRD treatment. f, Boxplot showing the response scores of individual cells of each malignant PC clone in 24 individual patients using a shallow neural network classifier predicting the response to treatment after 4 months. The center line represents the median, the box limits the upper and lower quartiles, and the whiskers 1.5× the interquartile range.
One of the genes showing consistent downregulation from the original clone to the emerging resistant clones is CD38, previously shown to be downregulated in response to treatment36,37 (Fig. 5e). We also observed upregulation of genes that are associated with a myeloid cell program such as S100A10 and S100A11 (Extended Data Fig. 8g)42. Finally, we applied the neural network model we previously trained on to the pre-treatment malignant PCs of the patients on all the clones collected longitudinally from PRMM patients. For several patients, with initial clones classified as responders by the model, we observed a switch to a nonresponder clone: KYDAR 30, 20, 31, 34, 19, 21 and 15 (Fig. 5f). These transcriptional clones were not introduced as training data to the model and emerged after treatment, showing that the acquisition of therapeutic resistance may occur in multiple stages, or on small clones that later define the patient outcome. In summary, our data demonstrate that dynamic single-cell analysis is an important molecular microscope to dynamically define patients’ response to treatment, and the genes and pathways associated with tumor resistance.
PPIA, a new target for MM patients with broad resistance mechanisms
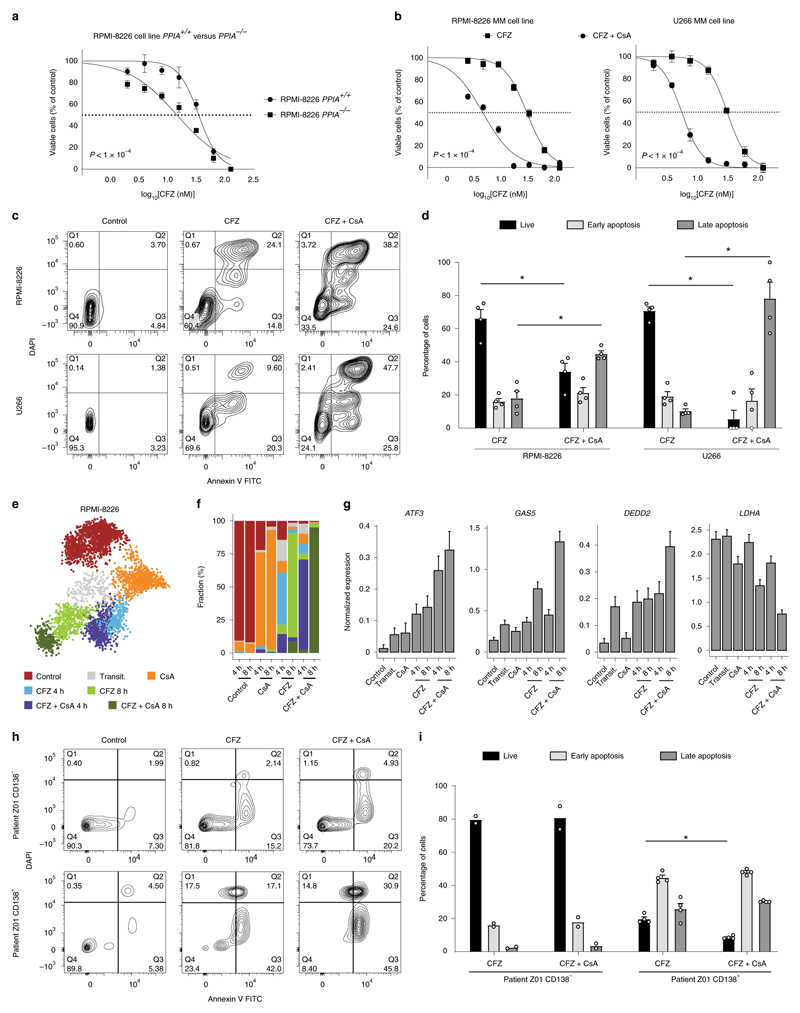
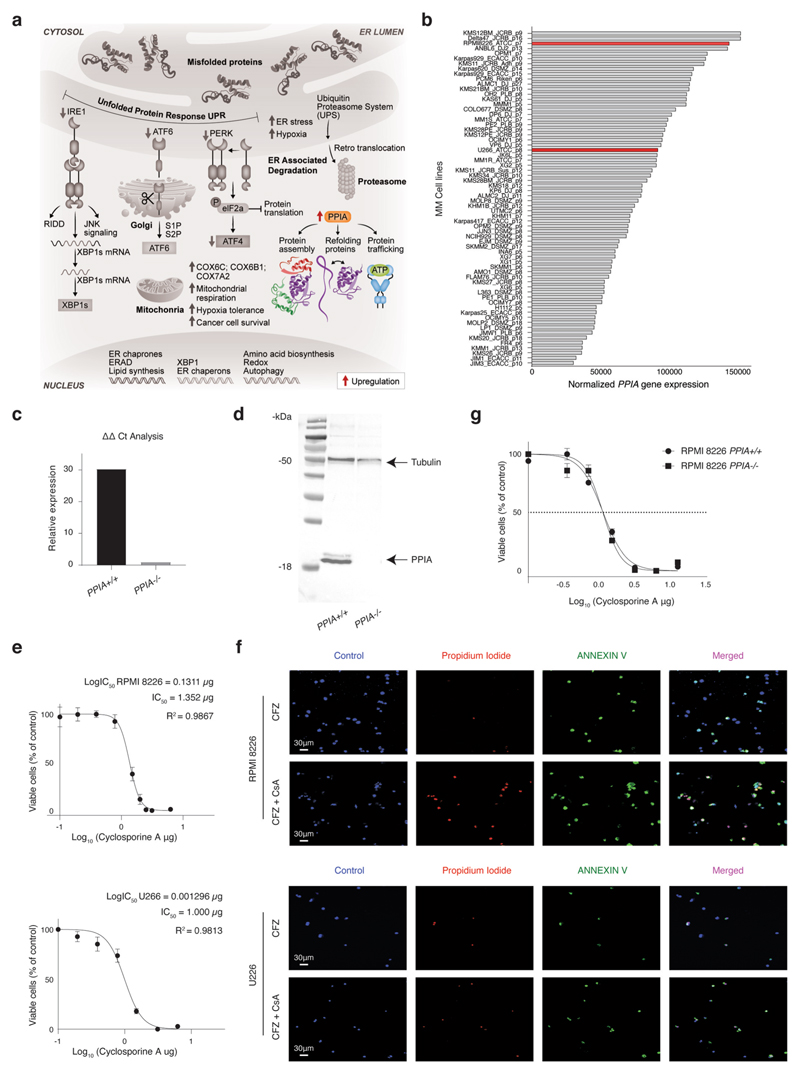
Cyclophilin A (encoded by the PPIA gene) is a peptidylprolyl cis−trans isomerase enzyme that facilitates efficient protein folding43. Our data characterize PPIA as a potential MM resistance gene, which is highly expressed in both PRMM (Fig. 2a,b) and the KYDAR nonresponder patients (Fig. 4a,b). We hypothesized that PPIA may function as a protective resistance gene in MM malignant cells, potentially by accelerating protein-folding pathways and reducing toxicity associated with PIs43,44 (Extended Data Fig. 9a). To investigate whether PPIA is merely a marker for highly resistant patients or has any causal role in MM resistance to PIs, we genetically deleted PPIA in an MM malignant cell line (RPMI-8226), which overexpresses PPIA, using a CRSIPR−Cas9 strategy (Extended Data Fig. 9b−d). We next compared the sensitivity of PPIA−/− and PPIA+/+ cells with the second-line PI, CFZ. Strikingly, PPIA−/− cells were significantly more sensitive to CFZ (P < 0.0001, extra sum-of-squares F test) with a half-maximal inhibitory concentration (IC50) of 14 nM compared with 34 nM for RPMI-8226 PPIA+/+ (Fig. 6a). We next tested whether inhibition of PPIA using CsA, a known small molecule inhibitor of PPIA45, will have a similar effect to the genetic perturbation of PPIA and synergize with PI treatment of malignant PCs. We first measured the proliferation of MM cell lines after CsA treatment and determined the IC50 of CsA (Extended Data Fig. 9e and Methods). We then evaluated whether CsA would synergize with CFZ. MM cells were seeded and treated with CFZ, CsA or combination therapy. We found that the combined therapy of CsA and CFZ was significantly more effective than CFZ as a monotherapy (Fig. 6b). To further evaluate the significance of these findings, we measured the effects of these drugs in apoptosis induction of MM, which showed a dramatic increase in cell apoptosis in the combination therapy setting compared with CFZ or CsA as monotherapy (Fig. 6c,d and Extended Data Fig. 9f). We found no difference in the sensitivity of PPIA−/− or PPIA+/+ to CsA treatment, supporting the hypothesis that, for malignant PCs, PPIA is the major target of CsA (Extended Data Fig. 9g).
Fig. 6. CsA, known inhibitor for PPIA shows synergistic effect with the proteasome inhibitor CFZ.
a, Dose-response curves for RPMI-8226 PPIA+/+ and RPMI-8226 PPIA−/− cell lines to determine sensitivity to the first-line proteasome inhibitor, CFZ. Cells were incubated with CFZ at serial dilution, starting at doses of 125 nM for 48 h before cell viability was determined using an MTS proliferation assay. Results are shown as the mean ± s.e.m. of three independent experiments. IC50 values are 34 nM for RPMI-8226 PP/A+/+ and 14 nM for RPMI-8226 PPIA−/−. P values of the statistical comparison between IC50 values are indicated (P< 0.001, extra sum-of-squares F test). b, Dose-response curves for RPMI-8226 and U266 cell lines. Cells were incubated with CFZ with or without CsA (1.5 μg) for 48 h before cell viability was determined using an MTS proliferation assay. Results are shown as the mean ± s.e.m. of three independent experiments. IC50 values for CFZ versus combination therapy are 28 nM and 3.8 nM in RPMI-8226 cell line (left), and 31 nM and 5.6 nM in U266 cell line (right), respectively. Results are shown as the mean ± s.e.m. of three independent experiments. P values of the statistical comparison between IC50 values are indicated (P < 0.001, extra sum-of-squares F test). c, FACS apoptosis assay of RPMI-8226 and U266 cell lines using annexin and DAPI staining for early and late apoptosis, respectively. d, Immunofluorescence analysis and quantification of proliferating cells. Statistical significance was determined using exact Wilcoxon’s rank-sum test (Mann-Whitney U-test, *P = 0.0286, two sided; n = 4 per group; results are shown as the mean ± s.e.m.). e, The 2D projection showing metacell analysis of scRNA-seq of RPMI-8226 cells during CsA, CFZ and CFZ + CsA treatment at 4 h and 8 h. Different cell states are indicated by colors. f, Barplot showing the cell state composition in each culture at 4 h and 8 h. g, Barplot showing normalized expression (Methods) of selected genes in each cell state. The results are shown as the mean±s.d. h, FACS apoptosis assay using annexin and DAPI staining for early and late apoptosis, respectively, on ex vivo cultured, patient malignant PCs, treated with either CFZ or CFZ + CsA. i, Barplot showing the quantification of live, early apoptotic and late apoptotic cells. Statistical significance was determined using exact Wilcoxon’s rank-sum test (Mann-Whitney U-test); *P = 0.0286, two sided; n = 4 replicates from patient Z01).
To further define the molecular mechanisms underlining the response to CFZ and the synergistic effect of CFZ + CsA, we performed scRNA-seq analysis of CFZ, CsA and their combination 4 and 8 h post-treatment (Extended Data Fig. 10a). Metacell analysis revealed seven clusters: cluster 1 was enriched with mock-treated (control) healthy cells; cluster 2 contained cells in transition from cluster 1 to preapoptotic states of clusters 4−7; cluster 3 was enriched with cells treated with CsA alone; clusters 4 and 5 contained cells from 4-h and 8-h treatment with CFZ; and clusters 6 and 7 were enriched for cells treated with CFZ + CsA (Fig. 6e-f, Extended Data Fig. 10b,c and Supplementary Table 6). Clusters 4−7 were defined by the induction of genes involved in stress response and particularly the ER stress response (for example, ATF3, ATF4 and BAG3), as well as apoptotic signaling pathways (for example, DEDD2, DDIT4, GAS5 and more), while downregulating housekeeping and metabolic genes such as LDHA (Fig. 6g, Extended Data Fig. 10d,e and Supplementary Table 6). Cells treated with the combination of CFZ + CsA expressed higher levels of these signatures, with almost all cells reaching the apoptotic stage compared with CFZ alone, supporting the synergistic effect we observed in the functional assays.
Finally, we evaluated whether this synergistic effect is also relevant to PI-resistant MM patients. To this end, we collected BM samples from a highly resistant PRMM patient (Z01, Methods) and sorted the cells for MARS-seq analysis, confirming that the patient was also positive for the resistance signature 1 (Extended Data Figs. 7a,b and 10f−h). In addition, we seeded, from the same patient, CD138+ and CD138− cells with medium supplemented with CFZ, CsA or CFZ + CsA (Methods). We evaluated the patient’s ex vivo response to these treatments by FACS analysis of apoptotic cells. Mock control-treated CD138+ cells or CD138− cells were viable and healthy. In contrast, we observed a synergistic effect of CFZ + CsA with only 8.4% live cells compared with 23.4% live cells when treating with CFZ alone (*P = 0.0286, exact Wilcoxon’s rank-sum test; n = 4 replicates from patient Z01; Fig. 6h,i). In conclusion, we find that PPIA is directly involved in PI resistance, and that CsA, a PPIA inhibitor, synergizes with PI to overcome resistance mechanisms of MM.
Discussion
Despite the substantial improvement in the development of targeted small molecules and antibody-based therapeutics for MM, we currently lack a thorough understanding of the tumor pathways affected by these agents and how they acquire resistance. As, in cancer and specifically in MM, most patients eventually become therapy resistant, the molecular characterization of resistance pathways is of major importance. Our study demonstrates the potential of combining longitudinal single-cell genomic measurements with clinical trials to accurately define the molecular pathways associated with responsive and resistant patients. We find that common MM drivers are not significantly associated with resistance. In contrast, our study describes a novel MM resistance signature that defines a large subset of the highly therapy-resistant MM patients, characterized by induction of proteasome machinery, mitochondrial stress, ER stress and UPR pathway, and downregulation of PC checkpoint genes. The group of patients expressing this signature is highly correlated with poor clinical outcome and outperforms current risk stratifications based on FISH cytogenetics. Analysis of the CoMMpass data demonstrates that this resistance signature is present in more than 5% of newly diagnosed MM patients and is more prevalent as treatment lines progress. In addition, combining risk stratification based on genetic aberrations with our resistance signature defines a group of patients with a very unfavorable outcome, suggesting that these data are defining different molecular mechanisms of resistance. These MM resistance signatures were externally validated in the CoMMpass study, possibly enabling targeted treatment of MM patients with resistance signatures.
Potentially, some of the genes that are part of the resistance signature we discovered may include druggable targets that have a causal role in the resistance mechanisms of PRMM patients. In support of this hypothesis, the signature includes many genes that are part of the proteasome machinery, ER stress and UPR pathway. One interesting new MM-druggable target gene is PPIA, which is a major hall-mark of the resistance signature we found in the PRMM group, the unresponsive KYDAR patients, as well as unresponsive patients in the CoMMpass study. PPIA is part of the cytosolic protein-folding pathway44, and its upregulation in the resistant patients potentially compensates for the ER stress and apoptotic signaling induced by PIs19,46,47. Supporting this hypothesis, deletion of PPIA in MM cell lines resistant to PI dramatically increased the sensitivity to PI treatment, as well as treatment with a PPIA inhibitor, CsA, synergized with the PI, and was shown to be highly effective and to demonstrate specific tumor killing. As our study defines the molecular signature of highly resistant MM patients, as well as potential targets for these resistance mechanisms beyond PPIA, further elucidation of the roles of these genes in MM resistance is important to generate the next generation of drugs for MM.
Clonal dynamics of the evolving PC clone during the treatment revealed that the acquisition of therapeutic resistance may occur in multiple stages, pre- and post-treatment, or on small clones that later define the patient’s outcome. Using machine learning we show that such data can have a large prognostic value to predict patients’ outcomes for specific treatments. Unfortunately, most patients with MM, which initially responded to anti-myeloma treatment, will eventually become resistant to subsequent treatments. Therefore, it is of the outmost urgency to understand the mechanisms underlying the drug resistance of MM and the dynamically changing clones of PCs during treatment to develop more effective therapeutic strategies. In summary, our study defines a roadmap for combining single-cell genomic profiling with clinical trials, and we anticipate that such studies will facilitate the design of molecularly informed diagnostics, personalized therapy selection and detection of new targets for treatment of myeloma and treatment-resistant myeloma patients.
Methods
Obtaining patient plasma cells from iliac crest aspirates
Patients who met KYDAR clinical trial eligibility criteria (specified below) were recruited to the present study from hematology departments in 14 medical centers in Israel. After informed consent (in accordance with the Helsinki Declaration), BM aspirate was placed in ethylenediaminetetraacetic acid (EDTA)-containing tubes (Beckton Dickenson), diluted 1:1 with ice-cold FACS buffer (2 mM EDTA, pH 8.0, 0.5% bovine serum albumin in phosphate-buffered saline (PBS)), placed on ice and immediately transported to the lab.
Flow cytometry single-cell sorting for MARS-seq v.2.0
BM cells were diluted 2:1 in ice-cold FACS buffer (2 mM EDTA, pH 8.0, 0.5% bovine serum albumin in PBS), washed and strained with a 100-μm strainer. Mononuclear cell separation was performed using density centrifugation media (Ficol-paque, GE Life Sciences) in a 1:1 ratio with marrow cells. Centrifugation (460g, 25 min) was performed at 10 °C, and the mononuclear cells were carefully aspirated and washed with ice-cold FACS buffer. After red blood cell lysis (Sigma-Aldrich) for 5 min at 4 °C and washing, BM cells from relapse-refractory patients were stained with magnetic CD138+ bead enrichment (Miltenyi). Cells were washed and stained with antibodies (all from Cytognos or BD Biosciences): CD38, CD138, CD56, CD19, CD117, CD27, CD45 and CD81. Samples were filtered through a 40-μm strainer before commencing sorting. Single-cell sorting was performed using either FACS SORP-AriaII or AriaFusion (BD Biosciences). After doublet exclusion, CD138+/ CD38+ PCs from baseline samples and CD138+/CD38+ from post-treatment samples were isolated and single-cell index sorted into 384-well, cell-capture plates containing 2 μl of lysis solution and barcoded poly(T) reverse-transcription (RT) primers for scRNA-seq. Four empty wells were kept in each 384-well plate as a no-cell control for data analysis. Immediately after sorting, each plate was spun down to ensure cell immersion into the lysis solution, snap frozen on dry ice and stored at −80 °C until processed. Cells were analyzed using BD FACSDIVA software (BD Biosciences) and FlowJo software.
MARS-seq
Single-cell libraries were prepared as previously described48–50. Briefly, messenger RNA from cells were sorted into barcoded cell-capture plates and converted into complementary DNA, later pooled by using an automated pipeline. The pooled sample is then linearly amplified by T7 in vitro transcription, and the resulting RNA is fragmented and converted into a sequencing-ready library by tagging the samples with pool barcodes and Illumina adapters during ligation, RT and PCR. Each pool of cells was tested for library quality and concentration was assessed as described earlier48–50. Overall, barcoding was done at three levels: cell barcodes allow attribution of each sequence read to its cell of origin, thus enabling pooling; unique molecular identifiers (UMIs) allow tagging of each original molecule to avoid amplification bias; and plate barcodes allow elimination of the batch effect.
Analysis of scRNA-seq data
MARS-seq libraries, pooled at equimolar concentrations, were sequenced using an Illumina NextSeq 500 sequencer, at a sequencing depth of 20,000-50,000 reads per cell. Reads are condensed into the original molecules by counting the same UMIs. We used statistics on empty-well spurious UMI detection to ensure that the batches we used for analysis showed a low level of cross single-cell contamination (<3%). MARS-seq reads were processed as previously described50. Reads were mapped to human reference genome hg38 using HISAT (v.0.1.6); reads with multiple mapping positions were excluded. Reads were associated with genes if they were mapped to an exon, using the UCSC genome browser for reference. Exons of different genes that shared genomic position on the same strand were to be considered a single gene with a concatenated gene symbol.
Metacell modeling for MARS-seq data
To analyze the MARS-seq data from all the samples, we used the MetaCell package26 with the following specific parameters. We removed specific mitochondrial genes and immunoglobulin (Ig) genes. We then filtered cells with either fewer than 300 UMIs or a total fraction of mitochondrial gene expression exceeding 50%. Our data comprised mainly PCs, which express Ig genes, accounting for almost 50% of their transcriptome. In malignant PCs, the expression of Ig genes can change drastically. Hence, the 300-UMI cutoff in our analysis excluded the UMIs of not only mitochondrial genes but also Ig genes, both of which were not used as features for clustering (440 UMIs on average). The 300-UMI cutoff is therefore equivalent to ~750-UMI cutoff without the exclusion. Gene features with high variance to the mean (Tvm) were selected using the parameter Tvm > 0.2 and minimal total UMIs > 100. From the gene features, we excluded high abundance long intervening noncoding (linc) RNA and genes linked with poorly supported transcriptional models (such as genes annotated with the prefix ‘AC[0-9]’, ‘AL[0-9]’, and so on). Annotation of the metacell model was done using the metacell confusion matrix and analysis of marker genes. We identified non-PC cells using straightforward analysis of known cell type markers (for example, COL1A2 (fibroblast cells), TRAC (T cells), C1QA (macrophages), S100A8 (monocytes) and more), and crossvalidation with the existing data from previous work22. Non-PC cells, such as fibroblast cells, monocytes, macrophages and so on, were considered as contamination, and were removed before performing the final clustering. In the final clustering, the gene feature selection strategy described above retained a total of 2,038 genes for the computation of the metacell-balanced similarity graph. We used K = 500 bootstrap iterations. Metacell splitting was performed by clustering the cells within each metacell and splitting it, if distinct clusters are detected.
The 2D projection in the metacell modeling for MARS-seq data
The 2D projection is computed using a force-directed layout algorithm on a balanced similarity graph. First, a raw similarity matrix is generated by computing Pearson’s correlations on the transformed UMI counts of features (genes). Next, the raw similarity matrix is used to generate a weighted adjacency matrix for a weighted, directed cell graph G, in which a heavy edge from cell i to cell j indicates strong attraction of the former to the latter. Then, the balanced similarity graph G is partitioned into metacell graph GM using an adaptation of k-means to graphs with bootstrapping. Finally, the coordinates for each metacell in the 2D projection are computed by applying a standard force-directed layout algorithm to the metacell graph GM, and the cells are positioned by averaging the metacell coordinates of their filtered neighbor cells in the original balanced graph G.
Normalized gene expression
To calculate the normalized gene expression per patient/clone, we first down-sampled total UMI counts of individual cells to the same level (n = 300). To account for the variable cell numbers, for a given patient or PC clone, we randomly sampled 100 cells and calculated the average UMI counts for each gene. Last, we performed the previous step 100 times to estimate the means and distributions of gene expression in each PC clone, and used them as normalized gene expression.
The z-score of the gene expression in malignant PCs from NDMM and PRMM patients
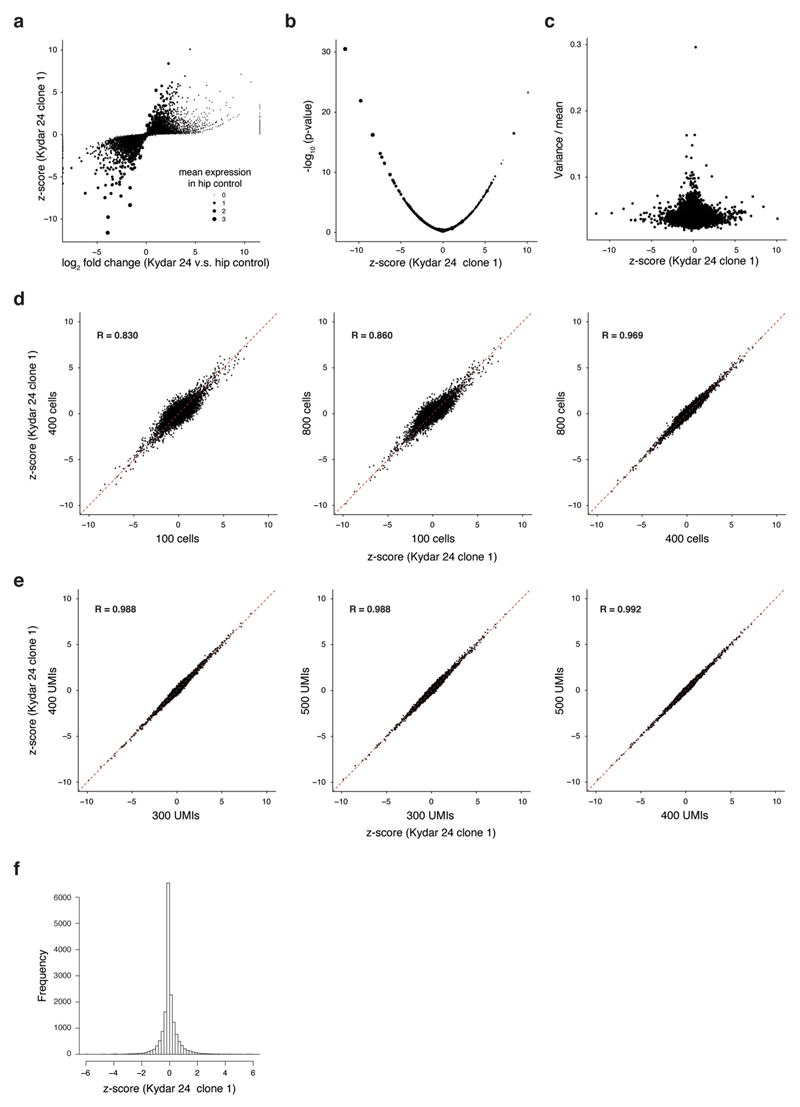
To provide robust estimates of malignant PC gene expression, we calculated a z-score for each gene of each malignant PC clone from individual NDMM and PRMM patients according to the following steps. First, for a given malignant PC clone, we randomly selected 100 cells from the clone and 100 cells from the healthy control group, and we assured that we always selected relatively the same number of healthy PCs from each healthy control donor. Second, we computed a P value using the Mann−Whitney U-test for each gene comparing the normalized UMI counts in the 100 malignant PCs and the 100 healthy PCs. This P value was then converted into a z-score. For each malignant PC clone, we performed the previous 2 steps 100 times to obtain 100 z-scores for each gene, and calculated the average value of the 100 z-scores to represent the relative expression of each gene in the given malignant PC clone, compared with the healthy PCs. Our z-score approach is robust. It does not show bias for the genes with different cell−cell variation. In addition, we down-sampled the number of cells to simulate different numbers of collected cells from the same sample, and the z-scores from the simulated data show very high correlation. We also evaluated the effect of the coverage per cell, by down-sampling the UMIs per cell to different levels, and observed much less variability compared with the effect of the number of cells. We performed the same calculation for all the malignant PC clones.
Detecting differential genes between malignant PCs from two different patient groups
To detect the differential genes between malignant PCs from NDMM and PRMM patients, we compared the z-scores of each gene from the NDMM and PRMM patients. First, for each gene, we calculated a Student’s t-test statistic treal between the expression z-scores of NDMM patients and the expression z-scores of PRMM patients. Second, we shuffled the labels of the z-scores of the gene and calculated a Student’s t-test statistic tbg between the expression z-scores of the shuffled NDMM and PRMM patient groups. We performed the shuffling 10,000 times. Therefore, we can compute an empirical P value for each gene by calculating the frequency of treal > tbg or treal < tbg. We used the same computation method to detect the differential genes between malignant PCs from PRMM responder and nonresponder groups in Fig. 4.
In addition, we used the rich single-cell gene expression information and performed differential gene expression analysis by comparing cells from NDMM and PRMM patients. The same numbers of cells were sampled from each patient from each group. A z-score statistics was computed for each gene using Wilcoxon’s rank-sum test on the down-sampled UMI counts from the cells of NDMM and PRMM patient groups. The z-score statistics, zmean, for each gene was calculated by randomly repeating the sampling procedure 100 times. Then, the zmean values were converted into P values, and we performed multiple testing correction on the P values using a standard Benjamini-Hochberg procedure and controlled for the FDR q value < 0.05.
Cross-referencing with known myeloma datasets
We calculated the module-1 gene score for each patient from the MMRF’s CoMMpass Interim Analysis 14 (n = 908 patients with clinical and RNA-seq data) using the normalized gene expression table of Salmon v.7.2-filtered gene transcripts per million (TPM). The score was defined as the average log(transformed TPM) of the 25 genes comprising module 1. We defined patients with a module-1 score >202.23 (which is the mean + 2 s.d.) as high module 1. We compared the distribution of several potential clinical and biological covariates within the CoMMpass dataset, between patients with module-1 high and low expression. The impact of the module-1 signature on clinical outcomes was analyzed using the Kaplan−Meier (KM) method. In addition, we constructed a predictive model that integrates clinical, biologically established predictors as well as the module-1 signature. We initially constructed a Cox’s model with two blocks: the first block included the established predictors using a ‘forward’ method and the second block included module 1 only using an ‘enter’ method.
Shallow neural network model to predict treatment response
To predict the response to treatment, we trained a shallow neural network with 10 hidden layers using the Matlab R2018A deep learning toolbox. For each patient, we trained a separate model on the entire cohort, excluding the target patient (leave-one-out strategy). The model was trained on the integer single-cell matrix down-sampled to 500 UMIs per cell using 2,038 variable genes as features. We used ‘trainscg’ as the network training function that updates weight and bias values, according to the scaled conjugate gradient method with default values. The network performance was calculated using the ‘crossentropy’ function with a 90:10 training:validation ratio. The final score was obtained for each cell by applying the network on the target patient’s cells, displayed as a boxplot showing the median value and 0.25 and 0.75 quantiles for each sample/patient.
Gene module score at single-cell and metacell levels
Given any list of gene modules, we defined the module scores for each single cell by averaging the log2(UMI×7 + 1), and we defined the module scores for each metacell by averaging the metacell log(enrichment scores) (lfp values) of the genes in the set. Note that, by using this approach, we limited the contribution of highly expressed genes to the score. At the single-cell level, the calculation overcame the sparseness of experimental detection. At the metacell level, we relied on the regularization of the metacell computation of gene enrichment scores to restrict the noise levels inflicted over the gene module scores. We used the same computation method to calculate the resistance signature score in Fig. 4.
Cell proliferation assays
Myeloma cell lines were seeded in 96-well, round-bottomed microplates at a density of 5 × 10⁴ cells per well and incubated with or without drugs for 48 h at 37 °C. After incubation, MTS tetrazolium compound (CellTiter 96 AQueous One Solution Cell Proliferation Assay; Promega) was added and the cells were incubated for 2−4 h. The absorbance was measured at a wavelength of 490 nm using a microplate reader (Synergy H1 microplate reader BioTek) and expressed as a percentage of the value of the corresponding untreated cells.
Myeloma cell lines and drug combination treatments
RPMI-8226 and U266 myeloma cell lines were purchased from the American Type Culture Collection (ATCC). Cells were cultured using an aseptic technique in RPMI medium (Gibco) supplemented with 10% heat-inactivated fetal bovine serum, 1 mM sodium pyruvate, 2 mM L-glutamine and 1% penicillin-streptomycin (Thermo Fisher Scientific). Cells were stored in 10- to 50-ml flasks (Corning) in an incubator (Thermo Fisher Scientific) with humidified air and 5% CO2, at 37 °C and a concentration of (0.5−1.0) × 106 ml−1. Cell lines were validated for lack of Mycoplasma infection using primers for the Mycoplasma-specific 16S ribosomal RNA gene region (EZ-PCR Mycoplasma Kit, Biological Industries). CFZ and CsA were purchased from LC Laboratories.
Dose−response assays
MTS assays were used as previously described to establish dose-response curves and to determine the IC50 of single-dose CFZ or CsA and the combination for each cell line. CFZ and CsA were administered at plating with a serial dilution starting at doses of 500 nM and 50 μg, in assay buffer, respectively. Cells were harvested at 48 h to determine the IC50 of each single drug. The CsA IC50 of both cell lines (1.5 μg) was used at a fixed concentration to determine synergism with CFZ. IC50 values for CFZ are 28 nM in an RPMI-8226 cell line and 31 nM in a U266 cell line. IC50 values for CsA and CFZ were consistently used in all in vitro and ex vivo experiments.
IC50 analysis
IC50 values were derived by a dose-response inhibition (variable slope) curve and were fitted using nonlinear regression a GraphPad Prism software. The reported data are the average of three independent experiments. The extra sum-of-squares F test was used to test whether IC50 values differed between groups using GraphPad Prism (GraphPad Software, Inc.).
PPIA guide RNA cloning and lentivirus production
For single-guide RNA (sgRNA) targeting PPIA expression, we used the lentiviral LentiCRISPR v.2 backbone vector (Addgene, catalog no. 52961). LentiCRISPR v.2 vector was digested with the restriction enzyme FastDigest Esp3I (Thermo Fisher Scientific, catalog no. FD0454) and guide RNAs were inserted using the Gibson assembly reaction. PPIA guide and control RNA lentiviral particles were produced by transfecting 293T cells together with packaging plasmids, using the jetPEI transfection reagent (Polyplus transfection) according to the manufacturer’s instructions and following the standard lentivirus production protocol51. Medium was replaced with RPMI medium without additives 18 h post-transfection, and medium containing virus particles was collected 48 and 72 h post-transfection.
PPIA−/− knock-out RPMI-8226 cell-line generation
RPMI-8226 human MM cell line (ATCC, catalog no. CCL-155) was stably infected with lentiviral LentiCRISPR v.2 expressing CAS9 gene and sgRNAs targeting PPIA or control lentivirus, and selected using puromycin antibiotic, 10 μg ml−1. PPIA knock-out was validated by quantitative (q)PCR and western blotting.
| Guide RNA name | sgRNA target sequence |
|---|---|
| sgRNA-PPIA-1 | CGTACCTGACACATAAACCC |
| sgRNA- PPIA-2 | GACAAGGTCCCAAAGACAGC |
| sgRNA- PPIA-3 | GAACTTCATCCTAAAGCATA |
| sgRNA- PPIA-4 | CGCCGCCCGCCCGACCTCAA |
FACS analysis quantifying apoptosis and cell death
Myeloma cell lines were seeded and incubated in 96-well plates as described earlier, with different treatments: cells only, CFZ only (IC50) and combined treatment (CsA IC50 + CFZ IC50). Cells were then harvested and centrifuged for 5 min at 300g and 4 °C. Cells were washed twice with cold BioLegend cell-staining buffer (catalog no. 420201) and then were resuspended in 50 μl of annexin V-binding buffer (BioLegend, catalog no. 422201) and were stained with 1 μl of FITC annexin V. Cells were gently vortexed and incubated for 15 min at 25 °C in the dark. Then, 2 μl of propidium iodide solution (Sigma-Aldrich, catalog no. P4864, 1:50) was added in the last 5 min of staining. Cells were centrifuged for 5 min at 300g and 4 °C, and resuspended in 50 μl of annexin V-binding buffer. Cells were analyzed for proliferation using LSRII FACS analyzer (BD Biosciences) and FlowJo software.
Immunofluorescence analysis of apoptosis and cell death
Myeloma cell lines were seeded and incubated in 96-well plates as previously described, with different treatments: cells only, CFZ only (IC50) and combined treatment (CsA IC50 + CFZ IC50). Cells were then harvested and centrifuged for 5 min at 300g and 4 °C. Cells were washed twice with cold BioLegend cell-staining buffer (catalog no. 420201) and were then resuspended in 50 μl of annexin V-binding buffer (BioLegend, catalog no. 422201) and stained with 1 μl of FITC annexin V. Cells were gently vortexed and incubated for 15 min at 25 °C in the dark; 2 μl of propidium iodide solution (Sigma-Aldrich, catalog no. P4864, 1:50) was added in the last 5 min of staining, and 35 μl of 16% formaldehyde solution (Thermo Fisher Scientific, catalog no. 28906) was directly added and gently mixed using a pipette; cells were then incubated for 10 min at 25 °C in the dark. Cells were centrifuged for 5 min at 300g and 4 °C, and were resuspended with 100 μl of cold BioLegend cell-staining buffer and 1.2 μl of 10% PBST (PBS + Triton X-100, Sigma-Aldrich, catalog no. T8787), and was gently mixed and incubated for 5 min at 25 °C in the dark. For detection of cell nuclei, 4′,6-diamidino-2-phenylindole (DAPI) was added for 2 min. After spin down, all the cells were applied to slides, mounted with SlowFade Diamond Antifade Mountant (Thermo Fisher Scientific, catalog no. S36963) and sealed with coverslips. Microscopic analysis was performed using a laser-scanning confocal microscope (Zeiss, catalog no. LSM880). Images were acquired and processed by Imaris software; all the thresholds are fixed through the whole experiment (Bitplane).
RNA-seq analysis of treated cell lines
The RPMI-8226 MM cell line was seeded and incubated on 96-well plates with different treatments: cells only, CFZ only (IC50), CsA only (IC50) and combined treatment (CsA IC50 + CFZ IC50) for 4 h and 8 h. Cells were then harvested and centrifuged for 5 min at 300g and 4 °C. Cells were resuspended with MACS buffer and filtered through a 40-μm strainer before commencing sorting. Single-cell sorting was performed using Aria (BD Biosciences). After doublet exclusion, cells were single-cell sorted into 384-well, cell-capture plates containing 2 μl of lysis solution and barcoded poly(T) RT primers for scRNA-seq, as described earlier.
Ex vivo analysis of primary cells from MM patients
BM cells from a relapse-refractory myeloma patient (penta-refractory, refractory to bortezomib and CFZ) were stained with magnetic CD138+ enrichment beads (Miltenyi). Cells were washed and resuspended in RPMI-1640 medium (Gibco) supplemented with 15% fetal bovine serum, 1% glutamine and 1% penicillin-streptomycin (Thermo Fisher Scientific). CD138+ and BM mononuclear cells (CD138− cells) were counted and seeded at 2 × 10⁵ in a 12-well culture plate with CFZ, CsA or a combination (CFZ + CsA) for 15 h at 37 °C in a culture incubator. Cells were then harvested and centrifuged for 5 min at 300g and 4 °C. Cells were washed with cold BioLegend cell-staining buffer, then resuspended in 50 μl of annexin V-binding buffer and stained with 2 μl of FITC annexin V. Cells were gently vortexed and incubated for 15 min at 25 °C in the dark, and DAPI was added for 2 min. Cells were centrifuged for 5 min at 300g and 4 °C and resuspended with 50 μl of annexin V-binding buffer. Cells were analyzed for proliferation using an LSRII FACS analyzer and FlowJo software.
Western blot validation for RPMI-8226 cell line PPIA−/− knock-out
Cells lysates were prepared in ice-cold radioimmunoprecipitation assay buffer with protease inhibitors. Total protein, 20 μg, was separated by sodium dodecylsulfate−polyacrylamide gel electrophoresis and transferred on to nitrocellulose membranes (Thermo Fisher Scientific). Analysis was further performed according to a standard procedure using anti-human PPIA antibody (catalog no. ab41684, Abcam), anti-βI-tubulin antibody (catalog no. ab179511, Abcam) and anti-rabbit horseradish peroxidase-conjugated secondary antibody (catalog no. ab205718, Abcam), followed by ECL visualization.
RT-qPCR for PPIA expression
The mRNA from cell lines was captured with Dynabeads oligo(dT) (Invitrogen), washed and eluted at 85 °C with 10 mM Tris-Cl, pH 7.5. The mRNA was reverse transcribed using SuperScript II (Thermo Fisher Scientific) and cDNA was diluted 1:40 for qPCR measurement using the different gene primers. The sequences of forward and reverse primers were, respectively, for PPIA_F (5′-GGCAAATGCTGGACCCAACACA-3′) and PPIA_R (5′-TGCTGGTCTTGCCATTCCTGGA-3′). The control sample was amplified under the same conditions with human glyceraldehyde 3-phosphate dehydrogenase (GAPDH) primers. The sequence of the forward and reverse primers for GAPDH was TCCCCCACCACACTGAATCT and ACAAGGTGCGGCTCCCTA, respectively.
KYDAR clinical trial
Eligibility criteria
Patients were aged ≥18 years, had documented myeloma as per the International Myeloma Working Group (IMWG) criteria52 and had started a bortezomib-based induction with corticosteroids, with or without alkylators, with or without immunomodulatory imide drugs (IMiDs: thalidomide lenalidomide or pomalidomide), 24 months before study enrollment, and not received any second-line treatment. Patients, who failed to achieve a minimal response (MR) after two cycles or a PR, after four cycles of a bortezomib-containing therapy (cohort A) or progressed within 18 months from induction treatment start (response defined by IMWG criteria; cohort B), had measurable disease at the time of enrollment as per the IMWG criteria. Patients were not planned for autologous stem cell transplantation (ASCT): determined by investigator to be either transplantation ineligible or post-ASCT, and progressed within 18 months from induction treatment start or failed to achieve at least PR post-ASCT. Patients were required to have hemoglobin ≥ 8 g dl−1, absolute neutrophil count ≥ 1.5 × 10⁹l−1, platelet count ≥ 50,000 mm−3 (or 30,000 mm−2 if myeloma BM involvement >50%), aspartate aminotransferase and alanine aminotransferase ≤3.0× the upper limit of normal, calculated or measured creatinine clearance ≥ 20 ml min−1 and left ventricular ejection fraction ≥ 40%. Patients were excluded if they had a diagnosis of monoclonal gammopathy of undetermined significance, smoldering MM, amyloidosis or Waldenström’s disease. The study excluded patients with chronic obstructive pulmonary disease (with a forced expiratory volume in 1 s that was 50% of predicted normal), moderate, severe or uncontrolled asthma, or substantial heart disease or active infection.
Study design
This is an open-label, non-randomized, single-arm, multicenter, prospective clinical and translational trial, in patients with MM who received a bortezomib-based induction and either failed to achieve a timely response (<4 months) or progressed early (<18 months) after therapy initiation. Patients were treated with a quadruple regimen comprising: daratumumab 16 mg kg−1 weekly during cycles 1−2, every 14 d during cycles 3−6, and thereafter monthly (first dose in cycle 1 may be split over 2 d); once-weekly intravenous (i.v.) CFZ on days 1, 8 and 15 of cycle numbers 1−9 and days 1 and 15 only of cycle numbers 10-18, at a dose of 20 mg m−2 on day 1 of cycle 1 and a dose of 56 mg m−2 on all subsequent once-weekly dosing days, alongside concomitant treatment with twice-weekly 20 mg of i.v. or oral dexamethasone administered on days 1−2, 8−9, 15−16 and 22−23 of a 28-d cycle, for cycles 1−2, followed by weekly 20 mg of dexamethasone on subsequent cycles; and oral lenalidomide 25 mg, administered on days 1−21 of a 28-d cycle (DARA−KRD). Frail patients (as per the IMWG recommendations5) received lenalidomide dose adjustment to 15 mg, and dexamethasone at 10 mg × 2-week in cycles 1 and 2, followed by 10 mg per week for subsequent cycles. The quadruple regimen is administered for 18 cycles, followed by long-term follow-up in which patients will receive standard-of-care treatment (lenalidomide maintenance or lenalidomide-daratumumab). Preinfusion medications included diphenhydramine (or equivalent), paracetamol and montelukast.
Study endpoints and analyses
The primary endpoints are the safety and tolerability of DARA-KRD. Safety evaluations included AE monitoring, physical examinations, electrocardiogram monitoring, clinical laboratory tests, vital sign measurements and Eastern Cooperative Oncology Group performance status. Toxicities were graded using the National Cancer Institute Common Terminology Criteria for Adverse Events v.4 (CTCAE). AEs were collected and reported from the time the patient signed informed consent and through the 30 d after the last dose of the study treatment, or after this time period if considered to have a reasonable possibility of being associated with the study drug. Study safety and tolerability were assessed by the investigators within the study steering committee, as well as the independent data safety monitoring board, which oversaw the study. Secondary endpoints include ORR, defined as the proportion of patients whose best response is at least PR, according to the IMWG criteria, that is, stringent CR, CR, VGPR or PR; PFS is defined as the time from study treatment initiation (that is, cycle 1, day 1) to the earlier disease progression or death due to any cause, and OS as the time from study treatment initiation to date of death (whatever the cause). Response to treatment and disease progression were evaluated according to the IMWG response criteria at the end of each odd-numbered treatment cycle. M-protein measurements in serum and urine were assessed by each center’s local laboratory. Serum and urine immunofixation electrophoresis (IFE) were performed at screening and when a CR was suspected. A daratumumab-specific IFE assay was used to confirm CR for patient samples in which daratumumab interference with IFE was suspected. The response evaluable analysis set included patients who received at least one cycle of DARA-KRD and had at least one post-baseline response assessment.
Single-cell transcriptional analysis is performed on samples of BM aspirate obtained at study enrollment (after a minimal washout of 5 d from induction therapy), and 3 and 9 months, to confirm CR or progressive disease (PD). Fresh samples were delivered at 4 °C within 90 min for PC separation and scRNA analysis.
Statistical analysis
All statistical analyses were conducted using R software (R Foundation for Statistical Computing), GraphPad Prism (GraphPad Software, Inc.) or SPSS software (IBM SPSS Statistics for Windows, v.25, IBM Corp.).
Statistical analysis data were presented as the mean (± s.e.m.) of three independent experiments. Comparisons between two groups of samples were evaluated using the Student’s t-test or Wilcoxon’s rank-sum test (Mann-Whitney U-test). All P values reported were two tailed and statistical significance was defined as P < 0.05.
A sample size of 40 was proposed to provide sufficient safety and preliminary efficacy data, and enable detection of transcriptional patterns associated with therapy resistance and response. Descriptive statistics for TEAEs were summarized, including AEs of clinical interest: IRRs, infections and cardiac function. Responses were categorized per the IMWG criteria.
PFS and OS were documented. Continuous variables were described as the median and range of observations. Categorical data were described with contingency tables including frequency and percentage. Median length of follow-up was observed using a reverse censoring method. The median survival time and the probabilities of OS and PFS were estimated using the KM method with the use of the logrank test. HRs and corresponding 95% CIs were estimated with the use of Cox’s regression model. Cox’s regression was performed with two blocks; in the first block, double hit was included in the model and, in the second block, module 1 was added. Nagelkerke’s R2 was calculated for the first and second blocks and was compared by the change in −2log(likelihood).
Extended Data
Extended Data Fig. 1. Sorting strategy of plasma cells and overview single cell data collection from the patients.
a-c, Flow cytometry plots showing sorting strategy (CD38+CD138+) for plasma cells after doublet exclusion from 3 representative patients. Plots were generated using FlowJo software. (Methods). d, Schematic diagram showing the statists of patient enrollment to KYDAR clinical trial and their current status.
Extended Data Fig. 2. Overview of quality control and data analysis for the single bone marrow plasma cells.
a, Dot plots showing number of reads, number of UMIs, and percentage of cells analyzed per batch of 384 cells (that were pooled for library construction) for all CD38+CD138+ bone marrow single cells from 66 participants (11 control donors, 15 NDMM patients, and 40 PRMM patients). (Methods). b, Heat map showing clustering analysis of 3,862 ‘contamination’ cells that pass quality control but do not express key plasma genes. Shown are representative genes of non-PC. c, Heat map showing clustering analysis of 51,297 PC sorted from all the 66 participants featuring normalized single cell expression levels of a selected set of most variable genes. Clustering is performed using 2,038 genes as features. d, Heat maps showing clustering analysis of PC from patient KYDAR 21 (left) together with the same number of PC from healthy control group (right) using 1,393 gene features.
Extended Data Fig. 3. The robustness of differential expression z-score.
a, comparison of standard log2 fold change vs. our z-score for patient KYDAR 24 clone 1 relative to healthy control. Size of the dots corresponds to the mean expression (UMIs) in the healthy control samples. b, Scatter plot showing the -log10 p-value from the two-sided Mann-Whitney test and the z-score. c, scatter plot comparing our z-score to variance/mean showing no clear bias with high z-score and cell-cell variability. d, z-score scatter plots comparing different sub-sampling of cells (100, 400 and 800 cells). e, z-score scatter plots comparing different sub-sampling of UMIs per cell (300, 400 and 500 cells). f, The distribution of the z-score from patient KYDAR 24.
Extended Data Fig. 4. Differential expression and functional enrichment analyses comparing NDMM and PRMM patients.
a, Volcano plot showing a selected set of differential genes between NDMM and PRMM patients. X axis showing the difference between the average z-score of NDMM patients and PRMM patients; Y axis showing the -log10 p-value from a bootstrap test using t-statistic (Methods). b, Heat map showing the correlation map of all the differential genes identified between the NDMM and PRMM patients. Genes are clustered using hierarchical clustering. c, Functional enrichment of the 3 gene modules using Metascape. d, Graphical illustration of non-responder overall PI resistant pathway.
Extended Data Fig. 5. Clinical response to DARA-KRD treatment.
a, Distribution of international myeloma working group (IMWG) response grades in KYDAR trial. b, Waterfall plot shows the best overall responses according to the IMWG in MM. c,d, Kaplan-Meir curve showing the progression free survival (panel c) and overall survival (panel d) of PRMM patients treated with DARA-KRD.
Extended Data Fig. 6. Differential expression analysis of DARA-KRD resistant patients.
a, Volcano plot showing a selected set of differential genes between PRMM responder group and PRMM non-responder group. X axis showing the difference between the average z-score of PRMM responder group and PRMM non-responder group; Y axis showing the log10 p-value from a bootstrap test using t-statistic (Methods). b, Scatter plot on the left showing the overlap between gene module 1 in Fig. 2a and resistance signature 1 in Fig. 4a. X axis showing the difference between the average z-score of NDMM patients and PRMM patients; Y axis showing the difference between the average z-score of PRMM responder group and PRMM non-responder group. Scatter plot on the right showing the same as the left one, but for gene module 3 and resistance signature 2. c, Venn diagram showing the overlap between the PRMM patient groups classified in Fig. 2a and PRMM responder and non-responder groups.
Extended Data Fig. 7. Longitudinal data collection of PRMM patients.
a, Representative flow cytometry plots showing sorting strategy (CD38+CD138+) for post treatment patients’ plasma cells after doublet exclusion, same as in Extended Data Fig. 1a, but for the samples from patient KYDAR 10 after 4 cycles DARA-KDR treatment. b, Same as in panel a, but for patient KYDAR 10 after 10 cycles DARA-KDR treatment. c, Heat map depicting the relative frequency of the immunoglobulin sequences for each clone (including 11 control donor and 15 newly diagnosed patients); left, bottom, immunoglobulin heavy chain constant region (IGHC); middle, immunoglobulin light chain constant region (IGKC and IGLC); right, immunoglobulin light chain variable region (IGKV and IGLV).
Extended Data Fig. 8. Longitudinal single cell analysis of MM patients pre- and post-treatment.
a, Upper part showing 2D projection of malignant PC of patient KYDAR 21, including healthy PC as reference, highlighting all cells (left), cells collected from baseline (middle left), cells collected from Cycle 4 (middle right), cells collected from Cycle 10 (right). The color of the cells represents healthy PC, and malignant clone 1, 2, and 3. Lower part showing 2D projection of expression of a selected set of differential genes over the metacell model. b, Heatmap showing clone composition in each sample from the patient KYDAR 21 and expression of selected differential genes in each clone. (c) and (d) showing the same as panel (a) and (b), but for patients KYDAR 34 with corresponding samples and clones. (e) and (f) showing the same as panel a and b, but for patients KYDAR 30 with corresponding samples and clones. g, The dynamics of S100A11 (left) and S100A10 (right) expression in individual patients during DARA-KRD treatment.
Extended Data Fig. 9. CsA potentiates Carfilzomib and induced cell death in myeloma cell lines.
a, Graphical illustration of PRMM non-responder resistant pathway, highlighting PPIA. b, Bar plots showing normalized RNAseq PPIA gene transcription in MM cell lines, highlighted in red lines − RPMI-8226 and U266 cell lines (Methods). c, Barplot showing PPIA mRNA levels measured by qPCR in RPMI-8226 PPIA+/+ and PPIA-/-. d, Western blot of PPIA protein levels in RPMI-8226 PPIA+/+ and PPIA-/- cell lines. Shown are cropped western blots of PPIA protein levels in RPMI-8226 PPIA+/+ and PPIA-/- cell lines (tubulin is used as control). Full image can be found in raw data section. Western Blot experiment was conducted once with 3 successful replicates per cell line group. e, Dose-response curves to determine the half maximal inhibitory concentrations (IC50) of CsA in RPMI-8226 and U266 cell lines (Methods). The dose-response curves and IC50 values were determined by a non-linear regression fit. Results are shown as the mean±SEM (Standard Error of the Mean) of 3 independent experiments. f, Immunofluorescence staining of RPMI 8226 (upper) and U266 (lower) cell lines post treatment with Carfilzomib or in combination with CsA for 48h. DAPI (Blue) staining for control live cells, Propidium Iodide (Red) staining for late apoptosis (death), FITC (Green) staining for early apoptosis, and merged gate showing all staining. Representative images from two independent experiments are shown. g, Dose-response curves to determine the half maximal inhibitory concentrations (IC50) of CsA in RPMI-8226 PPIA+/+ and PPIA-/- cell lines (Methods). Results are shown as the mean±SEM (Standard Error of the Mean) of 3 independent experiments.
Extended Data Fig. 10. Cyclosporin A, known inhibitor for PPIA shown synergistic effect with the proteasome inhibitor carfilzomib.
a, Representative flow cytometry plots showing sorting strategy for single RPMI-8226 cells. b, 2D projection showing metacell analysis of scRNA-seq of RPMI-8226 cells during CsA, CFZ, and CFZ+CsA treatment at 4 h and 8 h. Different cell states are indicated by colors. c, 2D projection showing the distribution of the cells (down sampled to 299 cells) in each sample over the metacell map in panel b. d, heatmap showing z-score of differentially expressed genes in each cell state. e, gene ontology enrichment of the 115 up regulated genes and 78 down regulated genes. f, Heatmap depicting the z-score of resistance signature 1 and 2 (Fig. 4a) genes in 15 NDMM, 21 PRMM responder, and 7 PRMM non-responder patients, together with ex-vivo cells of one highly resistant PRMM patient Z01. g, barplot showing scores of resistance signature 1 in 15 NDMM, 21 PRMM responder, and 7 PRMM non-responder patients, together with one resistant PRMM patient Z01. h, barplot showing Z-scores of PPIA expression in the same NDMM and PRMM patients in panel g, together with the resistant PRMM patient Z01.
Supplementary Material
Reporting Summary.
Further information on research design is available in the Nature Research Reporting Summary linked to this article.
Acknowledgements
We thank the following: the patients and their families; the clinical study research teams across all participating sites; the clinical research associates, L. Poor Porges, S. Shaibi and Y. Piltz; N. Lowenton-Spier for managing the study team; K. Bjorklof and F. Suzan from Amgen and A. Grossman from Medison for their support in the setup of the clinical trial; and A. Giladi for a review of the manuscript. We thank T. Wiesel from the Scientific Illustration unit of the Weizmann Institute for artwork, and members of the I. Amit’s lab for fruitful discussions. Extended Data Figs. 4d and 9a were created using BioRender.com. I. Amit is an Eden and Steven Romick Professorial Chair, supported by Merck KGaA, Darmstadt, Germany, the Chan Zuckerberg Initiative, the ISF Israel Precision Medicine Program (IPMP; 607/20, grant no. P128245), the HHMI International Scholar award, the European Research Council Consolidator Grant (ERC-COG; grant no. 724471, HemTree2.0), an SCA award of the Wolfson Foundation and Family Charitable Trust, the Thompson Family Foundation, an MRA Established Investigator Award (no. 509044), the Israel Science Foundation (703/15), the Ernest and Bonnie Beutler Research Program for Excellence in Genomic Medicine, the Helen and Martin Kimmel award for innovative investigation, the NeuroMac DFG/Transregional Collaborative Research Center Grant, an International Progressive MS Alliance/NMSS PA-1604 08459, Dan and Betty Kahn Foundation and an Adelis Foundation grant. Y.C. received an investigator-initiated research grant from Amgen for the present study (AMGEN IIS grant protocal KRD-OW-TA009; REF#20167107). S.-Y.W. is an EMBO long-term fellow (ALTF 263-2018) and received the NWO Rubicon award (019.181EN.038).
Footnotes
Author contributions
Y.C, M.Z., A.W., S.-Y.W. and I. Amit conceived and designed the study. M.Z. performed flow cytometry sorting experiments and other experiments. A.W. and S-Y.W. designed and performed single-cell bioinformatic analyses. Y.C. and I. Avivi collected clinical data and participant samples and supervised the clinical trial. C.B. and M.Z performed in vitro CRISPR experiments. E.L. analyzed clinical data using SPSS. Y.C, M.Z., A.W., S.-Y.W. and I. Amit generated the figures and wrote the manuscript. I. Amit supervised the project. All authors critically reviewed and approved the manuscript before submission.
Competing interests
The clinical trial was an investigator-initiated study (IIS); as such, Y.C. acted as sponsor for the study. The IIS was approved by Amgen, who provided funding and supply of the clinical drug CFZ. Y.C. is a consultant for Janssen, Amgen, Neopharm, Takeda and Madison. A patent application has been filed related to this work. The other authors declare no competing interests.
Additional information
Extended data is available for this paper at https://doi.org/10.1038/s41591-021-01232-w.
Peer review information Javier Carmona was the primary editor on this article, and managed its editorial process and peer review in collaboration with the rest of the editorial team. Peer reviewer reports are available.
Reprints and permissions information is available at www.nature.com/reprints.
Data availability
The scRNA-seq data were deposited at the National Center for Biotechnology Information’s Gene Expression Omnibus with accession no. GSE161195. The IA14 release of CoMMpass data was downloaded from the MMRF researcher gateway portal (https://research.themmrf.org). Source data are provided with this paper.
Code availability
Metacell source code can be found at https://github.com/tanaylab/metacell. Source code used for scRNA-seq analysis can be found at https://bitbucket.org/amitlab/multiple-myeloma-2020/.
References
- 1.Kyle RA, Rajkumar SV. Treatment of multiple myeloma: a comprehensive review. Clin Lymphoma Myeloma. 2009;9:278–288. doi: 10.3816/CLM.2009.n.056. [DOI] [PMC free article] [PubMed] [Google Scholar]
- 2.Palumbo A, Anderson K. Multiple myeloma. N Engl J Med. 2011;364:1046–1060. doi: 10.1056/NEJMra1011442. [DOI] [PubMed] [Google Scholar]
- 3.Yan Y, et al. The impact of response kinetics for multiple myeloma in the era of novel agents. Blood Adv. 2019;3:2895–2904. doi: 10.1182/bloodadvances.2019000432. [DOI] [PMC free article] [PubMed] [Google Scholar]
- 4.Nijhof IS, van de Donk NWCJ, Zweegman S, Lokhorst HM. Current and new therapeutic strategies for relapsed and refractory multiple myeloma: an update. Drugs. 2018;78:19–37. doi: 10.1007/s40265-017-0841-y. [DOI] [PMC free article] [PubMed] [Google Scholar]
- 5.Rajkumar SV. Multiple myeloma: 2020 update on diagnosis, risk-stratification and management. Am J Hematol. 2020 doi: 10.1002/ajh.25791. [DOI] [PubMed] [Google Scholar]
- 6.Majithia N, et al. Outcomes of primary refractory multiple myeloma and the impact of novel therapies. Am J Hematol. 2015;90:981–985. doi: 10.1002/ajh.24131. [DOI] [PMC free article] [PubMed] [Google Scholar]
- 7.Cohen YC, et al. Primary failure of bortezomib in newly diagnosed multiple myeloma—understanding the magnitude, predictors, and significance. Leuk Lymphoma. 2016 doi: 10.3109/10428194.2015.1121258. [DOI] [PubMed] [Google Scholar]
- 8.Corre J, et al. Early relapse after autologous transplant for myeloma is associated with poor survival regardless of cytogenetic risk. Haematologica. 2019 doi: 10.3324/haematol.2019.236588. [DOI] [PMC free article] [PubMed] [Google Scholar]
- 9.Kumar SK, et al. Early relapse after autologous hematopoietic cell transplantation remains a poor prognostic factor in multiple myeloma but outcomes have improved over time. Leukemia. 2018;32:986–995. doi: 10.1016/j.clml.2019.10.014. [DOI] [PMC free article] [PubMed] [Google Scholar]
- 10.Kastritis E, et al. Early relapse post autologous transplant is associated with very poor survival and identifies an ultra high risk group of myeloma patients. Clin Lymphoma Myeloma Leuk. 2020 doi: 10.1016/j.clml.2019.10.014. [DOI] [PubMed] [Google Scholar]
- 11.van de Donk NWCJ, et al. Treatment of relapsed and refractory multiple myeloma in the era of novel agents. Cancer Treatment Rev. 2011;37:266–283. doi: 10.1016/j.ctrv.2010.08.008. [DOI] [PubMed] [Google Scholar]
- 12.Wallington-Beddoe CT, Coghlan DW. In: Update on Multiple Myeloma. Ahmed Al-Anazi K, editor. IntechOpen; 2019. Resistance Mechanisms to Novel Therapies in Myeloma. [DOI] [Google Scholar]
- 13.Krishnan SR, Jaiswal R, Brown RD, Luk F, Bebawy M. Multiple myeloma and persistence of drug resistance in the age of novel drugs (Review) Int J Oncol. 2016;49:33–50. doi: 10.3892/ijo.2016.3516. [DOI] [PubMed] [Google Scholar]
- 14.Niewerth D, et al. Molecular basis of resistance to proteasome inhibitors in hematological malignancies. Drug Resist Update. 2015;18:18–35. doi: 10.1016/j.drup.2014.12.001. [DOI] [PubMed] [Google Scholar]
- 15.Harding T, Baughn L, Kumar S, Van Ness B. The future of myeloma precision medicine: integrating the compendium of known drug resistance mechanisms with emerging tumor profiling technologies. Leukemia. 2019;33:863–883. doi: 10.1038/s41375-018-0362-z. [DOI] [PubMed] [Google Scholar]
- 16.Papadas A, Asimakopoulos F. Handb Exp Pharmacol. Vol. 249. Springer; 2018. Mechanisms of Resistance in Multiple Myeloma; pp. 251–288. [DOI] [PubMed] [Google Scholar]
- 17.Nikesitch N, Ling SCW. Molecular mechanisms in multiple myeloma drug resistance. J Clin Pathol. 2016;69:97–101. doi: 10.1136/jclinpath-2015-203414. [DOI] [PMC free article] [PubMed] [Google Scholar]
- 18.Narayanan S, et al. Targeting the ubiquitin-proteasome pathway to overcome anti-cancer drug resistance. Drug Resist. Update. 2020;48:100663. doi: 10.1016/j.drup.2019.100663. [DOI] [PubMed] [Google Scholar]
- 19.Vincenz L, Jager R, O’Dwyer M, Samali A. Endoplasmic reticulum stress and the unfolded protein response: targeting the Achilles heel of multiple myeloma. Mol Cancer Therapeut. 2013;12:831–843. doi: 10.1158/1535-7163.MCT-12-0782. [DOI] [PubMed] [Google Scholar]
- 20.Ling SCW, et al. Response of myeloma to the proteasome inhibitor bortezomib is correlated with the unfolded protein response regulator XBP-1. Haematologica. 2012;97:64–72. doi: 10.3324/haematol.2011.043331. [DOI] [PMC free article] [PubMed] [Google Scholar]
- 21.Klein AM, Treutlein B. Single cell analyses of development in the modern era. Development. 2019 doi: 10.1242/dev.181396. [DOI] [PubMed] [Google Scholar]
- 22.Ledergor G, et al. Single cell dissection of plasma cell heterogeneity in symptomatic and asymptomatic myeloma. Nat Med. 2018;24:1867–1876. doi: 10.1038/s41591-018-0269-2. [DOI] [PubMed] [Google Scholar]
- 23.Kawano Y, et al. Targeting the bone marrow microenvironment in multiple myeloma. Immunol Rev. 2015;263:160–172. doi: 10.1111/imr.12233. [DOI] [PubMed] [Google Scholar]
- 24.Cohen M, et al. Lung single-cell signaling interaction map reveals basophil role in macrophage imprinting. Cell. 2018;175:1031–1044.:e18. doi: 10.1016/j.cell.2018.09.009. [DOI] [PubMed] [Google Scholar]
- 25.Medaglia C, et al. Spatial reconstruction of immune niches by combining photoactivatable reporters and scRNA-seq. Science. 2017;358:1622–1626. doi: 10.1126/science.aao4277. [DOI] [PMC free article] [PubMed] [Google Scholar]
- 26.Baran Y, et al. MetaCell: analysis of single-cell RNA-seq data using K-nn graph partitions. Genome Biol. 2019;20:206. doi: 10.1186/s13059-019-1812-2. [DOI] [PMC free article] [PubMed] [Google Scholar]
- 27.Bergsagel PL, et al. Cyclin D dysregulation: an early and unifying pathogenic event in multiple myeloma. Blood. 2005;106:296–303. doi: 10.1182/blood-2005-01-0034. [DOI] [PMC free article] [PubMed] [Google Scholar]
- 28.Zhan F, et al. The molecular classification of multiple myeloma. Blood. 2006;108:2020–2028. doi: 10.1182/blood-2005-11-013458. [DOI] [PMC free article] [PubMed] [Google Scholar]
- 29.Khan R, et al. Four genes predict high risk of progression from smoldering to symptomatic multiple myeloma (SWOG s0120) Haematologica. 2015;100:1214–1221. doi: 10.3324/haematol.2015.124651. [DOI] [PMC free article] [PubMed] [Google Scholar]
- 30.Decaux O, et al. Prediction of survival in multiple myeloma based on gene expression profiles reveals cell cycle and chromosomal instability signatures in high-risk patients and hyperdiploid signatures in low-risk patients: a study of the Intergroupe Francophone du Myelome. J Clin Oncol. 2008;26:4798–4805. doi: 10.1200/JCO.2007.13.8545. [DOI] [PubMed] [Google Scholar]
- 31.Shaughnessy JD, et al. A validated gene expression model of high-risk multiple myeloma is defined by deregulated expression of genes mapping to chromosome 1. Blood. 2007;109:2276–2284. doi: 10.1182/blood-2006-07-038430. [DOI] [PubMed] [Google Scholar]
- 32.Shaughnessy JD, et al. Pharmacogenomics of bortezomib test-dosing identifies hyperexpression of proteasome genes, especially PSMD4, as novel high-risk feature in myeloma treated with total therapy 3. Blood. 2011;118:3512–3524. doi: 10.1182/blood-2010-12-328252. [DOI] [PMC free article] [PubMed] [Google Scholar]
- 33.Jakubowiak AJ, et al. Daratumumab (DARA) in combination with carfilzomib, lenalidomide, and dexamethasone (KRd) in patients (pts) with newly diagnosed multiple myeloma (MMY1001) an open-label, phase 1b study. J Clin Oncol. 2017;35:8000. [Google Scholar]
- 34.Landgren O, et al. Bone marrow-based and longitudinal blood-based MRD tracking in newly diagnosed multiple myeloma patients treated with daratumumab, carfilzomib, lenalidomide and dexamethasone (DKRd): a correlative and clinical phase II study. Blood. 2018;132:3281. [Google Scholar]
- 35.Chari A, et al. Daratumumab (DARA) in combination with carfilzomib, lenalidomide, and dexamethasone (KRd) in patients with newly diagnosed multiple myeloma (MMY1001) updated results from an open-label, phase 1b study. Blood. 2017;130:3110. [Google Scholar]
- 36.Van De Donk NWCJ, Usmani SZ. CD38 antibodies in multiple myeloma: mechanisms of action and modes of resistance. Front Immunol. 2018;9:2134. doi: 10.3389/fimmu.2018.02134. [DOI] [PMC free article] [PubMed] [Google Scholar]
- 37.Krejcik J, et al. Daratumumab depletes CD38+ immune regulatory cells, promotes T-cell expansion, and skews T-cell repertoire in multiple myeloma. Blood. 2016;128:384–394. doi: 10.1182/blood-2015-12-687749. [DOI] [PMC free article] [PubMed] [Google Scholar]
- 38.Robak P, Drozdz I, Szemraj J, Robak T. Drug resistance in multiple myeloma. Cancer Treat. Rev. 2018;70:199–208. doi: 10.1016/j.ctrv.2018.09.001. [DOI] [PubMed] [Google Scholar]
- 39.Tsvetkov P, et al. Mitochondrial metabolism promotes adaptation to proteotoxic stress. Nat Chem Biol. 2019;15:681–689. doi: 10.1038/s41589-019-0291-9. [DOI] [PMC free article] [PubMed] [Google Scholar]
- 40.Greaves M, Maley CC. Clonal evolution in cancer. Nature. 2012;481:306–313. doi: 10.1038/nature10762. [DOI] [PMC free article] [PubMed] [Google Scholar]
- 41.Keats JJ, et al. Clonal competition with alternating dominance in multiple myeloma. Blood. 2012;120:1067–1076. doi: 10.1182/blood-2012-01-405985. [DOI] [PMC free article] [PubMed] [Google Scholar]
- 42.Khoo WH, et al. A niche-dependent myeloid transcriptome signature defines dormant myeloma cells. Blood. 2019;134:30–43. doi: 10.1182/blood.2018880930. [DOI] [PubMed] [Google Scholar]
- 43.Nigro P, Pompilio G, Capogrossi MC, Cyclophilin A. a key player for human disease. Cell Death Dis. 2013;4:e888. doi: 10.1038/cddis.2013.410. [DOI] [PMC free article] [PubMed] [Google Scholar]
- 44.Kyu JC, et al. Overexpressed cyclophilin A in cancer cells renders resistance to hypoxia- and cisplatin-induced cell death. Cancer Res. 2007;67:3654–3662. doi: 10.1158/0008-5472.CAN-06-1759. [DOI] [PubMed] [Google Scholar]
- 45.Matsuda S, Koyasu S. Mechanisms of action of cyclosporine. Immunopharmacology. 2000;47:119–125. doi: 10.1016/s0162-3109(00)00192-2. [DOI] [PubMed] [Google Scholar]
- 46.Nikesitch N, Lee JM, Ling S, Roberts TL. Endoplasmic reticulum stress in the development of multiple myeloma and drug resistance. Clin Transl Immunol. 2018;7:e1007. doi: 10.1002/cti2.1007. [DOI] [PMC free article] [PubMed] [Google Scholar]
- 47.Lee J, Kim SS. An overview of cyclophilins in human cancers. J Int Med Res. 2010;38:1561–1574. doi: 10.1177/147323001003800501. [DOI] [PubMed] [Google Scholar]
- 48.Jaitin DA, et al. Massively parallel single-cell RNA-seq for marker-free decomposition of tissues into cell types. Science. 2014;343:776–779. doi: 10.1126/science.1247651. [DOI] [PMC free article] [PubMed] [Google Scholar]
- 49.Paul F, et al. Transcriptional heterogeneity and lineage commitment in myeloid progenitors. Cell. 2015;163:1663–1677. doi: 10.1016/j.cell.2015.11.013. [DOI] [PubMed] [Google Scholar]
- 50.Keren-Shaul H, et al. A unique microglia type associated with restricting development of Alzheimer’s disease. Cell. 2017;169:1276–1290.:e17. doi: 10.1016/j.cell.2017.05.018. [DOI] [PubMed] [Google Scholar]
- 51.Klages N, Zufferey R, Trono D. A stable system for the high-titer production of multiply attenuated lentiviral vectors. Mol Ther. 2000;2:170–176. doi: 10.1006/mthe.2000.0103. [DOI] [PubMed] [Google Scholar]
- 52.Kumar S, et al. International Myeloma Working Group consensus criteria for response and minimal residual disease assessment in multiple myeloma. Lancet Oncol. 2016;17:e328–e346. doi: 10.1016/S1470-2045(16)30206-6. [DOI] [PubMed] [Google Scholar]
Associated Data
This section collects any data citations, data availability statements, or supplementary materials included in this article.
Supplementary Materials
Data Availability Statement
The scRNA-seq data were deposited at the National Center for Biotechnology Information’s Gene Expression Omnibus with accession no. GSE161195. The IA14 release of CoMMpass data was downloaded from the MMRF researcher gateway portal (https://research.themmrf.org). Source data are provided with this paper.
Metacell source code can be found at https://github.com/tanaylab/metacell. Source code used for scRNA-seq analysis can be found at https://bitbucket.org/amitlab/multiple-myeloma-2020/.


