Abstract
SARS-CoV-2, like other coronaviruses, builds a membrane-bound replication organelle (RO) to enable RNA replication1. The SARS-CoV-2 RO is composed of double membrane vesicles (DMVs) tethered to the endoplasmic reticulum (ER) by thin membrane connectors2, but the viral proteins and the host factors involved are currently unknown. Here we identify the viral non-structural proteins (NSPs) that generate the SARS-CoV-2 RO. NSP3 and NSP4 generate the DMVs while NSP6, through oligomerization and an amphipathic helix, zippers ER membranes and establishes the connectors. The NSP6ΔSGF mutant, which arose independently in the α, β, γ, η, ι and λ variants of SARS-CoV-2, behaves as a gain-of-function mutant with a higher ER-zippering activity. We identified three main roles for NSP6: to act as a filter in RO-ER communication allowing lipid flow but restricting access of ER luminal proteins to the DMVs, to position and organize DMV clusters, and to mediate contact with lipid droplets (LDs) via the LD-tethering complex DFCP1-Rab18. NSP6 thus acts as an organizer of DMV clusters and can provide a selective track to refurbish them with LD-derived lipids. Importantly, both properly formed NSP6 connectors and LDs are required for SARS-CoV-2 replication. Our findings, uncovering the biological activity of NSP6 of SARS-CoV-2 and of other coronaviruses, have the potential to fuel the search for broad antiviral agents.
SARS-CoV-2 extensively rearranges host cellular membranes into ROs that provide a microenvironment conducive to RNA synthesis and protection from host sensor/defense systems1,2. The 16 viral NSPs, released from polyproteins pp1a and pp1ab by two viral proteases, include 13 cytosolic proteins, involved in RNA replication, and three trans-membrane proteins, NSP3, NSP4 and NSP6. Studies on other coronaviruses suggest that NSP3 and NSP4, with a hitherto undefined contribution of NSP6, are responsible for generating the ROs3–6. Despite significant advances in understanding the ultrastructure of the SARS-CoV-2 RO2,7,8 mechanistic insights into its biogenesis are in their infancy. In particular, there is no information on the role of NSP6 in this process. Of interest, six SARS-CoV-2 “variants of concern” (VoC) (α, β, γ, η, ι9, and λ10) share a three amino acid deletion in NSP6 (SGF), in addition to the more noted mutations in the spike protein, adding further impetus to explore the role of NSP6 in RO biogenesis and SARS-CoV-2 replication.
NSP6 induces ER zippering
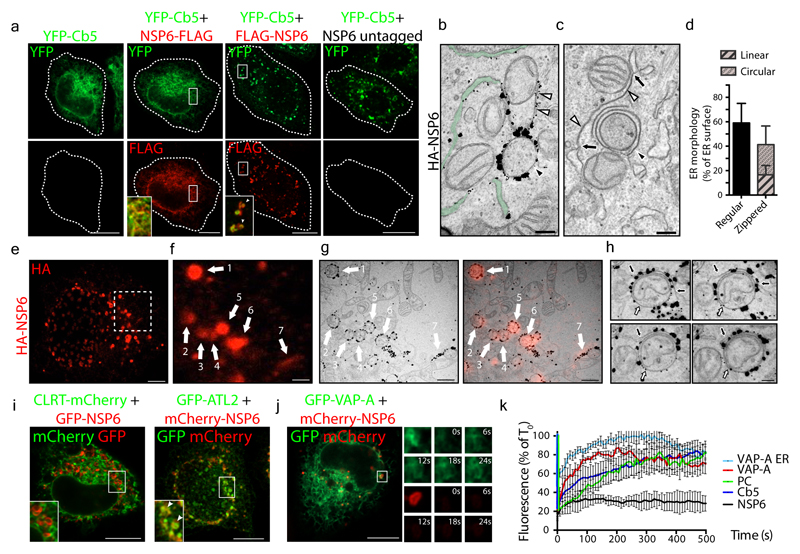
We tagged SARS-CoV-2 NSP6 at either the N- or C-terminus. C-tagged NSP6 showed a diffuse ER distribution (Fig. 1a, Extended Data Fig. 1a), as reported for NSP6 from other coronaviruses3,11. Conversely, N-tagged NSP6, expressed at a comparable level and untagged NSP6 elicited the formation of roundish structures (Fig. 1a, Extended Data Fig. 1a-c). These structures, which we refer to as the NSP6-compartment, did not colocalize with endosomal, lysosomal or autophagosomal markers (Extended Data Fig. 1d) but colocalized with the ER-reporter protein Cb5 (the C-terminal tail of cytochrome-b5)12 (Fig. 1a, Extended Data Fig. 1a).This appears to be a general feature of coronavirus NSP6 since N- but not C-tagged avian infectious bronchitis virus (IBV) NSP6 also formed roundish structures colocalizing with Cb5 (Extended Data Fig. 1e).
Figure 1. NSP6 induces ER zippering.
a, HeLa cells expressing YFP-Cb5 alone or co-expressing C- or N-terminally FLAG-tagged NSP6, or untagged NSP6. Insets, enlarged merge of boxed areas. Arrowheads, NSP6-compartments. Dashed lines, cell boundaries. b, IEM (anti-HA immunolabelling) and c, EM of HeLa cells expressing HA-NSP6. White arrowheads, linear and black arrowhead, circular zippered ER membranes. Regular ER, green. Black arrows, continuity between zippered and regular ER membranes. The average size of circular NSP6-positive ER structures is 623 ± 231 nm. d, Morphometric analysis of NSP6-expressing cells. % ER surface associated with regular cisternae or zippered domains. Mean ± SD, N=3, n = 60. e-h, Immuno-CLEM analysis of the NSP6-compartments. e, Fluoromicrograph of HA-NSP6 and f, enlargement with NSP6-labelled structures 1-7 that were identified on EM serial sections (g, left panel), and correspondence of NSP6 fluorescent spots with NSP6 circular and linear ER-zippered membranes (g, right panel). h, Serial sections of structure 6 in (g). Black arrow, NSP6-positive linear zippered membrane connection with ER cisternae. White arrow, NSP6-positive circular zippered structure. i, HeLa cells co-expressing NSP6 with CLRT or ATL2 as indicated. Insets, enlarged merge of boxed areas. Arrowheads indicate co-localization. j, k, FRAP analysis of GFP-VAP-A and mCherry-NSP6 co-expressing cells. j, NSP6-compartments (boxed) were photobleached and the fluorescence recovery monitored. Small panels are representative frames showing time in seconds after the bleach (see Supplementary Video 2). k, Quantitative FRAP analysis of the reporters in (j) and in Extended Data Fig. 2e, f. VAP-A ER, FRAP of VAP-A in “regular” ER areas. Fluorescence intensity is expressed as a percentage of the value measured at time 0, which is normalized to 100%. Mean ± SD, N=3, n=45. Scale bars, a, i, j, 10 μm; b, c, h, 250 nm; e, 4 μm; f, g, 1.1μm.
Immuno-electron microscopy (IEM) showed that NSP6 was highly concentrated on ER cisternae whose delimiting membranes were tightly juxtaposed, leaving a barely visible lumen (Fig. 1b, Extended Data Fig. 1f, g). These structures, which we refer to as zippered ER by analogy with those reported for other viruses4,6, were strikingly reminiscent of the “ER-connectors” observed in SARS-CoV-2 infected cells2. The zippered ER structures were either linear or, more often, circular structures that encapsulated the neighboring cytoplasm (Fig. 1c, d). Clear connections between these zippered ER structures and regular ER were visible by EM and EM tomography (Fig. 1c, Extended Data Fig. 1h-j, Supplementary Video 1). Correlative light-electron microscopy (CLEM) demonstrated that the roundish or elongated NSP6 spots visualized by IF corresponded, respectively, to the circular or linear zippered ER profiles observed by EM (Fig. 1e-g), whose connection to the regular ER can be traced (Fig. 1h). The NSP6-containing structures were not freely accessible to ER luminal proteins (such as calreticulin and the ER reporter GFP-KDEL) or to ER membrane proteins with bulky luminal domains (such as ERGIC53 and ATF6) but were accessible to ER membrane proteins such as VAP-A, Atlastin2 and KDEL receptor that possess no or very small luminal tracts (Fig. 1i-k, Extended Data Fig. 2a-d). We validated the continuity between the NSP6-compartment and the ER using FRAP assays (Fig. 1j, k; Extended Data Fig. 2e, Supplementary Videos 2-3).Upon bleaching, both VAP-A and Cb5 reentered the NSP6-compartment, although with slower kinetics compared with “regular” ER. The NSP6-compartment was accessible to phospholipids, such as BODIPY-C12-HPC, whose fluorescence also recovered after bleaching (Fig. 1k, Extended Data Fig. 2f, Supplementary Video 4). NSP6 itself, however, showed limited FRAP (Fig. 1j, k, Extended Data Fig. 2e, f) probably because it is engaged in stable protein complexes.
Our results indicate that NSP6 drives the formation of a zippered double-membrane compartment that maintains continuity with the ER but largely excludes ER luminal proteins.
NSP6 homodimers zipper ER membranes
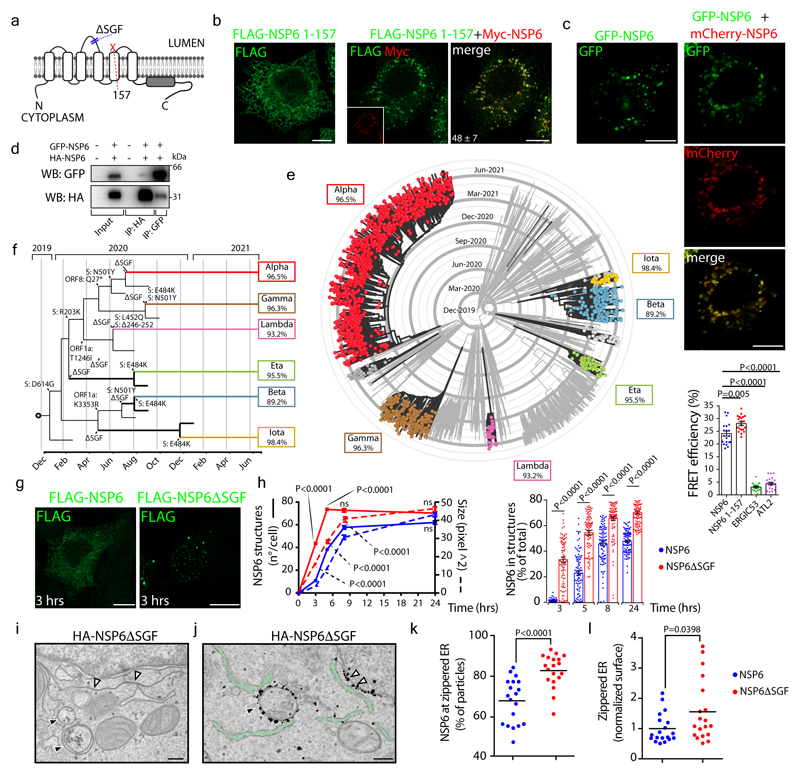
The structure of NSP6 has not been solved and different topologies have been predicted. The N and C termini of NSP6 must face the cytosol since they are processed by the cytosolic NSP5 protease. Indeed, N- or C-tagged NSP6 was readily detectable by antibodies upon plasma membrane permeabilization (Extended Data Fig. 3a). Based on these data, topology predictions using the CCTOP server13, and biochemical analyses of other coronaviruses14,15, we assigned six TMDs to NSP6 and envisaged that the seventh predicted TMD, which is an amphipathic helix (AH)16, does not cross, but remains associated with, the membrane (Fig. 2a, Extended Data Fig. 3 b).
Figure 2. ER zippering requires NSP6 homodimerization and is more efficient with NSP6ΔSGF.
a, Predicted secondary structure of NSP6. The ΔSGF deletion and truncation site (at 157) are indicated. b, HeLa cells expressing Myc-NSP6 (inset) and/or FLAG-NSP6-1-157. The fraction of NSP6-1-157 associated with NSP6 structures is indicated. Mean ± SD, N=3, n=74. c, Cells expressing GFP-NSP6 alone or together with mCherry-NSP6. Graph, FRET measurements in cells co-expressing mCherry-NSP6 with the indicated GFP-tagged protein. Mean ± SD, N=3, n=20. d, Immunoprecipitation and Western blot (WB) from GFP-NSP6 and HA-NSP6 co-expressing cells, representative of four independent experiments. e, Radial layout of a phylogenetic tree of 3,508 SARS-CoV-2 genomes. VoCs are indicated and the percentage of each genome carrying ΔSGF is reported. Black branches highlight the appearance of the deletion. f, Mutations involved in branching and specificity of each VoC. Arrows, appearance of the ΔSGF and mutations in S protein. g, h, Time course analysis of stably-expressing FLAG-NSP6 or FLAG-NSP6ΔSGF cells induced with doxycycline. g, Fluoro-micrographs at 3 hrs. h, quantification of the structures shown in, g and Extended Data Fig. 5a, N=3, n=90. Left graph, number and size of NSP6-positive structures. Right graph, NSP6 in structures as percentage of total NSP6 in the cell. i, EM and j, IEM (anti-HA immunolabelling) of HA-NSP6ΔSGF-expressing HeLa cells. White and black arrowheads, linear and circular zippered-ER structures. Green, regular ER membranes. k, Morphometric analysis of IEM images. Quantification of gold particles at zippered ER (% of total ER-associated-particles). l, The surface area of zippered-ER normalized for the total number of gold particles. For k, l, N=3, n=19. Scale bars, b, c, g, 10 μm; i, j, 250 nm. Two-tailed Mann-Whitney test, c or unpaired two-tailed t-test, k, l, one-way ANOVA with Tukey’s post-hoc test, h. ns, not significant.
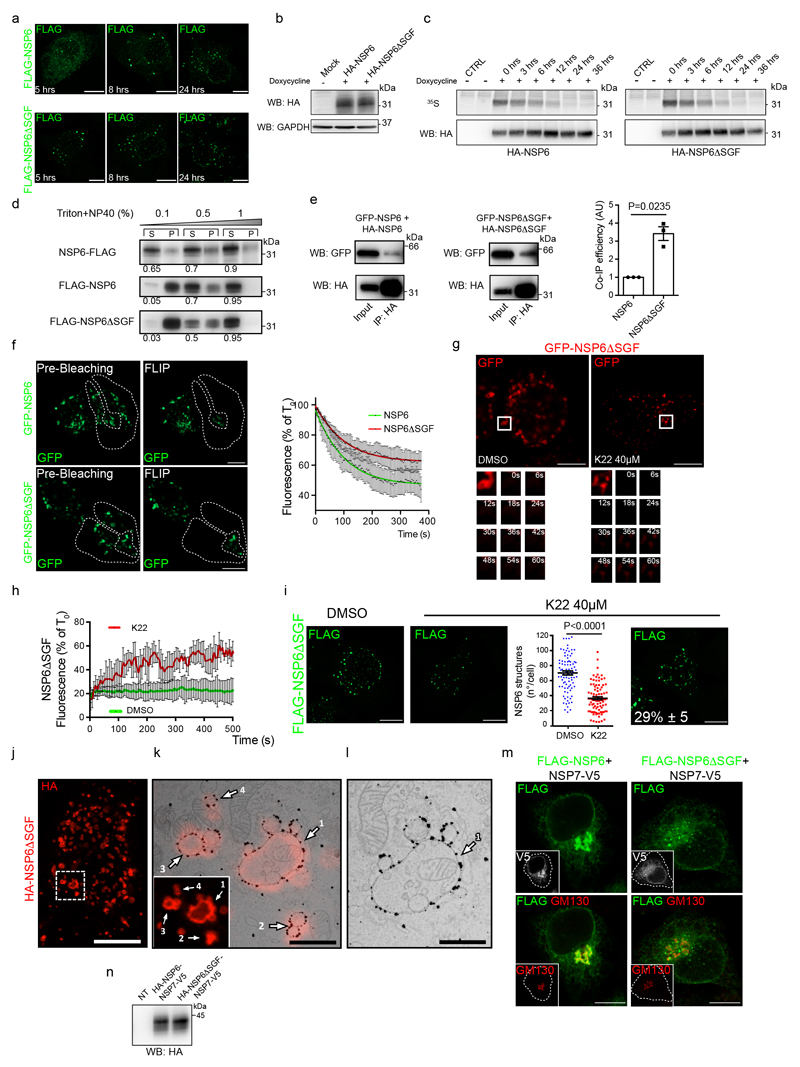
Truncating the C terminal part of NSP6 including the AH (NSP6 1-157) (Fig. 2a) or introducing two mutations that abrogate its amphiphilic properties16 (NSP6 F220Q/T222W) (Extended Data Fig. 3b) caused NSP6 to distribute diffusely in the ER (Fig. 2b, Extended Data Fig. 3c, d). However, while necessary the AH is not sufficient to induce ER remodelling since the C-terminal domain, which includes AH (NSP6-C80, see below), was unable to induce it. We found that homodimerization of NSP6 is also required. FRET measurements and the co-immunoprecipitation of GFP-NSP6 co-expressed with mCherry-NSP6 or HA-NSP6 indicated that NSP6 undergoes homodimerization (Fig. 2c, d, Extended Data Fig. 3e, f). Dimerization involves aa 1-157 since NSP6 1-157 was massively recruited and retained in the NSP6-compartment when co-expressed with the full length NSP6 (Fig. 2b). Indeed, both FRET and co-IP experiments (Fig. 2c, Extended Data Fig. 3g, h) confirmed that NSP6 1-157 and NSP6 interact, indicating that NSP6 1-157 maintains the homodimerization interface(s).
Together, these data indicate that both the C-terminal AH and NSP6 homodimerization (via N1-157) are required to generate the NSP6-compartment.
K22, a small molecule that interferes with the replication of several coronaviruses with different potency, has been hypothesized to target NSP6 since K22-resistant strains of HCoV-229E have mutations in NSP617. We found that K22 (at 40 μM) reduced the number of regular NSP6 structures and NSP6 retention in these structures (Extended Data Fig. 4a, b).Additionally, 37% of K22-treated cells presented elongated perinuclear NSP6 structures (Extended Data Fig. 4a, c). Immuno-CLEM (Extended Data Fig. 4d-f) and EM (Extended Data Fig. 4g-j) showed that these structures corresponded to extensive zippered areas of the nuclear envelope. Thus, impaired formation of the NSP6-compartment induced by K22 may be due in part to a shift in NSP6 zippering activity towards the nuclear envelope, apparently an unfavourable site for RO formation (https://www.ebi.ac.uk/empiar/EMPIAR-10490/).
NSP6ΔSGF has higher ER zippering activity
Six SARS-CoV-2 VoCs (α, β, γ, η, ι, λ) have a three amino acid deletion (SGF, positions 106-108) in the predicted second and longest NSP6 luminal loop. Phylogenetic analysis of SARS-CoV-2 using Nextstrain18 showed that the deletion emerged independently in these lineages (Fig. 2e, f), suggesting that it conveys a selective advantage.
We found that, compared with the Wuhan-HU-1 NSP6 (from here on, the reference NSP6), NSP6ΔSGF is more proficient in inducing the NSP6-compartment: the kinetics of formation were faster (Fig. 2g, h, Extended Data 5a), the NSP6ΔSGF-compartments were more numerous and larger (Fig. 2h), and NSP6AΔSGF was more enriched in these compartments (Fig. 2h). These differences were not due to different protein levels or half-lives (Extended Data Fig. 5b, c), but to higher propensity of NSP6ΔSGF to homo-oligomerize as indicated by its higher resistance to detergent extraction (Extended Data Fig. 5d), more efficient co-IP (Extended Data Fig. 5e) and lower mobility (in FLIP and FRAP experiments) compared to the reference NSP6 (Extended Data Fig. 5f-h). NSP6ΔSGF was slightly less sensitive to K22 than the reference NSP6 (Extended Data Fig. 5g-i). Finally, EM, IEM and CLEM showed that NSP6ΔSGF promoted the formation of both linear and circular zippered membrane compartments (Fig. 2i, j, Extended Data Fig. 5j-l), like NSP6, but it was more highly associated with zippered membrane domains and was depleted from the regular ER (Fig. 2j, k). This was paralleled by an increase in the ER surface area occupied by zippered domains (Fig. 2l).
The higher ER-zippering activity of NSP6ΔSGF was also evident comparing the putative precursor of NSP6, i.e. NSP6-7 and NSP6ΔSGF-NSP7. During viral infection NSP6 is generated via polyprotein cleavage by NSP51. Consistent with NSP6 forming the NSP6-compartment only if its C-terminus is “free”, NSP6-NSP7 showed a diffuse ER distribution (Extended Data Fig. 5m, n) and also a partial Golgi localization suggesting that the precursor might visit the Golgi before the cleavage unleashes its ER-zippering activity. By contrast, NSP6ΔSGF-NSP7 was mainly retained in the ER and was able to form small roundish structures even before cleavage (Extended Data Fig. 5m, n).
NSP6 connects DMVs with the ER
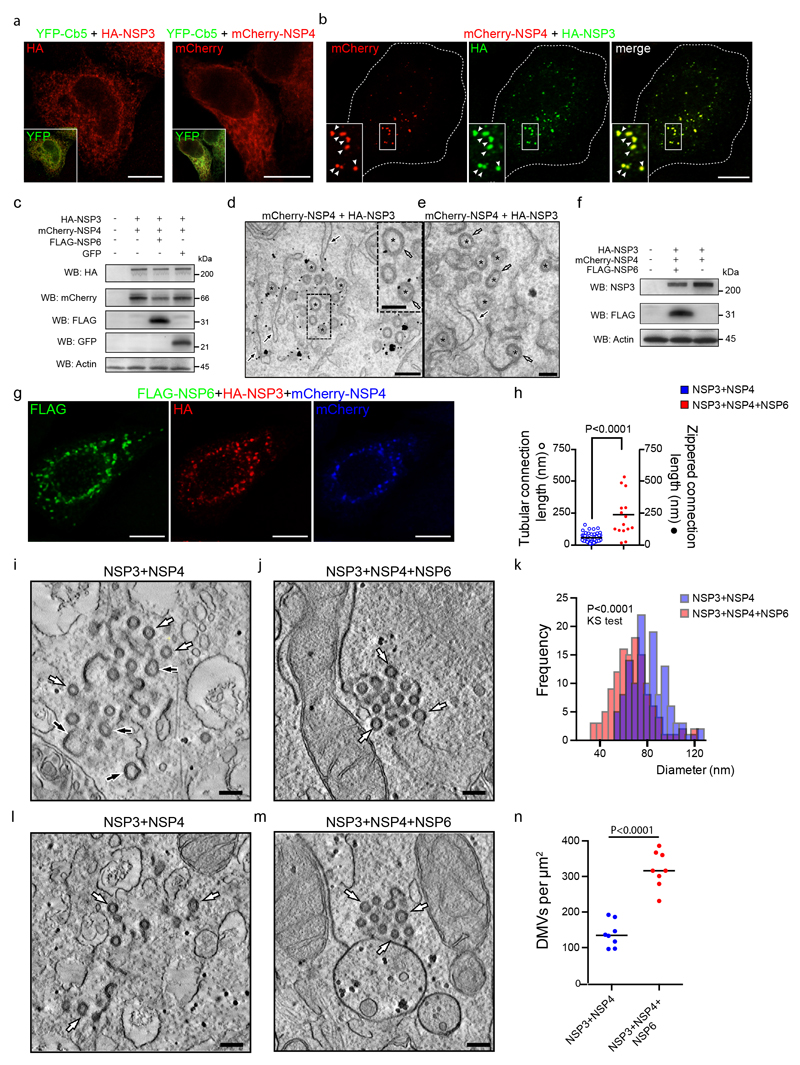
Given the similarity of NSP6-induced zippered ER with “ER-connectors” between the ER and DMVs in SARS-CoV-2 infected cells2, we explored the relationship between NSP6 and the DMVs. When expressed alone, NSP3 and NSP4 exhibited a diffuse ER distribution (Extended Data Fig. 6a), but when co-expressed, and in agreement with recent reports19,20, they fully colocalized in punctate structures (Extended Data Fig. 6b, c). At the EM level these corresponded to clusters of vesicles, having a diameter of 50-100 nm and surrounded by two membranes (i.e. DMVs) with a visible intermembrane space (Extended Data Fig. 6d, e).
Thus, NSP3/NSP4 and NSP6 are individually able to reproduce the two main features of the SARS-CoV-2 RO, DMVs and the connectors2, respectively.
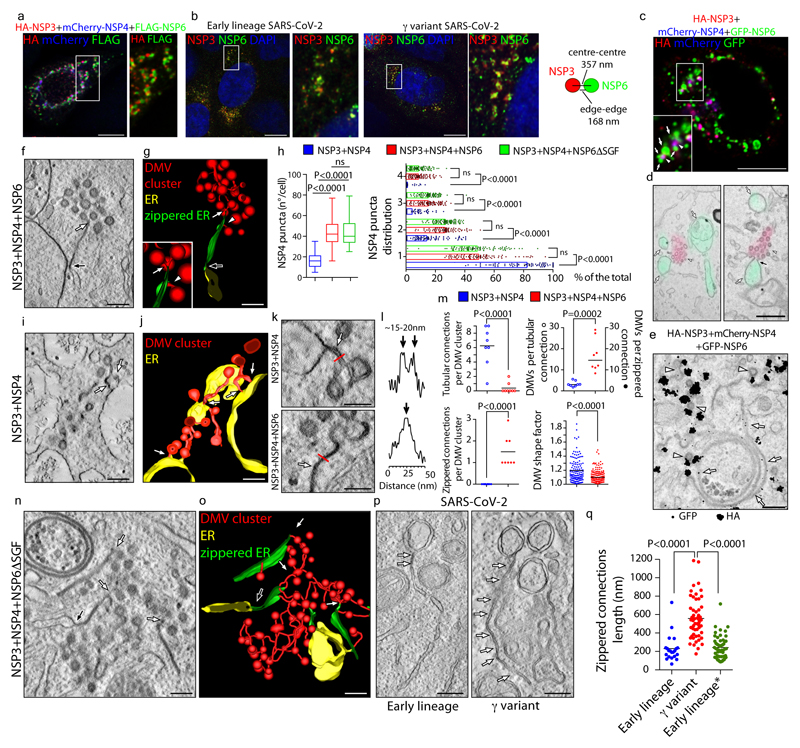
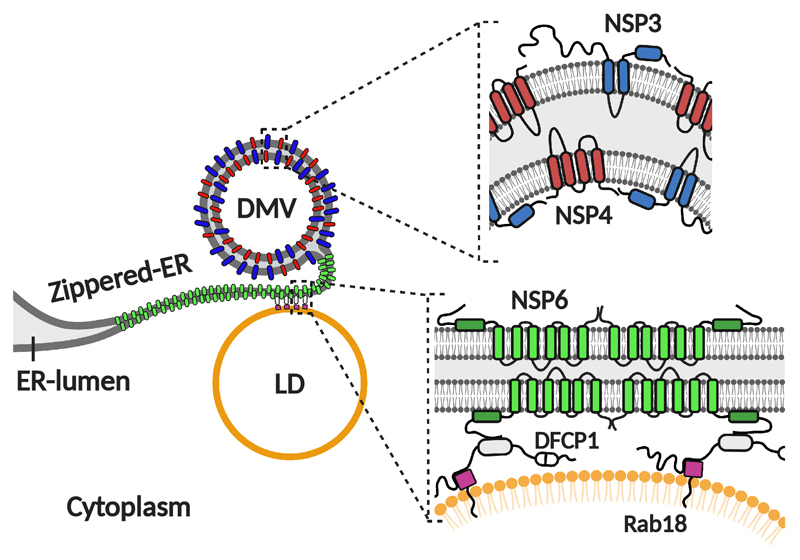
The combined expression of all three membrane NSPs (Extended Data Fig. 6f, g) revealed NSP3/4-positive puncta in close proximity to but not overlapping the NSP6-compartment (Fig. 3a). Importantly, a similar segregation of NSP6- and NSP3-positive domains was also detectable in Calu-3 cells infected with an early lineage or the γ variant of SARS-CoV-2 (Fig. 3b).CLEM revealed that the NSP3/4 puncta corresponded to clusters of DMVs while the NSP6 structures corresponded to tracts of zippered ER that remained distinct from but were often close and connected to the DMVs (Fig. 3c, d). IEM showed groups of NSP3/NSP4-positive DMVs associated with NSP6-positive zippered ER membranes (Fig. 3e). Tomographic analysis of NSP3/NSP4/NSP6-expressing cells revealed that DMVs were organized in “grape-like” clusters, sometimes with reciprocal connections (Fig. 3f, g). Long tracts of zippered ER formed connections between the DMV clusters and the ER proper (Fig. 3f, g, Supplementary Videos 5-7), similarly to those observed in SARS-CoV-2 infected cells2. Thus, we inferred that NSP6 forms the zippered connectors that guarantee full membrane, but restricted luminal, continuity with the ER.
Figure 3. NSP6-zippered membranes connect NSP3/NSP4-DMVs to the ER.
a, Calu-3 cells expressing HA-NSP3/FLAG-NSP6/mCherry-NSP4. Enlargement of boxed area shows HA/FLAG-immunolabelling. b, Calu-3 cells infected with early lineage and γ-variant SARS-CoV-2. Values represent mean NSP3- and NSP6-structure distances in nm. N=10 cells, n=2,233 structures. c, d, CLEM. Fluoromicrograph (c) and EM serial-sections (d) of HA-NSP3/mCherry-NSP4/GFP-NSP6-expressing cell. Arrowheads, NSP3/NSP4 colocalization, arrows NSP6-compartments. Black arrow, NSP6-compartment connection with NSP3/NSP4-DMVs. e, IEM showing NSP3 (anti-HA, white arrowheads) and NSP6 (anti-GFP, white arrows). f, Tomogram and g, 3D-reconstruction showing connections of zippered-ER to DMVs (white arrow and arrowhead) and to regular-ER (black arrow) (Supplementary Videos 5,6). h, Number and distribution of NSP4-puncta in cells expressing the indicated NSPs. Mean ± SD, N=3, n=30. Box plot represents 25th to 75th percentile of the data (centre line: median; whiskers: minima and maxima). i, Tomograms and j, 3D-reconstruction showing multiple short DMV-ER tubular connections (white arrows) in NSP3/NSP4-expressing cell (Supplementary Videos 8, 9). k, Tomograms from NSP3/NSP4 and NSP3/NSP4/NSP6-expressing cells showing DMV-ER connections (arrows). l, Intensity profiles along the red lines in (k). m, Morphometry of NSP3/NSP4- or NSP3/NSP4/NSP6-expressing cells. n, Tomogram and o, 3D-reconstruction of a NSP3/NSP4/NSP6ΔSGF-expressing cell showing numerous zippered-ER domains connected to DMVs (white arrows) and to regular ER (black arrow) (Supplementary Videos 11, 12). p, Tomograms showing zippered-ER connections (arrows) to DMVs in Calu-3 cells infected with SARS-CoV-2 early lineage and γ variant (Supplementary Videos 13, 14). q, Length of zippered-ER connected to DMVs in infected cells, N=10, n≥20, and from early lineage* (Bavpat1/2020) data in EMPIAR 10490 (29 tomograms). Scale bars, a-b, 10 μm; c, 2 μm; d, 470 nm; e, p, 200 nm; f, g, i, j, n, o, 160 nm; k, 100 nm. One-way ANOVA with Tukey’s (h, left panel) or Emmeans post-hoc test (h, right panel), unpaired two-tailed t-test, m, q. ns, not significant.
We then asked how NSP3/NSP4-induced DMVs might be affected by NSP6. The NSP3/NSP4 puncta were more numerous and more homogeneously distributed throughout the cytoplasm in NSP3/NSP4/NSP6 (both reference and NSP6ΔSGF) than in NSP3/NSP4-expressing cells (Fig. 3h) suggesting that NSP6 might provide a cue for the positioning and organization of DMVs (Fig. 3a, c).
EM tomography revealed that in the absence of NSP6, DMV connections with the ER were short and tubular with a clearly detectable lumen (Fig. 3i-m; Extended Data Fig. 6h Supplementary Videos 8-10). By contrast, in the presence of NSP6, DMV clusters were connected with the ER through much longer sheet-like zippered domains (Fig. 3f, g, k, l, m; Extended Data Fig. 6h, Supplementary Videos 5-7). The number of DMVs per connection was also different: an average of ~3 DMVs per tubular connection without NSP6 and of ~15 DMVs per zippered connection with NSP6 (Fig. 3m). In addition, the DMVs shape was more regular (Fig. 3m), their size more uniform (Extended Data Fig. 6i-k) and their packing inside each cluster was denser in the presence of NSP6 (Fig. 3f, g, i, j; Extended Data Fig. 6l-n).
These data indicate that the co-expressed NSP3/NSP4/NSP6 reproduce RO-like structures (ROLS) and that NSP6 organizes DMV clusters.
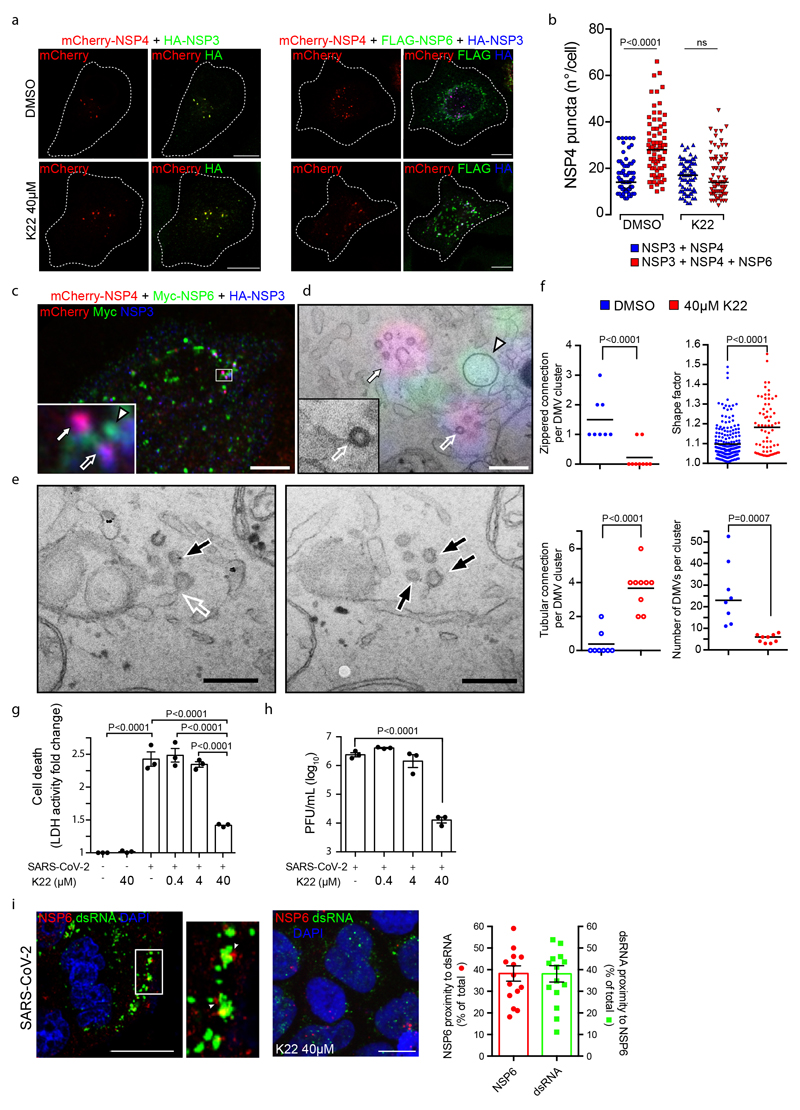
We then assessed whether conditions that negatively or positively affect the ER-zippering activity of NSP6, i.e. K22 treatment or SGF deletion, respectively, have an impact on the ROLS. While K22 had no effect on the number and distribution of NSP3/NSP4 puncta in cells expressing only NSP3 and NSP4, it blunted the ability of co-expressed NSP6 to increase the number of NSP3/NSP4 puncta (Extended Data Fig. 7a, b). EM revealed that DMV clusters in these cells contained a significantly lower number of vesicles (Extended Data Fig. 7c-f) with a less regular shape (Extended Data Fig. 7e, f) that lost zippered connections and acquired more tubular connections to the ER (Extended Data Fig. 7d-f). Thus, K22 treatment counteracted the ability of NSP6 to form zippered connections and to promote the homogeneous growth of DMVs. Corroborating these results, we found that K22, at (the relatively high) concentrations that interfere with the biogenesis of ROLS (i.e. 40 μM), but not at lower ones21, inhibited the replication of SARS-CoV-2 (Extended Data Fig. 7g-i).
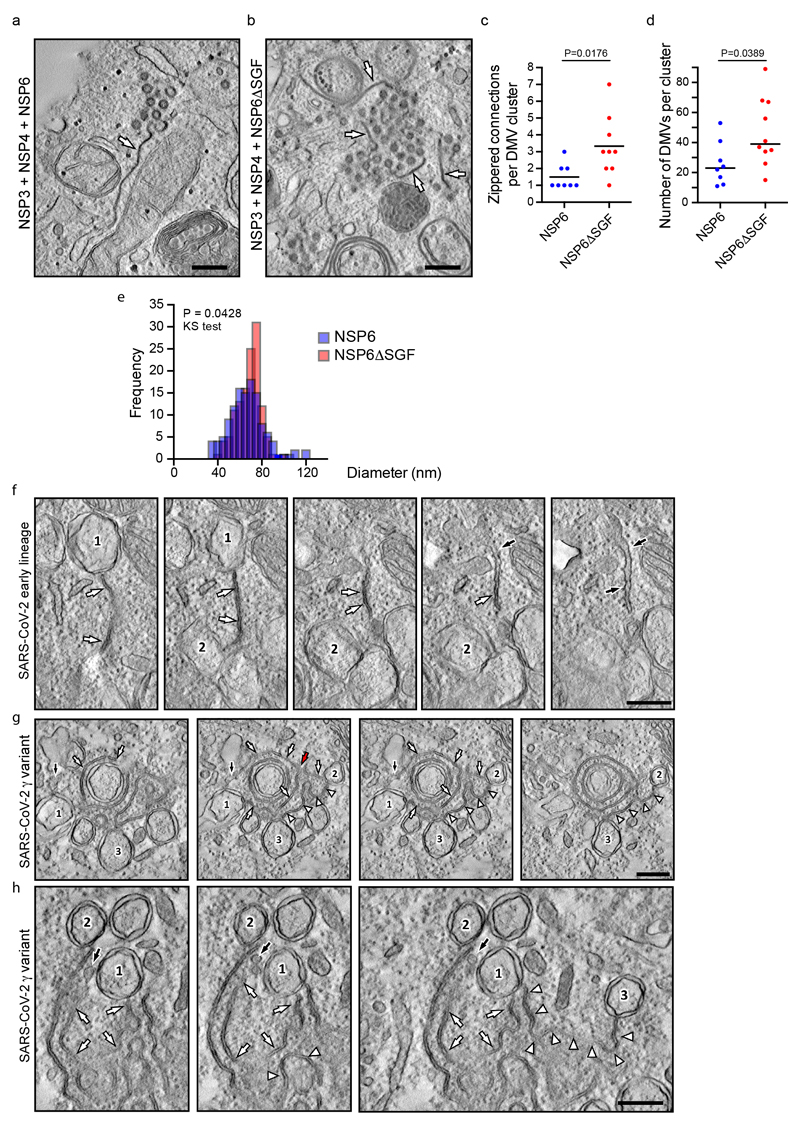
As for the SGF deletion, we found that NSP6ΔSGF also enhances and organizes the formation of NSP3/NSP4 puncta (Fig. 3h) but that each DMV cluster contains a higher number of DMVs that are more homogeneous in terms of size, as well as exhibiting a more developed system of zippered connections compared to the reference NSP6 (Fig. 3n, o, Extended Data Fig. 8a-e, Supplementary Videos 11, 12).
Finally, we analysed the zippered connectors in Calu-3 cells infected with an early lineage or γ variant SARS-CoV-2 which carries the SGF deletion in NSP6 and found that the γ strain has a much more extensive zippered connector system joining the DMVs with each other and with the ER (Fig. 3p-q, Extended Data Fig. 8f-h Supplementary Videos 13, 14). One might speculate that the higher zippering activity of NSP6ΔSGF has a role in establishing a more functional and better shielded RO, providing one of the multiple mechanisms contributing to the reported differences in replication dynamics and immune evasion of NSP6ΔSGF bearing VoC22,23.
NSP6 mediates RO association with LDs
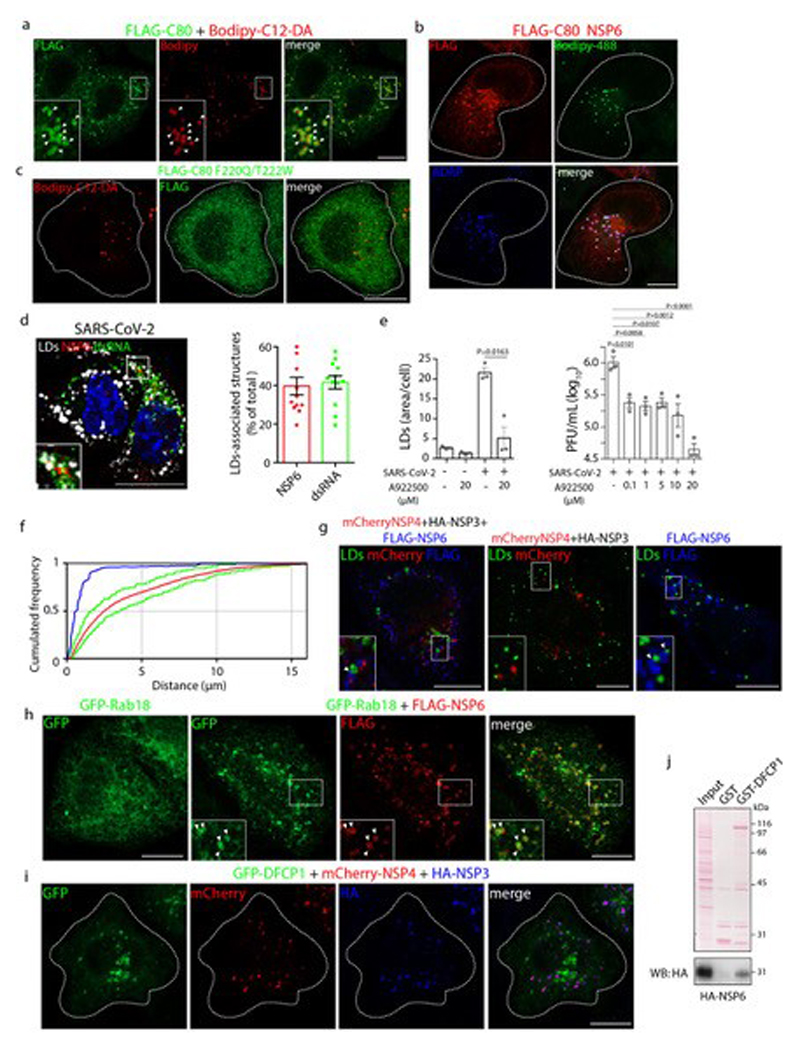
A C-terminal 80 amino acid fragment of NSP6 (NSP6-C80), unable to induce formation of the NSP6-compartment, associated with roundish cytoplasmic structures. These were negative for endosomal, Golgi, or mitochondrial markers, but turned out to be lipid droplets (LDs) (Extended Data Fig. 9a, b). This association is due to the AH since a mutated NSP6-C80 (C80 F220Q/T222W) which lost the amphiphilic properties of its AH failed to associate with LDs and exhibited a diffuse distribution (Extended Data Fig. 9c).
Importantly, and in agreement with recent results24, we found that 40% of the viral replication areas labelled by dsRNA and NSP6 are associated with LDs (Extended Data Fig. 9d) and that LDs are required for SARS-CoV-2 replication in Calu-3 cells since A922500, a DGAT-1 inhibitor, inhibited LD biogenesis and significantly reduced the viral load (Extended Data Fig. 9e).
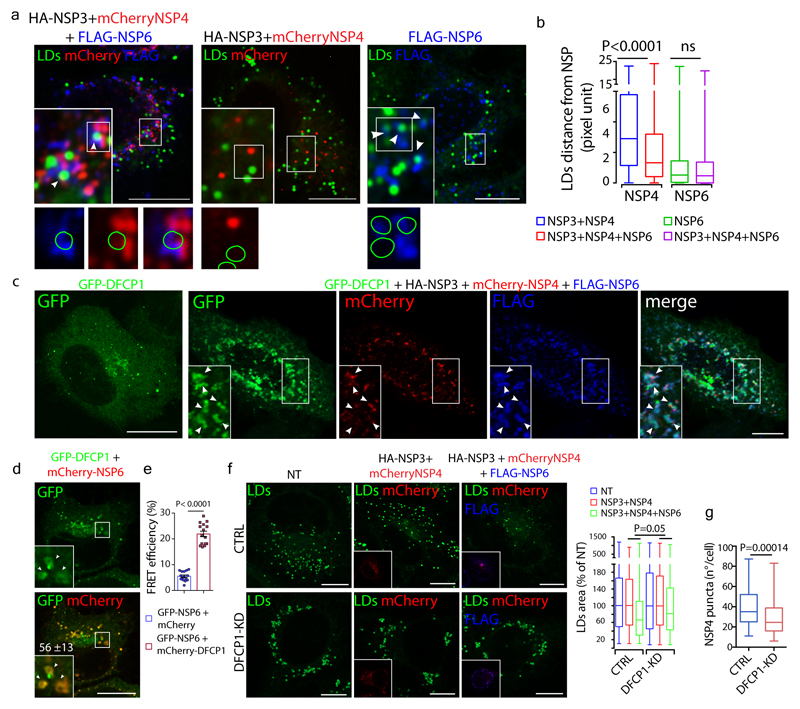
We found that LDs are also in close proximity to ROLS in cells co-expressing NSP3/NSP4/NSP6, mimicking the situation of infected cells, but not in cells expressing only NSP3/NSP4 (Fig. 4a, b, Extended Data Fig. 9f, g). By contrast, LDs were found very close to NSP6 structures in cells expressing NSP6 alone (Fig. 4a, b, Extended Data Fig. 9g). These data indicate that NSP6 mediates the association of LDs with ROLS.
Figure 4. NSP6 mediates the recruitment of LDs to the RO via DFCP1.
a, HeLa cells expressing the indicated NSPs stained with Bodipy-488 for LD (green). Insets, enlargement of boxed area; arrowheads, LDs close to ROLS (left panel) or to NSP6 (right panel). Lower panels, green circles delineate the position of LDs. b, Distance of LDs from NSP4 and NSP6-puncta measured in whole cell in cells expressing the indicated NSPs (see Methods). LD to NSP4-puncta, N=3, n=1,692 in NSP3/NSP4-, n=2,971 in NSP3/NSP4/NSP6-expressing cells. LD to NSP6-puncta, N=3, n=3,239 in NSP6-, n=2,563 in NSP3-4-6-expressing cells. c, HeLa cells expressing GFP-DFCP1 alone or with mCherry-NSP4/HA-NSP3/FLAG-NSP6 or d, with mCherry-NSP6. Arrowheads, DFCP1 signal in the NSP6-compartment. In d, the percentage of colocalization between DFCP1 and NSP6 is indicated, Mean ± SD. e, FLIM-FRET analysis showing average GFP lifetime in HeLa cells expressing GFP-NSP6 with mCherry or with mCherry-DFCP1. Mean ± SD, N=3, n=15. f, LD staining (Bodipy-488, green) of CTRL (Mock-transfected) and DFCP1-KD cells expressing mCherry-NSP4/HA-NSP3, mCherry-NSP4/HA-NSP3/FLAG-NSP6 or non-transfected (NT). Insets, mCherry-NSP4 fluorescence (red) and anti-FLAG immunostaining (blue). Graph, quantification of LD area in cells. Values are normalized to the NT-cells in either the CTRL or DFCP1-KD condition. The significance of LD area reduction upon DFCP1-KD and Mock treatment was assessed as described in Methods. N=3, n=90. g, Number of NSP4-puncta/cell in mCherry-NSP4/HA-NSP3/FLAG-NSP6-transfected cells without (CTRL) or with DFCP1-KD. N=3, CTRL n =66, DFCP1-KD n=71. Scale bars, a, c, d, f, 10 μm. Kruskal-Wallis test with Wilcoxon post-hoc and Bonferroni correction, b, unpaired two-tailed t-test, e, Wilcoxon test, f, unpaired two-tailed Mann-Whitney test, g. Box plots in b, f and g represent 25th to 75th percentile of the data with median (centre line) and minima and maxima (whiskers).
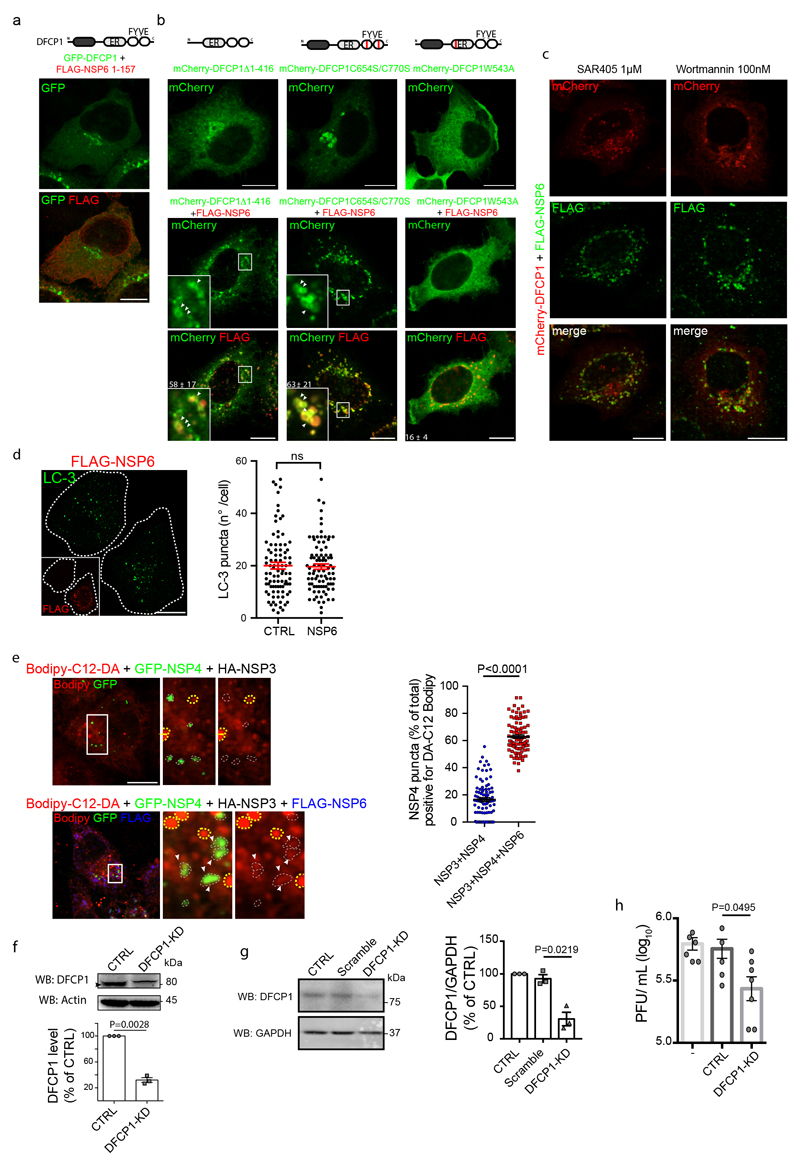
We investigated the involvement of molecular complexes known to tether LDs to the ER25–27 and found that DFCP1 (Fig. 4c) and Rab18 (Extended Data Fig. 9h) were associated with ROLS. In particular, DFCP1 was recruited by NSP6 but not by NSP3/NSP4 (Fig. 4d, Extended Data Fig. 9i). We found that the two proteins interact as shown by the intense FRET signal measured in cells expressing GFP-NSP6 and mCherry-DFCP1 (Fig. 4e) and by the ability of DFCP1 to pull-down NSP6 from lysates of cells expressing HA-NSP6 (Extended Data Fig. 9j). The C-terminal domain of NSP6 mediates DFCP1 recruitment since NSP6 1-157 was unable to recruit DFCP1 (Extended Data Fig. 10a). A DFCP1 mutant (DFCP1Δ1-416) lacking the N-terminal domain but including the ER-targeting domain and the two FYVE domains28 is still recruited by NSP6 (Extended Data Fig. 10b), as is the FYVE domain mutant C654S/C770S unable to bind PI3P (but not the single point mutant W543A in the ER domain) (Extended Data Fig. 10b). Thus, unlike recruitment to the omegasome (the site of autophagosome formation)29, DFCP1 recruitment to the ROLS is PI3P-independent. Indeed, inhibition of PI3P generation, by wortmannin or SAR405, did not affect DFCP1 recruitment to the NSP6-compartment (Extended Data Fig. 10c). Notably, SAR405 did not impair NSP6-compartment formation, arguing against a role for PI3P in this process. Supporting an autophagy-independent role of DFCP1 recruitment by NSP6, the autophagosome number in cells expressing NSP6 was comparable to that of non-transfected cells (Extended Data Fig. 10d).
Importantly, we found that LDs are consumed during ROLS formation in cells expressing NSP3/NSP4/NSP6 but not NSP3/NSP4, (Fig. 4f) and that a fluorescent fatty acid incorporated into LDs30 shows more efficient transfer to NSP3/NSP4 structures in the presence of NSP6 (Extended Data Fig. 10e), consistent with a role for NSP6 in channeling LD-derived lipids to the ROLS. Of note, NSP6-dependent consumption of LDs and ROLS formation were both inhibited by DFCP1-KD (Fig. 4f, g, Extended Data Fig. 10f). Finally, and in line with recent reports19, DFCP1 depletion also inhibited SARS-CoV-2 replication, confirming that the availability of LDs is required to sustain viral replication (Extended Data Fig. 10g, h).
Conclusions
The SARS-CoV-2 RO is made of DMVs and connectors2,8 whose molecular determinants we have shown are constituted by NSP3/NSP4 and NSP6, respectively. The NSP6 connectors are tracts of zippered ER that are not accessible to luminal ER proteins or ER membrane proteins with bulky luminal domains but are freely accessible to lipids (Extended Data Fig. 11). In addition to linking the DMVs to the ER, the connectors mediate the association of ROs with LDs (Extended Data Fig. 11); this is likely to be a dynamic association (as at any given time 40% of ROs is associated with LDs) that may provide fatty acids to fuel DMV growth. These features are perfectly suited to refurbish the DMVs with lipids synthesized in the ER but to exclude “undesired” ER proteins.
We found that NSP6 zippers the ER membrane via homodimerization and that NSP6ΔSGF (that underwent convergent evolution in α, β, η, ι, λ VoCs) has a higher ER zippering activity. Interestingly, the recent and highly infectious o BA.2 variant also bears the NSP6ΔSGF deletion18. The deletion falls in the second and longest luminal loop of NSP6, hosting a consensus O-glycosylation motif (LSGF: 105-108), which could act as a spacer that forms luminal bridges. Thus, SGF deletion could convey higher zippering activity by either shortening the “spacer” and/or preventing its O-glycosylation.
Our findings on NSP6 and its key role in RO biogenesis provide a testable target that is easily amenable to screens for anti-viral agents with applicability across a wide range of coronaviruses.
Methods
Reagents and antibodies
The following antibodies were used: mouse monoclonal anti-HA (BioLegend, 901503, dilution 1:600 for IF and 1:1500 for WB), rabbit polyclonal anti-HA (Sigma-Aldrich, H6908, dilution 1:200 for IF), goat polyclonal anti-HA (Bethyl, A190-138A, dilution 1:600 for IF), rabbit polyclonal anti-actin (Sigma-Aldrich, A2066, dilution 1:10000 for WB), rabbit polyclonal anti-NSP6 (ProSci Inc, 9177, dilution 1:200 for IF and 1:1000 for WB), sheep anti-NSP3 (The University of Dundee, DA126, dilution 1:100 for IF and 1:1000 for WB), rabbit polyclonal ADRP/Perilipin 2 (Proteintech, 15294-1-AP, dilution 1:200), rabbit monoclonal anti-DFCP1 (Cell Signaling, 38419, dilution 1:1000 for WB), mouse monoclonal anti-FLAG (Sigma-Aldrich, F1804, dilution 1:400 for IF and 1:1500 for IF), goat polyclonal anti-FLAG (Bethyl, A190-101A, dilution 1:200 for IF), mouse monoclonal anti-c-Myc (Santa Cruz, sc-40, dilution 1:200 for IF), mouse monoclonal anti-GAPDH (Santa Cruz, sc-32233, dilution 1:1000 for WB), mouse monoclonal anti-LAMP1 (Hybridoma Bank, #H4A3, dilution 1:200 for IF), rabbit monoclonal anti-EEA1 (BD Biosciences, #610456, dilution 1:1000 for IF), sheep anti human anti-TGN46 (BioRad #AHP500GT, dilution 1:750 for IF), rabbit polyclonal anti-GFP (Abcam, ab6556, dilution 1:250 for IF), mouse monoclonal anti-GFP (Santa Cruz, sc-9996, dilution 1:2000 for WB), mouse monoclonal anti-mCherry (Abcam, ab125096, dilution 1:2000 for WB), mouse monoclonal anti-V5 (ThermoFisher R960-25, dilution 1:200 for IF and 1:1000 for WB), rabbit polyclonal anti-LC3 (Novus Biologicals, NB100-2220, dilution 1:200 for IF), mouse monoclonal anti-dsRNA (Scicons, 10010500, dilution 1:10 for IF ), DAPI (Sigma-Aldrich, D9542, dilution 1:10000 for IF), rabbit 1.4 nm gold-conjugated Fab' fragment (Nanoprobes, 2004, dilution 1:50), mouse 1.4 nm gold-conjugated Fab' fragment (Nanoprobes, 2002, dilution 1:50) and Alexa Fluor®-546 FluoroNanogold™-anti-mouse Fab’ (7402, dilution 1:50). Alexa Fluor-488-568-647 (Invitrogen, diluted 1:400), horseradish peroxidase (HRP)-conjugated goat anti-mouse or anti-rabbit IgG antibody (1:8,000, Merck Millipore, 401215 and 401315, respectively). Anti-GM130 (1:1000 for IF) and anti-VAPA (1:300 for IF) were produced in our laboratory as previously described31,32
BODIPY™ 493/503 (4,4-Difluoro-1,3,5,7,8-Pentamethyl-4-Bora-3a,4a-Diaza-s-Indacene), β-BODIPY™ FL HPC-C12 (2-(4,4-Difluoro-5,7-Dimethyl-4-Bora-3a,4a-Diaza-s-Indacene-3-Dodecanoyl)-1-Hexadecanoyl-sn-Glycero-3 Phosphocholine) and BODIPY 558/568-DA-C12 (4,4-Difluoro-5-(2-Thienyl)-4-Bora-3a,4a-Diaza-s-Indacene-3-Dodecanoic Acid were purchased from ThermoFisher (D3922, D3792 and D3835, respectively). Oil Red O solution was purchased from Merck (102419). K22 (N-[(1Z)-1-1[[4-(4brompehnyl)-4-hydroxy1-piperidinyl]carbonyl]-2-phenylethenyl]-benzamide) was purchased from Cayman Chemical, the DGAT-1 inhibitor A922500 (A1737), Wortmannin (3144), delipidated serum (S5394), and doxycycline hydrochloride (8D3447) from Sigma-Aldrich, and the VPS34 specific inhibitor SAR405 from MedChemExpress (HY-12481). Puromycin dihydrochloride was purchased from Calbiochem (540411). For 35S-methionine/cysteine labelling, the EasyTag protein labelling mix (772007MC) was purchased from PerkinElmer. Unless otherwise stated, all other chemicals were purchased from Sigma-Aldrich.
Plasmid constructs
All NSP constructs were made with the Gateway system (ThermoFisher) using a modified pCDNA3.1 vector (containing a HA, FLAG, MYC, GFP or mCherry tag) for amino-terminal tagging, a modified pCDNA5/FRT/TO vector (containing 3XFLAG) for carboxy-terminal tagging, unmodified pCDNA5/FRT/TO to clone untagged NSP6, and pLTD-FLAG or pLTD-HA for stable doxycycline-inducible NSP6-expressing cell lines. All Gateway vectors were kindly provided by Paolo Grumati (TIGEM, Naples). The donor plasmids were pDONR207 SARS-CoV-2 NSP3, pDONR223 SARS-CoV-2 NSP4, and pDONR223 SARS-CoV-2 NSP6 from Wuhan-HU-1 SARS-CoV-2 (gifts from Fritz Roth, Addgene plasmids #141257, #141258, and #141260, respectively)33. For carboxy-terminal tagging of NSP6, the stop codon was removed using the oligo pairs NSP6 ns(+)/NSP6 ns(-) (Supplementary Table 2) with the Agilent QuikChange kit. The Agilent QuikChange kit and the oligos described in Supplementary Table 2 were used to make the following NSP6 N-terminally-tagged mutant constructs: NSP6-1-157 (amino acids 1-157); NSP6-C80 (amino acids 211-290); the mutants in the amphiphilic alpha helix NSP6-F220Q/T222W and NSP6-C80-F220Q/T222W; and the VoC mutant constructs NSP6-ΔSGF, NSP6-ΔSGF/NSP7.
The NSP6-NSP7 sequence was synthesized with flanking attB sequences by ThermoFisher (Supplementary Table 1), a V5 tag was added to NSP7 by PCR, and the amplicon was cloned into the Gateway vector pDONR223 and recombined with destination vector pCDNA3.1 containing HA to produce pHA-NSP6-NSP7-V5.
The IBV (avian infectious bronchitis virus, strain M41) NSP6 sequence (corresponding to Uniprot P0C6Y3 from position 3089 to 3381), optimized for human expression and synthesized with flanking attB sequences by ThermoFisher (Supplementary Table 1), was cloned into the Gateway vector pDONR223 and recombined in FLAG-containing Gateway destination vectors at the amino or carboxy terminus. Oligos NSP6-IBV ns (+)/NSP6-IBV ns (-) (Supplementary Table 2) were used to remove the stop codon for the carboxy terminal-tagged construct.
mCherry-DFCP1 was a gift from Do-Hyung Kim (Addgene plasmid #86746). pEGFP-ATF6 was a gift from Ron Prywes (Addgene plasmid #32955). mCherry-Calreticulin-N-16 (Michael Davidson, Addgene plasmid #55006), pLenti-X1-Neo-GFP-ATL2 (Jacob Corn, Addgene plasmid #109020), pEGFPC-DFCP1, and pRUBY-N1-KDEL were kindly provided by Paolo Grumati (TIGEM, Naples). pEGFP-Rab18 was a gift from Marci Scidmore (Addgene plasmid #4955).
The Agilent QuikChange kit and the oligos described in Supplementary Table 2 were used to make the following mCherry-DFCP1 mutant constructs: DFCP1-Δ1-416 (lacking the amino terminus); DFCP1-W543A (point mutation in the ER domain); DFCP1-C654S/C770S (mutations in the double FYVE domain unable to bind PI3P).
GST-tagged DFCP1 was constructed by amplifying the coding sequence from mCherry-DFCP1 with oligos DFCP1-p223(+)/DFCP1-p223(-) and cloning into the Gateway vector pDONR223 and subsequently into the Gateway vector pET60.
pEYFPC3-Cb5, constructed as described12 using YFP instead of mCherry, and pEGFP-VAPA were made in our laboratory. pEGFP-ERGIC53 and p-KDELR-EGFP were kind gifts from Alberto Luini (IBBC-CNR, Naples).
BP clonase and LR clonase for Gateway cloning were purchased from ThermoFisher. All other reagents for molecular biology were purchased from New England Biolabs.
Cell culture, transfection, and RNA interference
HeLa cells were obtained from ATCC and cultured as previously described12. Calu-3 cells (human lung adenocarcinoma), a kind gift from Louis J. Galietta (TIGEM, Naples), were cultured in DMEM F-12 (Gibco), supplemented with 10% Fetal Bovine Serum (Euroclone) 100 IU ml−1 penicillin and 100 μg ml−1 streptomycin (Thermo Fisher Scientific) and 2 mM L-Glutamine (Thermo Fisher Scientific) in a humidified incubator at 37 °C and 5% CO2. Cell lines were routinely tested for mycoplasma (Biological Industries). Cells were transfected with plasmids using either TransIT-LT1 (Mirus Bio LLC) for HeLa cells or Lipofectamine® LTX and PLUS™ Reagent (Thermo Fisher Scientific) for Calu-3 according to the manufacturer’s instructions. Expression was maintained for 16-24 h before processing unless otherwise stated. For RNA interference, HeLa and Calu-3 cells were mock-treated or treated with DFCP1 siRNA (50 nM) for 96 h using Lipofectamine™ RNAiMAX (Thermo Fisher Scientific) for direct transfection. siRNA sequences used in this study are listed in Supplementary Table 2.
Generation of HeLa FLAG-NSP6 and HA-NSP6 doxycycline-inducible stable lines
To generate stably expressing clones, HeLa cells were transfected with the plasmids pLTD-FLAG-NSP6, pLTD-FLAG-NSP6ΔSGF, pLTD-HA-NSP6, or pLTD-HA-NSP6ΔSGF and selected with complete medium containing 3μg ml−1 puromycin (Calbiochem). Single cell cultures were isolated from the mixed populations and protein expression was probed and induced with 1μg ml−1 doxycycline (Sigma-Aldrich) at different time points, as indicated. Samples were then processed by immunofluorescence analysis. All the cell lines generated in this study were authenticated through western blot and immunofluorescence.
SARS-CoV-2 infection and assays
SARS-CoV-2 infection, virus titration and cell death assay through the activity of lactate dehydrogenase (LDH) were performed as elsewhere described24. For immunofluorescence experiments, Calu-3 cells were seeded on coverslips, left untreated or pre-treated for 2 h with K22 or with the DGAT-1 inhibitor A922500 at different concentrations, as indicated in the Figures. Cell number and cell viability after treatment with either K22 or A922500 were assessed by crystal violet staining, cell morphology analysis, or LDH assay. No cytostatic or cytotoxic effect of the drugs was observed at the concentrations used. For immunofluorescence experiments and drug treatments, Calu-3 cells were seeded on coverslips and infected with SARS-CoV-2 early lineage (SARS-CoV-2/human/BRA/RJ01/2020, GenBank accession no. MT710714) at a MOI of 0.01 for 48h. Infected cells were fixed with 3.7% formaldehyde and processed for immunofluorescence as described24. For comparative analyses of NSP3-NSP6 proximity, cells were similarly infected with early lineage and γ variant (hCoV-19/Brazil/AM-L70-71-CD1739/2020, GISAID ID: EPI_ISL_1060902) at a MOI of 0.01 for 48h.
For EM experiments, Calu-3 cells were infected with early lineage B.1 (hCoV-19/Italy/CAM-INMI-32803-66/2020, GISAID ID: EPI_ISL_493333) or γ variant (hCoV-19/Italy/CAM-IZSM-RD020483D54/2021, GISAID ID: EPI_ISL_2933105) SARS-CoV-2 strains at 10 MOI for 24 h. SARS-CoV-2 infected Calu-3 cells were processed for EM as described below. All procedures related to virus culture were handled at a biosafety level 3 (BSL3) multiuser facility, according to WHO guidelines.
Drug treatments
FLAG-NSP6 and mCherry-DFCP1 transfected cells were treated with either 100 nM Wortmannin or 1 μM VPS34 inhibitor SAR405 for 3 h, then processed for immunofluorescence. For K22 treatment, cells were transfected and after 30 min DMSO or 40 μM K22 were added.
Recombinant proteins and pull-down/Co-IP experiments
All recombinant proteins were purified from E. coli Rosetta DE3 cells (Merck). GST-tagged DFCP1 from plasmid pET60 and GST alone from plasmid GEX-4T2 (GE Healthcare) were expressed as described34. For pull-down experiments, 3 mg of cellular lysates from HA-NSP6 transfected HeLa cells were incubated with GST-DFCP1 or GST alone (0.1 μM) overnight at 4 °C in 950 μl binding buffer (25 mM Tris pH 7.4, 150 mM NaCl, 0.1% Triton X-100, 0.1% NP-40, 1 mM EDTA and protease inhibitors). Glutathione-beads were added, incubated for 1 h at 4°C, washed four times with incubation buffer and twice with a similar buffer without detergents, eluted, and analysed by SDS-PAGE.
For Co-IP experiments, 1.7 mg of cellular lysate from cells mock-transfected or co-transfected with HA-NSP6 together with GFP-NSP6, FLAG-NSP6, GFP-ERGIC53, GFP-Atlastin2 or GFP-NSP6-1-157, or co-transfected with HA-NSP6ΔSGF and GFP-NSP6ΔSGF, were incubated with appropriate antibody-conjugated beads (HA, FLAG and GFP). After overnight incubation at 4 °C in 750 μl binding buffer, samples were washed five times with binding buffer and once with a similar buffer without detergents, eluted, and analysed by SDS-PAGE. To evaluate Co-IP efficiency a total of three independent experiments was analysed. The co-immunoprecipitated GFP-NSP6 signal was divided by the GFP-NSP6 signal in the Input and normalized by the signal of the immunoprecipitated primary antigen (HA). Co-IP efficiency was reported as Mean ± SEM of co-immunoprecipitated GFP-NSP6ΔSGF compared to GFP-NSP6.
Detergent extraction
HeLa cells transfected with FLAG-NSP6, NSP6-FLAG, or FLAG-NSP6ΔSGF were lysed in buffer (25mM Tris pH 7.4, 150 mM NaCl, 1 mM EDTA with protease and phosphatase inhibitor cocktails) containing increasing concentrations of Triton X-100 and NP-40 (1:1) and centrifuged at 13,200 rpm, 10 min. The pellet was resuspended in the same volume as the supernatant and equal volumes were subjected to Western blot analysis using an anti-FLAG antibody.
Metabolic radiolabeling
For metabolic labeling, wild-type HeLa cells or the pLTD-HA-NSP6 or pLTD-HA-NSP6-ΔSGF stable cell lines were induced with doxycycline (1μg ml−1) for 13 h, incubated for 30 min with methionine/cysteine-free medium (21013024, Gibco), and then incubated for 1 h at 37 °C with 50 μCi ml−1 35S-methionine/cysteine (PerkinElmer) in the same medium. The cells were then washed 3 times with complete medium and further incubated for different times at 37 °C in complete medium. Doxycycline (1μg ml−1) was included in all media. Following cell lysis, proteins were immunoprecipitated with anti-HA affinity beads, and analysed by SDS-PAGE gel autoradiography (using a Typhoon Imager, Image QuantTool, GE healthcare) of the immunoprecipitates to measure protein stability followed by immunoblot using anti-HA to measure total protein levels.
Western blot analysis
Western blot analysis and densitometry were performed as previously described34. Samples containing NSP6 were mixed with sample buffer (100 mM Tris pH 6.8, 25% glycerol, 2% SDS, 0.01% bromophenol blue, 10% 2-mercaptoethanol), but were not boiled before loading.
Immunofluorescence analysis
Immunofluorescence analysis was performed as previously described12.
Digitonin/Triton-X-100 permeabilization
HeLa cells transfected with FLAG-NSP6 or NSP6-FLAG were grown on coverslips and fixed with 4% PFA for 10 min, washed three times with Buffer A (20 mM PIPES pH 6.8, 137 mM NaCl, 2.7 mM KCl) and permeabilized with 20 μM digitonin (Calbiochem) diluted in Buffer A for 5 min. Coverslips were blocked for 30 min with blocking solution (5% FBS [vol/vol] and 50 mM NH4Cl in Buffer A) without any additional permeabilizing agent and incubated with primary anti-FLAG and anti-TGN46 antibodies diluted in blocking solution. The TGN46 antibody was raised against a luminal portion of the protein that is thus not accessible upon digitonin permeabilization. This represents a control that only the plasma membrane has been permeabilized. Coverslips were washed with Buffer A and incubated with fluorochrome-conjugated secondary antibodies (Alexa Fluor 488 for FLAG and Alexa Fluor 568 for TGN46 in Buffer A) for 1 h at RT. After incubation, cells were fixed with 2% PFA for 5 min and washed once with 50 mM NH4Cl in PBS. Coverslips were subsequently permeabilized with 0.1% Triton-X-100 in PBS for 5 min. Cells were then blocked with blocking solution (0.05% saponin, 0.5% BSA, and 50 mM NH4Cl in PBS) and incubated with the same primary antibodies used in the first step. Coverslips were then washed with PBS and incubated with fluorochrome-conjugated secondary antibodies (Alexa Fluor 405 for FLAG and Alexa Fluor 633 for TGN46 in PBS) for 1 h at RT. The TGN46 epitope becomes accessible to the primary antibody under these conditions, confirming selective permeability and identifying luminal epitopes.
Lipid droplet staining and assays
LDs were stained by adding 0.5 μM BODIPY 493/503 (ThermoFisher) to the fluorochrome-conjugated secondary antibody mix for 30 min after fixation and processed as for immunofluorescence analysis.
To monitor lipid transfer from LDs to DMVs we followed the protocol described in Rambold et al.30. Briefly, BODIPY 558/568-DA-C12 at a final concentration of 1 μM was added for 16 h to the culture medium of HeLa cells transfected with GFP-NSP4/HA-NSP3 or GFP-NSP4/HA-NSP3/FLAG-NSP6. Cells were then washed and incubated with DMEM supplemented with delipidated serum (1%) for an additional 6 h. Coverslips were fixed and processed as described above. NSP4 puncta were identified by using the Analyze particles tool of Fiji (ImageJ) software, and the fluorescence mean intensity of Bodipy-DA-C12 for each particle was determined. Particles with values equal or higher than a similar area of the ER were defined as “positive” particles. The percentage of NSP4 Bodipy-DA-C12 positive particles was calculated for each cell.
Confocal Microscopy and image analyses
Cells were imaged using a Plan-Apochromat 100×/1.4 oil objective on a Zeiss LSM800 or LSM880 confocal system equipped with an AiryScan module and controlled by the Zen blue software. Fluorescence images presented are representative of images collected from at least three independent experiments, unless otherwise stated (see “Statistics and Reproducibility” section for further details). The images used for phenotype quantification were acquired with the same parameters (i.e. digital gain, laser power, magnification) and processed with Fiji (ImageJ; National Institutes of Health) software. Brightness and contrast were adjusted with Adobe Photoshop, and Figure panels were assembled with Adobe Illustrator.
Structure quantification: number and area
NSP6, NSP4, LC3 and LD structures were analysed using the Analyze particle function to determine their number per cell. For each experiment, images were acquired below saturation limit and the same threshold was chosen and applied to all of them. For the calculation of the size of the structures the Analyze particle function was used, setting “Area” as measurement.
NSP4 puncta distribution
To calculate the distribution of NSP4 puncta in each cell, the Analyze particle function was used, considering a particle size between 0.1 and infinity and choosing the center of mass as reference for measurement. X and Y coordinates for each NSP4 puncta were obtained and plotted. A four-quadrant subdivision was applied to the images using XY coordinates of the centre of mass as the axis origin. The relative abundance of the NSP4 puncta for each quadrant is expressed as a percentage of the total identified structures for each cell.
Relative distribution of the NSP6 protein
To measure the cellular distribution of NSP6 fluorescence, the integrated density of NSP6 in NSP6 structures was calculated over the integrated density of total NSP6 in the whole cell. Cells with comparable levels total integrated fluorescence intensity were analyzed for each time point. Results were expressed as percentage of the fluorescent NSP6 signal present in the NSP6 structures over the total fluorescence.
Recruitment on NSP6 structures
The fraction of VAP-A or NSP6 1-157 associated with NSP6-positive structures was measured as the ratio between the integrated density of each protein on the NSP6 structures and the integrated density in the whole cell.
Co-localization between NSP6 and DFCP1
Co-localization between NSP6 and WT or mutant DFCP1 was calculated using the JACoP plugin35.
Distance between particles
The relative distance between objects has been determined with DiAna plugin36. Briefly, channels were thresholded and then segmented. For LD distance from NSP4 and NSP6 in transfected cells shown in Fig. 4b, Edge-Edge distances between particles were measured cin the whole cell and expressed as pixel unit of images acquired with scale of 24 pixel/mm (1 pixel unit= 24 pixels). No values were excluded. In addition, for selected images including the one in Fig. 4a we applied the Shuffle function36 as shown in Extended Data Fig. 9f. Briefly, this function redistributes the objects in a channel in a random manner; then the distances between objects of the randomized channel to the closest object in the second channel from the original image are measured. The distribution of these distances is represented as the mean (red line) flanked by 95% confidence intervals (green lines). The distribution of the distances measured between the objects in the two channels from the original images is plotted (blue line). If this distribution falls outside the confidence interval of the distance obtained for shuffled images, the distance is considered as statistically significant (p<0.05).
For the proximity between LDs and dsRNA or NSP6 in Extended Data Fig. 9d, and the proximity between dsRNA and NSP6 in Extended Fig. 7i, in infected cells, the Edge-Edge distance was analyzed and structures closer than 250 nm (in all directions) were considered as associated structures. To calculate the distance between NSP3-NSP6 positive structures in infected cells in Fig. 3b both centre-centre and edge-edge distances were measured.
NSP6fluorescence intensity measurements
HeLa cells expressing FLAG-tagged NSP6 were fixed and processed for immunofluorescence. Cells with similar expression were acquired using the same parameters and processed with the Fiji (ImageJ) software. The integrated density of each cell was measured.
Electron microscopy
For pre-embedding immuno-electron microscopy (IEM) the cells were fixed, permeabilized and labeled as described previously37. Briefly, the cells were fixed with a mixture of 4% paraformaldehyde (PFA) and 0.05% glutaraldehyde (GA) prepared in 0.2 M HEPES buffer for 10 min (RT) and then with 4% PFA alone for 30 min (RT), followed by incubation with blocking/permeabilizing solution (0.5% bovine serum albumin (BSA), 0.1% saponin, 50 mM NH4Cl in PBS) for 30 min.
Cells were incubated with a primary anti-HA monoclonal antibody (1:600, BioLegend) diluted in blocking/permeabilizing solution overnight and then a secondary anti-mouse antibody (1.4 nm gold-conjugated Fab' fragment diluted 1:50, Nanoprobes) was added for 2 h. The GoldEnhance™ EM kit (from Nanoprobes) was used to enhance ultrasmall gold particles. For double labelling of cells expressing HA-NSP3, mCherry-NSP4 and GFP-NSP6, enhancement with the anti-HA antibody was performed for 3 min and then a primary anti-GFP polyclonal rabbit antibody (1:250, Abcam) was added and processed as above using a secondary anti-rabbit antibody (1.4 nm gold-conjugated Fab' fragment diluted 1:50, Nanoprobes) for 2 h, followed by gold enhancement for an additional 3 min. The longer enhancement time for the anti-HA detection causes the formation of larger gold particles (clusters) with irregular shape that distinguishes HA-NSP3 from the smaller GFP-NSP6 signals in doubly-transfected cells.
For conventional EM the cells were fixed with 1% GA prepared in 0.2 M HEPES buffer for 30 min (RT).
Cells prepared for IEM or conventional EM were scraped, pelleted, post-fixed in OsO4 and uranyl acetate, dehydrated, embedded in Epon and polymerized at 60 °C for 72 h. For each sample, thin sections were cut using a Leica EM UC7 ultramicrotome (Leica Microsystems, Vienna, Austria). EM images were acquired from thin sections using a FEI Tecnai-12 electron microscope (FEI, Eindhoven, Netherlands) equipped with a VELETTA CCD digital camera (Soft Imaging Systems GmbH, Munster, Germany). Morphometric analysis of the structures of interest was performed using iTEM software (Olympus SYS, Germany).
Correlative-Light Electron Microscopy (CLEM)
HeLa cells were transfected with either HA-NSP6 or HA-NSP6ΔSGF or they were co-transfected with HA-NSP3/mCherry-NSP4/GFP-NSP6 or HA-NSP3/mCherry-NSP4/Myc-NSP6 where indicated. Transfected cells were treated or not with 40 μM K22 30 min post-transfection. After overnight expression, cells were fixed as for IEM and then labelled with an anti-HA antibody followed by detection with a secondary Alexa Fluor®-546 FluoroNanogold™-anti-mouse Fab’. The structures of interest carrying different proteins were visualized by confocal microscopy using a Zeiss LSM800 station and fluorescent images were recorded. Then the cells were post-fixed, dehydrated, embedded in EPON and polymerized as described above. Serial 60 nm sections were cut and analysed using a FEI Tecnai-12 electron microscope. The same cell and structures of interest obtained by confocal microscopy were identified on EM images using Zen Connect software (Zeiss).
Electron tomography
250 nm-thick Epon sections were collected on formwar carbon-coated slot grids and analysed using a Tecnai G2 Spirit BioTwin electron microscope (FEI) equipped with an automated tomography stage. The single tilt series of images were acquired in a range of - 65° to + 65° (at 1° intervals) using Xplore 3D - TEM Tomography software (FEI) at 40,000X magnification unless otherwise stated. Tilt series were used with the open source IMOD software to generate tomograms. At least 10 tomograms were analysed per experimental condition. For 3D reconstruction, the surfaces of DMVs and surrounding ER membranes were rendered using the IMOD software.
FLIM-measurements, FRAP and FLIP analysis
FLIM-FRET analysis of GFP-NSP6 alone and in combination with mCherry-NSP6, mCherry, or mCherry-DFCP1, and of mCherry-NSP6 with GFP-NSP6 1-157, GFP-ERGIC, and GFP-atlastin 2, was performed as previously described12. FLIM data analysis was performed using SymPhoTime 64 (Picoquant). For live cell imaging of the NSP6 structures, cells were plated in glass-bottomed dishes (MatTek), transfected with the fluorescently-tagged protein constructs or incubated with β-BODIPYTM FL C12-HPC (1 μM) for 16 h, and imaged with an LSM800 microscope (Zeiss) fitted with 488 and 561 nm argon laser lines, using a 63x PlanApochromat NA 1.4 DIC oil immersion objective. During imaging, cells were maintained in complete culture medium in a humidified atmosphere at 37 °C. Fluorescence images presented are representative of cells imaged in at least three independent experiments and were processed with FIJI (ImageJ; National Institutes of Health) software.
FRAP experiments and time-lapse laser-scanning confocal microscopy were performed as described12. Briefly, a single NSP6 structure was acquired 5 frames before bleaching (6 sec/frame). Bleaching was performed with 100% power of the 488 laser for 10 iterations. Recovery was monitored for 600 seconds after the bleaching event. At least 30 independent structures were analysed for each condition in three different experiments. Data were exported using Zen software (Zeiss) and corrected for bleaching by dividing the fluorescence intensity of the bleached area by that of an unbleached area. Bleaching was minimal during the time course of recovery (between 0-10%): where bleaching exceeded 10%, the recovery sequences were discarded.
Quantification of GFP-NSP6 and GFP-NSP6ΔSGF dissociation from membranes was measured in living cells by fluorescence loss in photo-bleaching (FLIP). FLIP was performed in cells expressing each GFP-tagged protein by bleaching iteratively (100 times, with intervals of 6 sec between frames) the GFP-associated fluorescence in the entire cell area except for a region of interest (ROI) containing NSP6 structures. The ROI usually accounted for 10-15% of the total cell area. The relative fluorescence intensity of single structures expressed as a percentage of pre-bleaching fluorescence was plotted as mean values ± SD. A slowdown of the FLIP-induced decay curves of GFP-NSP6ΔSGF from the structures was observed indicating an increase in GFP-NSP6ΔSGF association with membranes.
EM quantification
The percentage of normal and zippered ER (or NE) surface was quantified in random thin sections from pellets of NSP6-transfected HeLa cells using morphometric grids with the iTEM software (Olympus-SIS, Germany). Quantification of gold particles in thin sections from HeLa cells expressing HA-NSP6 or HA-NSP6ΔSGF and immuno-gold labelled for HA was performed with the touch count tool of the iTEM software. This quantification was further used as a measure of HA-NSP6 or HA-NSP6ΔSGF expression in each analysed cell to normalize surface area of zippered ER for the expression level of corresponding HA-tagged NSP6 protein. To assess the impact of NSP6 or NSP6ΔSGF on the organization of DMVs, tomograms of DMV clusters were used to quantify the following parameters: DMV diameter, shape factor (ratio between long and short axes), density (number per DMV cluster area), length of ER-DMV connections, number of DMVs per connection and overall number of ER-DMV connections per DMV cluster. DMV cluster was defined as a group of DMVs whose distance from the nearest neighbour does not exceed 2 average DMV diameters. All measurements in tomograms were done with the 3D Manager plugin of the open source Fiji software. The same tools were used to quantify the length of zippered DMV connectors in tomograms from Calu-3 cells infected with the early lineage B.1 or γ variant of SARS-CoV-2.
NSP6 protein topology
NSP6 topology modelling was performed using the Constrained Consensus TOPology prediction server (CCTOP, Institute of Enzymology, Budapest, Hungary). The amphipathic features of the alpha helix were determined using HELIQUEST (http://heliquest.ipmc.cnrs.fr)16 and the mutations were introduced following the Genetic Algorithm based module. Images and cartoons shown in Fig. 2a and Extended Data Fig. 11 were created with BioRender.com.
Phylogenetic analysis
The phylogenetic analysis of SARS-CoV-2 genomes deposited on GISAID (https://www.gisaid.org/) was performed on a set of 3,508 representative genomes sampled from December 2019 to July 2021, provided by Nextstrain18 (https://nextstrain.org/ncov/global). The percentages of genomes carrying the SGF deletion in the NSP6 protein were evaluated on samples deposited on GISAID up to July 16th 2021.
Statistics and Reproducibility
Statistical analyses were performed using GraphPad Prism7 (GraphPad Software Inc) or R software environment for statistical computing (rstatix R package).
To test the normal distribution of the data and the homogeneity of variance across groups, Shapiro-Wilk test and Levene’s test were used on the ANOVA residuals. When measured variables were normally distributed, statistical significance of difference in measured variables between control and treated groups was determined by t-test or analysis of variance (ANOVA) followed by appropriate multiple comparison post-hoc tests depending on the experiment. When measured variables were not normally distributed, non-parametric Mann-Whitney or Kruskal-Wallis tests were performed followed by appropriate multiple comparison post-hoc tests depending on the experiment.
All the experiments for which statistics was derived, were performed three times with similar results; N indicates the number of experiments and n the number of total measurements or observations. All the replicates performed were biological and not technical. Detailed information for each experiment of the study are provided below.
Experiments shown in Extended Data Fig. 1a, 1e, 3h, 6a, 9c were repeated twice.
Experiments shown in Fig. 1b, 1c, 1g, 1h, 1i, 2i, 2j, 3d, 3e, 3f, 3i, 3n, 4c and Extended Data Figure 1f, 1g, 1h, 1i, 1j, 2a, 2b, 2c, 3a, 3d, 4c, 4d, 4e, 4f, 4g 4h, 4i, 5k, 5l, 6d, 6e, 6i, 6j, 6l, 6m, 7c, 7d, 7e, 8a, 8b, 8f, 8g, 8h, 9a, 9b, 9f, 9g, 9h, 10a, 10b were repeated three times.
Experiments shown in Extended Data Figure 1c, 1d, 2d, 2e, 5c, 5m, 6c, 6f were repeated four times. Experiments shown in Figure 1a, 3a, 4d and Extended Data Figure 6g, 9i, 10c were repeated five times. Experiments shown in Extended Data Figure 5b was repeated six times. Experiments shown in Figure 1e, 1f, 3c and Extended Data Figure 5j, 6b were repeated ten times.
Extended Data
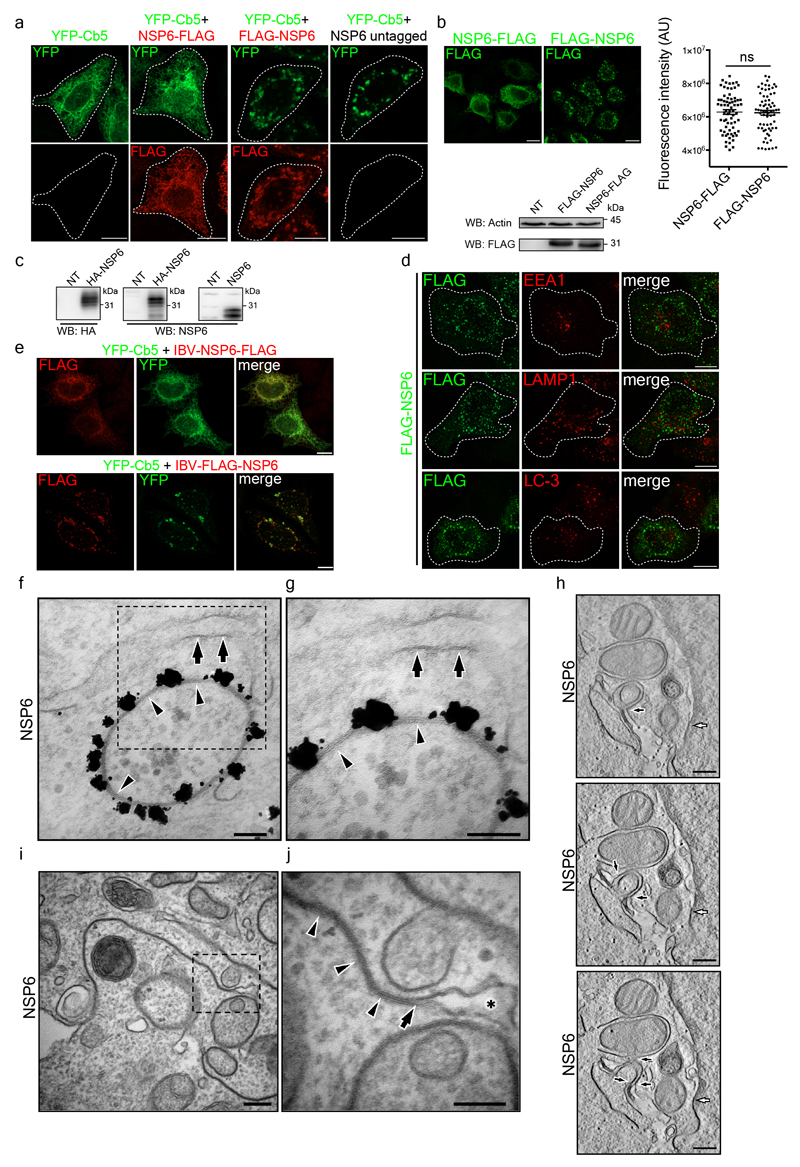
Extended Data Fig. 1. NSP6 requires a free C-terminus to exert its membrane deforming activity.
a, Fluoromicrographs of Calu-3 cells expressing YFP-Cb5 alone (leftmost panels) or in combination with C-terminally or N-terminally FLAG-tagged NSP6, or untagged NSP6 (NSP6), as indicated, and immunostained with anti-FLAG antibody (red). b, Expression analysis of NSP6-FLAG (C-term) or FLAG-NSP6 (N-term) in transfected HeLa cells. Left, representative fluorescence micrographs (anti-FLAG antibody). Right, fluorescence intensity measurements. Single values are plotted, Means ± SEM are indicated. N=3, n=69 cells. ns, not significant. Two-tailed unpaired t-test with Welch's correction. Lower panel, Western blot of total protein lysates using an anti-FLAG antibody; actin was used as a loading control. NT, non-transfected cells. c, Western blot of HeLa cells expressing HA-NSP6 or untagged NSP6, detected using anti-HA or anti-NSP6 antibody, as indicated. NT, non-transfected cells. d, HeLa cells transfected with FLAG-NSP6 immunostained with anti-FLAG, anti-LAMP1, anti-EEA1 or anti-LC3 antibodies. e, Fluoromicrographs of HeLa cells expressing YFP-Cb5 and either IBV-NSP6-FLAG (upper panels) or IBV-FLAG-NSP6 (lower panels). Cells immunostained with anti-FLAG antibody (red). f, IEM (anti-HA immunogold-labelling) of a HeLa cell expressing HA-NSP6. g, Magnification of the boxed area. Arrows show the regular single membrane of the ER cisterna while arrowheads indicate zippered-membranes in the circular NSP6-positive structure. h, Single slices from a tomogram of a HeLa cell expressing HA-NSP6. Connections of circular zippered structures with the ER are shown by black arrows, while the connection of linear zippered membranes with the nuclear envelope is indicated by a white arrow (see Supplementary Video 1). i, Routine EM of a HeLa cell expressing HA-NSP6 and j, magnification of boxed area. The arrow indicates apposition of limiting membranes of an ER cisterna (asterisk) that then continues into the zippered ER domain (arrowheads). Western blots in b and c are representative of three independent experiments each. Scale bars, a, b, d, e, 10 μm; f, g, 100 nm; h, 230 nm; i, 200 nm; j, 100 nm.
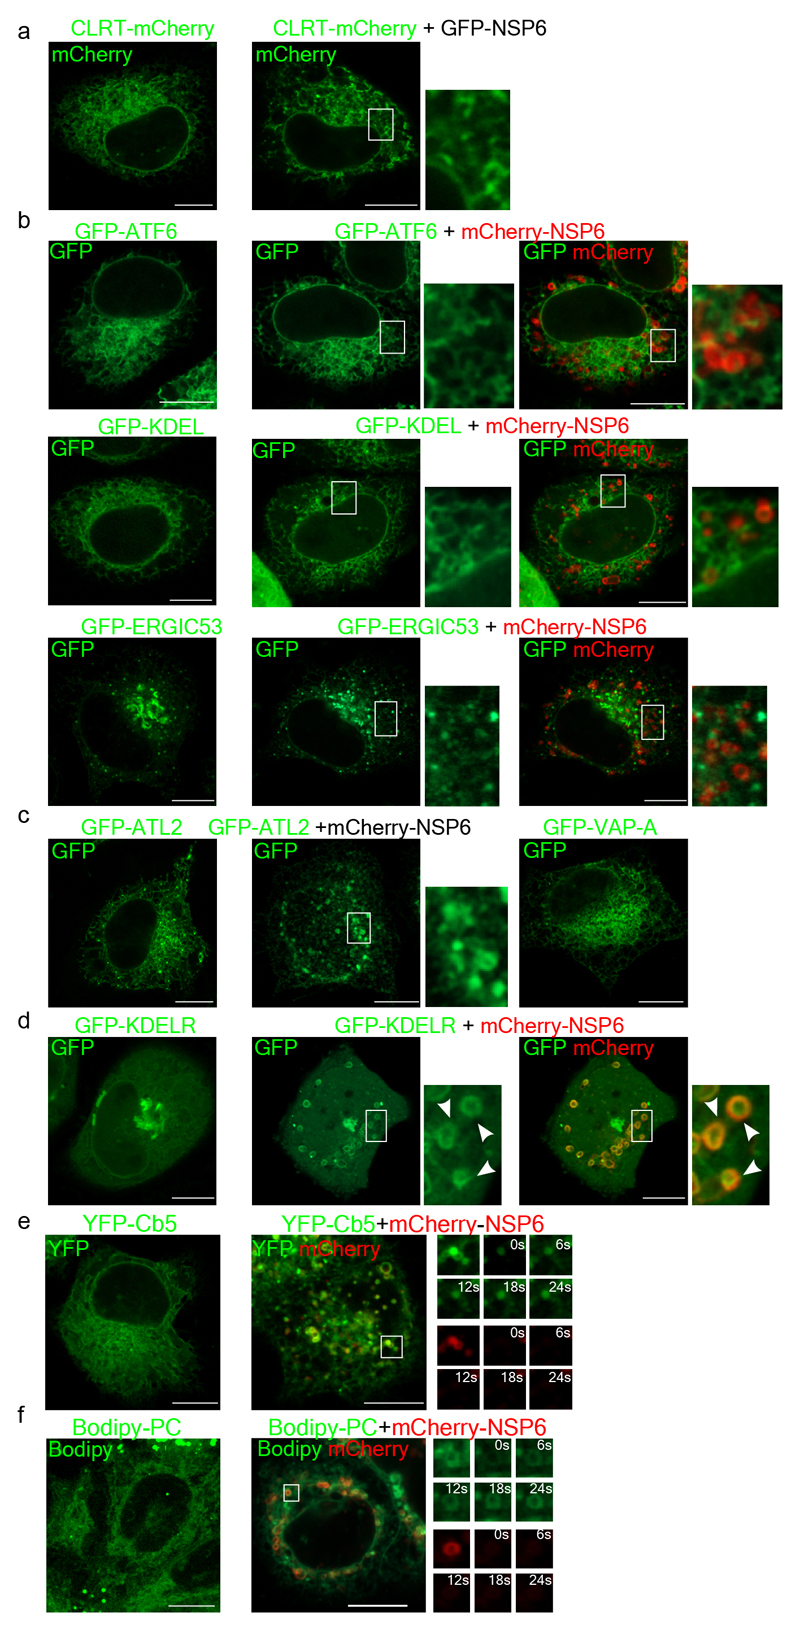
Extended Data Fig. 2. The NSP6-compartment is accessible to ER-membrane-proteins with small luminal domains but not to membrane-proteins with large luminal domains.
a, Fluoromicrographs of HeLa cells expressing CLRT-mCherry alone (left panel) or with GFP-NSP6 (right panel). b, Fluoromicrographs of HeLa cells expressing GFP-ATF6 or GFP-KDEL or GFP-ERGIC53 alone (left panel) or with mCherry-NSP6 (middle and right panels). c, Fluoromicrographs of HeLa cells expressing GFP-ATL2 alone (left panel), or with mCherry-NSP6 (middle panel), or expressing GFP-VAP-A (right panel). d, HeLa cells expressing GFP-KDELR alone (left panel) or with mCherry-NSP6 (middle and right panels). Small panels in (b-d), enlargements of boxed areas, arrowheads indicate co-localization in (d). e, Representative images of Hela cells expressing YFP-Cb5 alone or with mCherry-NSP6, as indicated. For FRAP analysis, individual NSP6-compartments (boxed) were photobleached and the fluorescence recovery was monitored. The small panels are representative frames (from a total of 100) showing time in seconds after the bleach (see Supplementary Video 3). See Fig. 1k for FRAP measurements. f, Representative images from FRAP experiments of Hela cells incubated with Bodipy C12-HPC (PC), without or with mCherry-NSP6 transfection, as indicated. Individual NSP6-compartments (boxed) were photobleached and the fluorescence recovery was monitored. The small panels are representative frames (from a total of 100) showing time in seconds after the bleach (see Supplementary Videos 2, 3). Scale bars, 10 μm.
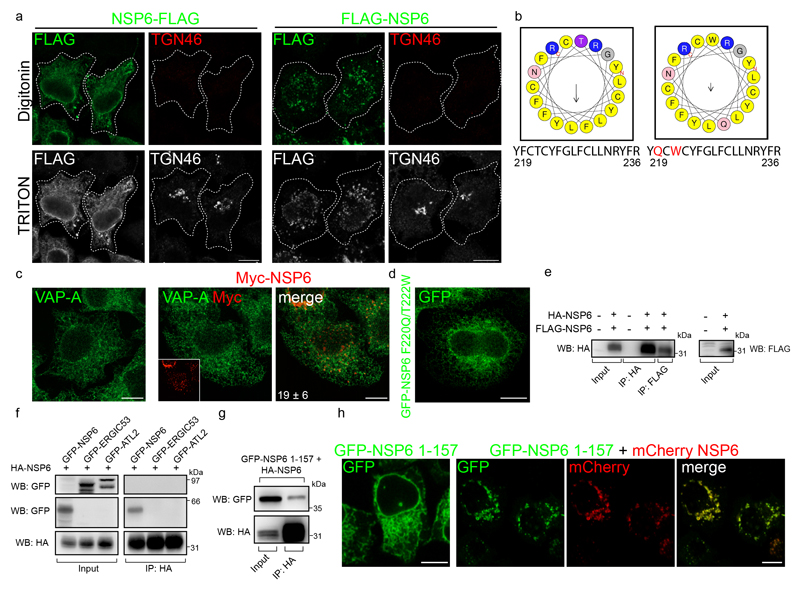
Extended Data Fig. 3. NSP6 undergoes homodimerization through the 1-157 region.
a, HeLa cells expressing C-terminal or N-terminal FLAG-tagged NSP6 immunostained with anti-FLAG antibody and an antibody against a luminal epitope of TGN46 after permeabilization with digitonin and subsequently with Triton-X-100 (see Methods). b, Model of the amphipathic helix of NSP6 (left panel) according to HELIQUEST (see Methods). Apolar residues are in yellow, polar residues and glycine have been given different colours. The arrow indicates the hydrophobic moment (μH = 0.409). Numbers indicate amino acid positions of the NSP6 protein. Right panel, model of the F220Q/T222W NSP6 mutant helix (μH = 0.191). Mutations that abolish the amphipathic character of the helix are in red. c, HeLa cells untransfected (left panel) or expressing Myc-NSP6 were immuno-stained for VAP-A or for Myc. Insets show the Myc-NSP6 signal. The number indicates the fraction of VAP-A associated with the NSP6 structures. Mean ± SD, N=3, n=74. d, HeLa cells expressing GFP-NSP6 F220Q/T222W mutant. e, f, g, Cell lysates (input) and immunoprecipitates (IP, with anti-HA or anti-FLAG antibodies) from HeLa cells, untransfected or expressing the indicated NSPs were analysed by Western blot with anti-HA, anti-FLAG or anti-GFP antibodies as appropriate. Images are representative of three independent experiments. h, Fluoromicrographs of HeLa cells expressing GFP-NSP6 1-157 alone or with mCherry-NSP6. Scale bar, a, c, d, h, 10 μm.
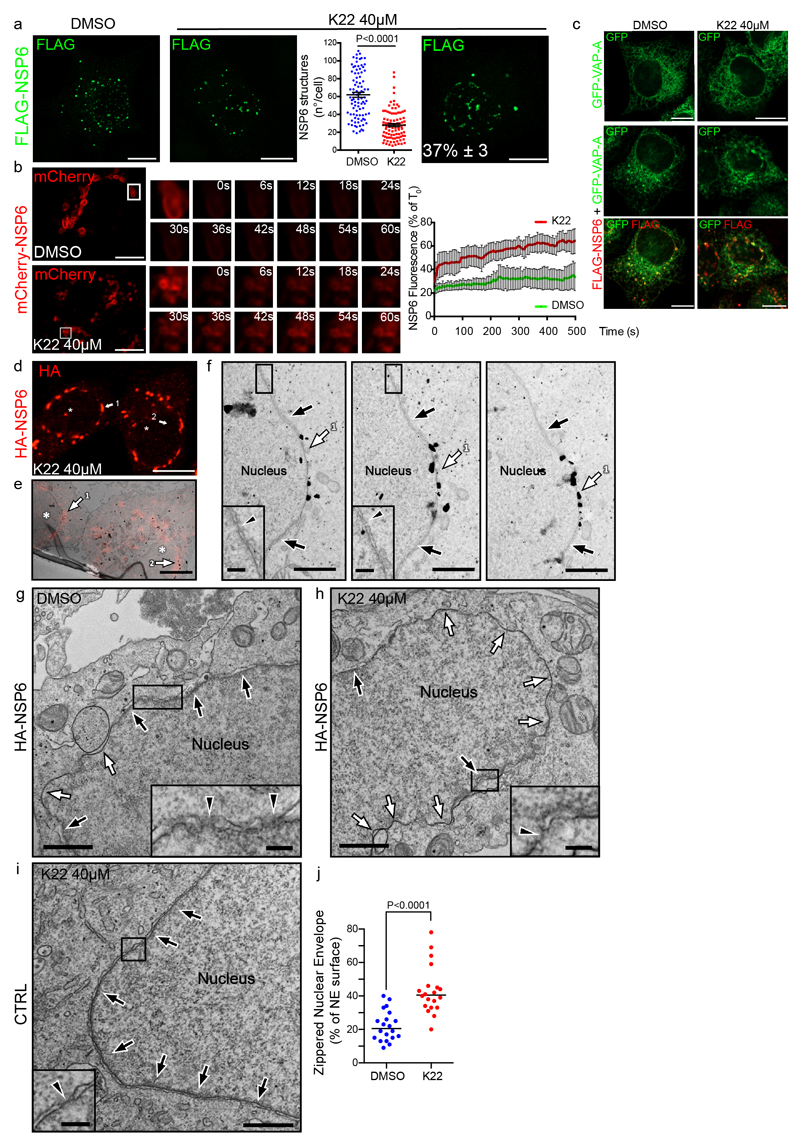
Extended Data Fig. 4. K22 interferes with the formation of the NSP6-compartment.
a, Stably transfected FLAG-NSP6 clone induced with doxycycline and treated with DMSO or K22 for 24 h. K22 reduced the number of NSP6 structures and resulted in elongated structures in a percentage of the cells (right panel, number of cells exhibiting these structures. Mean ± SD). The number of NSP6 structures in DMSO and K22-treated cells is plotted as single values. Mean ± SEM, N=3, n=90. Two-tailed unpaired t-test with Welch’s correction. b, FRAP analysis of mCherry-NSP6-structures (boxed) in cells treated with DMSO or K22. The small panels show time in seconds after the bleach. Graph, FRAP curves expressed as a % of time 0. Means ± SD, N=3, n=45 structures. c, Cells expressing GFP-VAP-A alone (as a control) or with FLAG-NSP6, treated with DMSO or with K22 for 16 h. d-f, Immuno-CLEM of HA-NSP6 expressing cells treated with K22 for 24 h. d, Fluoromicrograph showing NSP6 (anti-HA immunostaining with Alexa Fluor®546-FluoroNanogold secondary antibody) in elongated structures (arrows 1, 2) close to the nucleus (asterisk). e, EM section of the same cells (asterisks) shown in (d). Arrows 1 and 2 indicate overlap of the fluorescent and immuno-gold signals in the elongated zippered domains of the nuclear envelope (NE). f, Serial sections of the structure indicated by arrow 1 in panel (e). White arrows: NSP6-zippered domains of the NE, black arrows: regular NE. Insets, magnification of boxed areas showing regular NE (arrowheads: nuclear pore). g, h. EM showing regular (black arrows) and zippered (white arrows) NE domains in cells expressing HA-NSP6 treated with DMSO (g) or K22 (h). i, A cell not expressing NSP6 treated with K22 shows regular NE (black arrows). Insets in g-i, magnification of boxed areas showing regular NE (arrowheads: nuclear pores). j, Morphometric analysis of zippered NE surface in control and K22-treated cells expressing HA-NSP6. Single values are plotted, Medians are indicated, n = 20 cells, two-tailed unpaired t-test. Scale bars, a-c, 10 μm; d, 7.5 μm; e, 3.8 μm; f, 750 nm, inset 200 nm; g-i, 1 μm, insets 200 nm.
Extended Data Fig. 5. NSPAΔSGF is more prone to homodimerization and/or oligomerization than the reference NSP6.
a, Fluoromicrographs of stably-expressing FLAG-NSP6 or FLAG-NSP6AΔSGF cells induced with doxycycline at the indicated times. b, Levels of HA-NSP6 and HA-NSP6AΔSGF clones induced overnight with doxycycline analyzed by Western blot with anti-HA antibody. GAPDH was used as loading control. c, Doxycycline-induced HeLa clones expressing HA-NSP6 or HA-NSP6AΔSGF, or parental (CTRL) cells, were radiolabelled for 1 h with 35S-methionine/cysteine and chased for the indicated times. Samples were immunoprecipitated and analyzed by SDS-PAGE gel autoradiography (top panels) and by Western blot (bottom panels). The estimated half-life for HA-NSP6 and HA-NSP6ΔSGF was 5 h. d, Western blot of supernatant (S) and pellet (P) of lysates (at increasing Triton-X100/NP-40 concentrations) of cells expressing NSP6-FLAG, FLAG-NSP6, or FLAG-NSP6ΔSGF (see Methods). Numbers indicate the percentage of protein in the supernatant. e, Cell lysates (input) of cells expressing GFP-NSP6 with HA-NSP6, or GFP-NSP6ΔSGF with HA-NSP6ΔSGF, were immunoprecipitated (IP) with anti-HA antibody and analyzed by Western blot with anti-HA and anti-GFP antibodies. The graph shows co-IP efficiency of NSP6ΔSGF relative to NSP6, which was set as 1 (see Methods). Mean ± SEM, n= 3 samples examined over three independent experiments. Two-tailed unpaired t-test with Welch’s correction. f, Fluorescence Loss in Photobleaching (FLIP) analysis of cells expressing GFP-NSP6 or GFP-NSP6AΔSGF. Left panels, before bleaching. Right panels, after bleaching. Dashed lines indicate the areas where iterative bleaching was applied. Graph: quantitative analysis of FLIP (see Methods). Values are expressed as a percentage of time 0, Means ± SD, three independent experiments, n = 10–12 cells per experiment. The calculated FLIP half-life for GFP-NSP6 is 70.5 sec ± 12.6 and for GFP-NSP6ΔSGF 103.8 sec ± 27.6. g, FRAP analysis of GFP-NSP6ΔSGF-expressing cells treated with DMSO or K22 for 16 h after bleaching of the individual NSP6ΔSGF-compartments (boxed). The small panels are representative frames (from a total of 100) at different times (in seconds) after the bleach. h, Quantitative FRAP analysis of the experiment in (g). Fluorescence intensity is expressed as a percentage of the value measured at time 0 (normalized to 100%). Means ± SD, three independent experiments, n=45 structures. i, Doxycycline-induced clone expressing FLAG-NSP6ΔSGF treated with DMSO or K22 for 24 h. Number of NSP6 structures (middle panel) and cells with elongated NSP6 structures (right panel) induced by K22. The number indicates the percentage (Mean ± SD) of cells exhibiting the elongated structures. Single values are plotted, Means ± SEM are indicated, N=3, n=90, two-tailed unpaired t-test with Welch’s correction. j-l. Immuno-CLEM of cells expressing HA-NSP6ΔSGF. j, Fluoromicrograph (anti-HA immunostaining) of the NSP6-compartment. k, Magnification of the box in (j) (inset) and IEM, where arrows 1-4 indicate overlap of the fluorescent and immuno-gold signals in the zippered NSP6-positive-structures. l, magnification of the structure indicated by arrow 1. m, Fluoromicrographs of cells expressing FLAG-NSP6/NSP7-V5 or FLAG-NSP6ΔSGF/NSP7-V5 immunostained with anti-FLAG (green), anti-V5 (white insets) and anti-GM130 antibodies (red insets). Bottom panels, merge of FLAG-NSP6 and GM130. n, Western blot of cell lysates from non-transfected (NT) and HA-NSP6/NSP7-V5 or HA-NSP6ΔSGF/NSP7-V5 expressing HeLa cells. Western blot images are representative of three independent experiments. Scale bars, a, f, g,i, m, 10 μm; j, 3.7 μm; k, 480 nm; l, 250 nm.
Extended Data Fig. 6. NSP6 organizes the DMVs induced by NSP3-NSP4.
a, Fluoromicrographs of HeLa cells expressing YFP-Cb5 with HA-NSP3 (anti-HA immunostaining) or mCherry-NSP4. Insets, merge with YFP-Cb5. b, Fluoromicrographs of HeLa cells expressing HA-NSP3 and mCherry-NSP4. Insets, enlargement of boxed area. Arrowheads, NSP3/NSP4-positive structures. Dashed lines delineate cell boundaries. c, Western blot (WB) of total lysates from HeLa cells expressing HA-NSP3, mCherry-NSP4, FLAG-NSP6, or GFP as indicated. Actin was used as loading control. d, IEM and e, routine EM of HeLa cells co-transfected with HA-NSP3 and mCherry-NSP4. Anti-HA labelling in (d) shows gold particles decorating DMVs, indicated by asterisks. Black arrows, ER. Inset, magnification of boxed area. White arrows in d and e show double membranes. The average DMV size is 92 ± 30 nm. f, Western blot of total lysates from HeLa cells expressing HA-NSP3, mCherry-NSP4 or FLAG-NSP6 as indicated. Actin was used as loading control. g, Individual fluoromicrographs of a Calu-3 cell co-transfected with FLAG-NSP6, HA-NSP3, and mCherry-NSP4. h, Length of DMV-ER tubular or zippered connections in NSP3/NSP4 or in NSP3/NSP4/NSP6 expressing cells, respectively. Single values are plotted. Medians are shown (n ≥ 14 connections), two-tailed unpaired t-test. i, Tomographic slice of a HeLa cell expressing HA-NSP3/mCherry-NSP4 or j, HA-NSP3/mCherry-NSP4/FLAG-NSP6, showing DMV clusters with regular round DMVs (white arrows) and large and elongated DMVs (black arrows).k, Frequency histograms of DMV diameter measured from tomograms of cells expressing NSP3/NSP4 (average diameter 80.87 nm) or NSP3/NSP4/NSP6 (average diameter 67.50 nm). Non-parametric Kolmogorov-Smirnov (KS) test. n≥135 vesicles. l, Tomographic slice of HeLa cells transfected with HA-NSP3/mCherry-NSP4 or m, HA-NSP3/mCherry-NSP4/FLAG-NSP6, with arrows indicating the edges of the DMV clusters. n, DMV densities were calculated in tomograms as the number of vesicles per μm2 in an area occupied by a DMV cluster. n = 8 clusters; Single values are plotted, Medians are shown, two-tailed unpaired t-test. Scale bars, a, b, g, 10 μm; i, j, l, m, 180 nm.
Extended Data Fig. 7. K22 impairs the ability of NSP6 to organize the NSP3/NSP4 puncta and has anti-SARS-CoV-2 activity.
a, HeLa cells transfected with HA-NSP3 and mCherry-NSP4 for 5 h were further transfected or not with FLAG-NSP6 and treated with DMSO or K22 (40 μM, 16 h) followed by immunostaining as indicated. b, Quantification of the number of NSP4 puncta/cell in (a). N=3, n=60. Single values are plotted. The median value is shown. One-way ANOVA test with Tukey’s post-hoc. ns, not significant. c, d, CLEM analysis of K22-treated cells. c, Fluoromicrograph of HeLa cell expressing HA-NSP3, mCherry-NSP4 and Myc-NSP6. Inset corresponds to the boxed area and shows NSP3/NSP4 positive structures (arrows) close to the NSP6 compartment (arrowhead). d, Overlap of fluorescent image (inset in c) with EM image. The NSP6-compartment corresponds to a circular zippered ER structure (arrowhead) close to but not connected with the NSP3/NSP4 puncta that correspond to DMVs (arrows). The empty arrow indicates a tubular connection of a DMV to the regular ER (magnified in the inset). e, Ultrastructure of DMV clusters in K22-treated cells expressing HA-NSP3, mCherry-NSP4 and Myc-NSP6. Serial sections show a DMV cluster with irregular elongated DMVs (black arrows). The empty arrow indicates a tubular connection of a DMV with regular ER. f, Morphometric analysis of serial sections from untreated (NT) and K22-treated cells to quantify the number of DMVs per cluster, DMV shape factor, and the number of tubular or zippered connections per DMV cluster. Single values are plotted, Medians are shown, n = at least 8 clusters or 70 DMVs, two-tailed unpaired t-test. g, h, Antiviral activity of K22. Effects of K22 on cell death measured by LDH (g) or on viral replication (h) in SARS-CoV-2 infected Calu-3 cells. Mean ± SEM, N=3, one-way ANOVA. i, Calu-3 cells infected with SARS-CoV-2 without (left panels) or with (right panel) K22 treatment. Cells were immunostained for dsRNA and NSP6. Nuclei were stained with DAPI. An enlargement of the boxed area shows NSP6 labelling (arrowheads) in the proximity of replication areas labelled by dsRNA. Graph, NSP6 structures within a distance of 250 nm from dsRNA spots, and dsRNA spots within a distance of 250 nm from NSP6 structures were counted and expressed as a percentage of total. Mean ± SEM, 15 cells analyzed, n=729 NSP6 structures, n=901 dsRNA spots. Scale bar, a, 10 μm; c, 4.4μm; d, 370 nm; e, 320nm; i, 20 μm.
Extended Data Fig. 8. NSP6AΔSGF is more proficient in zippering the ER.
a, Tomographic slice of a HeLa cell expressing HA-NSP3/mCherry-NSP4/FLAG-NSP6 or b, expressing HA-NSP3/mCherry-NSP4/FLAG-NSP6ΔSGF. Arrows indicate zippered ER connectors directed towards DMV clusters. c, Quantification of the number of ER zippered connections per DMV cluster and d, number of DMVs per cluster. Single values are plotted, Medians are shown. NSP3/NSP4/NSP6, N=7 cells, n=8 DMV clusters; NSP3/NSP4/NSP6ΔSGF, N=8 cells, n=9 DMV clusters. Two-tailed unpaired t-test. e, Frequency histograms of DMV diameter measured from tomograms of cells expressing NSP3/NSP4/NSP6 (average diameter 67.50 nm) or NSP3/NSP4/NSP6ΔSGF (average diameter 68.51 nm). The histograms were analyzed using non-parametric Kolmogorov-Smirnov (KS) test. n ≥ 123 vesicles. f, Serial tomographic slices from Calu-3 cells infected with 10 MOIs of an early lineage SARS-CoV-2 for 24 h. White arrows indicate a zippered connector that links ER (black arrows) to two DMVs (1 and 2). g, h, Serial tomographic slices from Calu-3 cells infected with the γ variant of SARS-CoV-2. White arrows indicate zippered connectors that depart from the ER (black arrows) and then branch (red arrow) towards two DMVs (1 and 2) in (g) and link the ER to a DMV (1) in h. White arrowheads indicate connectors that link DMV2 to DMV3 in (g) and DMV1 to DMV3 in (h). Scale bars, a, b 140 nm; f-h 200 nm.
Extended Data Fig. 9. Rab18 is recruited to ROLS by NSP6.
a, Fluoromicrographs of HeLa cells expressing FLAG-NSP6-C80 (i.e. the last 80 amino acids of NSP6. Anti-FLAG antibody and staining for LDs using Bodipy-C12. Insets, enlargement of boxed areas. Arrowheads, colocalizing structures. b, FLAG-NSP6-C80 associates with roundish structures that stain with Bodipy-488 and with ADRP (perilipin 2). c, NSP6-C80 mutated in residues that abrogate the amphiphilic properties of the AH fail to associate with LDs. Cells were immunostained with anti-FLAG Ab (green) and with Bodipy-DA-C12 (red). d, Calu-3 cells infected with SARS-CoV-2 stained for LDs (Oil Red O staining)22 and immunostained with anti-dsRNA and anti-NSP6 antibodies. Blue, nuclear DAPI staining. Graph, quantification of the association of NSP6 or dsRNA positive structures with LDs, expressed as a percentage of the total number of NSP6 or dsRNA structures per cell. Mean ± SEM, N=12, n=1,377 and n=861 for dsRNA and NSP6, respectively. e, Calu-3 cells infected or not with SARS-CoV-2, with or without the DGAT-1 inhibitor A922500, were analyzed for LDs using Oil Red O staining (measurement of the fluorescent area of LDs- left graph) or for viral titres22 (right graph). Two-tailed unpaired t-test with Welch’s correction (left graph); one-way ANOVA followed by Tukey’s post-hoc test (right graph). f, Graph obtained applying the function Shuffle (see Methods) for the “NSP6 objects” and “LD objects” in the NSP3/NSP4/NSP6 transfected cell in Fig. 4a, showing that the measured distances (blue line) are significantly different from mean random distances (red line) flanked by 95% confidence intervals (green lines). g, Fluoromicrographs of Calu-3 cells expressing mCherry-NSP4, HA-NSP3, and FLAG-NSP6 (left panel), or mCherry-NSP4 and HA-NSP3 (middle panel), or FLAG-NSP6 (right panel). Cells were immunostained with anti-FLAG Ab (blue). mCherry fluorescence was used as a read-out for mCherry-NSP4/HA-NSP3 structures. LDs were detected using Bodipy-488 (green). Inset, enlargement of boxed area. Arrowheads indicate LDs close to the NSP6 compartment and in proximity to the RO. h, Cells expressing GFP-Rab18 alone or with FLAG-NSP6 (anti-FLAG immunostaining). Insets, arrowheads show co-localization of Rab18 with the NSP6-compartment. i, Individual fluoromicrographs and merge of cells co-expressing GFP-DFCP1, mCherry-NSP4 and HA-NSP3 (anti-HA immunostaining). j, In vitro pull-down assays using total cell lysates (input) from HeLa cells expressing HA-NSP6 incubated with GST-DFCP1 or GST alone. Upper panel, Ponceau Red staining; bottom panel, Western blot with anti-HA antibody. Images are representative of three independent experiments. Scale bars, a-c, g-i, 10 μm; d, 20 μm.
Extended Data Fig. 10. The C-terminal domain of NSP6 is involved in the recruitment of DFCP1 in a PI3P-independent manner.
a, Fluoromicrographs of cells co-expressing GFP-DFCP1 and FLAG-NSP6 1-157. b, Fluorescent images of HeLa cells transfected with the indicated DFCP1 mutants alone or in combination with NSP6 (as indicated). A schematic representation of DFCP1 mutants is reported on top. Arrowheads, DFCP1 signal in the NSP6-compartment. Insets, enlarged merge of boxed areas. Numbers indicate the percentage of colocalization between DFCP1 mutants and NSP6. Mean ± SD (see Methods). c, Fluorescent micrographs of cells expressing mCherry-DFCP1 and FLAG-NSP6 treated with SAR405 or with wortmannin. Anti-FLAG immunostaining. d, Fluoromicrograph showing LC3 staining in one transfected and one non-transfected cell from FLAG-NSP6 expressing HeLa cells. Inset, anti-FLAG immunostaining. Graph, quantification of LC3 puncta in non-transfected (CTRL) and NSP6-transfected cells (number of LC3 spots/cell). Means ± SEM. n=74 cells examined over three independent experiments. Two-tailed unpaired t-test with Welch’s correction. ns, not significant. e, HeLa cells expressing HA-NSP3 and GFP-NSP4, or HA-NSP3, GFP-NSP4 and FLAG-NSP6, were loaded with Bodipy-DA-C12 and washed out for 6 h (see Methods). Dotted yellow lines, LDs; dotted white lines, NSP4 puncta. Graph, quantification of the percentage of NSP4 puncta positive for Bodipy-DA-C12. Single values are plotted, Means ± SEM are indicated, N=3, n=90, two-tailed Mann-Whitney test. f, Western blot of protein extracts from mock-treated (CTRL) and DFCP1-KD cells. Actin was used as loading control. The graph shows the level of DFCP1 protein expressed as percentage of control (set at 100). Mean ± SEM. N =3, Two-tailed unpaired t-test with Welch’s correction. g, Western blot of protein lysates from untreated (CTRL), scramble- and DFCP1 siRNA-treated (DFCP1-KD) SARS-CoV-2-infected Calu-3 cells detected with an anti-DFCP1 antibody. GAPDH was used as loading control. The graph shows the level of DFCP1 KD expressed as percentage of control (set at 100). Mean ± SEM. N =3, two-tailed unpaired t-test with Welch’s correction. h, Quantification of viral titres in SARS-CoV-2-infected Calu-3 cells untreated (-), transfected with scramble siRNA (CTRL) or DFCP1 siRNA (DFCP1-KD). Mean ± SEM, N = 7, two-tailed unpaired t-test with Welch’s correction. Scale bar a-e, 10 μm. Western blot images are representative of three independent experiments.
Extended Data Fig. 11. Working model for the role of NSP6 in RO biogenesis.
NSP6-induced zippered connectors are cues and organizers for NSP3/NSP4-induced DMV formation acting as selective communication tracks with the ER (largely excluding luminal ER proteins). In addition, the connectors might also act as fast-tracks to refurbish the actively growing subpopulation of DMVs with lipids derived from LDs.
Supplementary Material
Acknowledgments
We thank Pedro Paulo Manso Rede of the confocal imaging facility (Rede de Plataformas Tecnológicas FIOCRUZ), Carmen Beatriz Wagner Giacoia Gripp of the BSL3 facility, and Eelco Van Anken, Carolyn Machamer, Raffaele De Francesco, Matteo Chiara, Andrea Ballabio, Graciana Diez Roux, Alberto Luini, Roberto Sitia, Carmine Settembre, Davide Cacchiarelli, Antonio Grimaldi, and Paolo Grumati for helpful discussion, Antonella Iuliano for assistance in the statistical analysis, M.A.D.M. acknowledges the support of Telethon (grant TGM16CBDM13), the Italian Association for Cancer Research (grant IG2013_14761), and European Research Council Advanced Investigator grant 670881 (SYSMET), the University of Naples Federico II (grant STAR Plus 2020 linea 1), the Italian Ministry of University and Research (PRIN, 2020PKLEPN). R.S.P. acknowledges the support of Telethon (grant TGM16CBDM09). R.V. acknowledges the University of Naples Federico II (grant STAR2017 Linea1) and the Italian Association for Cancer Research (grant MFAG 2020, code 25174). P.T.B. and T.M.L.S. acknowledge the support of Inova program Fiocruz, Fundação de Amparo à Pesquisa do Estado do Rio de Janeiro (FAPERJ), Conselho Nacional de Desenvolvimento Científico e Tecnológico (CNPq) and Coordenação de Aperfeiçoamento de Pessoal de Nível Superior (CAPES).
Footnotes
Author contributions
Author contributions: M.A.D.M. conceived the work. R.V. coordinated the experimental plan, R.V., S.R., A.M.G. and L.G. planned and analyzed most of the experiments. E.P. and R.P. performed EM, CLEM and tomography analyses. M.S. and G.D.T. developed plasmid constructs and provided technical support. A.M.G. and G.D.T. performed the protein studies. C.W. provided background data analysis. F.P. performed the VoC evolution analysis. V.C.S., S.S.G.D., J.C.S., T.M.L.S., P.T.B., G.F., M.V., and S.B.: performed the SARS-CoV-2 studies. M.A.D.M. conceptualized the work and strategy and wrote the manuscript.
Competing Interests The authors declare no competing interests.
Reporting summary
Further information on research design is available in the Nature Research Reporting Summary linked to this paper.
Data availability
Full scans for all western blots and autoradiographs are provided in Supplementary Fig. 1. The nucleotide sequence of synthetic IBV NSP6 and NSP6/NSP7 used in this study are in Supplementary Table 1. The oligonucleotides, siRNAs and primers used in this study are in Supplementary Table 2. Source data for each figure are provided in the corresponding "Source Data" files. Raw data supporting the findings of this study are deposited in Zenodo and will be publicly available at 10.5281/zenodo.5929088 (upon publication). Raw EM data, including tilt series and reconstructed 3D tomograms were deposited in EMDB and EMPIAR public databases with EMD-14179 and EMPIAR-10935 accession codes respectively.
References
- (1).Hartenian E, et al. The molecular virology of coronaviruses. J Biol Chem. 2020;295:12910–12934. doi: 10.1074/jbc.REV120.013930. [DOI] [PMC free article] [PubMed] [Google Scholar]
- (2).Cortese M, et al. Integrative Imaging Reveals SARS-CoV-2-Induced Reshaping of Subcellular Morphologies. Cell Host Microbe. 2020;28:853–866.:e5. doi: 10.1016/j.chom.2020.11.003. [DOI] [PMC free article] [PubMed] [Google Scholar]
- (3).Angelini MM, Akhlaghpour M, Neuman BW, Buchmeier MJ. Severe acute respiratory syndrome coronavirus nonstructural proteins 3, 4, and 6 induce double-membrane vesicles. mBio. 2013;4:e00524–13. doi: 10.1128/mBio.00524-13. [DOI] [PMC free article] [PubMed] [Google Scholar]
- (4).Oudshoorn D, et al. Expression and Cleavage of Middle East Respiratory Syndrome Coronavirus nsp3-4 Polyprotein Induce the Formation of Double-Membrane Vesicles That Mimic Those Associated with Coronaviral RNA Replication. mBio. 2017;8:e01658–17. doi: 10.1128/mBio.01658-17. [DOI] [PMC free article] [PubMed] [Google Scholar]
- (5).Wolff G, Melia CE, Snijder EJ, Barcena M. Double-Membrane Vesicles as Platforms for Viral Replication. Trends Microbiol. 2020;28:1022–1033. doi: 10.1016/j.tim.2020.05.009. [DOI] [PMC free article] [PubMed] [Google Scholar]
- (6).Snijder EJ, et al. A unifying structural and functional model of the coronavirus replication organelle: Tracking down RNA synthesis. PLoS Biol. 2020;18:e3000715. doi: 10.1371/journal.pbio.3000715. [DOI] [PMC free article] [PubMed] [Google Scholar]
- (7).Klein S, et al. SARS-CoV-2 structure and replication characterized by in situ cryo-electron tomography. Nat Commun. 2020;11:5885. doi: 10.1038/s41467-020-19619-7. [DOI] [PMC free article] [PubMed] [Google Scholar]
- (8).Ogando NS, et al. SARS-coronavirus-2 replication in Vero E6 cells: replication kinetics, rapid adaptation and cytopathology. J Gen Virol. 2020;101:925–940. doi: 10.1099/jgv.0.001453. [DOI] [PMC free article] [PubMed] [Google Scholar]
- (9).Peacock TP, Penrice-Randal R, Hiscox JA, Barclay WS. SARS-CoV-2 one year on: evidence for ongoing viral adaptation. J Gen Virol. 2021;102:001584. doi: 10.1099/jgv.0.001584. [DOI] [PMC free article] [PubMed] [Google Scholar]
- (10).Romero PD, et al. The Emergence of SARS-CoV-2 Variant Lambda (C.37) in South America. MicrobiolSpectr. 2021;9:e0078921. doi: 10.1128/Spectrum.00789-21. [DOI] [PMC free article] [PubMed] [Google Scholar]
- (11).Cottam EM, et al. Coronavirus nsp6 proteins generate autophagosomes from the endoplasmic reticulum via an omegasome intermediate. Autophagy. 2011;7:1335–1347. doi: 10.4161/auto.7.11.16642. [DOI] [PMC free article] [PubMed] [Google Scholar]
- (12).Venditti R, et al. Molecular determinants of ER-Golgi contacts identified through a new FRET-FLIM system. J Cell Biol. 2019;218:1055–1065. doi: 10.1083/jcb.201812020. [DOI] [PMC free article] [PubMed] [Google Scholar]
- (13).Dobson L, Remenyi I, Tusnady GE. CCTOP: a Consensus Constrained TOPology prediction web server. Nucleic Acids Res. 2015;43(W1):W408–W412. doi: 10.1093/nar/gkv451. [DOI] [PMC free article] [PubMed] [Google Scholar]
- (14).Baliji S, Cammer SA, Sobral B, Baker SC. Detection of nonstructural protein 6 in murine coronavirus-infected cells and analysis of the transmembrane topology by using bioinformatics and molecular approaches. J Virol. 2009;83:6957–6962. doi: 10.1128/JVI.00254-09. [DOI] [PMC free article] [PubMed] [Google Scholar]
- (15).Oostra M, Hagemeijer MC, van Gent M, Bekker CP, te Lintelo EG, Rottier PJ, de Haan CA. Topology and membrane anchoring of the coronavirus replication complex: not all hydrophobic domains of nsp3 and nsp6 are membrane spanning. J Virol. 2008;82:12392–12405. doi: 10.1128/JVI.01219-08. [DOI] [PMC free article] [PubMed] [Google Scholar]
- (16).Gautier R, Douguet D, Antonny B, Drin G. HELIQUEST: a web server to screen sequences with specific alpha-helical properties. Bioinformatics. 2008;24:2101–2102. doi: 10.1093/bioinformatics/btn392. [DOI] [PubMed] [Google Scholar]
- (17).Lundin A, et al. Targeting membrane-bound viral RNA synthesis reveals potent inhibition of diverse coronaviruses including the middle East respiratory syndrome virus. PLoS Pathog. 2014;10:e1004166. doi: 10.1371/journal.ppat.1004166. [DOI] [PMC free article] [PubMed] [Google Scholar]
- (18).Hadfield J, et al. Nextstrain: real-time tracking of pathogen evolution. Bioinformatics. 2018;34:4121–4123. doi: 10.1093/bioinformatics/bty407. [DOI] [PMC free article] [PubMed] [Google Scholar]
- (19).Twu WI, et al. Contribution of autophagy machinery factors to HCV and SARS-CoV-2 replication organelle formation. Cell Rep. 2021;37:110049. doi: 10.1016/j.celrep.2021.110049. [DOI] [PMC free article] [PubMed] [Google Scholar]
- (20).Tabata K, et al. Convergent use of phosphatidic acid for hepatitis C virus and SARS-CoV-2 replication organelle formation. Nat Commun. 2021;12:7276. doi: 10.1038/s41467-021-27511-1. [DOI] [PMC free article] [PubMed] [Google Scholar]
- (21).Holwerda M, V'kovski P, Wider M, Thiel V, Dijkman R. Identification of an Antiviral Compound from the Pandemic Response Box that Efficiently Inhibits SARS-CoV-2 Infection In Vitro. Microorganisms. 2020;8:1872. doi: 10.3390/microorganisms8121872. [DOI] [PMC free article] [PubMed] [Google Scholar]
- (22).Lee JY, et al. Absolute quantitation of individual SARS-CoV-2 RNA molecules provides a new paradigm for infection dynamics and variant differences. eLife. 2022;11:e74153. doi: 10.7554/eLife.74153. [DOI] [PMC free article] [PubMed] [Google Scholar]
- (23).Thorne LG, et al. Evolution of enhanced innate immune evasion by SARS-CoV-2. Nature. 2022;602:487–495. doi: 10.1038/s41586-021-04352-y. [DOI] [PMC free article] [PubMed] [Google Scholar]
- (24).Dias SSG, et al. Lipid droplets fuel SARS-CoV-2 replication and production of inflammatory mediators. PLoS Pathog. 2020;16:e1009127. doi: 10.1371/journal.ppat.1009127. [DOI] [PMC free article] [PubMed] [Google Scholar]
- (25).Li D, et al. The ER-Localized Protein DFCP1 Modulates ER-Lipid Droplet Contact Formation. Cell Rep. 2019;27:343–358.:e5. doi: 10.1016/j.celrep.2019.03.025. [DOI] [PubMed] [Google Scholar]
- (26).Gao G, Sheng Y, Yang H, Chua BT, Xu L. DFCP1 associates with lipid droplets. Cell Biol Int. 2019 doi: 10.1002/cbin.11199. [DOI] [PubMed] [Google Scholar]
- (27).Herker E, Vieyres G, Beller M, Krahmer N, Bohnert M. Lipid Droplet Contact Sites in Health and Disease. Trends Cell Biol. 2021;31:345–358. doi: 10.1016/j.tcb.2021.01.004. [DOI] [PubMed] [Google Scholar]
- (28).Ridley S, et al. FENS-1 and DFCP1 are FYVE domain-containing proteins with distinct functions in the endosomal and Golgi compartments. J CellSci. 2001;114:3991–4000. doi: 10.1242/jcs.114.22.3991. [DOI] [PubMed] [Google Scholar]
- (29).Axe EL, et al. Autophagosome formation from membrane compartments enriched in phosphatidylinositol 3-phosphate and dynamically connected to the endoplasmic reticulum. J Cell Biol. 2008;182:685–701. doi: 10.1083/jcb.200803137. [DOI] [PMC free article] [PubMed] [Google Scholar]
- (30).Rambold AS, Cohen S, Lippincott-Schwartz J. Fatty acid trafficking in starved cells: regulation by lipid droplet lipolysis, autophagy, and mitochondrial fusion dynamics. Dev Cell. 2015;32:678–692. doi: 10.1016/j.devcel.2015.01.029. [DOI] [PMC free article] [PubMed] [Google Scholar]
- (31).Marra P, et al. The GM130 and GRASP65 Golgi proteins cycle through and define a subdomain of the intermediate compartment. Nat Cell Biol. 2001;3:1101–1113. doi: 10.1038/ncb1201-1101. [DOI] [PubMed] [Google Scholar]
- (32).Jansen M, et al. Role of ORPs in sterol transport from plasma membrane to ER and lipid droplets in mammalian cells. Traffic. 2011;12:218–31. doi: 10.1111/j.1600-0854.2010.01142.x. [DOI] [PubMed] [Google Scholar]
- (33).Kim DK, et al. A Comprehensive, Flexible Collection of SARS-CoV-2 Coding Regions. G3 (Bethesda) 2020;10:3399–3402. doi: 10.1534/g3.120.401554. [DOI] [PMC free article] [PubMed] [Google Scholar]
- (34).Venditti R, et al. The activity of Sac1 across ER-TGN contact sites requires the four-phosphate-adaptor-protein-1. J Cell Biol. 2019;218:783–797. doi: 10.1083/jcb.201812021. [DOI] [PMC free article] [PubMed] [Google Scholar]
- (35).Bolte S, Cordelieres FP. A guided tour into subcellular colocalization analysis in light microscopy. J Microsc. 2006;224:213–232. doi: 10.1111/j.1365-2818.2006.01706.x. [DOI] [PubMed] [Google Scholar]
- (36).Gilles JF, Dos Santos M, Boudier T, Bolte S, Heck N. DiAna, an ImageJ tool for object-based 3D co-localization and distance analysis. Methods. 2017;115:55–64. doi: 10.1016/j.ymeth.2016.11.016. [DOI] [PubMed] [Google Scholar]
- (37).Polishchuk EV, Polishchuk RS. Pre-embedding labeling for subcellular detection of molecules with electron microscopy. Tissue Cell. 2019;57:103–110. doi: 10.1016/j.tice.2018.11.002. [DOI] [PubMed] [Google Scholar]
Associated Data
This section collects any data citations, data availability statements, or supplementary materials included in this article.
Supplementary Materials
Data Availability Statement
Full scans for all western blots and autoradiographs are provided in Supplementary Fig. 1. The nucleotide sequence of synthetic IBV NSP6 and NSP6/NSP7 used in this study are in Supplementary Table 1. The oligonucleotides, siRNAs and primers used in this study are in Supplementary Table 2. Source data for each figure are provided in the corresponding "Source Data" files. Raw data supporting the findings of this study are deposited in Zenodo and will be publicly available at 10.5281/zenodo.5929088 (upon publication). Raw EM data, including tilt series and reconstructed 3D tomograms were deposited in EMDB and EMPIAR public databases with EMD-14179 and EMPIAR-10935 accession codes respectively.


