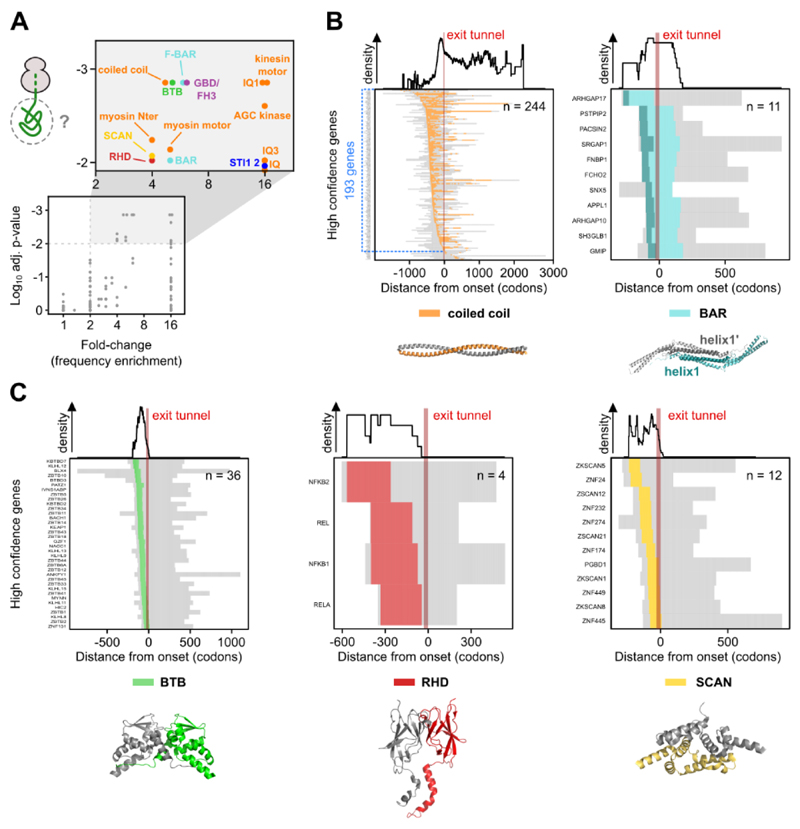
Fig. 4. Co-co assembly is coordinated with exposure of five major dimerization domain classes.
A) Analysis of protein domains on nascent chain segments exposed at assembly onset. The frequency of each domain in the high confidence class is compared to their general frequency in the proteome (33). We used a Monte-Carlo simulation of the null hypothesis to calculate the p-value (33) and the Benjamini-Yekutieli procedure to correct for multiple testing. The adjusted p-value is plotted against the respective fold-change (frequency enrichment). Domains passing a significance (p-adj. ≥ 0.01) and fold-change (≥ 2) threshold are shown in the magnified rectangle and further analyzed.
B) Heatmaps of partially exposed domains: coiled coil (left) and BAR (right). In the heatmaps, nascent chain segments left from the ribosome exit tunnel (approximated to 30 codons, shown by a red bar) are exposed when assembly starts. The subset of genes exposing a coiled coil segment on the nascent chain at the onset of assembly is highlighted in blue (n = 193). Residues forming helix1 of BAR domains are colored dark green in the heatmap and in the exemplary structure. Corresponding domain density profiles shown on top. Representative structures are PDB: 1D7M, 3Q0K.
C) Heatmaps of completely exposed domains: BTB (left), RHD (middle) and SCAN (right). Corresponding domain density profiles shown on top. Representative structures are PDB: 1BUO, 1K3Z, 3LHR.

