Abstract
Transcriptional cofactors (COFs) communicate regulatory cues from enhancers to promoters and are central effectors of transcription activation and gene expression1. Although some COFs have been shown to prefer certain promoter types2–5 over others (e.g. refs 6,7), the extent to which different COFs display intrinsic specificities for distinct promoters is unclear. Here, we use a high-throughput promoter-activity assay in Drosophila melanogaster S2 cells to screen 23 COFs for their ability to activate 72,000 candidate core promoters (CPs). We observe differential activation of CPs, indicating distinct regulatory preferences or compatibilities8,9 between COFs and specific types of CPs. These functionally distinct CP types are differentially enriched for known sequence elements2,4, such as the TATA-box, Downstream Promoter Element (DPE), or TCT motif and display distinct chromatin properties at endogenous loci. Importantly, the CP types differ in their relative abundance of H3K4me3 and H3K4me1 (see also refs 10–12), suggesting that these histone modifications might distinguish trans regulatory factors rather than promoter- versus enhancer-type cis elements. We confirm the existence of distinct COF-CP compatibilities in two additional Drosophila cell lines and in human cells, for which we find COFs that prefer TATA-box or CpG island promoters, respectively. Distinct compatibilities between COFs and promoters can explain how different enhancers specifically activate distinct sets of genes9, alternative promoters within the same genes, and distinct transcription start sites within the same promoters13. Thus, cofactor−promoter compatibilities may underlie distinct transcriptional programs in species as divergent as flies and human.
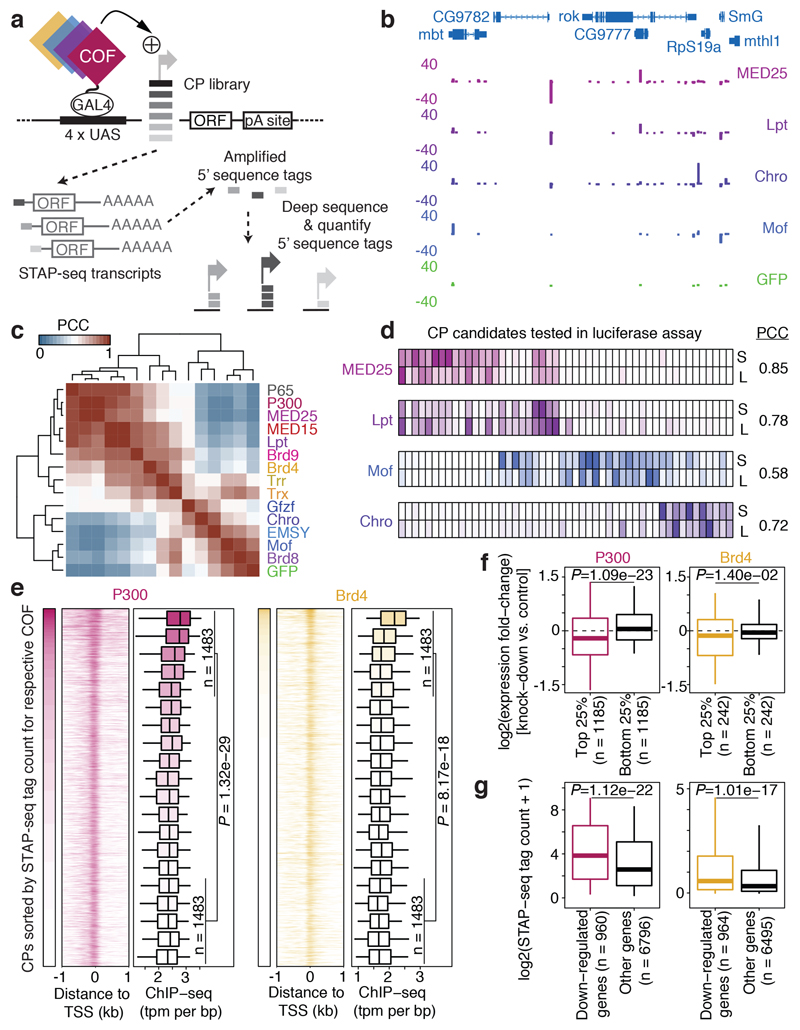
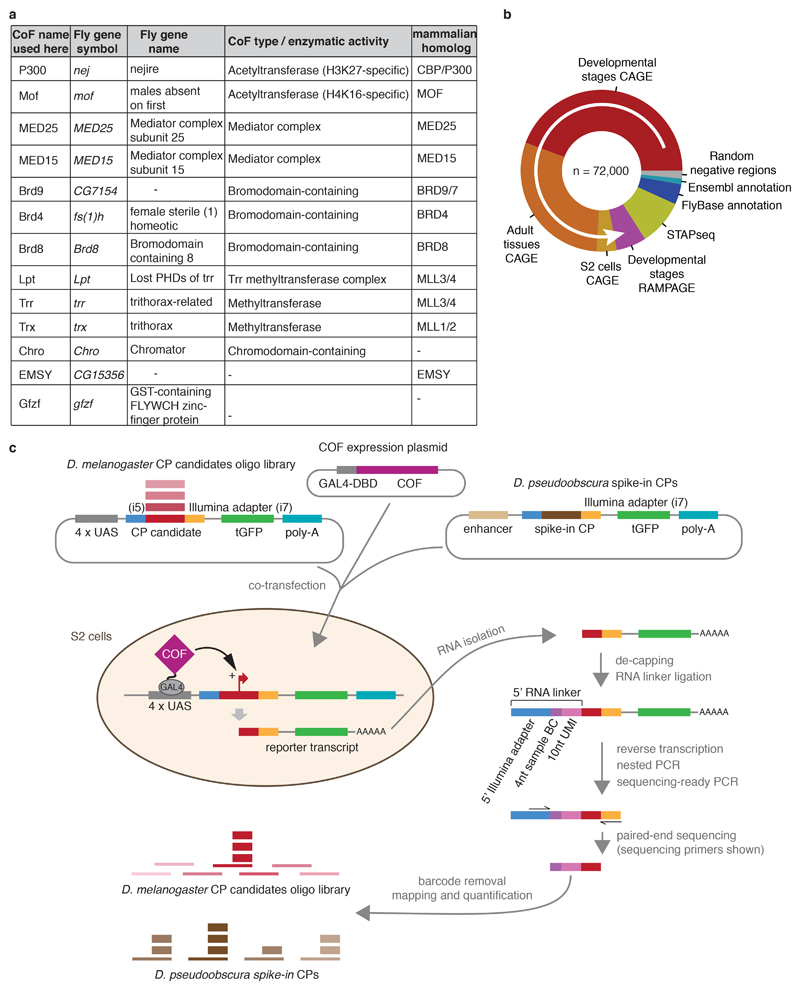
To systematically test intrinsic cofactor (COF) − core promoter (CP) preferences for many CPs in a standardized setup, we combined a plasmid-based high-throughput promoter-activity assay, Self-Transcribing Active Core Promoter-sequencing (STAP-seq)14, with the specific GAL4-DNA-binding-domain (GAL4-DBD)-mediated recruitment of individual COFs7,15,16 (Fig. 1a). Using this assay in Drosophila melanogaster (D. melanogaster) S2 cells, we initially tested whether 13 different individually tethered D. melanogaster COFs, representing different functional classes and enzymatic activities (two acetyltransferases P300/CBP and Mof, three H3K4-methyltransferase-complex components [Lpt, Trr and Trx], two Chromo/Chromo-shadow-domain- [Chro and Mof] and three Bromodomain- [Brd4, Brd8, Brd9] COFs, the mediator complex subunits MED15 and MED25, and two less well-characterized COFs [EMSY and Gfzf]; Extended Data Fig. 1a) could activate transcription from any of 72,000 CP candidates, 133 bp long DNA fragments around a comprehensive genome-wide set of TSSs and negative controls (Extended Data Fig. 1b). If a tethered COF activates a candidate CP, this generates reporter RNAs with a short 5’ sequence tag, derived from the 3’ end of the corresponding CP (Fig. 1a, Extended Data Fig. 1c). We capture these reporter transcripts with a 5’ RNA linker that includes a 10 nucleotide (nt) long unique molecular identifier (UMI), allowing us to count individual reporter RNA molecules and quantify productive transcription initiation events at single-base-pair resolution for all candidate CPs in the library (Extended Data Fig. 1c).
Figure 1 |. Differential activation of core promoter candidates by transcriptional cofactors.
a, Schematic overview of the COF-STAP-seq high-throughput promoter-activity assay. Cofactors (COFs) are recruited one-by-one via a GAL4-DNA-binding domain to a core-promoter (CP) candidate library; reporter-transcript tags are quantified by sequencing. b, Transcription from CPs activated by four COFs and GFP in a representative genomic locus (negative values: antisense transcription). c, Hierarchical clustering of COFs based on Pearson correlation coefficients (PCCs) of COF-STAP-seq tag counts across 30,936 CPs activated by at least one COF. d, Heatmap of STAP-seq (S) and luciferase (L) signals for activation of 50 CPs by four COFs (right: PCCs between STAP-seq and luciferase values; see Extended Data Figure 3d). e, COF binding in S2 cells to 5,933 CPs active in COF-STAP-seq and endogenously. Per COF, CPs are sorted by STAP-seq activation (left) and ChIP-seq coverage is shown in heatmaps and boxplots (-150 to +50bp window around the TSS; n=297 independent CPs per box; box shading: mean STAP-seq tag count) f, Expression fold change upon COF inhibition for genes associated with top and bottom 25% COF-STAP-seq CPs for the respective COF. g, COF-STAP-seq tag count for CPs of genes down-regulated upon COF inhibition and CPs of all other genes. (e-g) considering only CPs (or genes) active in COF-STAP-seq and endogenously in S2; data reanalysed from refs in Supplementary Table 1; n denotes number of independent CPs; boxes: median and interquartile range; whiskers: 5th and 95th percentiles; P values: one-sided Wilcoxon rank sum test.
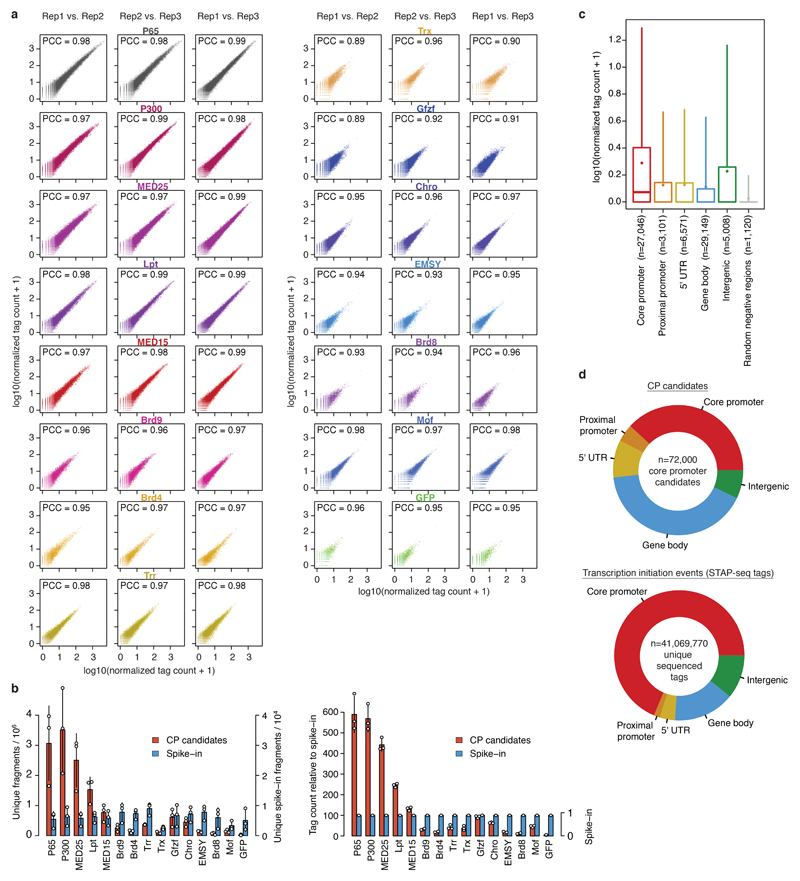
Three independent COF-STAP-seq screens for each of the 13 COFs and positive (P65) and negative (GFP) controls in S2 cells were highly similar (all pairwise Pearson’s correlation coefficients [PCCs] ≥0.89; Extended Data Fig. 2a) and showed more initiation events for P65 and the 13 COFs than for GFP, as expected (Extended Data Fig. 2b). Initiation mainly occurred at CPs corresponding to annotated gene starts, whereas random negative controls showed the least initiation (Extended Data Fig. 2c, d), corroborating previous findings that gene CPs are specialized sequences, able to strongly respond to activating enhancers14.
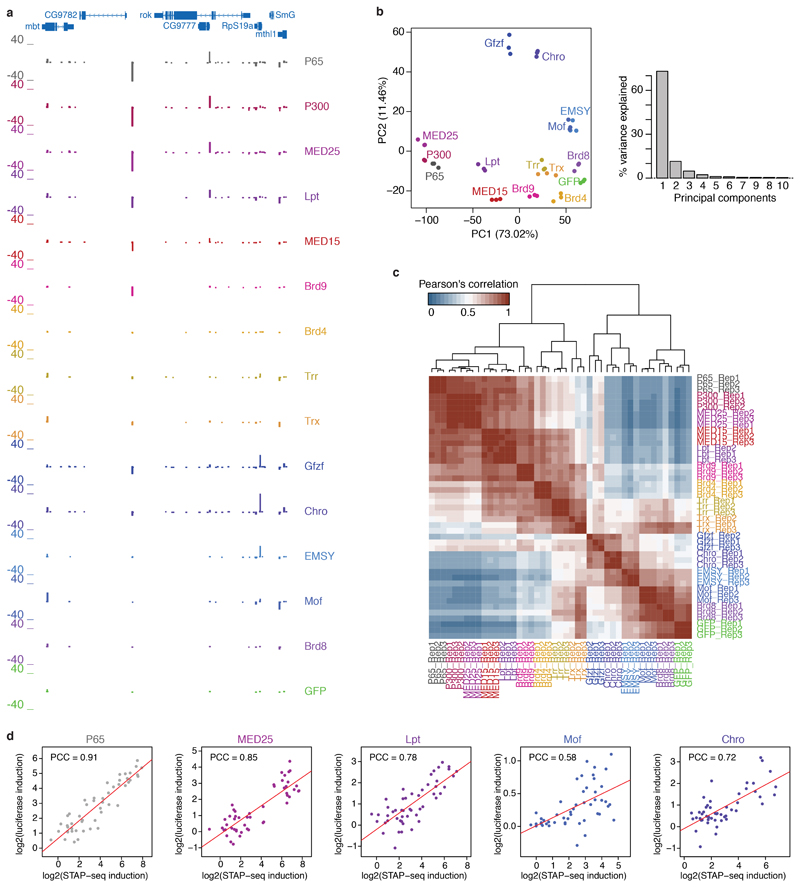
Importantly, each COF showed differential activation of CPs and activated a unique set of CPs. For example, within a representative genomic locus, MED25 and Lpt most strongly activated the CP of CG9782, Chro and Gfzf the CP of RpS19a, and Mof the CPs of mbt and SmG (Fig. 1b; see Extended Data Fig. 3a for all COFs). Indeed, the COFs’ activation profiles across all CPs are characteristically different, as revealed by hierarchical clustering (Fig. 1c; Extended Data Fig. 3b, c). We validated the differential CP activation by luciferase reporter assays with MED25, Lpt, Mof, and Chro for 50 CPs. The two assays agreed well (PCCs ≥ 0.72 except Mof with PCC=0.58; Extended Data Fig. 3d) and confirmed that COFs activate some CPs more strongly than others (Fig. 1d; MED25 for example preferentially activates the CPs on the left, Mof the ones in the middle, and Chro the ones on the right), which we refer to as distinct preferences, specificities, or compatibilities8,9 towards different CPs.
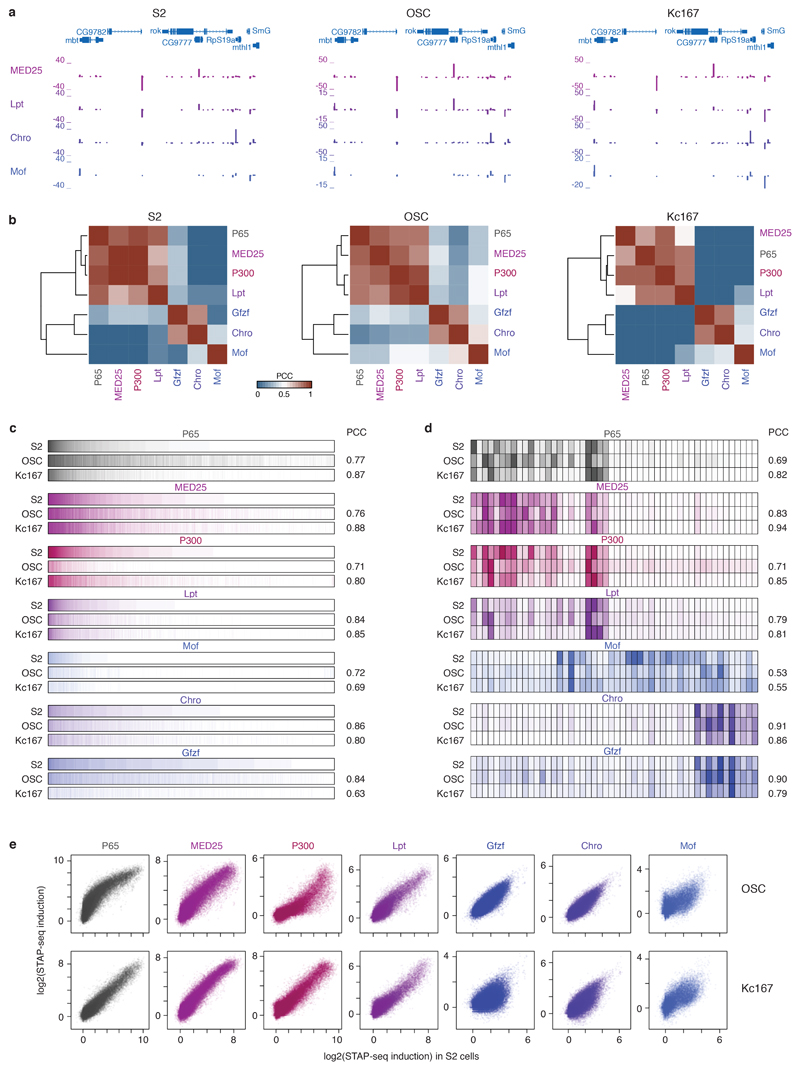
To test if the COF−CP compatibilities generalize beyond S2 cells, we performed three independent COF-STAP-seq screens for 6 COFs (MED25, P300, Lpt, Gfzf, Chro, Mof) in two additional D. melanogaster cell lines, one derived from embryos (Kc167) and one from adult ovaries (ovarian somatic cells, OSCs). For each of the 6 COFs, the screens were highly similar across all three cell lines (all PCCs≥0.69), validating the COFs’ distinct CP preferences and the observed COF-CP compatibilities (Extended Data Fig. 4). These results establish the observed COF−CP compatibilities as a cell-type independent, COF- and CP-sequence-inherent regulatory principle.
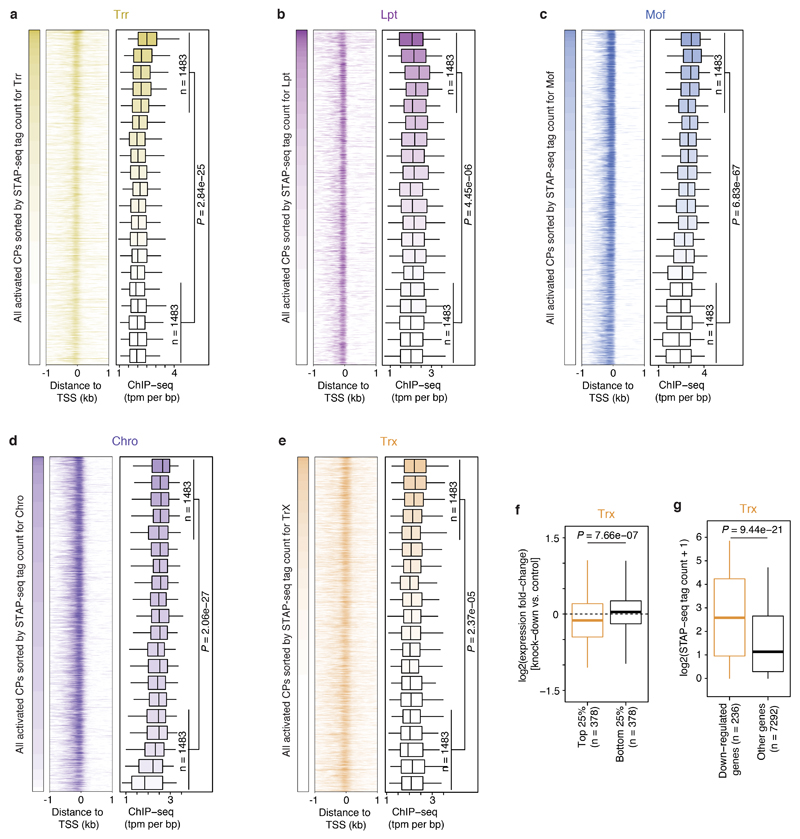
To test whether the COF−CP preferences reflect endogenous gene regulation, we first assessed the binding of each COF to genomic CPs of genes expressed in S2 cells. Published chromatin immunoprecipitation followed by sequencing (ChIP-seq) data for P300 (ref. 12), Brd4 (ref. 17), Trx18, Trr18, Lpt19, Mof20 from S2 cells, and Chro from D. melanogaster embryos21 (see Supplementary Table 1 for details) showed stronger COF binding at CPs that were strongly activated in STAP-seq by the respective COF (top 25%) and weaker binding at CPs that were more weakly activated (bottom 25%; Fig. 1e-g; Extended Data Fig. 5). Next, we compared the COF−CP preferences with the impact of COF inhibition or depletion on endogenous gene expression. Analyses of published gene expression data upon COF inhibition via small-molecules (P300; ref. 12) or RNA interference (RNAi; Brd4 [ref. 17] and Trx18) revealed that genes associated with the top 25% of CPs preferentially activated by P300, Brd4 or Trx displayed stronger down-regulation upon inhibition of the respective COF, compared to genes associated with the bottom 25% of CPs (Fig. 1f, Extended Data Fig. 5f; Wilcoxon test P-value ≤ 0.014). Conversely, the CPs of all genes that are down-regulated upon inhibition of P300, Brd4 or Trx, showed stronger activation by the respective COF in STAP-seq than the CPs of genes not affected by COF inhibition (Fig. 1g, Extended Data Fig. 5g; Wilcoxon test P-value ≤ 1e-17). Together, these analyses suggest that the distinct COF−CP preferences we observed are employed during endogenous gene regulation in vivo.
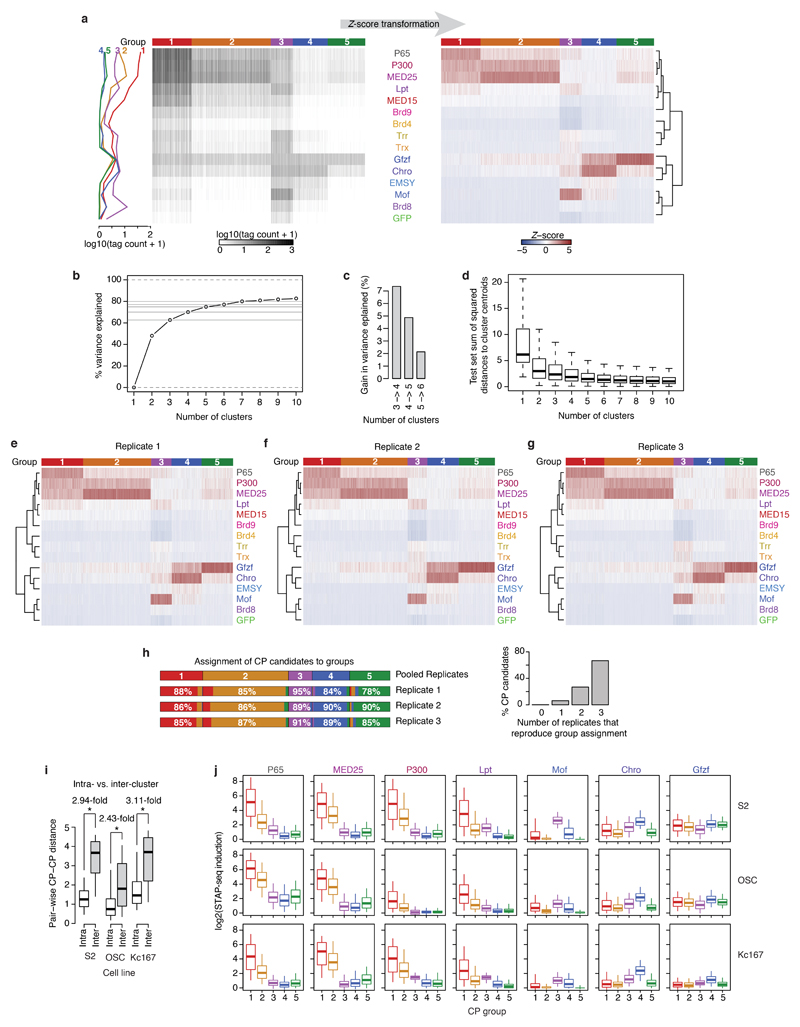
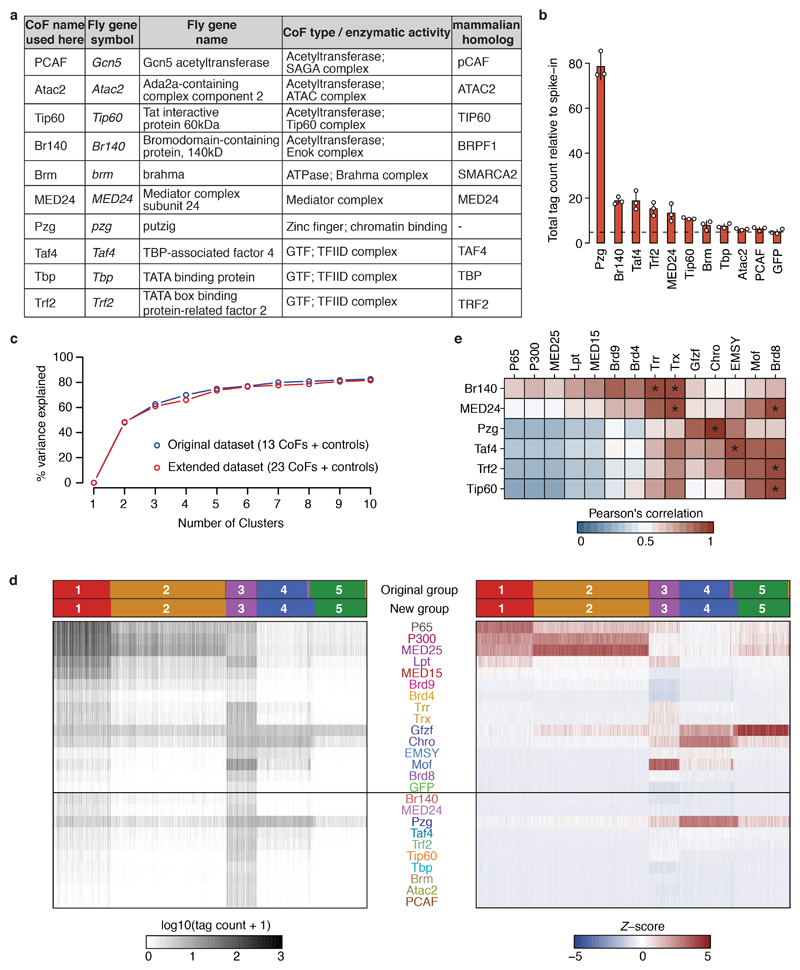
The observed COF−CP compatibilities (Fig. 1b-d) suggest the existence of distinct CP classes that differentially respond to specific COFs. To address this, we used K-means clustering to define groups of CPs with similar responses. Around 75% of the variance can be explained by 5 CP groups, which were activated preferentially by 1) MED25, P300, and strongly by P65, 2) MED25, P300, and weakly by P65, 3) Mof, and weakly by Lpt and Chro, 4) Chro and Gfzf, and 5) Gfzf, respectively (Extended Data Fig. 6). While additional types of CPs likely exist in more specialized cell types such as germline cells22, screening 10 additional COFs, including subunits of prominent COF complexes with diverse enzymatic activities (e.g. SAGA, ATAC, NuA4/Tip60, Enok) and general transcription factors (GTFs; e.g. TBP, Trf2, Taf4) did not reveal additional CP types in S2 cells (Extended Data Fig. 7a-d), presumably because each of the additional COFs was highly similar to at least one of the original 13 COFs (PCC ≥ 0.9; Extended Data Fig. 7e).
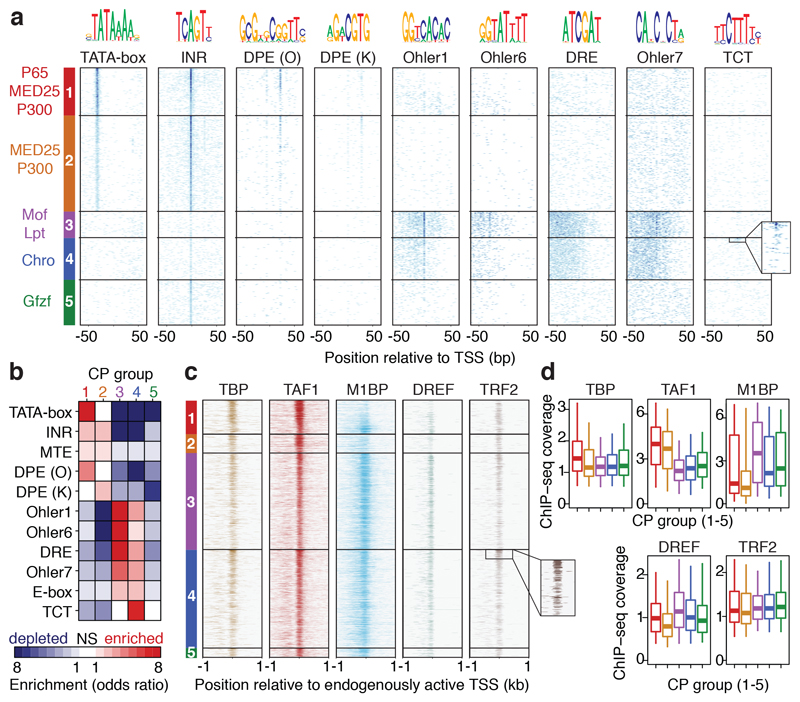
Given that COF-STAP-seq measures COF-CP compatibility in an otherwise constant reporter setup, distinct compatibilities likely arise from differences in CP sequences. Indeed, the five groups of CPs displayed striking differences in the occurrence of known core promoter motifs (Fig. 2a, b). Group 1 is strongly enriched for TATA-box and a variant of the downstream promoter element (DPE) (from ref. 2), whereas Group 2 is enriched for a different DPE variant (from ref. 23). In contrast, Groups 1 and 2 are depleted in Motifs 1, 6, and 7 and in the DNA replication-related element (DRE), all of which are enriched in Group 3 and to a lesser extent in Group 4. Group 4 is the only group with a strong enrichment for the TCT motif known to occur in the promoters of ribosomal protein genes and other genes involved in translation4, which are indeed among the top 10% of CPs preferentially activated by Chro (Fig. 2a inset). In accordance with the differential occurrence of CP motifs, published datasets24–26 reveal differential binding of GTFs to these CPs in their endogenous genomic contexts. For instance, the TATA-binding-protein (TBP) bound more strongly to Group 1 CPs (Fig. 2c, d), which are enriched for the TATA-box, TAF1 to Group 1 and 2 CPs, which are enriched for the Inr motif, and Motif-1-binding protein (M1BP) and DRE factor (DREF) to Group 3 CPs, which are enriched for Motif 1 and DRE (Fig. 2a, b). Lastly, the TBP paralog TRF2 bound more strongly to Group 3, 4 and 5 CPs, consistent with previous reports that TRF2 regulates ribosomal protein genes24. The differences in motif occurrence and GTF binding between the CP groups suggest that COF compatibility might relate to GTF composition at the CP, which is determined by the CP sequence.
Figure 2 |. Groups of core promoters activated preferentially by different cofactors contain different core-promoter motifs.
a, Occurrence of known fly core-promoter (CP) motifs for CPs separated into 5 groups based on cofactor (COF) responsiveness in STAP-seq (Extended Data Figure 6). Within each group, CPs are sorted by decreasing STAP-seq tag count for the respective strongest COFs (left). Inset: occurrences of TCT in top 10% Group 4 CPs. b, Mutual enrichments (red) or depletions (blue) of motifs in CP groups. n = 5723, 11538, 3203, 5038 and 5434 CPs for Groups 1 to 5 respectively. NS = not significant (two-sided Fisher’s exact test P > 0.01). c, General-transcription-factor ChIP-seq coverage around TSSs for CPs active in S2 cells (sorted as in a; inset: Trf2 ChIP-seq coverage at top 10% Group 4 CPs; ChIP-seq data (S2 and Kc167 cells, embryos) from refs in Supplementary Table 1). d, as c but showing average coverage in -150 to +50bp windows around the TSS (n = 646, 363, 1842, 1885 and 179 CPs for Groups 1 to 5, respectively; boxes: median and interquartile range; whiskers: 5th and 95th percentiles).
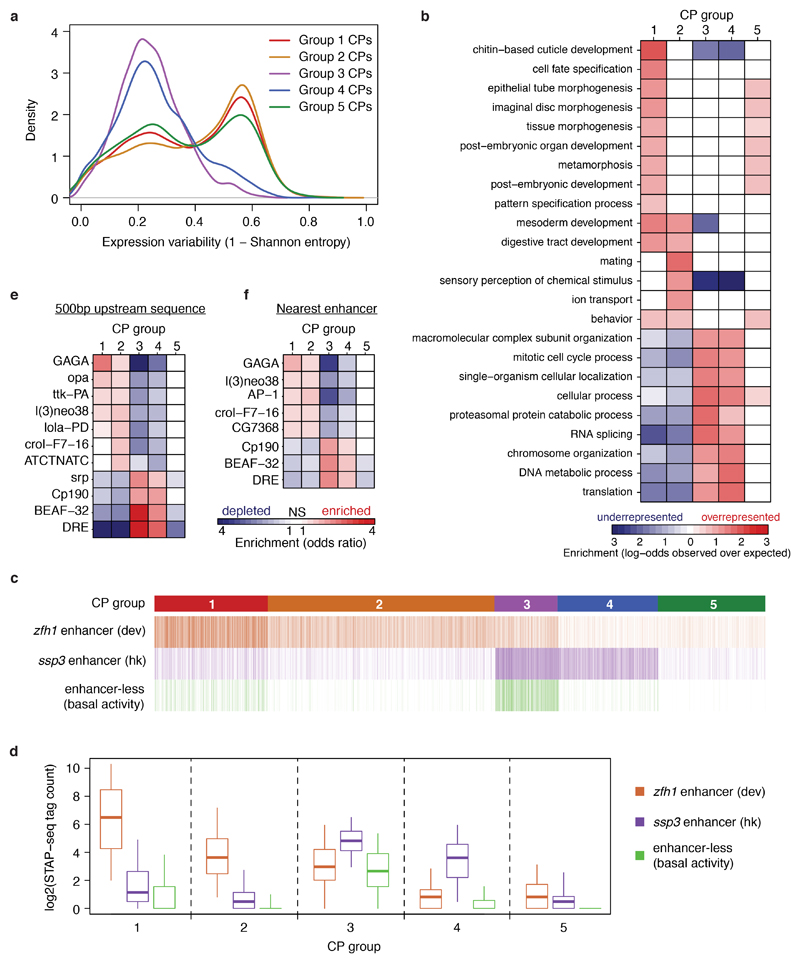
The CP groups defined by their COF responsiveness are reminiscent of groups previously defined based on motif content2,4 and transcription initiation patterns5 that differ in chromatin properties10, gene function and expression3–5, and enhancer responsiveness9. Our dataset might provide a functional link between these observations and the activation of distinct CP types by specific COFs. Indeed, Group 1 and 2 CPs are associated with genes that are expressed highly variably across cells in Drosophila embryos27 and have cell type-specific or developmental functions, while Group 3 and 4 CPs belong to genes that are expressed more uniformly and have housekeeping functions (Extended Data Fig. 8a,b). Furthermore, both the upstream sequences and the nearest enhancers (obtained from ref. 9) of these CPs were enriched for TF motifs known to occur in developmental versus housekeeping enhancers9, respectively, and developmental and housekeeping enhancers indeed preferentially activated Group 1 and 2 versus Group 3 and 4 CPs, respectively, when tested by STAP-seq (Extended Data Fig. 8c-f). Together, these results directly link enhancer−CP specificity9 to COF−CP compatibility.
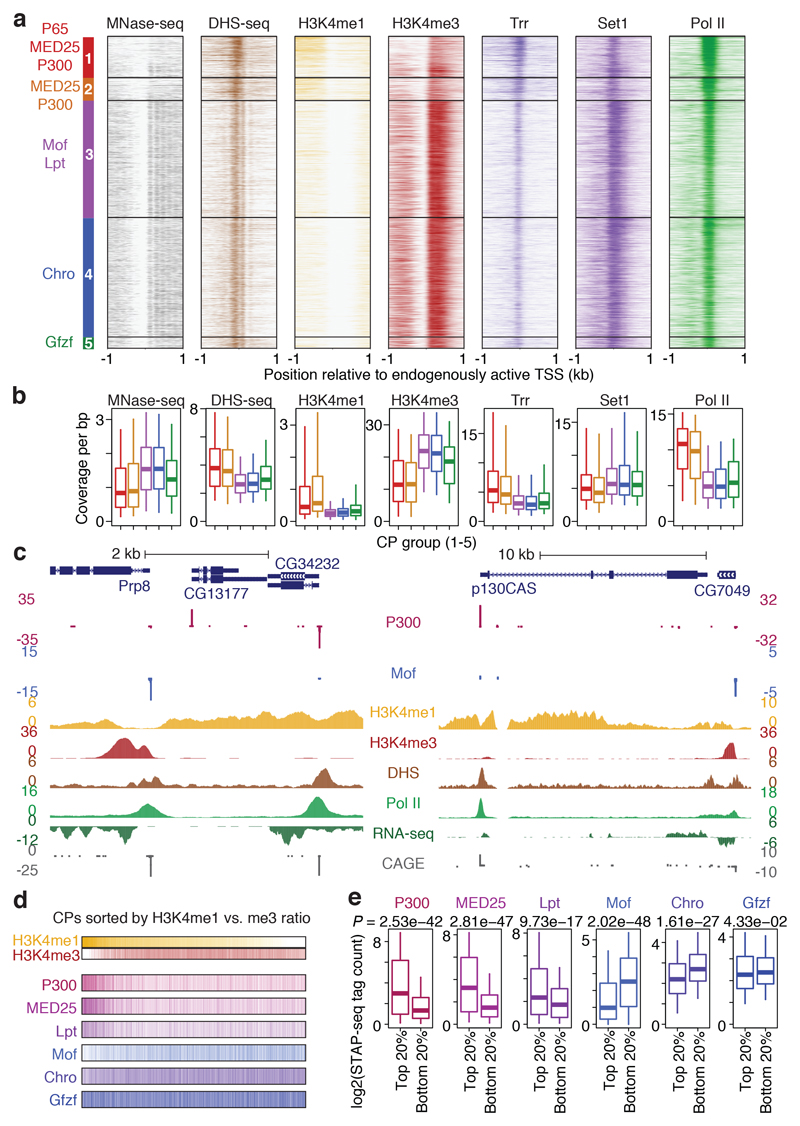
Since COFs can modify nucleosomes and alter the chromatin structure, we investigated the endogenous genomic contexts of the five CP groups in S2 cells (only considering CPs of active genes, as in Fig. 1e-g). Nucleosome positioning28, DNA accessibility29, and histone modifications19 all differed between the CP groups (Fig. 3a, b; see Supplementary Table 1 for details): Group 1 and 2 CPs have broader DNA accessible regions around the TSSs and lower nucleosome occupancy and -phasing downstream of the TSS, compared to Group 3 and 4 CPs, which have more narrow nucleosome-depleted regions around the TSS and strongly phased downstream nucleosomes (Fig. 3a, b; see Extended Data Fig. 9a for nucleosome-positioning-related di-nucleotide patterns).
Figure 3 |. H3K4me1 and H3K4me3 differentially mark promoters activated by distinct cofactors.
a, Endogenous chromatin properties of 5 core-promoter (CP) groups activated by distinct cofactors (COFs; left). Heatmaps show coverage (MNase-, DHS- or ChIP-seq from S2 cells) around the TSS of CPs grouped and sorted as in Fig. 2c. b, as a but average coverage in a defined window around the TSS (-150 to +50 for DHS-seq, Trr, and Pol II; -150 to +250 for Set1; +1 to +500 for MNase-seq, H3K4me1 and H3K4me3). n = 646, 363, 1842, 1885 and 179 CPs, for Groups 1 to 5, respectively. c, Examples of differentially activated and H3K4me1- versus H3K4me3 marked CPs (COF-STAP-seq data: merge of three independent biological replicates). d, COF-STAP-seq signals of CPs sorted by decreasing H3K4me1-versus-H3K4me3 ratios at endogenous loci in S2 cells. e, COF-STAP-seq signals of top and bottom 20% CPs from d (n = 983 CPs per box). a-e considering only CPs active in S2 cells; all data but COF-STAP-seq reanalysed from refs in Supplementary Table 1; boxes: median and interquartile range; whiskers: 5th and 95th percentiles; P values: two-sided Wilcoxon rank sum test.
Unexpectedly, the CP groups also differed in the methylation status of histone 3 lysine 4 (H3K4). H3K4me3 is thought to be universally associated with active promoters30 and indeed strongly marks CPs of Groups 3, 4 and 5 (Fig. 3a, b). In contrast, Group 1 and 2 CPs have lower levels of H3K4me3 but higher levels of H3K4me1 compared to Group 3 to 5 CPs, a modification typically considered an enhancer mark (Fig. 3a-c, Extended Data Fig. 9b-d). This difference is consistent with the differential binding of Trr and Set118, which deposit these modifications, respectively19, and does not seem to stem from higher levels of Pol II binding or transcription at Group 3 to 5 CPs (Fig. 3a, b; Extended Data Fig. 9e, f). Consistent with reports that developmental promoters lack H3K4me3 (refs 10–12), these results suggest that high H3K4me3 versus H3K4me1 levels might not be a universal feature of promoters that distinguishes them from enhancers, as previously suggested, and rather might depend on the COFs that regulate the respective promoters (Fig. 3c and Extended Data Fig. 9b, c). Indeed, ranking all active CPs in S2 cells by their H3K4me1-to-H3K4me3 ratio revealed that those with the highest ratio are preferentially activated by P300 and MED25, and those with the lowest ratio by Mof or Chro (Fig. 3d, e).
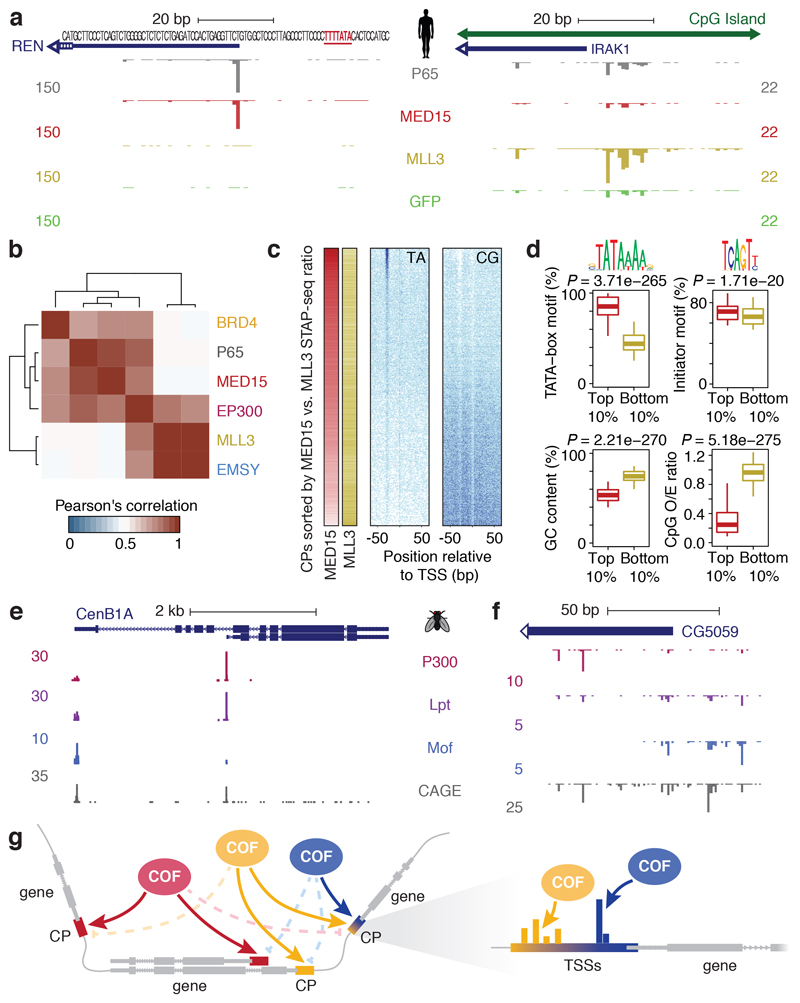
To test if regulatory compatibilities between COFs and CPs exist in other species, we performed proof-of-principle screens in human HCT116 cells for five human COFs (BRD4, MED15, EP300, MLL3, EMSY) and P65, using a focused library containing 12,000 human CP candidates selected to cover the diversity of human CPs (see Methods). These screens revealed that CPs also respond differently to different COFs in human cells (Fig. 4a, Extended Data Fig. 10a, b): while the TATA-box containing CP of REN is for example only activated by MED15 and P65, the CpG-island CP of IRAK1 responds most strongly to MLL3; and the tested COFs consistently displayed distinct CP-preferences across the entire CP library (Fig. 4b, Extended Data Fig. 10c). Overall, the CPs most strongly activated by MED15 are enriched for TATA-boxes, whereas CPs rather activated by MLL3 exhibit a higher GC and CpG content, suggesting that MLL3 but not MED15 preferentially activates CpG-island promoters (Fig. 4c, d; Extended Data Fig. 10d). Together this establishes that sequence-encoded COF-CP compatibilities exist in species as distant as fly and human, suggesting that they constitute a general principle with important implications for transcriptional regulation.
Figure 4 |. Cofactor−core-promoter compatibility is a conserved regulatory principle that underlies differential gene and alternative promoter activation.
a, Transcription activated by human P65, MED15, and MLL3 from the CPs of the REN (left) and IRAK1 (right) genes (human COF-STAP-seq: merge of 3 independent biological replicates). b, Hierarchical clustering of COFs based on Pearson’s correlation of STAP-seq tag counts across 12,000 CP candidates. c, Occurrence of TA and CG dinucleotides in CPs sorted by MED15 versus MLL3 activation (left). d, Distribution of TATA-box and Initiator scores, GC content and CpG dinucleotide observed-over-expected (O/E) ratio for top vs. bottom 10% of CPs from c (n = 961 CPs for each box; boxes: median and interquartile range; whiskers: 5th and 95th percentiles; P values: two-sided Wilcoxon rank sum test. e, f, Examples of differentially activated alternative promoters (e) or closely-spaced TSSs (f; see also Extended Data Fig. 9g, h; merge of three independent biological replicates). c, Model of COF−CP regulatory compatibility, which allows independent regulation of different genes, alternative promoters of the same gene (left) or individual TSSs within a single promoter (right).
The regulatory compatibilities between COFs and CPs we observed allow separate transcriptional programmes to independently regulate not only different genes (e.g. housekeeping and developmental genes9; Extended Data Fig. 8) but also alternative promoters and thus different isoforms of the same gene (Fig. 4e). Interestingly, composite promoters with differentially activated closely spaced TSSs exist (Fig. 4f) and enable regulation by different COFs and programmes, potentially in different developmental contexts13. As the CP types differ in sequence elements, these might instruct the assembly of functionally distinct pre-initiation complexes (PICs) that differ in GTF composition22,24 or create distinct rate-limiting steps that require activation by different COFs, enabling specific and synergistic regulation31–33. The existence of regulatory COF−CP compatibilities impacts promoter activation and gene expression in endogenous contexts and biotechnological applications and − together with other mechanisms that determine enhancer-promoter targeting in the context of the three-dimensional chromatinized genome1 − helps explain how different genes or alternative promoters can be distinctly regulated in species as divergent as flies and humans (Fig. 4g).
Materials and Methods
UAS STAP-seq screening vector
The UAS STAP-seq screening vector was generated from pSTAP-seq_fly-ctrl14 (Addgene ID 86380) by cloning an array of 4 upstream activating sequences (UAS) (obtained from pSGE_91_4xUAS_dCP7 [Addgene ID 71169]) upstream of the library insertion site (position of the CP) between the KpnI and BglII restriction sites. The full sequence of the newly created pSTAP-seq_fly-4xUAS is available at www.addgene.org (Addgene ID 125149). The overall design of the human UAS STAP-seq screening vector (pSTAP-seq_human-4xUAS; Addgene ID 125150) matches the fly version with few adaptations to human cells, including the use of the pGL4 series backbone (from pSTARR-seq_human; Addgene ID 71509) and a chimeric intron34. In detail, we first replaced the sequence between the KpnI and PciI restriction sites by the DNA sequence synthesized as gBlock (IDT) (see Supplementary Table 2). Second, the sequence between the AgeI and SalI sites from pSTAP-seq_fly-ctrl14 (Addgene ID 86380) and, finally the 4xUAS array (see Supplementary Table 2) was added between the KpnI and BglII sites.
GAL4-DBD-COF expression vectors
To specifically recruit COFs to the CP candidate library we expressed the COFs ectopically as GAL4-DBD fusion proteins. To N-terminally fuse the GAL4-DBD to the COF we modified the previously used expression vector pAGW-GAL4-DBD7 (pSGE_240_pAGW_V5; Addgene ID 71188). We replaced the Act5C promoter with a strong enhancer35 and the CP (orthologue of CG13116) from Drosophila pseudoobscura (D. pse) (Supplementary Table 2) using BglII and EcoRV sites, after sub-cloning them to pGL3_ctrl_CP-candidate_luc+14 (Addgene ID 86392) using KpnI and BglII and BglII and SbfI sites, respectively, to obtain the expression vector pAGW-dpse-GAL4-DBD (Addgene ID 125153), which was used in S2 cells (Gateway destination vector; see below). For OSCs and Kc167 cells we used the pAGW-GAL4-DBD7 expression clones. The GAL4-DBD-COF expression clones were created using the Gateway system (Invitrogen) as described7. The pENTRY clones for Nejire/P300, Mof, Lpt, Trr, Chro, Brd8, Brd9, MED15, MED25, EMSY, Gfzf, Pzg, Br140, Taf4, MED24, Tip60, Brm, Tbp, Atac2, Gcn5, fs(1)h were obtained from ref. 7. The pENTR-Trf2 (Addgene ID 125159) clone was obtained from the Brennecke lab36 (IMBA, Vienna, Austria) and the pENTR-DTOPO-Trx (Addgene ID 125160) clone from the Paro lab (ETH Zürich, Switzerland). All expression clones were sequence verified using high-throughput sequencing as described previously7.
Human COF (MED15, EMSY, EP300) pENTRY clones were generated by cloning their ORFs, amplified from cDNA obtained from HeLaS3 and K562 cells into pDONR221 (see Supplementary Table 3 for primer & cDNA sequences), as described before7 (Addgene IDs 125155-125157). For MLL3 we directly generated the expression clone pAGW-CMV_GAL4-DBD_MLL3 (Addgene ID 125158) using the golden gate assembly system (NEB; cat.no E1600). The cDNA fragments for MLL3 were amplified from pcDNA-MLL3 (a gift from Joanna Wysocka, Stanford University, USA). BRD4 was obtained from pDONR223-BRD4 (Addgene ID 23455). To express human COFs we used the previously described human expression vector pAGW-CMV_GAL4-DBD7 (pSW1; Addgene ID 71279). Individual COF expression vectors were generated by the Gateway system (Invitrogen) following the same strategy as described before7. All expression human clones were verified by Sanger sequencing. All clones matched the annotated coding sequences, except EMSY (additional Val at position 141) and MLL3 (Ala→Val at position 236 and a deletion of 4 amino acids at position 4721-4724 [Arg-Phe-Val-Leu]).
Comprehensive genome-wide Drosophila CP candidate library
The Drosophila CP candidate library was cloned from a pool of 72,000 synthesized 200-mer oligonucleotides obtained from Twist Biosciences Inc. The CP candidates spanned 133 base pairs total, centered on the candidates’ major (+1) TSS, flanked by the Illumina i5 (33bp; 5’-ACACTCTTTCCCTACACGACGCTCTTCCGATCT) and i7 (34bp; 5’ GTGACTGGAGTTCAGACGTGTGCTCTTCCGATCT) adapter sequences upstream and downstream, respectively, serving as constant linkers for amplification and cloning (Supplementary Table 4).
Representative/Focused human CP candidate library
The human CP candidate library exhibits the same specifications as the fly library, except that it only includes 12,000 different 200-mer oligonucleotides, i.e. CP candidates. These were selected to be a representative subset containing different types of human CPs based on sequence, transcription initiation patterns and endogenous expression (see below).
CP candidate selection for synthetic oligo library
A comprehensive library of CP candidates from Drosophila melanogaster genome was compiled by selecting transcription start sites (TSS) supported by different datasets. We used endogenous transcription initiation sites mapped by Cap Analysis of Gene Expression (CAGE) in 13 different developmental stages, 18 adult fly tissues and S2 cells37, as well as TSSs mapped by RAMPAGE in 36 stages of the fly life cycle38. We additionally included genomic positions that initiate transcription in response to activation by the zfh1 enhancer in STAP-seq14, and all remaining annotated gene TSSs from FlyBase (version 5.57) and Ensembl (version 78) databases. TSSs were included sequentially in the order shown in Extended Data Fig. 1a, i.e. first all TSSs detected by CAGE across 13 developmental stages were selected and for each following dataset only the new TSSs were added (if they were more than 10 base-pairs away from any TSS already in the set). As negative controls, we selected random positions without any evidence of initiation. Total of 72,000 TSSs were selected and used as reference points to design core promoter oligos encompassing 66 bp upstream and 66 bp downstream of the TSS. The sequences were extracted from D. melanogaster genome (BDGP Release 5 / dm3 genome assembly). Genomic coordinates of all 72,000 CP candidates included in the library and dataset supporting the choice of each candidate are provided in Supplementary Table 5.
For the focused human CP candidate library, we used a comprehensive collection of human core promoters and enhancers defined in FANTOM5 from endogenous transcription initiation sites mapped by CAGE39,40. We selected a subset of different types of annotated gene promoters based on sequence (TATA-box-, DPE- or CpG island-containing promoters), initiation pattern (broad vs. focused initiation) and endogenous expression (cell/tissue-type restricted vs. ubiquitous), a subset of enhancers and a set of random control sequences amounting to 12,000 candidates in total. Oligos were designed to encompass 66 bp upstream and 66 bp downstream of the major TSS and the sequences were extracted from H. sapiens genome (hg19 genome assembly). Genomic coordinates and sequences of all 12,000 CP candidates included in the library are provided in Supplementary Table 6.
STAP-seq CP candidate library generation
To comprehensively amplify the oligonucleotide pool (diluted to 1ng/μl) and thereby creating the CP candidate library insert we performed 40 PCR reactions for Drosophila and 20 for human (98°C for 45seconds (s); followed by 16 cycles of 98°C for 15s, 65°C for 30s, 72°C for 10s) with 1μl diluted oligonucleotide pool as template, using KAPA Hifi Hot Start Ready Mix (KAPA Biosystems; cat. no. KK2602) and primers (fw: TAGAGCATGCACCGGACACTCTTTCCCTACACGACGCTCTTCCGATCT and rev: GGCCGAATTCGTCGAGTGACTGGAGTTCAGACGTGTGCTCTTCCGATCT) that add extra 15bp to each of the adapters, serving as homology arms for directional cloning of the CP candidate library insert using In-Fusion HD (Clontech; cat. no. 639650). All PCR reactions were pooled and purified with Agencourt AMPureXP DNA beads (ratio beads/PCR 1.4; cat. no. A63881). Cloning of the library insert (amplified oligonucleotide pool) into the UAS-STAP-seq screening vector (pSTAP-seq_fly-4xUAS/ pSTAP-seq_human-4xUAS) was performed as described previously14,29, with the exception that we used a 3:1 molar ratio of amplified library (PCR fragments) to vector.
STAP-seq spike-in controls
To account for variations between screens and replicates, we normalized all STAP-seq screens and replicates using spike-in controls. We employed the same strategy as described previously14, however extending the number of spike-in controls.
We added five spike-in controls to the previously describe set14. They were generated as described14 with the exception that we used pSTAP-seq_fly_spike-in (Addgene ID 125151), that was generated by replacing the zfh1 enhancer in the pSTAP-seq_zfh1 vector by an D. pse enhancer35 (Supplementary Table 2; sub-cloned to pGL3_ctrl_CP-candidate_luc+14 (Addgene ID 86392) using the KpnI and EcoRI sites) between the KpnI and BglII sites. The new spike-in vectors were diluted to 0.1ng/μl (we used 0.2ng of each spike-in per 20μg library/COF DNA) and added to the previously described spike-in vector mix14. The sequences of the newly added spike-in CPs from D. pse are listed in Supplementary Table 2. These spike-in vectors were used for S2 and Kc167 cells. For STAP-seq in OSCs we cloned the D. pse promoters into pSTAP-seq_fly-tj14 that contains the OSC-specific traffic jam (tj) enhancer to account for cell-type specific expression.
For STAP-seq in human HCT116 cells the spike-in controls were generated by cloning 10 mouse promoter regions at the position of the CP (see Supplementary Table 7 for promoter and primer sequences), using KpnI and SalI restriction sites in the human pSTAP-seq_human_spike-in vector (Addgene ID 125152), that in contrast to the pSTAP-seq_human-4xUAS lacks the array of UAS sites and exhibits a shorten version of GFP. The pSTAP-seq_human_spike-in vector (Addgene ID 125151) was generated as described for pSTAP-seq_human-4xUAS but using a slightly different synthesized DNA sequence (gBlock; IDT; Supplementary Table 7). The spike-in mix was obtained by mixing the 10-individual spike-in plasmids at equal volumes but different concentrations (see Supplementary Table 7 for spike-in composition and concentrations of individual spike-in plasmids).
Cell culture and transfection
S2 cells were cultured as described previously29. Co-transfection of the CP candidate library, the COF expression plasmid and the spike-in controls was performed with 2x10⁸ S2 cells at 70-80% confluence using the MaxCyte STX Scalable Transfection System. We transfected the cells at a density of 5x10⁸ cells per milliliter in MaxCyte HyClone buffer using OC-400 processing assemblies and 50μg DNA (45μg library and 5 μg COF expression plasmid and 0.5ng of each spike-in) per milliliter of cells. Electroporation was performed as described previously14. We performed three independent transfections per COF. OSCs were cultured and transfected as described previously14. Drosophila Kc167 cell lines were cultured in M3+BYPE medium, supplemented with 5% heat-inactivated fetal bovine serum (FBS) at 25°C. They were transfected as described for S2 cells above.
Human HCT116 (ATCC #CCL-247) cells were cultured in DMEM (Gibco; cat# 52100-047) supplemented with 10% heat-inactivated FBS (Sigma; cat# F7524) and 2 mM L-glutamine (Sigma; cat# G7513) at 37°C in a 5% CO2-enriched atmosphere. Electroporation was performed using the MaxCyte STX Scalable Transfection System (as described in ref. 34) with the HCT116 pre-set program. Per COF we were using 80x106 cells at a density of 100x106 per ml in two OC-400 processing assemblies (40x106 cells per OC-400). We co-transfected 80μg library, 8μg COF plasmid DNA and 10 μl of human spike-in mix (588 ng) per OC-400 (see Supplementary Table 7 for spike-in composition and concentrations of individual spike-in plasmids).
STAP-seq RNA processing
As described previously29 total RNA was isolated 24 hours for Drosophila and 6 hours for human cells post electroporation followed by polyA+ RNA purification and turbo DNase treatment (Ambion; cat. no. AM2238). Per sample (replicate) we used 20μg of turbo DNAse treated polyA+ RNA. STAP-seq RNA processing was performed as described previously14, with the following exceptions: (1) the usage of a different de-capping enzyme. We exclusively used Cap-Clip™ Acid Pyrophosphatase (cat. no. C-CC15011H) from CELLSCRIPT (0.05μl per 1μg RNA). (2) We ligated 100μM RNA oligonucleotide (5’ RNA linker; Supplementary Table 4) per 1μg polyA+ RNA. The 5’ RNA linker contains 10 random nucleotides at the 3’ end (used as Unique Molecular Identifier (UMI) to count reporter mRNAs) (see below), but also to minimize sequence-preferences during the T4 RNA Ligase 1 reaction41. Between the RNA linker sequence and the UMI we included a four nucleotide (sample) barcode (eBC; Supplementary Table 4) creating eight different and specific 5’ RNA linkers. These linkers individually barcode the samples already at the step of linker ligation. Importantly, this allows the simultaneous amplification of up to eight pooled samples (see below). cDNA synthesis was performed as described14.
STAP-seq cDNA amplification
We amplified the total amount of reporter cDNA obtained from reverse transcription (above) for Illumina sequencing with a two-step nested PCR strategy. In the first PCR step we used primers that bind to the 5’ RNA linker and downstream of the ORF (upstream of the poly-A signal) towards the 3’end of the reporter cDNA. We performed 2 PCR reactions per COF/sample using the KAPA Hifi Hot Start Ready Mix (KAPA Biosystems; cat. no. KK2602) with the primers GTTCAGAGTTCTACAGTCCG*A and TATCATGTCTGCTCGAAG*C*G*G (* denotes phosphorothioate linkages). The 2 PCR reactions were pooled and cleaned up using AMPure XP beads (ratio 1:0.9) and eluted in 100μl H2O.
For the second PCR step (sequencing ready PCR) we pooled eight samples (40 μl each; each barcoded by a different 5’RNA linker). We then performed 16 sequencing-ready PCR reaction (20μl template each) on the pooled samples using as forward primer AATGATACGGCGACCACCGAGATCTACACGTTCAGAGTTCTACAGTCCG*A and as reverse primer NEBNext® Multiplex Oligos for Illumina® (NEB; cat. no. E7335 or E7500), which makes these fragments NGS competent. We purified the PCR products using Agencourt AMPureXP DNA beads (ratio beads/PCR 1.4) prior to NGS.
Illumina sequencing
All samples were sequenced by the VBCF’s NGS unit on an Illumina HiSeq2500 or NextSeq platform, following manufacturer’s protocol, with the exception that the forward read primer mix (read1) was replaced by the Illumina smallRNATrueSeq primer (TCTACACGTTCAGAGTTCTACAGTCCGACGATC).
Luciferase reporter assays
To construct the UAS firefly reporter vector, we cloned an array of four UASs between the XhoI and BglII restriction sites into the pGL3_ctrl_CP-candidate_luc+14 (Addgene ID 86392), to obtain pGL3_4xUAS_CP-candidate_luc+ (Addgene ID 125154). The candidate sequences (see Supplementary Table 8 for primers) were subsequently cloned between the BglII and SbfI restriction sites. As in COF-STAP-seq, COFs were recruited to drive transcription from the individual CP candidates. To determine the basal activities of the CP candidates they were also tested by recruiting GFP. Luciferase assays were performed as describe previously7 in quadruplicates. In brief, individual candidates were tested by co-transfecting 30,000 S2 cells with 30 ng of the respective UAS firefly construct and 3 ng COF expression vector (3 ng of ubiquitin-63E Renilla control plasmid29 was added to each sample using JetPei as described before7. We measured luciferase activities at a Bio-Tek Synergy H1 plate reader, as described7.
Luciferase assay analysis
We first normalized firefly over Renilla luciferase values for each of the 4 biological replicates individually. We used the mean of the replicates to calculate the fold change of COF driven luciferase signals over the GFP control for each candidate (i.e. activation above GFP).
COF-STAP-seq NGS data processing
Paired-end COF-STAP-seq reads were trimmed to 46 bp, with the first 10 bp of the forward read as the unique molecular barcode identifier (UMI). The reads were mapped using the remaining 36 bp as paired-end to a reference containing 133bp long sequences of 72,000 CP candidates for fly or 12,000 CP candidates for human, as well as to D. pseudoobscura (dp3) or Mus musculus (mm9) genome (for spike-in controls) using Bowtie version 0.12.9 (ref. 42). The spike-in control D. pseudoobscura and M. musculus CP sequences were selected from their D. melanogaster or H. sapiens orthologs, respectively, such that the reads could unambiguously be mapped to the spike-in genome with the same mapping parameters. Multi-mapping was allowed and only mappings with reverse reads mapping to the end of the oligo sequence were kept ensuring they correspond to reporter transcripts transcribed from that particular cloned CP candidate. Read pairs that still mapped to more than one oligo sequence were randomly assigned to one position. For paired-end reads that mapped to the same positions, we collapsed those that have identical UMIs as well as those for which the UMIs differed by 1 nucleotide to ensure the counting of unique reporter transcripts. Tag counts at each position represent the sum of the 5′-most position of collapsed fragments. Total read counts mapping to CP library and spike-in CPs for each dataset are summarized in Supplementary Table 9.
Quantification and normalization of initiation events per CP candidate
Unique tags mapping to any position within the CP candidate were summed to obtain tag count per CP candidate. We did the same for the spike-in CPs, and the counts were used to calculate normalization factors between the datasets within the same batch (Supplementary Table 10). For each spike-in CP we first assigned factor 1 to the dataset with the lowest count and then calculated down-scaling factors for all other datasets based on their counts for that CP. Final normalization factors were calculated as median of factors for individual CPs and were used to normalize raw tag counts in each dataset. Normalization was performed for each cell line separately, since the expression of spike-in CPs is not comparable across different cell lines. For downstream analyses, we averaged normalized tag counts across the 3 biological replicates for each COF (Supplementary Tables 11 & 12). Normalized tag counts allowed us to quantitatively compare different COFs, i.e. assess their absolute strengths and relative activation of any CP.
Genomic distribution
We assigned a unique annotation for each nucleotide in the genome based on the FlyBase v5.57 gene annotation via the following priority order: core promoter (+/- 50 bp around annotated TSS), proximal promoter (-250 to -50 bp from annotated TSS), 5’ UTR, gene body (includes exons, introns and 3’ UTR), intergenic region. We then assigned each CP candidate to one of these categories by the annotation of its TSS.
CPs activated significantly above GFP
For each COF, we considered only CP candidates that were supported by ≥5 tags (≥3 tags supporting single TSS position) in at least 2 replicates. These CPs were tested for significant activation above GFP using one-sided Student’s t-test (3 reps of COF vs. 3 reps of GFP) and P-values were corrected for multiple testing by Benjamini-Hochberg procedure. CPs with FDR ≤ 0.06 and fold-change above GFP ≥ 2 were considered significant. We then compiled a set of 30,936 CPs that are significantly activated by at least one COF and used those in subsequent analyses (Supplementary Table 11). In addition, we defined a subset of non-redundant activated CPs by removing overlapping oligos and keeping a single most activated oligo per non-overlapping genomic region (Supplementary Table 13), which we used in all analyses that involve integration with other genomic data.
Correlation and COF clustering
We calculated pair-wise Pearson’s correlation coefficients (PCCs) between COFs (either individual or merged replicates) using tag counts at 30,936 CPs significantly activated by at least one COF in fly and tag counts at all 12,000 CP candidates in human. For comparison of COF clustering in different cell lines, we used induction above GFP (to account for differences in basal activity) to calculate PCCs between COFs. We performed hierarchical clustering (UPGMA method) using the correlation values as similarities.
CP candidates clustering
For each significantly activated CP, we transformed the merged normalized tag counts per COF into Z-scores. We then used Z-scores to cluster CPs into 5 clusters with K-means algorithm. Optimal number of clusters was determined by the “elbow” method looking at the percentage of variance explained and the sum of squared distances to nearest cluster center in a 5-fold cross-validation procedure, both as a function of the number of clusters. We assessed the robustness and reproducibility of the obtained clusters by repeating the clustering for each of the 3 replicates independently and calculating the percentage of CPs with the correct cluster assignment per replicate, and conversely, number of replicates that support cluster assignment for each CP. We repeated the clustering on an extended dataset containing 10 additional COFs and compared the cluster assignment of each CP between the original and the extended dataset. For each run of K-means the algorithm was initialized at a different, randomly chosen data point.
To assess the meaningfulness of the CP clusters defined in S2 cells for OSC and KC167 cells, we calculated pair-wise Euclidean distances between all CPs using OSC or Kc167 COF-STAP-seq data and compared the distribution of distances for CPs belonging to the same versus CPs belonging to different clusters in S2 cells.
Public datasets
In this study we re-analyzed the following previously published high-throughput sequencing datasets: ChIP-seq for P300/CBP12,43, Brd4 (ref. 17), Mof20, Set1 (ref. 18), Trx18, Trr18, Lpt19, PolII19, H3K4me1 (ref. 19) and H3K4me3 (ref. 19) in S2 cells, DREF in Kc167 cells25, and TBP24, TRF224 and Chro21 (modENCODE, sample ID: 5068) in D. melanogaster embryos; ChIP-exo for TAF1 and M1BP in S2 cells26; MNase-seq in S2 cells28; DHS-seq in S2 cells29; PRO-seq in S2 cells upon P300 inhibition12; RNA-seq in wild-type S2 cells44 and S2 cells upon Trx18 or Brd417 knock-down; single cell RNA-seq of D. melanogaster embryos27; CAGE in S2 cells (modENCODE, sample ID: 5331), D. melanogaster developmental and adult stages37,38 and GRO-seq in S2 cells45. All datasets are listed in Supplementary Table 1 with respective references and GEO and SRA accessions. We used raw sequencing data and re-processed it for consistency: reads were trimmed to 36 nt and mapped to dm3 genome assembly with Bowtie version 0.12.9 (ref. 42) or to transcriptome (FlyBase v5.57) with TopHat version 2.0.12 (ref. 46). For S2 cells CAGE, we combined the two replicates and mapped 27 nt tags with Bowtie. We removed the non-template G nucleotide at the 5’ if it was a mismatch to the genome and then computed the coverage of 5’ ends per genomic position and normalized the counts to tags per million (tpm). For ChIP-seq, MNase-seq and DHS-seq, we computed coverage of reads extended to 150 bp across the genome and normalized it to tpm. For RNA-seq and PRO-seq, we counted number of reads per gene using HTSeq version 0.6.1 (ref. 47) and used the counts for differential expression analysis. For single cell RNA-seq, we used the processed tables with unique counts per gene in each individual cell downloaded directly from GEO.
Comparison of COF-STAP-seq to COF binding by ChIP-seq
We considered all significantly activated CP candidates that were within annotated core promoter regions (+/- 50 bp around annotated TSSs) and were supported by CAGE (≥10 tpm) and RNA-seq for the associated transcript (≥5 reads per kilobase per million). For each of the COFs, for which the published ChIP-seq data is available, we sorted the CPs by the STAP-seq tag count for that COF and visualized the ChIP-seq coverage of the respective COF in the 2 kb window centered at the TSS. We then binned the CPs into 20 equally-sized bins and displayed the distribution of average ChIP-seq coverage in the -150 bp to +50 bp window around the TSSs for each bin. Significance between top 25% and bottom 25% CPs (first 5 vs. last 5 bins) was assessed using one-sided Wilcoxon rank-sum test.
Comparison of COF-STAP-seq to gene expression changes upon COF function loss
Differential gene expression was assessed with DESeq2 version 1.8.1 (ref. 48), and only genes expressed in S2 cells were considered (≥5 RPKM). Genes with FDR ≤ 0.01 were considered significantly down- or up-regulated. For each gene, the most highly activated CP in COF-STAP-seq was picked and the distribution of expression fold-change between COF knock-down/inhibition and control was displayed for top 25% CPs activated by that COF and for the same number of bottom ranking significantly activated CPs (not activated by that COF, but activated by any of the other COFs). Conversely, we visualized the distribution of COF-STAP-seq tag counts for CPs of significantly down-regulated genes vs. CPs of all other expressed genes. Significance between the distributions was assessed using one-sided Wilcoxon rank-sum test.
Core promoter motif and TF motif enrichment
Position weight matrices (PWMs) for TATA-box, Inr, downstream promoter element (DPE), motif ten element (MTE), Ohler motifs 1,6 & 7, DNA replication-related element (DRE) and E-box were obtained directly from ref. 2. PWMs for variant DPE and the TCT motif were constructed from sequences provided in refs 23 and 4, respectively. CP sequences were scanned with individual PWMs and a hit was reported if the maximal score in the narrow window where the motif is expected to occur49 was at least 95% of the maximal possible score for that PWM (i.e. 95% match was required).
For transcription factors we used previously employed PWMs44 with a cut-off of 4-6 = 2.4 × 10⁻⁴. For each motif we counted its occurrence in the 500 bp windows upstream of the CPs’ TSSs or within 401 bp windows centred on the peak summits of the nearest enhancers identified by STARR-seq in S2 cells9.
For each of the 5 groups of CPs, we assessed the differential distribution of each core promoter or TF motif between the CPs in that group and CPs in the remaining 4 groups by two-sided Fisher’s exact test. Obtained P-values were corrected for multiple testing by Benjamini-Hochberg procedure and enrichments or depletions with FDR ≤ 0.01 were considered significant.
Gene ontology analysis
We assessed whether genes associated with each of the 5 CP groups were mutually enriched or depleted for a particular GO term by calculating hypergeometric P-values for every GO term with GOstats R/Bioconductor package50 (version 2.34.0), using genes assigned to a specific CP group as a foreground and genes assigned to any of the 5 CP groups as a background. P-values were corrected for multiple testing by Benjamini-Hochberg procedure and enrichments with FDR ≤ 0.01 were considered significant. For each CP group, a non-redundant representative set of significantly enriched GO terms was selected manually from the top 100 terms, and respective enrichments or depletions of those terms in each CP group were visualized as a heatmap.
Dinucleotide and motif density plots
Density plots (heatmaps) of motifs and dinucleotides occurrence were generated as described in ref. 13, using the seqPattern R package (version 1.9.1) from Bioconductor51.
Endogenous chromatin, factor binding and expression data heatmaps and boxplots
Heatmaps displaying coverage centred at TSS for sorted sets of CPs were generated using custom scripts in R. For each dataset, the color scale represents log-transformed coverage values (tpm) scaled between 0 and maximum for that dataset. For boxplots we calculated average coverage (per bp) in a selected window relative to TSS. We used a window from -150 to +50 bp for DHS-seq, TBP, TAF1, M1BP, DREF, TRF2, Trr and Pol II, -150 to +250 for Set1 and +1 to +500 for MNase-seq, H3K4me1 and H3K4me3.
Statistics and data visualization
All statistical calculations and graphical displays have been performed in R statistical computing environment52, version 3.2.2. In all boxplots, the central line denotes the median, the box encompasses 25th to 75th percentile (interquartile range) and the whiskers extend from 5th to 95th percentile of the data. Coverage data tracks have been visualized in the UCSC Genome Browser53 and used to create displays of representative genomic loci.
Extended Data
Extended Data Figure 1 |. Selection of core promoter candidates and cofactors.
a, List of initial 13 Drosophila melanogaster cofactors (COFs) used in this study (see Extended Data Figure 7 for 10 additional COFs). For each COF, relevant information about its function is shown (functional domain / enzymatic activity / protein complex) and the name of the respective mammalian homolog from Ensembl database. b, Core promoter (CP) candidates from the D. melanogaster genome were selected sequentially (in order of the white arrow) based on transcription start sites (TSSs) from datasets that map endogenous transcription initiation (CAGE37 and RAMPAGE38), TSSs in reporter assays (STAP-seq14), or FlyBase (version 5.57) and Ensembl (version 78) gene annotations (for each new dataset, only TSSs that were more than 10 base-pairs (bp) away from TSSs already present in the selection were added). As negative controls, random positions without any evidence of initiation were selected. A total of 72,000 TSSs were used as reference points to design core-promoter oligos encompassing 66 bp upstream and 66 bp downstream of the TSS. c, Overview of COF-recruitment STAP-seq (COF-STAP-seq), a high-throughput activator bypass15,16,54-like assay that we created by combining a plasmid-based high-throughput promoter-activity assay, Self-Transcribing Active Core Promoter-sequencing (STAP-seq)14 with the GAL4-DNA-binding-domain (GAL4-DBD)-mediated recruitment of individual COFs as in ref. 7. The D. melanogaster CP candidate library, pre-mixed with the Drosophila pseudoobscura (D. pseudoobscura) CP spike-in mix, was co-transfected with an expression plasmid for one of the GAL4-DBD-COF fusion proteins. If binding of a GAL4-DBD-COF to the 4x-UAS array activates transcription from a candidate CP, this generates reporter RNAs with a short 5’ sequence tag, derived from the 3’ end of the corresponding CP. These reporter transcripts are captured with a 5’ RNA linker that includes a 10 nucleotide (nt) long unique molecular identifier (UMI), allowing counting of individual reporter RNA molecules. In addition, the RNA linker contains a 4 nt sample barcode (BC), used for sample identification, enabling pooled processing of up to 8 samples after linker ligation. This is followed by selective reverse transcription, PCR amplification, deep sequencing and mapping of the 5’ sequence tags to quantify productive initiation events at single base-pair resolution for all candidate CPs in the library and spike-in CPs.
Extended Data Figure 2 |. Cofactor recruitment reproducibly activates transcription preferentially from annotated core promoter sequences.
a, Pairwise comparisons of normalized STAP-seq tag counts between 3 independent biological replicates per cofactor (COF) across all 72,000 tested core promoter (CP) candidates. The Pearson’s correlation coefficient (PCC) is denoted for each comparison. b, Total unique STAP-seq tag counts for P65, GFP and the 13 COFs (left: raw counts; right: counts relative to spike-in). Bar heights: mean counts; error bars: standard deviation (SD). n=3 independent biological replicates for each COF. c, Distribution of normalized STAP-seq tag counts from all COFs at candidates grouped by different annotated genomic regions (FlyBase version 5.57). ‘Core promoter’ regions were defined as 100bp regions from 50 bp upstream to 50 bp downstream of annotated gene TSSs, and ‘Proximal promoter’ as regions up to 250 bp upstream of annotated gene TSSs. ‘Gene body’ includes both exons and introns, but excludes 5’ UTRs, which form a separate category. ‘Random negative regions’ represent candidates selected as negative controls (see Extended Data Fig. 1b) irrespective of their genomic location. n: number of independent CP candidates per box; boxes: median and interquartile range; dots: mean; whiskers: 5th and 95th percentiles. d, Genomic distribution of CP candidates (top; n=72,000) and of unique STAP-seq tags, i.e. transcripts initiated at CP candidates upon activation by any of the COFs (bottom; n= 41,069,770). Annotated gene core promoters (red) are highly enriched for STAP-seq tags.
Extended Data Figure 3 |. Transcriptional cofactors have characteristically different core-promoter activation profiles.
a, COF-STAP-seq signals (transcription initiation events) of each of the 13 cofactors (COF) and the positive and negative controls (P65 and GFP, respectively) from core promoter (CP) candidates in the representative genomic locus (same as in Fig. 1b but showing all 13 COFs). Negative values denote transcription initiation on the antisense strand. b, Principal component analysis of STAP-seq tag count normalized to spike-ins for 30,936 CPs significantly activated above GFP by at least one COF (≥ 2-fold enrichment over GFP and Student’s t-test FDR ≤ 0.06; see Methods) in 3 biological replicates per tested COF and controls. Scatterplot of projections onto the first two principal components (left) and the percent of variance explained by each principal component (right) are shown. c, Hierarchical clustering of individual biological replicates per COF based on Pearson’s correlation coefficient (PCC) across 30,936 CPs activated by at least one COF. All biological replicates cluster closely together and reproduce the functional COF groups shown in Fig. 1c derived from merged replicates. Blue-to-red shading indicates the PCC for each comparison d, Comparison of CP activation above GFP (induction) in STAP-seq (x-axis) and luciferase (y-axis) for 50 CPs tested with P65 and 4 different COFs. PCC indicated for each comparison.
Extended Data Figure 4 |. Cofactor−core-promoter compatibilities are cell type independent.
a, Representative genomic locus showing differential COF-STAP-seq signals for recruitment of MED25, Lpt, Chro and Mof in three Drosophila melanogaster cell lines. Each COF preferentially activates the same CPs in all 3 cell lines (S2, OSC and Kc167 cells), and these preferences differ between COFs. STAP-seq data: merge of 3 independent biological replicates. b, Hierarchical clustering of P65 and 6 COFs tested in all 3 cell lines based on Pearson’s correlation coefficient (PCC) of CP activation in each cell line. c, Activation of all 72,000 CP candidates by different COFs in the 3 cell lines. For each COF, the CPs are first sorted by activation in S2 cells and then the activation in OSC and Kc167 cells is displayed in the same order. PCCs (right) were calculated by comparing OSC or Kc167 with S2 cells, respectively. d, COF-STAP-seq activation of 50 CPs selected for luciferase assays in S2 cells (see Fig. 1d) by different COFs and P65 in the 3 cell lines (subset of c). Differential activation of CPs by each COF is consistent across all cell lines. e, Pairwise comparison of CP activation by different COFs above GFP (induction) in OSC vs. S2 cells (top row) and Kc167 vs. S2 cells (bottom row) for of all 72,000 CP candidates.
Extended Data Figure 5 |. Cofactors preferentially activate core promoters of their endogenously bound and regulated target genes.
a-e, Binding of Trr18 (a), Lpt19 (b), Mof20 (c) and Trx18 (e) in S2 cells and Chro in Drosophila melanogaster embryos21 (d) to 5,933 CPs active in COF-STAP-seq and endogenously in S2 cells (as in Fig. 1e but for additional COFs). Per COF, CPs are sorted by STAP-seq activation (left) and ChIP-seq coverage is shown in heatmaps and boxplots (-150 to +50bp window around the TSS; n=297 independent CPs per box; box shading: mean STAP-seq tag count; boxes: median and interquartile range; whiskers: 5th and 95th percentiles; P values: one-sided Wilcoxon rank sum test; all ChIP-seq data from previous publications; see Supplementary Table 1 for details and references). For all COFs, the most strongly activated CPs in COF-STAP-seq are significantly more strongly bound by the respective COF in their endogenous genomic context compared to CPs that are activated weakly (note that even though this also holds for Lpt, the trend for Lpt starts only after the most strongly activated CPs (first two bins), which are less strongly bound than expected). f, Expression fold change upon Trx depletion by RNA interference (RNAi) for genes associated with top and bottom 25% of CPs by activation with Trx (RNA-seq data from ref. 18; see also Supplementary Table 1). Only CPs associated with genes active in S2 cells and activated in COF-STAP-seq by at least one COF are included. g, STAP-seq tag count for CPs of genes down-regulated upon Trx depletion by RNAi versus CPs of all other genes expressed in S2 cells and activated by at least one COF (RNA-seq data from ref. 18; n denotes number of independent CPs; boxes: median and interquartile range; whiskers: 5th and 95th percentiles; P values: one-sided Wilcoxon rank sum test).
Extended Data Figure 6 |. Defining and validating core promoter groups activated preferentially by different cofactors.
a, Spike-in normalized COF-STAP-seq tag counts (left heatmap) for 30,936 core promoter (CP) candidates (columns) clustered based on their preferential activation by different cofactors (COFs; rows). These tag counts were transformed for each CP separately into Z-scores (right heatmap) to highlight the differential activation by different COFs independently of the overall activity of the CP. We then used these Z-score-transformed values to cluster the CPs into 5 groups of respectively similar activation profiles across all COFs irrespective of absolute activation levels using k-means clustering (the CPs in both heatmaps are organized identically according to these groups, see coloured bar on top). Line-plot on the left shows the average spike-in normalized COF-STAP-seq tag count across all CPs of each group for each of the 13 COFs and the 2 controls. b, Percent of variance in the data explained by clustering CPs into different number of clusters with k-means (k ranging from 1 to 10). Increasing the number of clusters beyond 5 does not add much to explaining the variance in the data. c, Gain of percent variance explained by increasing the number of clusters in steps of one from 3 to 6. d, Distribution of sum of squared distances to centroids of the clusters for number of clusters ranging from 1 to 10, using a 5-fold cross-validation approach. The data was binned randomly into 5 equally sized bins, one bin was left aside as a test set and clustering was performed on the remaining 4 bins. Sum of squared distances to the nearest centroid for each data point in the test set was then calculated. The procedure was repeated for each number of clusters (k). Increasing the number of clusters beyond 5 does not lead to substantially more coherent or dense clusters. For each box n=30,936 independent CPs. e-g, Clustering of 30,936 CPs (columns) based on their preferential activation by different COFs (rows) as in a, but using data for only one replicate as indicated. k-means clustering (k=5) for each individual replicate reproduces qualitatively the same groups obtained with the merged replicates (see a). h, Agreement between assignment of CPs to groups in individual replicates and in the pooled data (left). In each replicate, around 85% of CPs are assigned to the same group as in the assignment based on pooled replicates. Barplot: Number of replicates that reproduce group assignment for individual CPs is shown on the right. For around 94% of CPs, the group assignment is reproduced in at least two replicates. i, Pairwise distances in CP response to 6 COFs and two controls for CPs belonging to the same (intra-) or different (inter-) clusters (defined in S2 cells) in all 3 Drosophila melanogaster cell lines. n = 115,508,123 and 362,994,457 independent CP pairs for intra and inter-cluster boxes, respectively. * P-value ≤ 0.01; one-sided Wilcoxon rank sum test. j, Induction (activation above GFP) of CPs (5 groups defined in S2 cells; see panel a) by P65 and 6 COFs in S2 (top), OSC (middle) and Kc167 (bottom) cells. Each of the 6 COFs preferentially activates the same CP groups in all 3 cell lines, i.e. COFs’ CP preferences appear to be cell type independent. n = 5723, 11538, 3203, 5038 and 5434 CPs, for Groups 1 to 5 respectively. (d, i and j) boxes: median and interquartile range; whiskers: 5th and 95th percentiles.
Extended Data Figure 7 |. Core-promoter preferences of ten additional cofactors.
a, List of ten additionally tested Drosophila melanogaster cofactors (COF). For each COF, relevant information about its function is shown (functional domain / enzymatic activity / protein complex) and the name of the respective mammalian homolog. b, Total COF-STAP-seq tag counts relative to spike-in for GFP (negative control) and the ten COFs. Bar heights: mean counts; error bars: standard deviation (SD); n=3 independent biological replicates per COF. c, Percent of variance in the data explained by clustering core promoters (CPs) into different number of clusters with k-means (k ranging from 1 to 10) using the original dataset containing 13 COFs, P65 and GFP (as in Extended Data Figure 6b; blue) or the extended dataset with 10 additional COFs (23 total; red). The curves are highly similar for both datasets, i.e. the same number of clusters explains the same amount of variance in both the original and the extended dataset. d, as Extended Data Figure 6a but for extended dataset of 23 COFs: spike-in normalized STAP-seq tag counts (left heatmap) for 30,936 CPs (columns) clustered based on their preferential activation by 23 different COFs and 2 controls (rows). Tag counts were transformed into Z-scores (right heatmap), which were used to cluster CPs into 5 clusters with k-means. For comparison, groups defined on the dataset containing 13 COFs and 2 controls (Extended Data Fig. 6a) are shown in the top row and groups defined with this extended dataset are shown below. e, Correlation between each of the six activating COFs in the extended dataset and the 13 COFs of the original dataset. Pearson’s correlation coefficients ≥ 0.9 are marked by an asterisk.
Extended Data Figure 8 |. Core promoters activated by distinct cofactors discriminate between housekeeping and developmental gene regulation.
a, Expression variability between around 8,000 single cells of a stage 6 Drosophila melanogaster embryo for genes associated with each of the 5 different core promoter (CP) groups (single cell RNA-seq data from ref. 27). b, Gene-ontology (GO) term enrichment analysis (GOStats R/Bioconductor package version 2.34.0) for genes associated with the 5 different CP groups. c, d, Activation of 72,000 CP candidates by a developmental (dev; from the gene zfh1) and a housekeeping (hk; from the gene ssp3) enhancer (enhancers and enhancer-less control obtained from refs 9 and 14). CPs are grouped into 5 groups as in Extended Data Fig. 6a. The enhancer-less control reflects the basal activity of the CPs. Group 3 CPs have the highest basal activity but are further activated by the hk enhancer. n = 5723, 11538, 3203, 5038 and 5434 independent CPs, for Groups 1 to 5 respectively; boxes: median and interquartile range; whiskers: 5th and 95th percentiles. e, f Transcription factor motif enrichment analysis in the sequence 500 bp upstream of the TSS (e) or within the nearest developmental or housekeeping enhancer (from ref. 9; f) for the 5 CP groups. n = 5723, 11538, 3203, 5038 and 5434 independent CPs, for Groups 1 to 5 respectively. NS = not significant (two-sided Fisher’s exact test; P-values corrected for multiple testing by Benjamini-Hochberg procedure; FDR > 0.01).
Extended Data Figure 9 |. Core promoters activated preferentially by distinct cofactors differ in their sequence and in endogenous chromatin features.
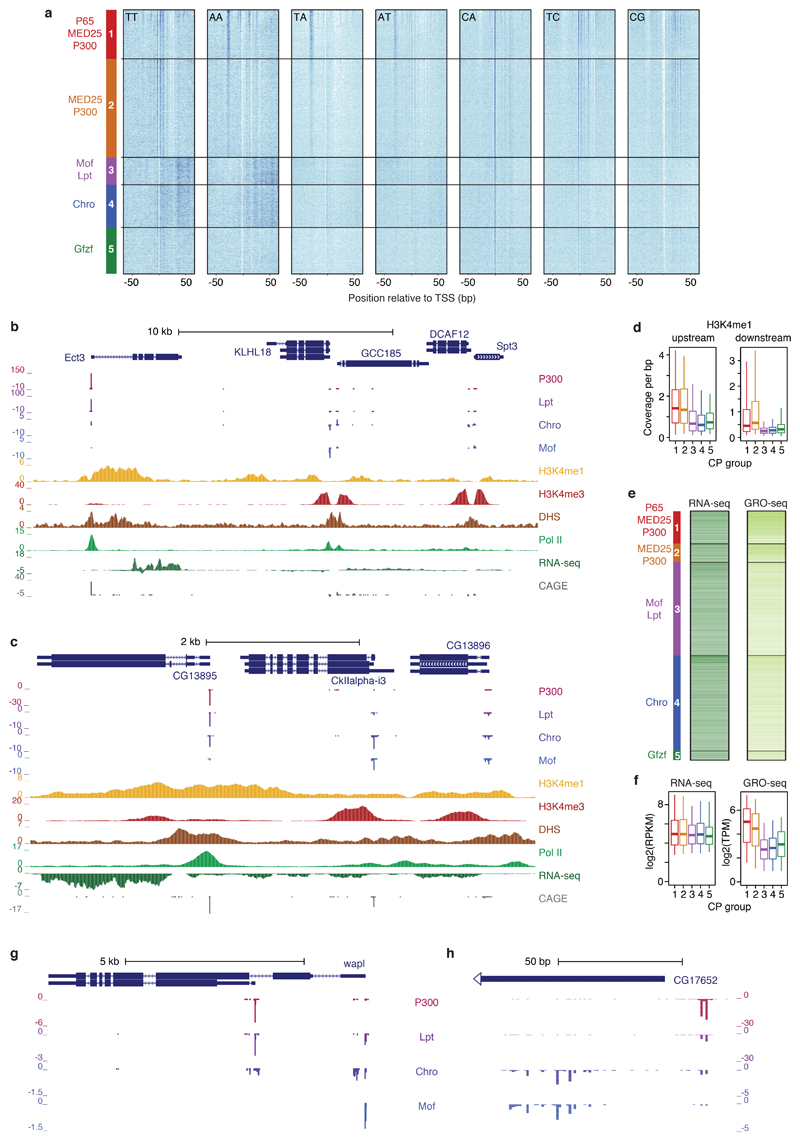
a, Occurrence of specific dinucleotides (see label in each heatmap) relative to TSSs for core promoters (CPs) of the five groups defined in Extended Data Fig. 6a. Within each group, CPs are sorted decreasingly by the COF-STAP-seq tag count of the respective strongest COFs (denoted on the left). Darker shade reflects higher density of the respective dinucleotides at specific positions. b, c, Examples of genomic loci with CPs active in S2 cells that are differentially activated by COFs in STAP-seq. All supporting data tracks are from S2 cells and re-analysed from previous publications (see Supplementary Table 1 for details and references). (b) CPs of KLHL18 and Spt3 (Group 3), and GCC185 and DCAF12 (Group 4), are preferentially activated by Mof and Chro, respectively, and have high levels of H3K4me3 downstream of their TSSs. In contrast, the CP of Ect3 (Group 1) is preferentially activated by P300 and has high levels of H3K4me1 both upstream and downstream of the TSS but almost no H3K4me3, although Ect3 is expressed and the CP is endogenously active in S2 cells. (c) CPs of CkIIalpha-i3 (Group 4) and CG13896 (Group 3) are preferentially activated by Chro and Mof, respectively, and both bear high levels of H3K4me3 and low levels of H3K4me1 downstream of the TSS. In contrast, the CP of CG13895 (Group 1) is preferentially activated by P300 and is marked by higher levels of H3K4me1, but lower levels of H3K4me3, although the gene is expressed in S2 cells. d, Average H3K4me1 ChIP-seq coverage in the 500 bp window upstream (left) and 500 bp window downstream (right) of the TSS for 5 groups of CPs active in S2 cells (as in Fig. 3b). n = 646, 363, 1842, 1885 and 179 CPs, for Groups 1 to 5, respectively. e, Heatmaps showing endogenous expression (as measured by RNA-seq [left] and GRO-seq [right]) of genes associated with CPs active in S2 cells from the 5 CP groups (RNA-seq and GRO-seq data from refs 44 and 45, respectively; see Supplementary Table 1 for details and references). Within each group, CPs are sorted decreasingly by STAP-seq of the respective strongest COFs (denoted on the left). f, Gene expression for genes associated with 5 groups of CPs as in e but shown as box plots. n = 646, 363, 1842, 1885 and 179 CPs, for Groups 1 to 5, respectively. (d and f) boxes: median and interquartile range; whiskers: 5th and 95th percentiles. g, Example of differentially activated alternative promoters, h, Example of differentially activated closely-spaced TSSs (g and h: merge of three independent biological replicates).
Extended Data Figure 10 |. Sequence-encoded cofactor−core-promoter compatibility is conserved in human.
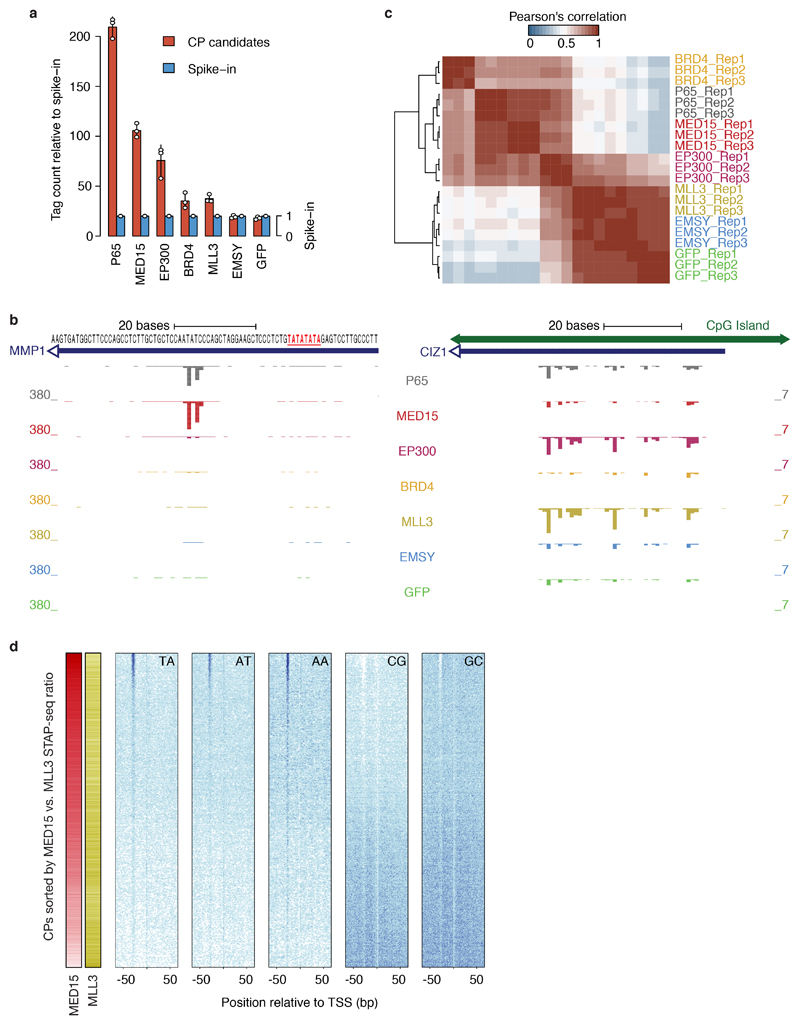
a, Total unique STAP-seq tag counts relative to spike-in for P65, GFP and five human cofactors (COFs) from COF-STAP-seq in human HCT116 cells. Bar heights: mean counts; error bars: standard deviation (SD); n=3 independent biological replicates for each COF). b, COF-STAP-seq signals (transcription initiation) activated by P65, and the five human COFs for the CPs of MMP1 (TATA-box promoter; left) and CIZ1 (CpG-island promoter; right; STAP-seq data: merge of 3 independent biological replicates). c, Hierarchical clustering of independent biological replicates for all tested human COFs based on Pearson’s correlation coefficients (PCCs) across 12,000 human CP candidates. d, Occurrence of different dinucleotides (TA, AT, AA, CG and GC) around TSSs in CPs sorted by the ratio between COF-STAP-seq signals with MED15 and MLL3, for 9,607 CPs activated by either COF.
Supplementary Material
Acknowledgements
The authors thank C. Plaschka, L. Cochella, P.R. Andersen and Life Science Editors (http://lifescienceeditors.com) for comments on the manuscript; J. Wysocka, T. Swigut, and K. Dorighi (Standford University), M. Seimiya and R. Paro (ETH Zürich), and P.R. Andersen and J. Brennecke (IMBA) for kindly sharing MLL3, Trx, and Trf2 cDNAs. Deep sequencing was performed at the Vienna Biocenter Core Facilities GmbH. V.H. is supported by the Human Frontier Science Program (grant no. LT000324/2016-L). Research in the Stark group is supported by the European Research Council (ERC) under the European Union’s Horizon 2020 research and innovation programme (grant agreement no. 647320) and by the Austrian Science Fund (FWF, P29613-B28 and F4303-B09). Basic research at the IMP is supported by Boehringer Ingelheim GmbH and the Austrian Research Promotion Agency (FFG).
Footnotes
Author contributions
V.H., C.D.A. and A.S. conceived the project. C.D.A. and M.P. performed the (COF-) STAP-seq screens, C.D.A. the luciferase experiments, and M.P., M.R. and K.S. cultured cells and performed transfections. V.H. performed the computational analyses. V.H., C.D.A. and A.S. interpreted the data and wrote the manuscript. A.S. supervised the project.
The authors declare no competing financial interests.
Author Information
Reprints and permissions information is available at www.nature.com/reprints.
Code availability
All custom code used for data processing and computational analyses is available from the authors upon request.
Data availability
All raw sequencing and processed data generated in this study have been deposited in the NCBI Gene Expression Omnibus (GEO) under accession number GSE116197 (D. melanogaster data) and GSE126221 (human data). Previously published datasets re-analyzed in this study are available in the GEO repository under the following accession numbers: GSE47691 (RNA-seq), GSE58955 (GRO-seq), GSE40739 (DHS-seq), GSE22119 (MNase-seq), GSE52029 (ChIP-seq for Tbp and Trf2), GSE97841 (ChIP-exo for TAF1 and M1BP), GSE39664 (ChIP-seq for DREF), GSE64464 (ChIP-seq for P300/CBP), GSE30820 (ChIP-seq for Fsh/Brd4), GSE37864 (ChIP-seq for Mof), GSE47263 (ChIP-seq for Chro), GSE41440 (ChIP-seq for Lpt, Pol II, H3K4me1 and H3K4me3), GSE81795 (ChIP-seq for Set1, Trr and Trx; RNA-seq upon Trx depletion), GSE81649 (PRO-seq upon P300/CBP inhibition), GSE43180 (RNA-seq upon Fsh/Brd4 depletion), GSE95025 (single cell RNA-seq of D. melanogaster embryo). S2 cells CAGE and Chro ChIP-seq data are available from modENCODE (http://data.modencode.org/, sample ID: 5331 and 5068, respectively). The full sequences of plasmids used in this study are available at www.addgene.org. No restrictions on data availability apply.
References
- 1.Zabidi MA, Stark A. Regulatory Enhancer−Core- Promoter Communication via Transcription Factors and Cofactors. Trends Genet. 2016;32:801–814. doi: 10.1016/j.tig.2016.10.003. [DOI] [PMC free article] [PubMed] [Google Scholar]
- 2.Ohler U, Liao G-C, Niemann H, Rubin GM. Computational analysis of core promoters in the Drosophila genome. Genome Biol. 2002;3:RESEARCH0087. doi: 10.1186/gb-2002-3-12-research0087. [DOI] [PMC free article] [PubMed] [Google Scholar]
- 3.Rach EA, Yuan H-Y, Majoros WH, Tomancak P, Ohler U. Motif composition, conservation and condition-specificity of single and alternative transcription start sites in the Drosophila genome. Genome Biol. 2009;10:R73. doi: 10.1186/gb-2009-10-7-r73. [DOI] [PMC free article] [PubMed] [Google Scholar]
- 4.Parry TJ, et al. The TCT motif, a key component of an RNA polymerase II transcription system for the translational machinery. Genes Dev. 2010;24:2013–2018. doi: 10.1101/gad.1951110. [DOI] [PMC free article] [PubMed] [Google Scholar]
- 5.Hoskins RA, et al. Genome-wide analysis of promoter architecture in Drosophila melanogaster. Genome Res. 2011;21:182–192. doi: 10.1101/gr.112466.110. [DOI] [PMC free article] [PubMed] [Google Scholar]
- 6.Hsu J-Y, et al. TBP, Mot1, and NC2 establish a regulatory circuit that controls DPE-dependent versus TATA-dependent transcription. Genes Dev. 2008;22:2353–2358. doi: 10.1101/gad.1681808. [DOI] [PMC free article] [PubMed] [Google Scholar]
- 7.Stampfel G, et al. Transcriptional regulators form diverse groups with context-dependent regulatory functions. Nature. 2015;528:147–151. doi: 10.1038/nature15545. [DOI] [PubMed] [Google Scholar]
- 8.van Arensbergen J, van Steensel B, Bussemaker HJ. In search of the determinants of enhancer-promoter interaction specificity. Trends Cell Biol. 2014;24:695–702. doi: 10.1016/j.tcb.2014.07.004. [DOI] [PMC free article] [PubMed] [Google Scholar]
- 9.Zabidi MA, et al. Enhancer-core-promoter specificity separates developmental and housekeeping gene regulation. Nature. 2015;518:556–559. doi: 10.1038/nature13994. [DOI] [PMC free article] [PubMed] [Google Scholar]
- 10.Rach EA, et al. Transcription initiation patterns indicate divergent strategies for gene regulation at the chromatin level. PLoS Genet. 2011;7:e1001274. doi: 10.1371/journal.pgen.1001274. [DOI] [PMC free article] [PubMed] [Google Scholar]
- 11.Pérez-Lluch S, et al. Absence of canonical marks of active chromatin in developmentally regulated genes. Nat Genet. 2015;47:1158–1167. doi: 10.1038/ng.3381. [DOI] [PMC free article] [PubMed] [Google Scholar]
- 12.Boija A, et al. CBP Regulates Recruitment and Release of Promoter-Proximal RNA Polymerase II. Mol Cell. 2017;68:491–503.:e5. doi: 10.1016/j.molcel.2017.09.031. [DOI] [PMC free article] [PubMed] [Google Scholar]
- 13.Haberle V, et al. Two independent transcription initiation codes overlap on vertebrate core promoters. Nature. 2014;507:381–385. doi: 10.1038/nature12974. [DOI] [PMC free article] [PubMed] [Google Scholar]
- 14.Arnold CD, et al. Genome-wide assessment of sequence-intrinsic enhancer responsiveness at single-base-pair resolution. Nat Biotechnol. 2016;35:136–144. doi: 10.1038/nbt.3739. [DOI] [PMC free article] [PubMed] [Google Scholar]
- 15.Chatterjee S, Struhl K. Connecting a promoter-bound protein to TBP bypasses the need for a transcriptional activation domain. Nature. 1995;374:820–822. doi: 10.1038/374820a0. [DOI] [PubMed] [Google Scholar]
- 16.Ptashne M, Gann A. Transcriptional activation by recruitment. Nature. 1997;386:569–577. doi: 10.1038/386569a0. [DOI] [PubMed] [Google Scholar]
- 17.Kockmann T, et al. The BET protein FSH functionally interacts with ASH1 to orchestrate global gene activity in Drosophila. Genome Biol. 2013;14:R18. doi: 10.1186/gb-2013-14-2-r18. [DOI] [PMC free article] [PubMed] [Google Scholar]
- 18.Rickels R, et al. An Evolutionary Conserved Epigenetic Mark of Polycomb Response Elements Implemented by Trx/MLL/COMPASS. Mol Cell. 2016;63:318–328. doi: 10.1016/j.molcel.2016.06.018. [DOI] [PMC free article] [PubMed] [Google Scholar]
- 19.Herz H-M, et al. Enhancer-associated H3K4 monomethylation by Trithorax-related, the Drosophila homolog of mammalian Mll3/Mll4. Genes Dev. 2012;26:2604–2620. doi: 10.1101/gad.201327.112. [DOI] [PMC free article] [PubMed] [Google Scholar]
- 20.Straub T, Zabel A, Gilfillan GD, Feller C, Becker PB. Different chromatin interfaces of the Drosophila dosage compensation complex revealed by high-shear ChIP-seq. Genome Res. 2013;23:473–485. doi: 10.1101/gr.146407.112. [DOI] [PMC free article] [PubMed] [Google Scholar]
- 21.Ho JWK, et al. Comparative analysis of metazoan chromatin organization. Nature. 2014;512:449–452. doi: 10.1038/nature13415. [DOI] [PMC free article] [PubMed] [Google Scholar]
- 22.Hochheimer A, Tjian R. Diversified transcription initiation complexes expand promoter selectivity and tissue-specific gene expression. Genes Dev. 2003;17:1309–1320. doi: 10.1101/gad.1099903. [DOI] [PubMed] [Google Scholar]
- 23.Burke TW, Kadonaga JT. Drosophila TFIID binds to a conserved downstream basal promoter element that is present in many TATA-box-deficient promoters. Genes Dev. 1996;10:711–724. doi: 10.1101/gad.10.6.711. [DOI] [PubMed] [Google Scholar]
- 24.Wang Y-L, et al. TRF2, but not TBP, mediates the transcription of ribosomal protein genes. Genes Dev. 2014;28:1550–1555. doi: 10.1101/gad.245662.114. [DOI] [PMC free article] [PubMed] [Google Scholar]
- 25.Gurudatta BV, Yang J, Van Bortle K, Donlin-Asp PG, Corces VG. Dynamic changes in the genomic localization of DNA replication-related element binding factor during the cell cycle. Cell Cycle. 2013;12:1605–1615. doi: 10.4161/cc.24742. [DOI] [PMC free article] [PubMed] [Google Scholar]
- 26.Baumann DG, Gilmour DS. A sequence-specific core promoter-binding transcription factor recruits TRF2 to coordinately transcribe ribosomal protein genes. Nucleic Acids Res. 2017;45:10481–10491. doi: 10.1093/nar/gkx676. [DOI] [PMC free article] [PubMed] [Google Scholar]
- 27.Karaiskos N, et al. The Drosophila embryo at single-cell transcriptome resolution. Science. 2017;358:194–199. doi: 10.1126/science.aan3235. [DOI] [PubMed] [Google Scholar]
- 28.Gilchrist DA, et al. Pausing of RNA polymerase II disrupts DNA-specified nucleosome organization to enable precise gene regulation. Cell. 2010;143:540–551. doi: 10.1016/j.cell.2010.10.004. [DOI] [PMC free article] [PubMed] [Google Scholar]
- 29.Arnold CD, et al. Genome-wide quantitative enhancer activity maps identified by STARR-seq. Science. 2013;339:1074–1077. doi: 10.1126/science.1232542. [DOI] [PubMed] [Google Scholar]
- 30.Heintzman ND, et al. Distinct and predictive chromatin signatures of transcriptional promoters and enhancers in the human genome. Nat Genet. 2007;39:311–318. doi: 10.1038/ng1966. [DOI] [PubMed] [Google Scholar]
- 31.Herschlag D, Johnson FB. Synergism in transcriptional activation: a kinetic view. Genes Dev. 1993;7:173–179. doi: 10.1101/gad.7.2.173. [DOI] [PubMed] [Google Scholar]
- 32.Adelman K, Lis JT. Promoter-proximal pausing of RNA polymerase II: emerging roles in metazoans. Nat Rev Genet. 2012;13:720–731. doi: 10.1038/nrg3293. [DOI] [PMC free article] [PubMed] [Google Scholar]
- 33.Michel M, Cramer P. Transitions for regulating early transcription. Cell. 2013;153:943–944. doi: 10.1016/j.cell.2013.04.050. [DOI] [PubMed] [Google Scholar]
- 34.Muerdter F, et al. Resolving systematic errors in widely used enhancer activity assays in human cells. Nat Methods. 2018;15:141–149. doi: 10.1038/nmeth.4534. [DOI] [PMC free article] [PubMed] [Google Scholar]
- 35.Arnold CD, et al. Quantitative genome-wide enhancer activity maps for five Drosophila species show functional enhancer conservation and turnover during cis-regulatory evolution. Nat Genet. 2014;46:685–692. doi: 10.1038/ng.3009. [DOI] [PMC free article] [PubMed] [Google Scholar]
- 36.Andersen PR, Tirian L, Vunjak M, Brennecke J. A heterochromatin-dependent transcription machinery drives piRNA expression. Nature. 2017;549:54–59. doi: 10.1038/nature23482. [DOI] [PMC free article] [PubMed] [Google Scholar]
- 37.Brown JB, et al. Diversity and dynamics of the Drosophila transcriptome. Nature. 2014;512:393–399. doi: 10.1038/nature12962. [DOI] [PMC free article] [PubMed] [Google Scholar]
- 38.Batut P, Dobin A, Plessy C, Carninci P, Gingeras TR. High-fidelity promoter profiling reveals widespread alternative promoter usage and transposon-driven developmental gene expression. Genome Res. 2013;23:169–180. doi: 10.1101/gr.139618.112. [DOI] [PMC free article] [PubMed] [Google Scholar]
- 39.Consortium, The FANTOM & DGT, T.R.P.A.C. A promoter-level mammalian expression atlas. Nature. 2014;507:462–470. doi: 10.1038/nature13182. [DOI] [PMC free article] [PubMed] [Google Scholar]
- 40.Andersson R, et al. An atlas of active enhancers across human cell types and tissues. Nature. 2014;507:455–461. doi: 10.1038/nature12787. [DOI] [PMC free article] [PubMed] [Google Scholar]
- 41.Jayaprakash AD, Jabado O, Brown BD, Sachidanandam R. Identification and remediation of biases in the activity of RNA ligases in small-RNA deep sequencing. Nucleic Acids Res. 2011;39:e141. doi: 10.1093/nar/gkr693. [DOI] [PMC free article] [PubMed] [Google Scholar]
- 42.Langmead B, Trapnell C, Pop M, Salzberg SL. Ultrafast and memory-efficient alignment of short DNA sequences to the human genome. Genome Biol. 2009;10:R25. doi: 10.1186/gb-2009-10-3-r25. [DOI] [PMC free article] [PubMed] [Google Scholar]
- 43.Philip P, et al. CBP binding outside of promoters and enhancers in Drosophila melanogaster. Epigenetics Chromatin. 2015;8:48. doi: 10.1186/s13072-015-0042-4. [DOI] [PMC free article] [PubMed] [Google Scholar]
- 44.Shlyueva D, et al. Hormone-responsive enhancer-activity maps reveal predictive motifs, indirect repression, and targeting of closed chromatin. Mol Cell. 2014;54:180–192. doi: 10.1016/j.molcel.2014.02.026. [DOI] [PubMed] [Google Scholar]
- 45.Fuda NJ, et al. GAGA factor maintains nucleosome-free regions and has a role in RNA polymerase II recruitment to promoters. PLoS Genet. 2015;11:e1005108. doi: 10.1371/journal.pgen.1005108. [DOI] [PMC free article] [PubMed] [Google Scholar]
- 46.Trapnell C, Pachter L, Salzberg SL. TopHat: discovering splice junctions with RNA-Seq. Bioinformatics. 2009;25:1105–1111. doi: 10.1093/bioinformatics/btp120. [DOI] [PMC free article] [PubMed] [Google Scholar]
- 47.Anders S, Pyl PT, Huber W. HTSeq--a Python framework to work with high-throughput sequencing data. Bioinformatics. 2015;31:166–169. doi: 10.1093/bioinformatics/btu638. [DOI] [PMC free article] [PubMed] [Google Scholar]
- 48.Love MI, Huber W, Anders S. Moderated estimation of fold change and dispersion for RNA-seq data with DESeq2. Genome Biol. 2014;15:550. doi: 10.1186/s13059-014-0550-8. [DOI] [PMC free article] [PubMed] [Google Scholar]
- 49.FitzGerald PC, Sturgill D, Shyakhtenko A, Oliver B, Vinson C. Comparative genomics of Drosophila and human core promoters. Genome Biol. 2006;7:R53. doi: 10.1186/gb-2006-7-7-r53. [DOI] [PMC free article] [PubMed] [Google Scholar]
- 50.Falcon S, Gentleman R. Using GOstats to test gene lists for GO term association. Bioinformatics. 2007;23:257–258. doi: 10.1093/bioinformatics/btl567. [DOI] [PubMed] [Google Scholar]
- 51.Gentleman RC, et al. Bioconductor: open software development for computational biology and bioinformatics. Genome Biol. 2004;5:R80. doi: 10.1186/gb-2004-5-10-r80. [DOI] [PMC free article] [PubMed] [Google Scholar]
- 52.The R Development Core Team. R: A Language and Environment for Statistical Computing. R Foundation for Statistical Computing; 2013. pp. 1–3079. [Google Scholar]
- 53.Kent WJ, et al. The human genome browser at UCSC. Genome Res. 2002;12:996–1006. doi: 10.1101/gr.229102. [DOI] [PMC free article] [PubMed] [Google Scholar]
- 54.Barberis A, et al. Contact with a component of the polymerase II holoenzyme suffices for gene activation. Cell. 1995;81:359–368. doi: 10.1016/0092-8674(95)90389-5. [DOI] [PubMed] [Google Scholar]
Associated Data
This section collects any data citations, data availability statements, or supplementary materials included in this article.
Supplementary Materials
Data Availability Statement
All custom code used for data processing and computational analyses is available from the authors upon request.
All raw sequencing and processed data generated in this study have been deposited in the NCBI Gene Expression Omnibus (GEO) under accession number GSE116197 (D. melanogaster data) and GSE126221 (human data). Previously published datasets re-analyzed in this study are available in the GEO repository under the following accession numbers: GSE47691 (RNA-seq), GSE58955 (GRO-seq), GSE40739 (DHS-seq), GSE22119 (MNase-seq), GSE52029 (ChIP-seq for Tbp and Trf2), GSE97841 (ChIP-exo for TAF1 and M1BP), GSE39664 (ChIP-seq for DREF), GSE64464 (ChIP-seq for P300/CBP), GSE30820 (ChIP-seq for Fsh/Brd4), GSE37864 (ChIP-seq for Mof), GSE47263 (ChIP-seq for Chro), GSE41440 (ChIP-seq for Lpt, Pol II, H3K4me1 and H3K4me3), GSE81795 (ChIP-seq for Set1, Trr and Trx; RNA-seq upon Trx depletion), GSE81649 (PRO-seq upon P300/CBP inhibition), GSE43180 (RNA-seq upon Fsh/Brd4 depletion), GSE95025 (single cell RNA-seq of D. melanogaster embryo). S2 cells CAGE and Chro ChIP-seq data are available from modENCODE (http://data.modencode.org/, sample ID: 5331 and 5068, respectively). The full sequences of plasmids used in this study are available at www.addgene.org. No restrictions on data availability apply.


