Abstract
Chromosomal instability (CIN) results in the accumulation of large-scale losses, gains, and rearrangements of DNA1. The broad genomic complexity caused by CIN is a hallmark of cancer2, however, there is no systematic framework to measure different types of CIN and their impact on clinical phenotypes pan-cancer. Here, we evaluate the extent, diversity and origin of chromosomal instability across 7,880 tumours representing 33 cancer types. We present a compendium of 17 copy number signatures characterising specific types of CIN, with putative aetiologies supported by multiple independent data sources. The signatures predict drug response and identify new drug targets. Our framework refines the understanding of impaired homologous recombination, one of the most therapeutically targetable types of CIN. Our results illuminate a fundamental structure underlying genomic complexity in human cancers and provide a resource to guide future CIN research.
Chromosomal instability has complex consequences including loss or amplification of driver genes, focal rearrangements, extrachromosomal DNA, micronuclei formation, and activation of innate immune signalling1. This leads to associations with disease stage, metastasis, poor prognosis, and therapeutic resistance3. The causes of CIN are also diverse and include mitotic errors, replication stress, homologous recombination deficiency (HRD), telomere crisis, breakage fusion bridge cycles, and others1,4.
Because of the diversity of these causes and consequences, CIN is generally used as an umbrella term. Measures of CIN either divide tumours into broad categories of high/low CIN5, are restricted to a single aetiology like homologous repair deficiency6, are limited to a particular genomic feature like whole chromosome-arm changes7, or can only be quantified in specific cancer types8,9. As a result, there is no systematic framework to comprehensively characterise the diversity, extent and origins of CIN pan-cancer, or to define how different types of CIN within a tumour relate to clinical phenotypes. Here, we present a robust analysis framework to quantitatively measure different types of CIN across cancer types.
Deconstructing chromosomal instability
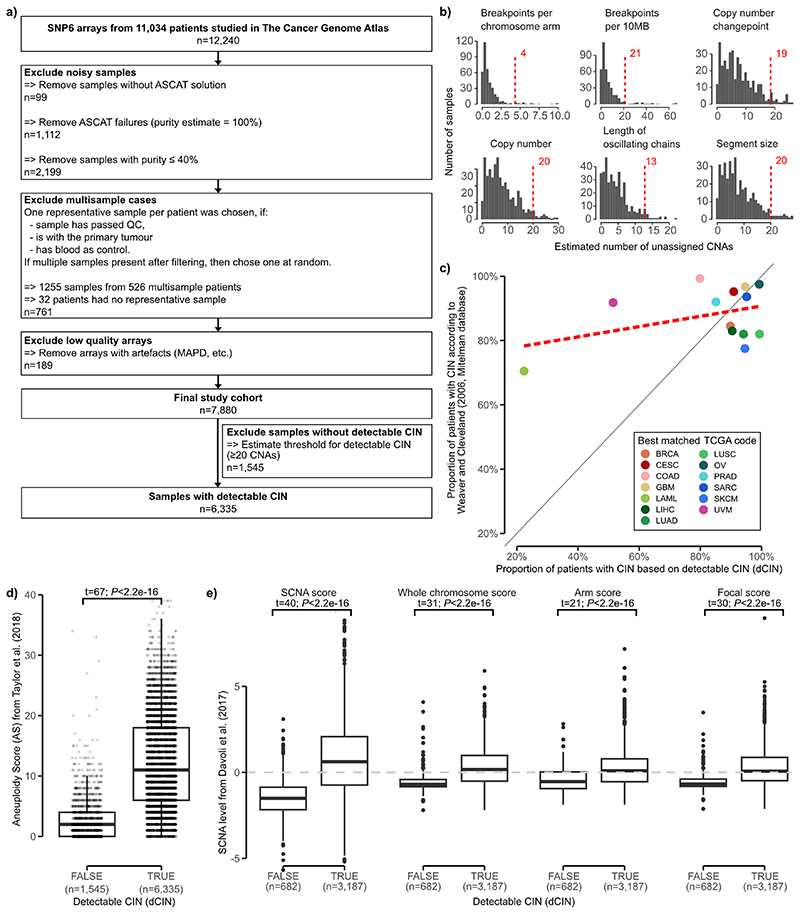
We derived 7,880 high-quality absolute copy number profiles across 33 tumour types using SNP array data from The Cancer Genome Atlas (TCGA) (Extended Data Fig. 1a). Extending our previously developed framework for quantifying signatures of CIN in ovarian cancer8, we determined that 6,335 of the 7,880 samples (80%) had detectable CIN and were suitable for pan-cancer detection of copy number signatures (Extended Data Fig. 1b). This estimate was consistent with previous pan-cancer estimates of CIN10 (Extended Data Fig. 1c-e).
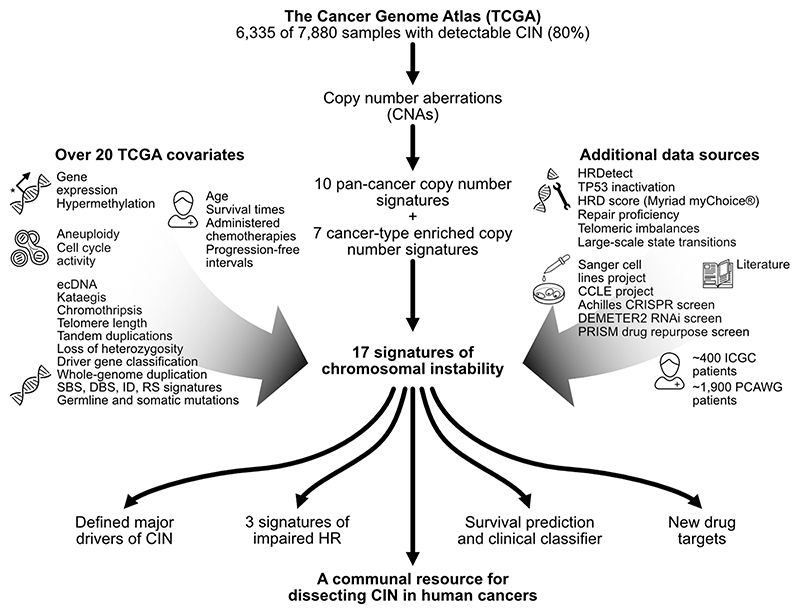
Fig. 1. Study overview.
This schematic summarises our robust analysis framework which uses copy number to derive pan-cancer copy number signatures and provide insights. On the left and right are lists of the datasets used to support the signature aetiologies and insights. HR = homologous recombination.
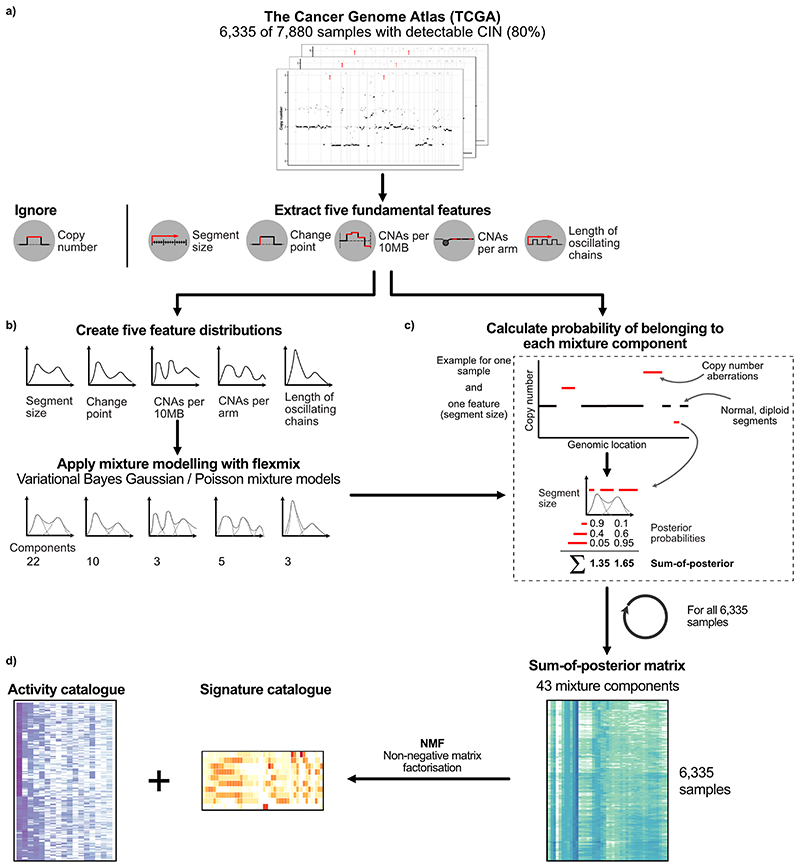
Using these 6,335 genome-wide copy number profiles, we computed distributions of five fundamental copy number features previously demonstrated to encode patterns of copy number changes representing different underlying causes of CIN8 (Extended Data Fig. 2a, Supplementary Methods). These features included: the copy number change between a segment and neighbouring segment; segment length; breakpoint count per 10 megabases; breakpoint count per chromosome arm; and length of chains of oscillating copy number states. Only segments which deviated from a normal, diploid state were considered for the segment size and changepoint features. We did not include a feature representing the copy number of a segment to avoid redundant signatures that encode the same aetiology across different ploidy backgrounds.
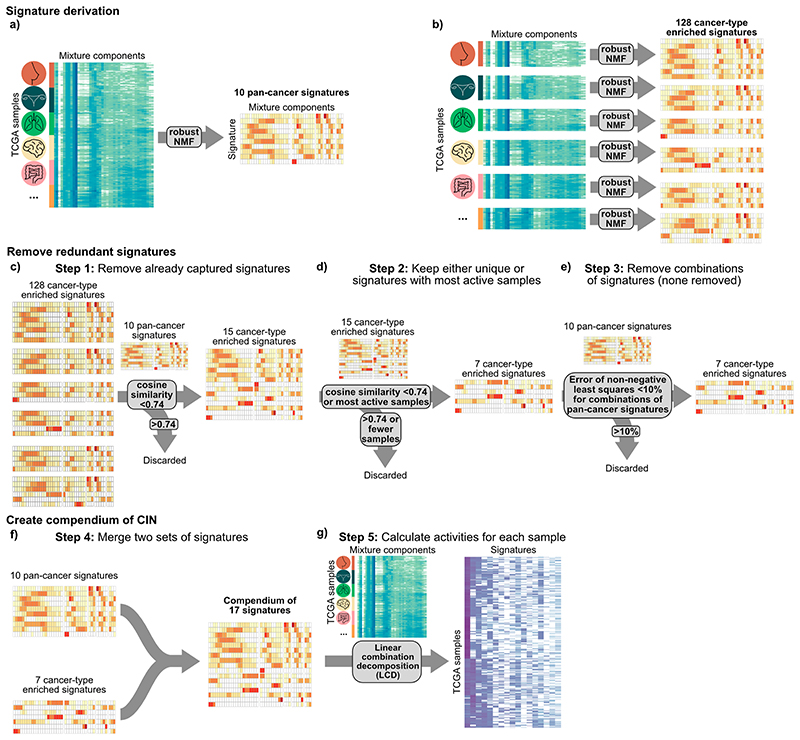
We applied mixture modelling to define distinct components for each cohort-wide feature distribution, identifying a total of 43 mixture components across the 5 features (Extended Data Fig. 2b-c, Supplementary Methods). Conceptually, these components represent the basic building blocks for defining CIN processes. We used these mixture components to encode each tumour genome by probabilistically assigning copy number events to these components, resulting in a 6,335 by 43 dimensional matrix. We then applied a Bayesian implementation of non-negative matrix factorisation to identify copy number signatures (Extended Data Figs. 2d, 3a-b). We first used the complete matrix and found 10 pan-cancer copy number signatures, then used subsets of the matrix representing individual cancer types with at least 100 samples, and found an additional 7 signatures (Extended Data Fig. 3b-e, Supplementary Methods). We merged both sets of signatures and computed their activities using linear combination decomposition to yield a pan-cancer compendium of 17 copy number signatures and their activities in tumours across the 33 cancer types (Extended Data Figs. 3f-g, 4, Supplementary Figs. 1 and 2).
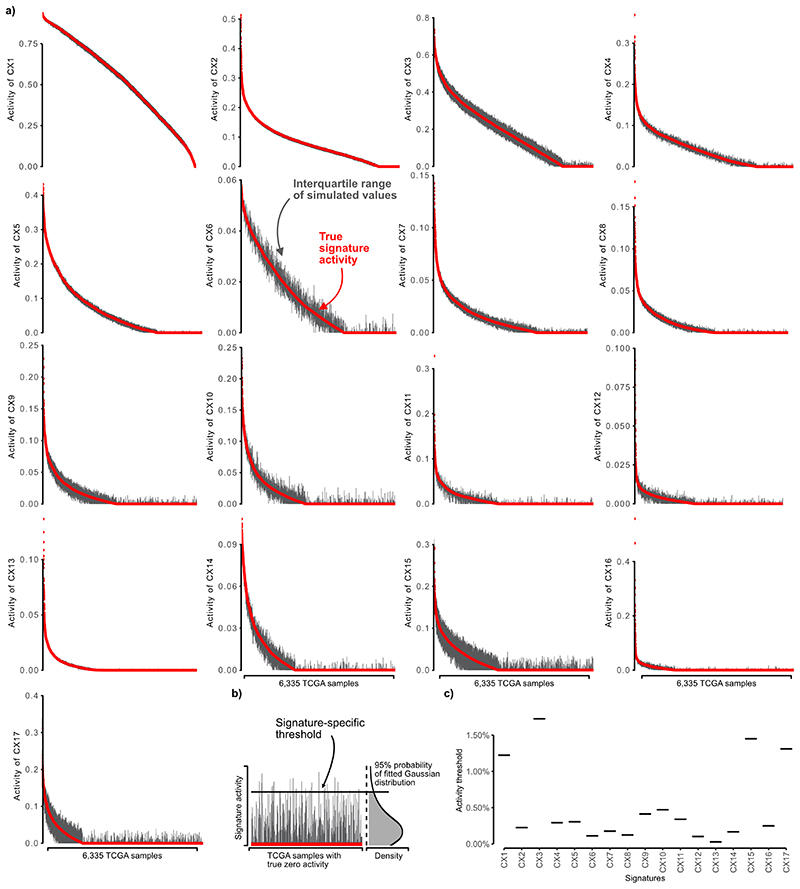
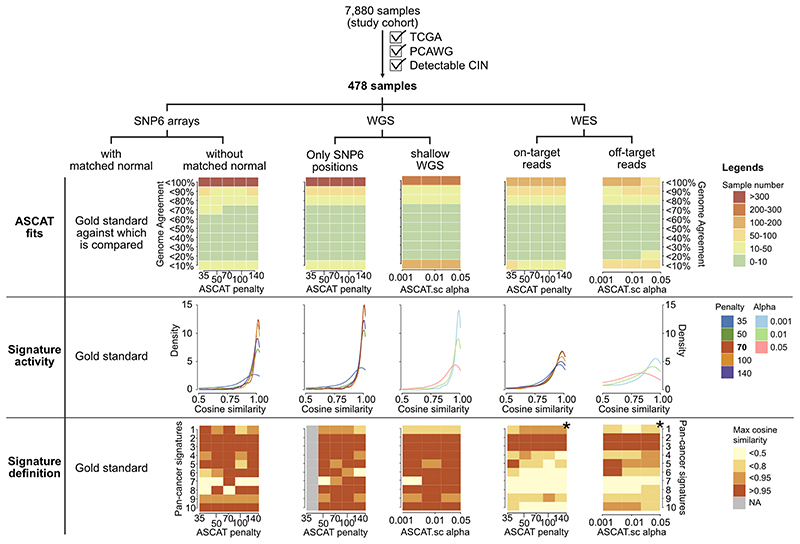
We validated this approach by correctly identifying signatures in a collection of simulated cancer genomes with copy number changes caused by five well-studied mutational processes (Supplementary Figs. 3-6, Supplementary Methods). We used a second simulation study to derive signature-specific activity thresholds, test the stability of signature definitions, and the stability of signature activities (Methods, Extended Data Fig. 5, Supplementary Fig. 7). We then tested the robustness of our approach across different high-throughput technologies comparing signature definitions and activities across five platforms: SNP 6.0 without matched normal, WGS downsampled to SNP 6.0 positions, WGS downsampled to shallow WGS, on-target WES and off-target WES. Signature activity quantification was robust across all platforms. Signature identification was possible across the WGS platforms but performance deteriorated for WES (Extended Data Fig. 6).
Putative causes underlying each signature
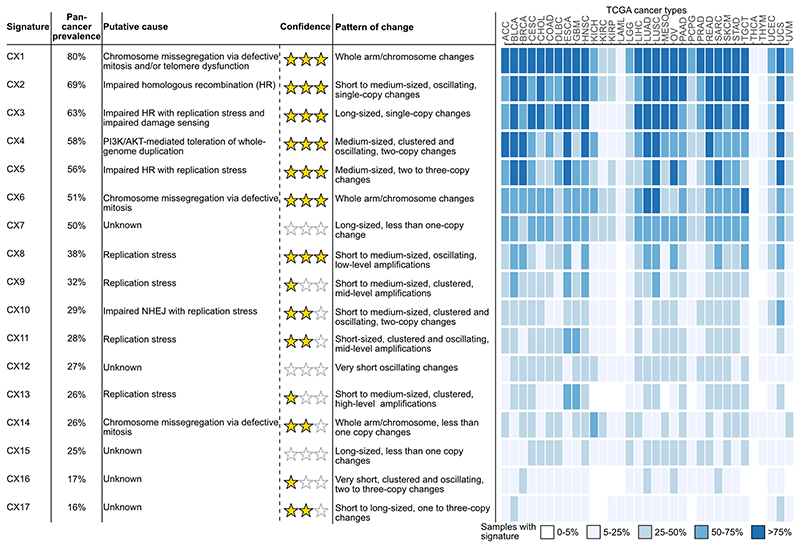
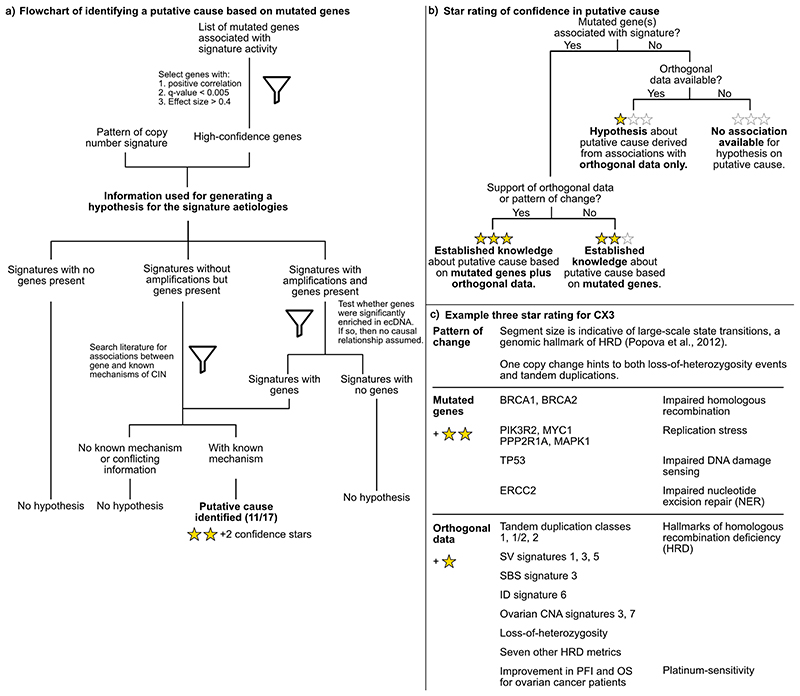
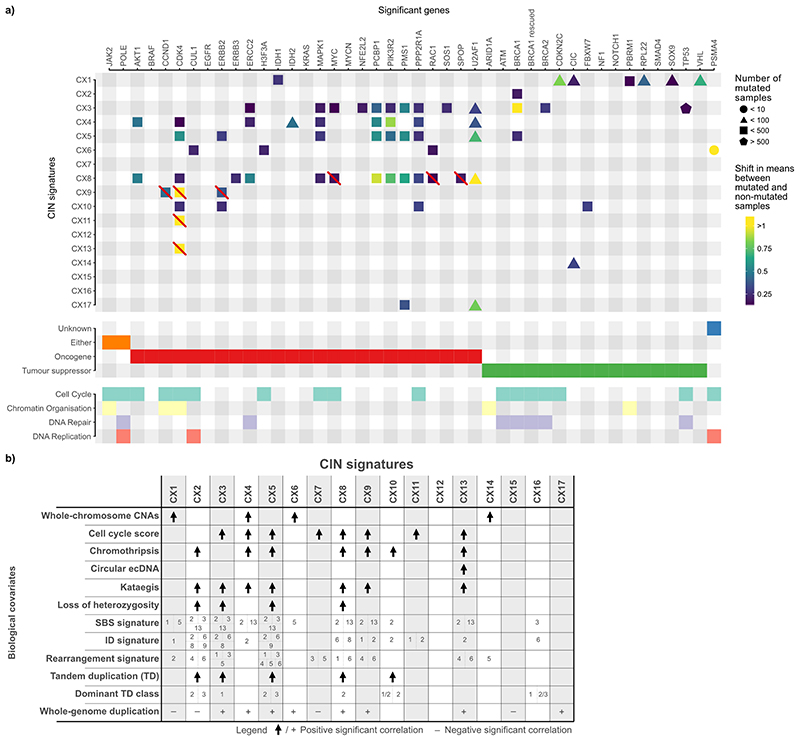
To determine the putative causes underlying each of the 17 signatures (named CX1 to CX17), we developed a data integration framework and assigned a confidence score to each signature aetiology based on the quality and extent of supporting data (Extended Data Fig. 7, Fig. 2). To propose putative aetiologies we used the patterns of copy number change encoded by the signature (Extended Data Fig. 4, Supplementary Figs. 8 and 9, Methods) and signature associations with known cancer driver mutations (Extended Data Fig. 8a, Supplementary Figs. 10-17). We used these driver gene associations as markers for putative pathways involved in the aetiologies and assumed the same pathway deregulation for samples where no driver gene was mutated (similar to how BRCAness is defined in the absence of BRCA1/2 mutation11). In many cases, the signature pattern was already suggestive of a mechanism (e.g. whole chromosome missegregation). Once a putative cause was proposed, we sought additional supporting data (Fig. 1, Extended Data Figs. 8 and 9, Supplementary Methods) including: data from two additional patient cohorts and their clinical metadata (~ 1,900 patients from the Pan-Cancer Analysis of Whole Genomes (PCAWG) project, ~400 patients from the International Cancer Genome Consortium (ICGC) project); 5 types of mutational signatures (single base substitution (SBS), indel, doublet base substitutions (DBS), ovarian copy number, rearrangement); 14 molecular features (somatic point mutations, gene expression, cell cycle score, aneuploidy score, whole-chromosome CNAs, tandem duplications, loss of heterozygosity (LOH), chromothripsis, kataegis, whole-genome duplication status, telomere length and elongation machinery activity, extrachromosomal DNA (ecDNA), centrosome amplification score (CA20)) and 11 DNA repair specific features (germline BRCA1/2 mutations, BRCA1 and RAD51C hypermethylation data, HRDetect response, HRD score (homologous recombination deficiency, Myriad myChoice), TP53 inactivation score, telomeric imbalances score, large-scale state transition score, LOH score, DNA repair proficiency score, protein expression score for 23 DNA-damage repair genes, PCAWG structural variant with associated microhomologies). Here, we provide a synthesis of the data supporting the putative aetiologies (summarised in Fig. 2).
Fig. 2. Proposed aetiologies and prevalence of copy number signatures.
A summary of the pan-cancer frequency, proposed aetiology (where possible), aetiology confidence rating, pattern of copy number change and distribution across cancer types is provided for each signature. Signatures are labelled based on pan-cancer prevalence, with signature CX1 having the highest pan-cancer frequency. Confidence measures for each signature aetiology are indicated by a star rating. The heatmap shows signature frequency for each of the 33 cancer types.
Mitotic signatures
CX1, CX6 and CX14 all encoded patterns related to whole-arm or whole-chromosome changes and significantly correlated with direct counts of whole-chromosome changes (Supplementary Fig. 18). This suggested putative causes resulting in chromosome missegregation during mitosis. In agreement with this hypothesis, CX14 had significantly higher activity in tumours with inactivating mutations in CIC12; CX1 with mutations in CIC12, VHL13 and PBRM114; and CX6 with mutations in CUL115 and RAC116 (Extended Data Fig. 8a). Each of the three signatures correlated with downregulation of telomerase activity (Supplementary Fig. 19b), with CX1 also being negatively correlated with telomere length (Supplementary Fig. 19a) and associated with a lack of TERC and TERT amplification and expression (Supplementary Fig. 19c-e). Therefore, telomere shortening may play a key role in the mechanisms underlying these signatures4. CX1 positively correlated with the “clock-like” SBS1 signature suggesting these errors might also be mediated via a natural ageing process such as age-related telomere attrition4 (Extended Data Fig. 8, Supplementary Fig. 21).
Signatures of impaired HR
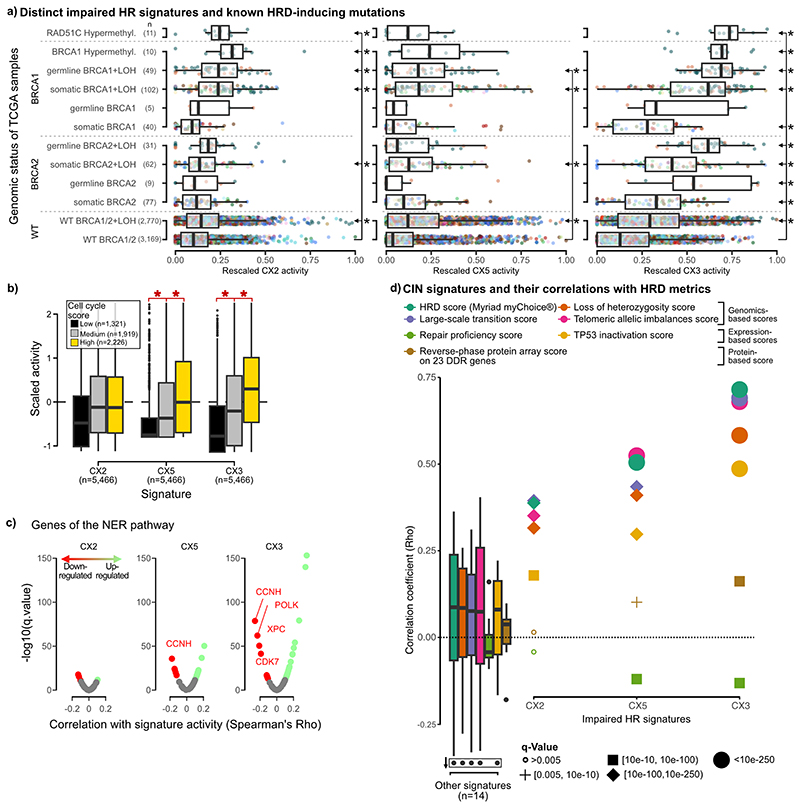
CX2, CX3 and CX5 all exhibited patterns that had previously been shown to associate with imparied HR: CX2 showed a pattern of short to medium-sized, oscillating changes associated with tandem duplications17; CX5 showed medium-sized, events associated with tandem duplication17; and CX3 showed long-sized, single-copy changes with associated loss of heterozygosity18,19 (Extended Data Fig. 4, Supplementary Figs. 18 and 22). All three signatures were observed at significantly higher levels in tumours with somatic BRCA1 mutation, independently of each other (Extended Data Figs. 8a and 9a, Supplementary Table 12). This suggested varying roles for disruption of homologous recombination (HR) as underlying causes11. Several lines of evidence supported the link between these signatures and HR: increased CX2, CX3 and CX5 activity across germline mutated BRCA1 carriers (and BRCA2 carriers for CX3); higher activity in cases with methylated RAD51C (except CX5)20 (Extended Data Fig. 9a); correlation with tandem duplication scores17 (Supplementary Fig. 22), rearrangement signatures 1, 3 and 521 (Supplementary Fig. 23), SBS signature 3 and ID signature 6 (Supplementary Fig. 21), centrosome amplification score22 (Supplementary Fig. 24), ovarian copy number signatures 3 and 78 (Supplementary Fig. 25); association with loss of heterozygosity18, chromothripsis23 (except CX3) and kataegis24 (Supplementary Fig. 18); increased utilisation of theta-mediated end joining (TMEJ) and single strand annealing (SSA) backup repair pathways visible as microhomologies at breakpoints11 (Supplementary Fig. 26); as well as correlation with seven homologous recombination deficiency (HRD) metrics25 (Extended Data Fig. 9d). The strength of these associations increased from CX2 to CX5 and to CX3. This suggested an increasing spectrum of CIN complexity associated with disruptions in HR mediated repair. Indeed, CX2 appears to be only associated with disruption of HR, whereas CX5 and CX3 have associations indicating the involvement of replication stress (via amplification and overexpression of MAPK126, PPP2R1A27 and U2AF128). The larger copy number changes observed for CX5 and CX3 suggest faster cell cycling and breaks carried through to mitosis11, which was supported by strong correlation with cell cycle scores (Extended Data Fig. 9b) and increased CNAs estimated to occur during mitosis (Supplementary Fig. 27, Supplementary Methods). Further associations were observed for CX3, including missense mutations in ERCC229 and downregulation of key NER genes suggesting defects in nucleotide excision repair (NER) (Extended Data Fig. 9c, Supplementary Fig. 28), as well as TP53 mutation suggesting impaired damage sensing30 (Extended Data Fig 8a). These CX3 associations are reminiscent of what has been termed BRCAness or HRD11. However, CX5, and especially CX2, appear to represent a more moderate impairment of HR. Therefore we use the term impaired homologous recombination (IHR) for the aetiology underlying all three signatures rather than HRD.
Whole-genome duplication signature
CX4 encompassed a unique pattern of copy number change with neighbouring segments separated by 2 copy changes (Extended Data Fig. 4), a pattern commonly used to define the presence of a whole-genome duplication (WGD) event31. CX4 was also associated with whole chromosome changes (Supplementary Fig. 18a), a feature commonly observed in tetraploid cells due to increased mitotic errors32. The specific WGD cause (endoreduplication, errors in cytokinesis, or cell fusion33) was not evident from our data, however, this signature had high activity in tumours with PIK3R2, AKT1, and MAPK1 mutations suggesting tolerance to WGD may be mediated by PI3K/AKT activation34,35 (Extended Data Fig. 8a).
Signature of impaired non-homologous end joining
CX10 displayed a pattern of clustered and oscillating copy number changes (Extended Data Fig. 4). Its activity was significantly higher in tumours with inactivating mutations in FBXW7 and correlated with FBXW7 mutant mediated tandem duplication class 1/2 (Extended Data Fig. 8, Supplementary Fig. 22), suggesting impaired non-homologous end joining (NHEJ)17,36 as a putative cause. A significant increase in the proportion of breakpoints with microhomologies in samples with this signature was indicative of a lack of blunt-end joining, a hallmark of NHEJ (Supplementary Fig. 29a).
Signatures of amplification
CX8, CX9, CX11 and CX13 encoded patterns of low-, mid-, mid- and high-level amplifications, respectively (Extended Data Fig. 4). Higher activity of CX8 in the context of amplification and overexpression of U2AF128 and MAPK126, and for CX9 ERBB337 (Extended Data Fig. 8), suggested replication stress as a putative cause. All four signatures were associated with increased cell cycle score (Supplementary Fig. 30) reinforcing replication stress as a causal factor. In addition, CX8, CX9, and CX13 were associated with APOBEC mutagenesis (SBS2 and/or SBS13, Supplementary Fig. 21a) and CX9 and CX11 were associated with ID signatures 1 and 238 (Supplementary Fig. 21). CX9 copy number changes were not part of oscillating chains, however, the remaining amplification signatures were. CX13 was strongly associated with ecDNA circularisation and amplification events (Supplementary Fig. 31), however, the specific mechanism causing the ecDNA was not evident.
Unknown aetiologies
CX7, CX12, CX15, CX16, CX17 did not have patterns of copy number change or associations clearly indicative of a putative cause (Extended Data Figs. 4 and 8a). Therefore, these signatures currently have unknown aetiologies.
Cross-signature observations
Many covariates demonstrated associations with multiple signatures. Chromothripsis was linked with seven different signatures (Extended Data Fig. 8), suggesting many potential aetiologies underpin these complex rearrangements. Replication stress was associated with eight signatures, highlighting it as a major source of CIN (Fig. 2). Different signatures showed a bias for occurrence before WGD (CX1, CX2, CX7, CX15) or after WGD (CX3, CX5, CX6, CX8, CX9, CX13, CX17) demonstrating the importance of WGD events in modulating CIN (Extended Data Fig. 8b, Supplementary Fig. 18e-f). Finally, signatures of APOBEC mutagenesis and kataegis were associated with six signatures, highlighting these as a common feature of CIN39 (Extended Data Fig. 8b, Supplementary Figs. 18 and 21).
Drug response prediction and drug target identification
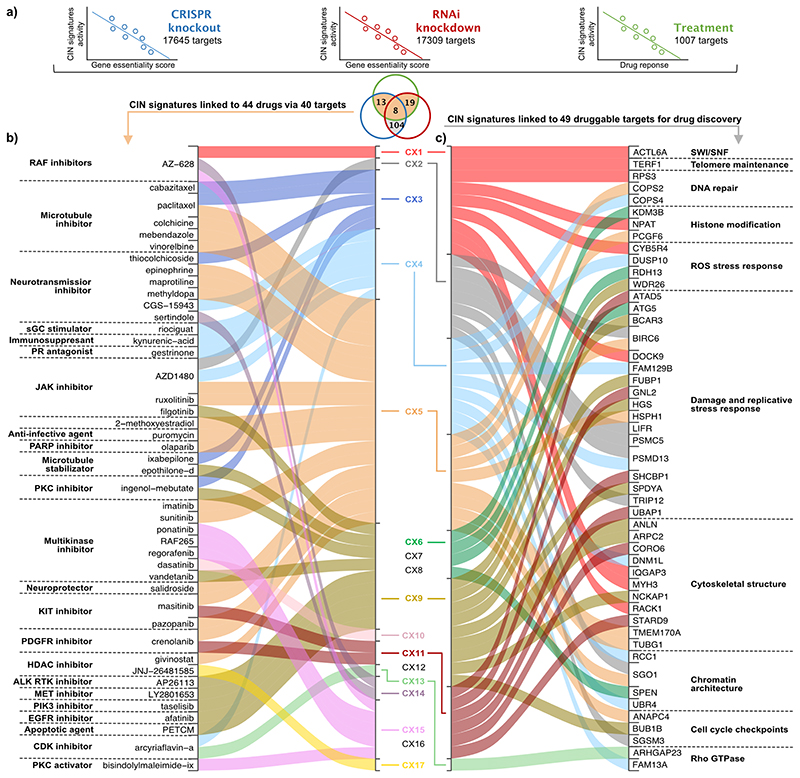
The putative signature aetiologies implicated canonical cancer pathways as some of the major drivers of CIN. Many of these pathways have been the focus of targeted therapy development. Therefore, given that our signatures can be readily measured in patient tumours, we explored their utility for therapy response prediction and drug target identification. We integrated data from 297 cancer cell lines, including copy number profiling, genome-wide clustered regularly interspaced short palindromic repeats (CRISPR/Cas9) knock-out screens, genome-wide RNA interference (RNAi) screens and the Profiling Relative Inhibition Simultaneously in Mixtures (PRISM) drug repurposing screen (Supplementary Methods). We assessed correlations between signature activities, gene essentiality, and sensitivity to drug perturbation of the gene (Fig. 3a).
Fig. 3. Signatures as biomarkers for drug response and discovery of novel drug targets.
a: A schematic showing how response biomarkers and novel drug targets were found by correlating signature activities with gene essentiality determined by CRISPR/Cas9 or RNAi screens, and with response to drug perturbations measured as the area under dose response curve, across 297 cell lines. The Venn diagram shows the overlap of significant correlations for each of the signature/target gene associations. The colour of the circles matches the schematic above, and the shaded areas indicate which results relate to panels a and b. b: A summary of the significant associations between copy number signatures and drug response to 44 therapies. Each signature on the right is linked to a therapy on the left if the signature is predictive of response to CRISPR and/or RNAi perturbation of a target gene, and treatment with a therapy that targets that gene. c: A summary of the significant associations between copy number signatures and target gene perturbation. Each signature on the left is linked to a target gene on the right if the signature is predictive of response to CRISPR and RNAi perturbation of the target gene. The listed targets were filtered for druggability according to their structure or by ligand-base approaches (n=104) and their previous known association with CIN (n=49).
We identified 40 genes where copy number signature activity was significantly correlated with both genetic and drug perturbation of the target (Fig. 3b, Supplementary Table 56). Among these, several revealed promising new therapeutic avenues for targeting CIN. CX4 (associated with PI3K/AKT activation) was correlated with response to inhibition of CCND1 via arcyriaflavin-a, which may indicate a therapeutic strategy for reversing tolerance to WGD40. CX5, a signature of IHR, predicted response to olaparib via PARP1 inhibition. Given that this signature was also correlated with RNAi knockdown of PARP1, this may represent a biomarker specific to the inhibition of regular protein function rather than PARP trapping41. CX9 (associated with replication stress) was correlated with response to multiple kinase inhibitors targeting genes involved in major mitogenic pathways (EGFR, JAK1, MET, PRKCA and PIK3CA), suggesting a multikinase inhibitor approach may be suitable for targeting replication stress. Correlation of CX13 (also associated with replication stress) with response to CDK4 inhibition, may potentially represent a biomarker-led approach for improving CDK4/6 inhibitor mediated tumour sensitisation to immune checkpoint blockade42.
Copy number signature correlations with gene essentiality scores from both CRISPR and RNAi perturbation screens, identified 104 target genes with druggable structures that currently have no targeted therapies in the clinic (Supplementary Table 57). These represent putative synthetic lethal drug targets, 49 of which had evidence of being implicated in CIN-related mechanisms (Fig. 3c). A number of these show promising links between the signature aetiology and potential consequence of target inhibition. CX1 activity was correlated with perturbation of ACTL6A (involved in SWI/SNF complex) and TERF1 (telomere maintenance), both of which are required for faithful chromosome segregation during mitosis4,43. The combined dysregulation of mitosis and telomere elongation machinery associated with CX1 suggests that inhibiting either one of these genes might be a promising therapeutic strategy by creating synthetic lethality. Indeed, inhibition of both genes has been previously suggested to induce cell lethality by generating excessive CIN44. CX9 was correlated with BUB1B perturbation, a spindle assembly checkpoint (SAC) gene recently identified as therapeutically relevant in CIN-high cells measured via WGD status45 and an aneuploidy score7. This association with CX9 suggests that SAC may play a crucial role in tolerating mid-level amplifications, and reducing levels of BUB1B may induce excessive and catastrophic chromosome missegregation46. Finally, CX11, which was strongly associated with CDK4 amplification, was correlated with inhibition of GNL2 which in turn impedes cyclin D1/CDK4 complex formation47.
Predicting platinum sensitivity
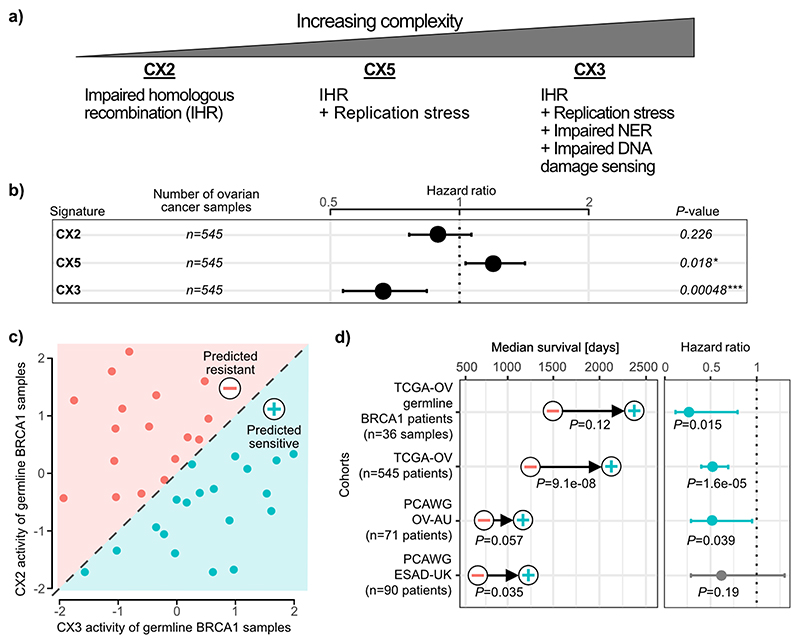
The aetiologies of the 3 impaired HR signatures suggested a model of increasing CIN complexity (Fig. 4a, Extended Data Fig. 9). IHR alone gives rise to CX2, a signature of small copy number changes indicative of tandem duplication. IHR plus replication stress leads to CX5, involving larger CNAs. Finally, IHR plus replication stress, impaired damage sensing and impaired NER, gives rise to CX3 with the largest CNAs that are strongly associated with LOH. Our results did not reveal if the different levels of complexity developed in a stepwise manner or by independent processes.
Fig. 4. Predicting platinum sensitivity using impaired homologous recombination signatures.
a: A proposed model of increasing CIN complexity for impaired homologous recombination (IHR) signatures based on the signature aetiologies. b: Results for each IHR signature after training a Cox proportional hazards model to predict overall survival across 545 ovarian cancers treated with platinum-based chemotherapy. Hazard ratios, their 95% confidence interval and Wald test significance are reported. c: A schematic of the clinical classifier built on CX3 and CX2 activities of ovarian samples with germline BRCA1 mutations. d: Results of survival analyses after applying the classifier from (c) to assign patients into predicted sensitive (plus symbol) or predicted resistant (minus symbol) groups. Each row displays results for each of the four cancer cohorts from the TCGA and PCAWG projects. Differences in median survival are indicated by the arrow, with p-values from a log-rank test appearing below (Kaplan-Meier survival analysis). Hazard ratios and their 95% confidence interval of the predicted sensitive group compared to the predicted resistant group are obtained from Cox proportional hazards models correcting for stage and age of patients. P-value represents the corresponding Wald test.
Disruption of both HR11 and NER48 have been shown to confer sensitivity to platinum-based chemotherapy. Given only CX3 was associated with disruption of NER, we hypothesised the IHR signatures may demonstrate differing abilities to predict platinum sensitivity. As ovarian cancer patients are routinely treated with platinum-based chemotherapy, we tested the ability of all three signatures to predict overall survival, and hence platinum sensitivity, using a Cox proportional hazards model (Fig. 4b, Supplementary Fig. 32). CX2 showed no association with platinum sensitivity, CX5 was predictive of resistance and CX3 predictive of sensitivity.
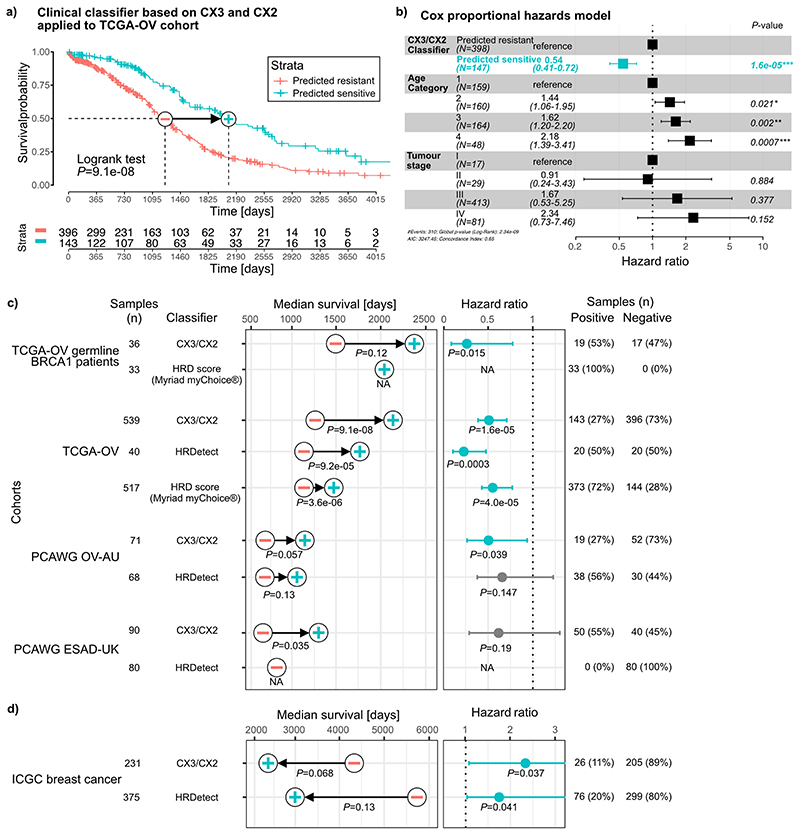
Given these IHR signatures were able to dissect platinum response, we further hypothesised that they could be used in combination to provide better predictors of platinum sensitivity. As CX2 was not predictive, we used it as a baseline for capturing non-predictive IHR-related genomic changes, and required the predictive CX3 activity exceed it in order to potentially confer sensitivity. This resulted in a simple classification rule: “if CX3 activity is greater than CX2 activity, then predict sensitivity” (Fig. 4c). This interpretable classifier was able to distinguish significant overall survival separation across cohorts of BRCA1 germline mutant ovarian cancers; ovarian cancers from the TCGA cohort; an independent validation cohort; and an oesophageal cancer cohort (also routinely treated with platinum-based chemotherapy) (Fig. 4d, Extended Data Fig. 10, Supplementary Figs. 33-36). Other classifiers using all three IHR signatures, including more complex machine learning methods, did not outperform this decision rule (Supplementary Fig. 37). Furthermore, this simple classifier had comparable performance to more complex state-of-the-art HRD predictors, which rely on additional data beyond copy number, applied to cohorts of ovarian, oesophageal and breast cancers (Extended Data Fig. 10c-d). By applying this classifier to the whole TCGA ovarian cohort, we estimate that 27% of ovarian tumours might be platinum sensitive. Applying the classifier pan-cancer, we estimate that 8% of all tumours might be sensitive.
Discussion
Here, we present a robust analysis framework for chromosomal instability in human cancers built on a pan-cancer analysis across 33 cancer types. This resource advances the field in two ways: it untangles CIN according to characteristic genomic patterns and underlying causes, and defines copy number signatures as new biomarkers to quantitatively measure different types of CIN. Our approach complements previous landscape studies of the genetic consequences of CIN49, which generally focused on recurrent somatic copy number events at individual loci. In contrast, copy number signatures8,9 uncover mechanistic biases in the patterns of alterations across all chromosomes.
In its current form, the signature methodology cannot account for selection pressures on CNAs. For SNV signatures, passenger mutations provide strong signals for detection. However, for CNAs the distinction between driver and passenger mutations is less clear. For example, large homozygous deletions are likely to be subject to strong negative selection, whereas other CNAs can be subject to strong positive selection. This has implications for the ability to detect signatures of CIN. Those processes that generate CNAs under positive selection will be easier to detect than those that generate CNAs under negative selection. Quantitatively, the relationship between signature detection and selection is not yet well understood and will depend on genomic background. For example, negative selection will be weaker in whole-genome duplicated samples (~50% of tumours) and in tumours which have lost their ability to sense DNA damage (e.g. via TP53 mutation).
To maximise sample size, we used SNP 6.0 technology data from the TCGA collection. This technology is well established for copy number analysis, but has lower resolution than whole-genome sequencing. As further WGS data becomes available there will be an opportunity to refine our signatures and increase their resolution. In their current form, we have demonstrated that the signatures are widely applicable across technologies, including inexpensive assays like shallow WGS that can be easily applied in a clinical setting to formalin-fixed tumour material50.
However, it is important to note that the bulk-DNA samples we analysed do not show dynamics of CIN and future work is needed to extend our approach to multiple samples or single cells from the same patient to show how patterns of CIN change over time. Further work is also required to quantify copy number signature activity at specific genomic loci, as currently our method only supports signature quantification at a whole-genome level.
The 17 copy number signatures and their putative aetiologies provide a valuable resource for furthering our understanding of CIN. For example, CX1 represents the most prevalent type of CIN across tumours: chromosome missegregation. CX1 aetiology analysis pointed at multiple different mitotic defects giving rise to this signature. This suggests that, despite diversity in the potential causes of mitotic defects, these all result in the same change in genome structure1. These missegregation events typically result in large copy number changes, potentially disrupting the function of many genes, however, our signature analysis reveals that these changes only represent, on average, 4% of the total number of copy number changes observed in a tumour (Supplementary Fig. 38). In contrast, CX2 accounts for 23% of the copy number changes observed in a tumour. This highlights the power of our compendium of signatures to quantify and disentangle the causes, and functional impact that different types of CIN have on tumour genomes. Our results also highlight the potential of our signatures to improve the treatment of patients with extreme CIN tumours. Platinum-based chemotherapy is currently considered a broad-spectrum cytotoxic chemotherapy and is routinely used to treat cancers with extreme CIN. However, here we showed that platinum response can be robustly dissected using different signatures of IHR. By developing the IHR signatures into a companion diagnostic assay, platinum-based therapies could potentially be administered in a more targeted manner, allowing resistant patients to avoid their toxic side effects, and healthcare systems to reduce the cost burden of ineffectual treatment. Similarly for other signatures, our analysis of drug response across cell lines reinforces their potential to be developed into companion diagnostics for improved patient stratification during clinical trials.
The signature compendium presented here is an important resource to guide future studies into a deeper understanding of the origins and diversity of CIN and how to therapeutically target different CIN types.
Extended Data
Extended Data Fig. 1. Workflow of sample filtering and detectable chromosomal instability (dCIN).
a: REMARK diagram showing flow of samples through the study. b: For each copy number feature of the previous ovarian signatures: a histogram of number of events per sample that could not be assigned to an ovarian copy number signature on the TCGA ovarian cohort. Red dotted line indicates the quantile 0.95. c: Scatterplot of cancer types comparing our estimate of detectable CIN (Supplementary Methods) to estimates reported in the Mitelman database. d+e: Boxplots comparing our estimate of detectable CIN with aneuploidy score and four CNA-specific metrics. Boxes represent the interquartile range (IQR) with the median as a bolded line. The whiskers extend to the largest/smallest value no further than 1.5 * IQR from the hinge. Outliers beyond the end of the whiskers are marked individually as points. Results of two-sided Welch’s t-test shown on top of the boxplots.
Extended Data Fig. 2. Overview of copy number features and signature identification.
a: A schematic showing the 5 fundamental copy number features that were computed using 6,335 samples with detectable CIN (dCIN). Note, a feature capturing absolute copy number is not included in our method. b: A schematic showing how mixture modelling is used to split the genome-wide feature distributions into smaller components by either Variational Bayes Gaussian mixture models or Finite Poisson mixture models. The actual number of resulting components is listed below each feature distribution. These components represent basic building blocks of each feature distribution. c: An example of how the probability of a CNA belonging to a mixture component (posterior probability) is calculated and how these are summed. d: (Right) The resulting 43-dimensional feature vectors for each sample, after all posterior probabilities are summed for each component. (Left) A schematic of how the sum-of-posterior matrix for all 6,335 samples was split in two matrices by a Bayesian implementation of the non-negative matrix factorisation (NMF), resulting in a signature catalogue and an activity catalogue.
Extended Data Fig. 3. Schematic of the signature compendium identification.
a: From the complete input matrix 10 pan-cancer signatures were identified. b: For the 20 cancer types with over 100 samples each, 128 cancer-type enriched signatures (CTES) were identified. c: All CTES were removed that had a cosine similarity over 0.74 with any pan-cancer signature. d: From the groups of CTES that had cosine similarities over 0.74 to each other, the signature with activities in the largest number of samples was taken as a representative signature. e: We performed non-negative least squares on each pair of pan-cancer specific signatures to each CTES. For any combination which showed a reconstruction error below 0.1, this CTES was removed. f: The sets of 10 pan-cancer and 7 CTES were joined to a compendium of 17 signatures. g: Using linear combination decomposition, the signature activities were calculated for the 6,335 TCGA samples.
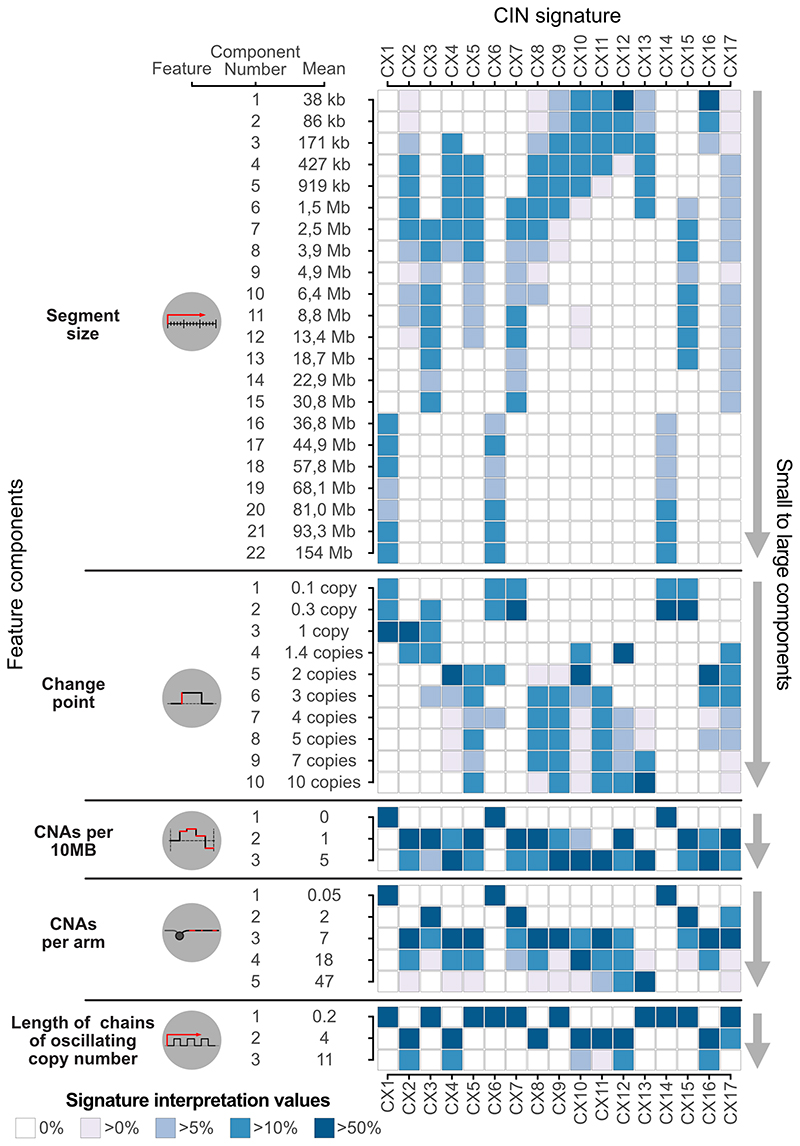
Extended Data Fig. 4. Signature interpretation matrix.
Displayed on the left are the five features, their mixture components and component means. The heatmap on the right shows the signature interpretation values, which combine information from the sum-of-posterior matrix, signature activity matrix and the signature definition matrix (Supplementary Methods). Only components that are positively correlated with signature activity levels are displayed. Interpretation values are normalised per feature and signature.
Extended Data Fig. 5. Monte Carlo simulation results for determining signature-specific noise thresholds.
a: Each plot (1 per signature) shows the interquartile range of sample signature activities after the introduction of noise in the copy number features using a Monte Carlo simulation. Samples are ordered by their observed signature activity (red line). b: Schematic showing how we fitted a Gaussian distribution to the simulated values of all samples with an observed signature activity of 0 (red line). The horizontal black line represents the quantile 0.95 of the fitted Gaussian and forms the basis of our signature specific noise threshold, where values below this line are not distinguishable from 0. c: Plot of the signature-specific thresholds for the 17 copy number signatures.
Extended Data Fig. 6. Signature stability across different copy number profiling technologies.
Across the same set of 478 tumours, we compared the SNP6-array based copy number profiles and signatures to copy number profiles and signatures derived using different copy number profiling technologies. The columns contain results for the different technologies and the rows contain results for comparison between copy number profiles (top), signature activities (middle) and signature definitions (bottom, limited to pan-cancer signatures). For each comparison we show results for a range of penalties for ASCAT’s piecewise constant fitting or ASCAT.sc’s circular binary segmentation. (*): For settings marked with a star it was not possible to derive solutions for K=10, instead the optimal number of K was chosen (lower than K=10).
Extended Data Fig. 7. Workflow for determining signature aetiology and confidence rating.
a: Flowchart showing how an association between a mutated gene and signature activity was used to derive a hypothesis for a putative aetiology. b: Flowchart representing the decision making process leading to the assignment of a 3-star rating confidence score. c: Example of the star rating process for CX3.
Extended Data Fig. 8. Summary of associations between signatures and other covariates.
a: Main panel shows significant associations between copy number signatures and mutated genes. Gene annotations summarised in the panels below. Boxes with a red line indicate significant associations that were not considered when determining signature aetiologies as the significant enrichment was via amplification of the gene, which also resided in an ecDNA amplicon, which could be a consequence of the signature rather than a cause, potentially causing a spurious correlation with amplification signatures (CX8, CX9, CX11, CX13). b: Each row shows highly significant associations between signatures and different covariates. Unless otherwise specified, only positive correlations are shown.
Extended Data Fig. 9. Impaired homologous recombination signatures and their associations.
a: Boxplots summarise signature activities of different patient groups (rows) defined by their driver gene mutation status. Ovarian samples are coloured in dark green and breast in orange. Boxes represent the interquartile range (IQR) with the median as a bolded line. The whiskers extend to the largest/smallest value no further than 1.5 * IQR from the hinge. Outliers beyond the end of the whiskers are marked individually as points. Significance tested with two-sided Welch’s t-test between WT BRCA1/2 and each of the categories and corrected for multiple testing by using Benjamini-Hochberg method. Statistically significant comparisons are shown to the right of the boxplots with stars denoting significance (q<0.05) and arrows denoting the two groups used for the statistical test. (BRCA1/2 = BRCA1 and BRCA2, WT = wild type; LOH = loss of heterozygosity) b: Boxplots (with same characteristics as in a) summarise the scaled signature activities of 5,466 TCGA samples split by low, medium and high cell cycle scores. The brackets and stars (q<0.05) show where there was a significant increase from low to medium to high cell cycle groups tested with a Welch’s t-test and corrected for multiple testing with Benjamini-Hochberg method. c: Volcano plots showing the results of a correlation between signature activity and expression of genes involved in nucleotide excision repair (NER). Each dot represents a gene, coloured dots show significant correlations. d: Spearman correlation coefficient (y-axis) of correlation between signature activities and seven common metrics of HRD (listed at top). Individual coefficients are displayed for impaired homologous recombination (IHR) signatures and the distribution of coefficients from remaining signatures are represented by boxplots (with same characteristics as in a).
Extended Data Fig. 10. Performance of classifiers for predicting platinum sensitivity.
a: Kaplan-Meier estimator showing the overall survival probabilities of TCGA ovarian cancer patients split into two groups using our CX3/CX2 classifier. b: Hazard ratios and their 95% confidence interval obtained from a Cox proportional hazards model trained on our CX3/CX2 classification predicting overall survival of TCGA ovarian cancer patients. The model also corrected for age and cancer stage of the patients. P-value represents the significance of a Wald test. c+d: Median survival and hazard ratios generated for five cancer cohorts from the TCGA, PCAWG and ICGC projects using predictions from three classifiers (our CX3/CX2 classifier, HRDetect and Myriad myChoice based on the HRD score). Improvements in median survival tested by log-rank test (Kaplan-Meier survival analysis), with the minus symbol representing the predicted resistant group and the plus symbol the predicted sensitive group. Hazard ratios, their 95% confidence interval, and Wald test significance of the predicted sensitive group compared to the predicted resistant group are obtained from Cox proportional hazards models correcting for stage and age of patients, except for HRDetect where tumour stage was omitted as the models did not converge if included. The number and proportion of patients predicted to be sensitive (with HRD) and resistant (without HRD) by each classifier are listed on the right.
Supplementary Material
Acknowledgements
We thank Matthew Eldridge for setting up the online resource and Adam Berman for bug fixes. R.M.D., P.S.S., D.L.C. and F.M. are funded by Cancer Research UK (core grants C14303/A17197, A19274) and the Cambridge Cancer Centre (grant C9685/A25117). G.M. and B.H. are hosted by the Centro Nacional de Investigaciones Oncológicas (CNIO), which is supported by the Instituto de Salud Carlos III and recognised as a “Severo Ochoa” Centre of Excellence (ref. CEX2019-000891-S) by the Spanish Ministry of Science and Innovation (MCIN/AEI/ 10.13039/501100011033). G.M. and B.H. were also supported by a Spanish Ministry of Science and Innovation grant PID2019-111356RA-I00 (MCIN/AEI/ 10.13039/501100011033). M.T. was supported as a postdoctoral researcher of the F.R.S.-FNRS. LMG was supported by the Wellcome Trust PhD programme in Mathematical Genomics and Medicine (grant number RG92770). M.P.S. was supported by the Horizon 2020 (H2020) Integrated Training Network CONTRA (grant 766030-CONTRA-H2020-MSCA-ITN-2017). J.D.B. is funded by Cancer Research UK (core grant A22905). This work was supported by the Francis Crick Institute, which receives its core funding from Cancer Research UK (FC001202), the UK Medical Research Council (FC001202), and the Wellcome Trust (FC001202). P.V.L. is a Winton Group Leader in recognition of the Winton Charitable Foundation’s support towards the establishment of The Francis Crick Institute.
Footnotes
Author contributions
G.M. and F.M. contributed equally to this work. R.M.D., G.M. and F.M. conceived and designed the study. R.M.D., B.H., D.L.C., M.P.S. and G.M. developed the methodology of the study. R.M.D., B.H., M.T., K.H., T.L., P.S.S., L.M.G., L.Y.L., M.P.S. and G.M. developed software for the study. R.M.D., M.T., K.H., T.L., P.S.S., D.L.C. and G.M. contributed to the validation of the method and results. R.M.D., B.H., L.M.G., D.L.C., L.Y.L. and G.M. contributed to the formal analysis presented in this study. R.M.D., B.H., K.H., T.L., P.S.S., L.M.G., and P.V.L. provided access to data and contributed to gathering, processing and curating data. R.M.D., J.D.B., P.V.L., G.M. and F.M. wrote the original draft. R.M.D., B.H., G.M. and F.M. produced and contributed to the visualisations of the study. R.M.D., G.M. and F.M. supervised the project. All authors had access to all the data in the study. All authors contributed to the review and the editing of the manuscript. All authors approved the manuscript prior to the initial submission and all other resubmissions.
Competing interests
J.D.B., G.M., F.M. are co-founders of Tailor Bio Ltd. R.M.D., B.H., G.M., F.M. applied for a patent based on the work presented in this paper (GB2114203.9). G.M., F.M. and J.D.B hold a patent on using copy number signatures to predict response to doxorubicin treatment in ovarian cancer (PCT/EP2021/065058).
Data availability
All data used in this study were obtained from publicly available sources and are described in detail in Supplementary Table 1, section "Data and Code" in the Supplementary Methods. Some raw data have restricted access (TCGA dbGaP Accession number: phs000178.v11.p8; ICGC EGA Accession number: EGAS00001001692). Access can be obtained by applying to the relevant Data Access Committees (TCGA; ICGC). The authors declare that all other data supporting the findings of this study, including the source data for all figures, are publicly available without restrictions and also available in the Supplementary Information and the Github repositories. All data supporting the analysis of our copy number signatures are navigable via our web portal (https://markowetz.cruk.cam.ac.uk/cincompendium/).
Code availability
The code is publicly accessible via our hub repository https://github.com/markowetzlab/Drews2022, which describes how the CIN signatures were derived and how to reproduce the figures and tables in this publication. The repository also contains the publicly accessible data and intermediary results used and produced in this study. The hub repository links to other repositories containing the code for specialised tasks.
References
- 1.Bakhoum SF, Cantley LC. The Multifaceted Role of Chromosomal Instability in Cancer and Its Microenvironment. Cell. 2018;174:1347–1360. doi: 10.1016/j.cell.2018.08.027. [DOI] [PMC free article] [PubMed] [Google Scholar]
- 2.Hanahan D, Weinberg RA. Hallmarks of Cancer: The Next Generation. Cell. 2011;144:646–674. doi: 10.1016/j.cell.2011.02.013. [DOI] [PubMed] [Google Scholar]
- 3.Tijhuis AE, Johnson SC, McClelland SE. The emerging links between chromosomal instability (CIN), metastasis, inflammation and tumour immunity. Mol Cytogenet. 2019;12:17. doi: 10.1186/s13039-019-0429-1. [DOI] [PMC free article] [PubMed] [Google Scholar]
- 4.Chakravarti D, LaBella KA, DePinho RA. Telomeres: history, health, and hallmarks of aging. Cell. 2021;184:306–322. doi: 10.1016/j.cell.2020.12.028. [DOI] [PMC free article] [PubMed] [Google Scholar]
- 5.Bakhoum SF, et al. Chromosomal instability drives metastasis through a cytosolic DNA response. Nature. 2018;553:467–472. doi: 10.1038/nature25432. [DOI] [PMC free article] [PubMed] [Google Scholar]
- 6.Davies H, et al. HRDetect is a predictor of BRCA1 and BRCA2 deficiency based on mutational signatures. Nat Med. 2017;23:517–525. doi: 10.1038/nm.4292. [DOI] [PMC free article] [PubMed] [Google Scholar]
- 7.Cohen-Sharir Y, et al. Aneuploidy renders cancer cells vulnerable to mitotic checkpoint inhibition. Nature. 2021;590:486–491. doi: 10.1038/s41586-020-03114-6. [DOI] [PMC free article] [PubMed] [Google Scholar]
- 8.Macintyre G, et al. Copy number signatures and mutational processes in ovarian carcinoma. Nat Genet. 2018 doi: 10.1038/s41588-018-0179-8. [DOI] [PMC free article] [PubMed] [Google Scholar]
- 9.Steele CD, et al. Undifferentiated Sarcomas Develop through Distinct Evolutionary Pathways. Cancer Cell. 2019;35:441–456.:e8. doi: 10.1016/j.ccell.2019.02.002. [DOI] [PMC free article] [PubMed] [Google Scholar]
- 10.Ben-David U, Amon A. Context is everything: aneuploidy in cancer. Nat Rev Genet. 2020;21:44–62. doi: 10.1038/s41576-019-0171-x. [DOI] [PubMed] [Google Scholar]
- 11.Stok C, Kok YP, van den Tempel N, van Vugt MATM. Shaping the BRCAness mutational landscape by alternative double-strand break repair, replication stress and mitotic aberrancies. Nucleic Acids Res. 2021 doi: 10.1093/nar/gkab151. [DOI] [PMC free article] [PubMed] [Google Scholar]
- 12.Chittaranjan S, et al. Loss of CIC promotes mitotic dysregulation and chromosome segregation defects. bioRxiv. 2019:533323. doi: 10.1101/533323. [DOI] [Google Scholar]
- 13.Hell MP, Duda M, Weber TC, Moch H, Krek W. Tumor suppressor VHL functions in the control of mitotic fidelity. Cancer Res. 2014;74:2422–2431. doi: 10.1158/0008-5472.CAN-13-2040. [DOI] [PubMed] [Google Scholar]
- 14.Brownlee PM, Chambers AL, Cloney R, Bianchi A, Downs JA. BAF180 promotes cohesion and prevents genome instability and aneuploidy. Cell Rep. 2014;6:973–981. doi: 10.1016/j.celrep.2014.02.012. [DOI] [PMC free article] [PubMed] [Google Scholar]
- 15.Silverman JS, Skaar JR, Pagano M. SCF ubiquitin ligases in the maintenance of genome stability. Trends Biochem Sci. 2012;37:66–73. doi: 10.1016/j.tibs.2011.10.004. [DOI] [PMC free article] [PubMed] [Google Scholar]
- 16.Godinho SA, Pellman D. Causes and consequences of centrosome abnormalities in cancer. Philos Trans R Soc Lond B Biol Sci. 2014;369 doi: 10.1098/rstb.2013.0467. [DOI] [PMC free article] [PubMed] [Google Scholar]
- 17.Menghi F, et al. The Tandem Duplicator Phenotype Is a Prevalent Genome-Wide Cancer Configuration Driven by Distinct Gene Mutations. Cancer Cell. 2018;34:197–210.:e5. doi: 10.1016/j.ccell.2018.06.008. [DOI] [PMC free article] [PubMed] [Google Scholar]
- 18.Abkevich V, et al. Patterns of genomic loss of heterozygosity predict homologous recombination repair defects in epithelial ovarian cancer. Br J Cancer. 2012;107:1776–1782. doi: 10.1038/bjc.2012.451. [DOI] [PMC free article] [PubMed] [Google Scholar]
- 19.Popova T, et al. Ploidy and large-scale genomic instability consistently identify basal-like breast carcinomas with BRCA1/2 inactivation. Cancer Res. 2012;72:5454–5462. doi: 10.1158/0008-5472.CAN-12-1470. [DOI] [PubMed] [Google Scholar]
- 20.The Cancer Genome Atlas Research Network. Integrated genomic analyses of ovarian carcinoma. Nature. 2011;474:609–615. doi: 10.1038/nature10166. [DOI] [PMC free article] [PubMed] [Google Scholar]
- 21.Nik-Zainal S, et al. Landscape of somatic mutations in 560 breast cancer whole-genome sequences. Nature. 2016;534:47–54. doi: 10.1038/nature17676. [DOI] [PMC free article] [PubMed] [Google Scholar]
- 22.Ogden A, Rida PCG, Aneja R. Prognostic value of CA20, a score based on centrosome amplification-associated genes, in breast tumors. Sci Rep. 2017;7:262. doi: 10.1038/s41598-017-00363-w. [DOI] [PMC free article] [PubMed] [Google Scholar]
- 23.Piazza A, Heyer W-D. Homologous Recombination and the Formation of Complex Genomic Rearrangements. Trends Cell Biol. 2019;29:135–149. doi: 10.1016/j.tcb.2018.10.006. [DOI] [PMC free article] [PubMed] [Google Scholar]
- 24.Guirouilh-Barbat J, Lambert S, Bertrand P, Lopez BS. Is homologous recombination really an error-free process? Frontiers in Genetics. 2014;5 doi: 10.3389/fgene.2014.00175. [DOI] [PMC free article] [PubMed] [Google Scholar]
- 25.Knijnenburg TA, et al. Genomic and Molecular Landscape of DNA Damage Repair Deficiency across The Cancer Genome Atlas. Cell Rep. 2018;23:239–254.:e6. doi: 10.1016/j.celrep.2018.03.076. [DOI] [PMC free article] [PubMed] [Google Scholar]
- 26.Saavedra HI, Fukasawa K, Conn CW, Stambrook PJ. MAPK mediates RAS-induced chromosome instability. J Biol Chem. 1999;274:38083–38090. doi: 10.1074/jbc.274.53.38083. [DOI] [PubMed] [Google Scholar]
- 27.Perl AL, et al. Protein phosphatase 2A controls ongoing DNA replication by binding to and regulating cell division cycle 45 (CDC45) J Biol Chem. 2019;294:17043–17059. doi: 10.1074/jbc.RA119.010432. [DOI] [PMC free article] [PubMed] [Google Scholar]
- 28.Chen L, et al. The Augmented R-Loop Is a Unifying Mechanism for Myelodysplastic Syndromes Induced by High-Risk Splicing Factor Mutations. Mol Cell. 2018;69:412–425.:e6. doi: 10.1016/j.molcel.2017.12.029. [DOI] [PMC free article] [PubMed] [Google Scholar]
- 29.Li Q, et al. ERCC2 Helicase Domain Mutations Confer Nucleotide Excision Repair Deficiency and Drive Cisplatin Sensitivity in Muscle-Invasive Bladder Cancer. Clin Cancer Res. 2019;25:977–988. doi: 10.1158/1078-0432.CCR-18-1001. [DOI] [PMC free article] [PubMed] [Google Scholar]
- 30.Menon V, Povirk L. Involvement of p53 in the repair of DNA double strand breaks: multifaceted Roles of p53 in homologous recombination repair (HRR) and non-homologous end joining (NHEJ) Subcell Biochem. 2014;85:321–336. doi: 10.1007/978-94-017-9211-0_17. [DOI] [PMC free article] [PubMed] [Google Scholar]
- 31.Dentro SC, et al. Characterizing genetic intra-tumor heterogeneity across 2,658 human cancer genomes. Cell. 2021;184:2239–2254.:e39. doi: 10.1016/j.cell.2021.03.009. [DOI] [PMC free article] [PubMed] [Google Scholar]
- 32.Dewhurst SM, et al. Tolerance of whole-genome doubling propagates chromosomal instability and accelerates cancer genome evolution. Cancer Discov. 2014;4:175–185. doi: 10.1158/2159-8290.CD-13-0285. [DOI] [PMC free article] [PubMed] [Google Scholar]
- 33.Davoli T, de Lange T. The Causes and Consequences of Polyploidy in Normal Development and Cancer. 2011 doi: 10.1146/annurev-cellbio-092910-154234. [DOI] [PubMed] [Google Scholar]
- 34.Berenjeno IM, et al. Oncogenic PIK3CA induces centrosome amplification and tolerance to genome doubling. Nat Commun. 2017;8:1773. doi: 10.1038/s41467-017-02002-4. [DOI] [PMC free article] [PubMed] [Google Scholar]
- 35.Darp R, Vittoria MA, Ganem NJ, Ceol CJ. Oncogenic BRAF Induces Whole-Genome Doubling Through Suppression of Cytokinesis. bioRxiv. 2021:2021.04.08.439023. doi: 10.1101/2021.04.08.439023. [DOI] [PMC free article] [PubMed] [Google Scholar]
- 36.Zhang Q, et al. FBXW7 Facilitates Nonhomologous End-Joining via K63-Linked Polyubiquitylation of XRCC4. Mol Cell. 2016;61:419–433. doi: 10.1016/j.molcel.2015.12.010. [DOI] [PMC free article] [PubMed] [Google Scholar]
- 37.Citri A, Skaria KB, Yarden Y. The deaf and the dumb: the biology of ErbB-2 and ErbB-3. Exp Cell Res. 2003;284:54–65. doi: 10.1016/s0014-4827(02)00101-5. [DOI] [PubMed] [Google Scholar]
- 38.Alexandrov LB, et al. The repertoire of mutational signatures in human cancer. Nature. 2020;578:94–101. doi: 10.1038/s41586-020-1943-3. [DOI] [PMC free article] [PubMed] [Google Scholar]
- 39.Venkatesan S, et al. Induction of APOBEC3 Exacerbates DNA Replication Stress and Chromosomal Instability in Early Breast and Lung Cancer Evolution. Cancer Discov. 2021;11:2456–2473. doi: 10.1158/2159-8290.CD-20-0725. [DOI] [PMC free article] [PubMed] [Google Scholar]
- 40.Crockford A, et al. Cyclin D mediates tolerance of genome-doubling in cancers with functional p53. Ann Oncol. 2017;28:149–156. doi: 10.1093/annonc/mdw612. [DOI] [PMC free article] [PubMed] [Google Scholar]
- 41.Ray Chaudhuri A, Nussenzweig A. The multifaceted roles of PARP1 in DNA repair and chromatin remodelling. Nat Rev Mol Cell Biol. 2017;18:610–621. doi: 10.1038/nrm.2017.53. [DOI] [PMC free article] [PubMed] [Google Scholar]
- 42.Goel S, et al. CDK4/6 inhibition triggers anti-tumour immunity. Nature. 2017;548:471–475. doi: 10.1038/nature23465. [DOI] [PMC free article] [PubMed] [Google Scholar]
- 43.Brownlee PM, Meisenberg C, Downs JA. The SWI/SNF chromatin remodelling complex: Its role in maintaining genome stability and preventing tumourigenesis. DNA Repair. 2015;32:127–133. doi: 10.1016/j.dnarep.2015.04.023. [DOI] [PubMed] [Google Scholar]
- 44.Kops GJP, Foltz DR, Cleveland DW. Lethality to human cancer cells through massive chromosome loss by inhibition of the mitotic checkpoint. Proc Natl Acad Sci U S A. 2004;101:8699–8704. doi: 10.1073/pnas.0401142101. [DOI] [PMC free article] [PubMed] [Google Scholar]
- 45.Quinton RJ, et al. Whole-genome doubling confers unique genetic vulnerabilities on tumour cells. Nature. 2021 doi: 10.1038/s41586-020-03133-3. [DOI] [PMC free article] [PubMed] [Google Scholar]
- 46.Janssen A, Kops GJPL, Medema RH. Elevating the frequency of chromosome mis-segregation as a strategy to kill tumor cells. Proc Natl Acad Sci U S A. 2009;106:19108–19113. doi: 10.1073/pnas.0904343106. [DOI] [PMC free article] [PubMed] [Google Scholar]
- 47.Datta D, et al. Nucleolar GTP-binding Protein-1 (NGP-1) Promotes G1 to S Phase Transition by Activating Cyclin-dependent Kinase Inhibitor p21 Cip1/Waf1. J Biol Chem. 2015;290:21536–21552. doi: 10.1074/jbc.M115.637280. [DOI] [PMC free article] [PubMed] [Google Scholar]
- 48.Martin LP, Hamilton TC, Schilder RJ. Platinum resistance: the role of DNA repair pathways. Clin Cancer Res. 2008;14:1291–1295. doi: 10.1158/1078-0432.CCR-07-2238. [DOI] [PubMed] [Google Scholar]
- 49.Zack TI, et al. Pan-cancer patterns of somatic copy number alteration. Nat Genet. 2013;45:1134–1140. doi: 10.1038/ng.2760. [DOI] [PMC free article] [PubMed] [Google Scholar]
- 50.Scheinin I, et al. DNA copy number analysis of fresh and formalin-fixed specimens by shallow whole-genome sequencing with identification and exclusion of problematic regions in the genome assembly. Genome Res. 2014;24:2022–2032. doi: 10.1101/gr.175141.114. [DOI] [PMC free article] [PubMed] [Google Scholar]
Associated Data
This section collects any data citations, data availability statements, or supplementary materials included in this article.
Supplementary Materials
Data Availability Statement
All data used in this study were obtained from publicly available sources and are described in detail in Supplementary Table 1, section "Data and Code" in the Supplementary Methods. Some raw data have restricted access (TCGA dbGaP Accession number: phs000178.v11.p8; ICGC EGA Accession number: EGAS00001001692). Access can be obtained by applying to the relevant Data Access Committees (TCGA; ICGC). The authors declare that all other data supporting the findings of this study, including the source data for all figures, are publicly available without restrictions and also available in the Supplementary Information and the Github repositories. All data supporting the analysis of our copy number signatures are navigable via our web portal (https://markowetz.cruk.cam.ac.uk/cincompendium/).
The code is publicly accessible via our hub repository https://github.com/markowetzlab/Drews2022, which describes how the CIN signatures were derived and how to reproduce the figures and tables in this publication. The repository also contains the publicly accessible data and intermediary results used and produced in this study. The hub repository links to other repositories containing the code for specialised tasks.


