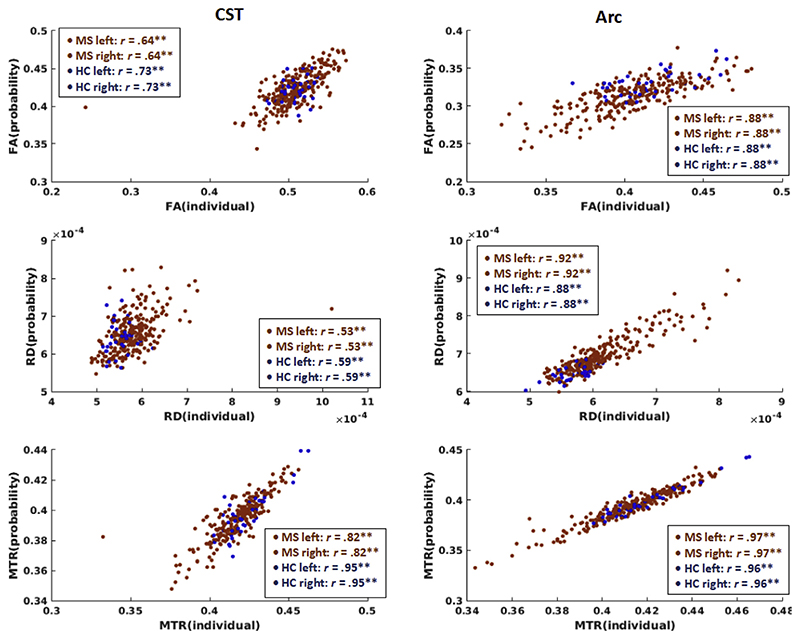
Fig. 5. Correlations between tract-specific microstructure from individually segmented and probability-based tracts.
For each microstructural metric (top row: FA, middle row: RD and bottom row: MTR) and tract (CST: left column, ARC: right column), the correlation between individual approach and probability-based approach is shown. Data were collapsed across hemispheres for plotting. Pearson correlation coefficients are provided for each group and hemisphere separately. MS data points are plotted in red, HC data points in blue. Data from 123 to 130 patients and 19 controls contributed to the plot for the left and right CST, respectively, and data from 130 to 122 patients and 19 controls contributed to the plot for the left and right Arc, respectively. **p < .0001. Acronyms: CST: cortico-spinal tract, Arc: arcuate fasciculus.

