Abstract
The N6-methyladenosine (m6A) is an abundant internal RNA modification1,2 catalysed predominantly by the METTL3–METTL14 methyltransferase complex3,4. The m6A writer METTL3 has been linked to the initiation and maintenance of acute myeloid leukaemia (AML), but its true therapeutic importance is still unknown5–7. Here we present the identification and characterisation of a highly potent and selective first-in-class catalytic inhibitor of METTL3 (STM2457) and its co-crystal structure bound to METTL3/METTL14. Treatment with STM2457 leads to reduced AML growth, and an increase in differentiation and apoptosis. These cellular effects are accompanied by selective reduction of m6A levels on known leukaemogenic mRNAs and a decrease in their expression consistent with a translational defect. We demonstrate that pharmacological inhibition of METTL3 in vivo leads to impaired engraftment and prolonged survival in various AML mouse models, specifically targeting key stem cell subpopulations of AML. Collectively, these results reveal the inhibition of METTL3 as a potential therapeutic strategy against AML, and provide proof of concept that the targeting of RNA modifying enzymes represents a promising new avenue for anti-cancer therapy.
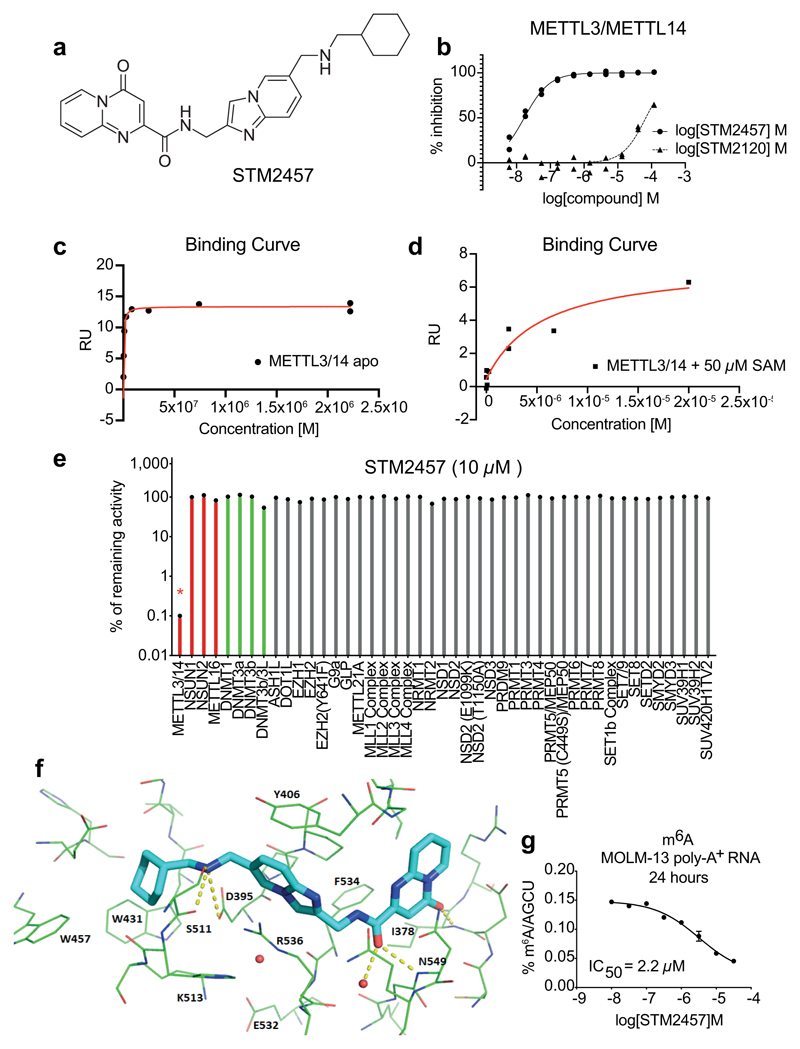
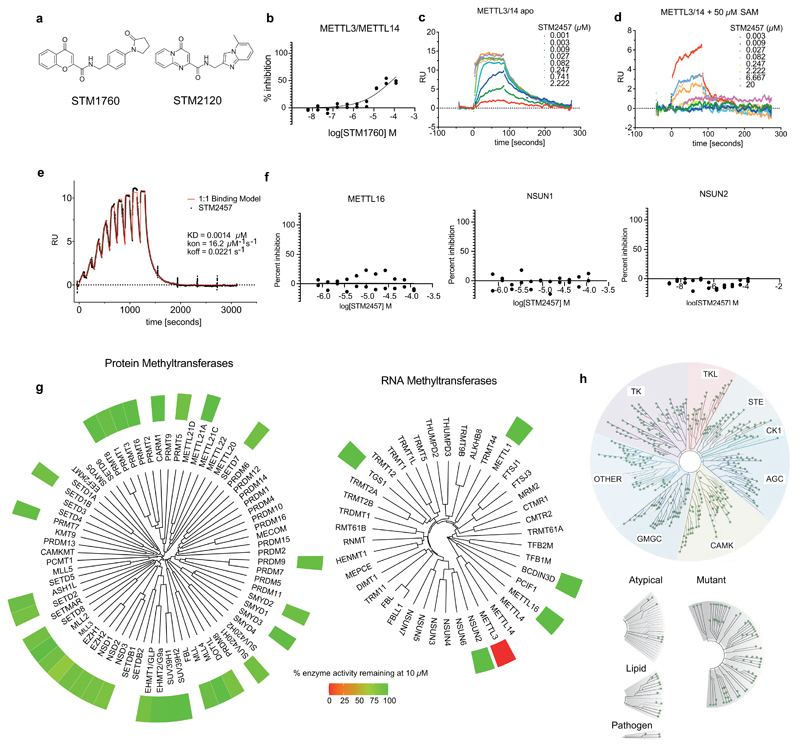
To investigate the therapeutic potential of targeting the enzymatic activity of METTL3 as an anti-leukaemic strategy, we developed the small molecule STM2457. A high throughput screen (HTS) of 250,000 diverse drug-like compounds was carried out. STM1760 [half maximum inhibitory concentration (IC50) = 51.7 μM] was one of only two non-S-adenosyl methionine (SAM) related hits arising from the HTS (Extended Data Fig. 1a, b). After optimisation of potency, in vitro ADME and in vivo pharmacokinetic properties, we identified STM2457 (Fig. 1a). STM2120 (IC50 = 64.5 μM) was identified as structurally related, but 1,000 fold less active compared to STM2457 (Fig. 1b and Extended Data Fig. 1a).
Fig. 1. Characterisation of the RNA methyltransferase inhibitor STM2457.
a) Chemical structure of STM2457. b) Biochemical activity assay showing inhibition of the METTL3/14 enzyme complex using a dose-range of STM2457 and STM2120. c) Surface plasmon resonance (SPR) assay showing binding affinity of STM2457 to the METTL3/14 protein complex. d) SPR assay showing binding affinity to the METTL3/METTL14 protein complex is reduced in the presence of SAM, indicative of SAM-competitive binding. e) STM2457 inhibits METTL3/METTL14 selectively in a methyltransferase profiling panel of 45 RNA (red bars), DNA (green bars) and protein methyltransferases (grey bars) (red star indicates <50% activity remaining) (n=2). f) Crystal structure of METTL3/METTL14 (carbon atoms in green) in complex with STM2457 (carbon atoms in cyan). Hydrogen bonds (yellow dashed lines) and water molecules proximal to the inhibitor (red sphere) are shown (PDB code 7O2I). g) Quantification of m6A levels on poly-A+-enriched RNA after 24 hours of treatment of MOLM-13 with the indicated STM2457 concentrations (mean +/- s.d., n=3). IC50, half maximum inhibitory concentration.
Characterisation of STM2457
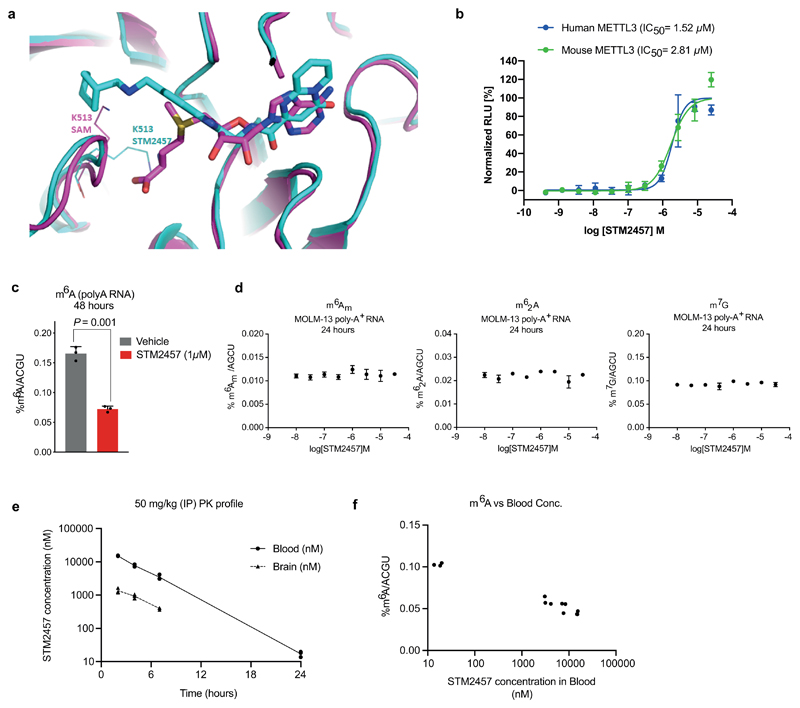
STM2457 is a potent inhibitor of METTL3/METTL14 catalytic activity with a IC50 of 16.9 nM (Fig. 1b). Direct binding to the METTL3/METTL14 heterodimer was confirmed using surface plasmon resonance (SPR) with a high affinity Kd of 1.4 nM (Fig. 1c, d and Extended Data Fig. 1c-e). A co-factor competitive binding mode was demonstrated using SAM in the SPR running buffer (Fig. 1d). There was no evidence that the compound disrupted the METTL3/METTL14 complex. STM2457 is highly specific for METTL3 and showed no inhibition of other RNA methyltransferases (Extended Data Fig. 1f). Moreover, STM2457 showed >1,000-fold selectivity for METTL3 when tested against a broad panel of 45 RNA, DNA and protein methyltransferases (Fig. 1e and Extended Data Fig. 1g), and showed no inhibitory effect on a panel of 468 kinases (Extended Data Fig. 1h). We further characterized the binding of STM2457 to METTL3 by X-ray crystallography, confirming the binding of STM2457 to the SAM binding site (Fig. 1f and Extended Data Fig. 2a). The strong selectivity of STM2457 observed in the methyltransferase panel is consistent with: the structural dissimilarity with SAM or known methyl transferase inhibitors, its avoidance of the homocysteine binding pocket utilized by SAM, the reorganization of K513 on STM2457 binding, and the known structural diversity of the cofactor binding site of SAM-dependent methyl transferases8.
Equipotent inhibition of human and mouse METTL3 by STM2457 was demonstrated using a cellular thermal-shift assay (Extended Data Fig. 2b). The difference between biochemical and cellular IC50 of STM2457 is consistent with the Km of SAM for METTL3/14 (0.1 μM)9 and the competition from highly abundant intracellular SAM10. We further demonstrated target inhibition of STM2457 in cells by measuring concentration-dependent reduction of m6A on poly-A+-enriched RNA (Fig. 1g and Extended Data Fig. 2c). No changes were detected on other RNA modifications (Extended Data Fig. 2d). Pharmacokinetic profiling of STM2457 in mice following a single intra-peritoneal dose of 50 mg/kg indicated a sufficient half-life of STM2457, ensuring appropriate compound exposure levels in vivo over 24h (Extended Data Fig. 2e). Dose-dependent inhibition of m6A on poly-A+-enriched RNA from mouse spleens confirmed a clear relationship between compound exposure and target inhibition in vivo (Extended Data Fig. 2f). These data demonstrate that STM2457 is a highly potent, specific and bioavailable inhibitor of METTL3, suitable for in vivo investigations.
Cellular and molecular effects of STM2457
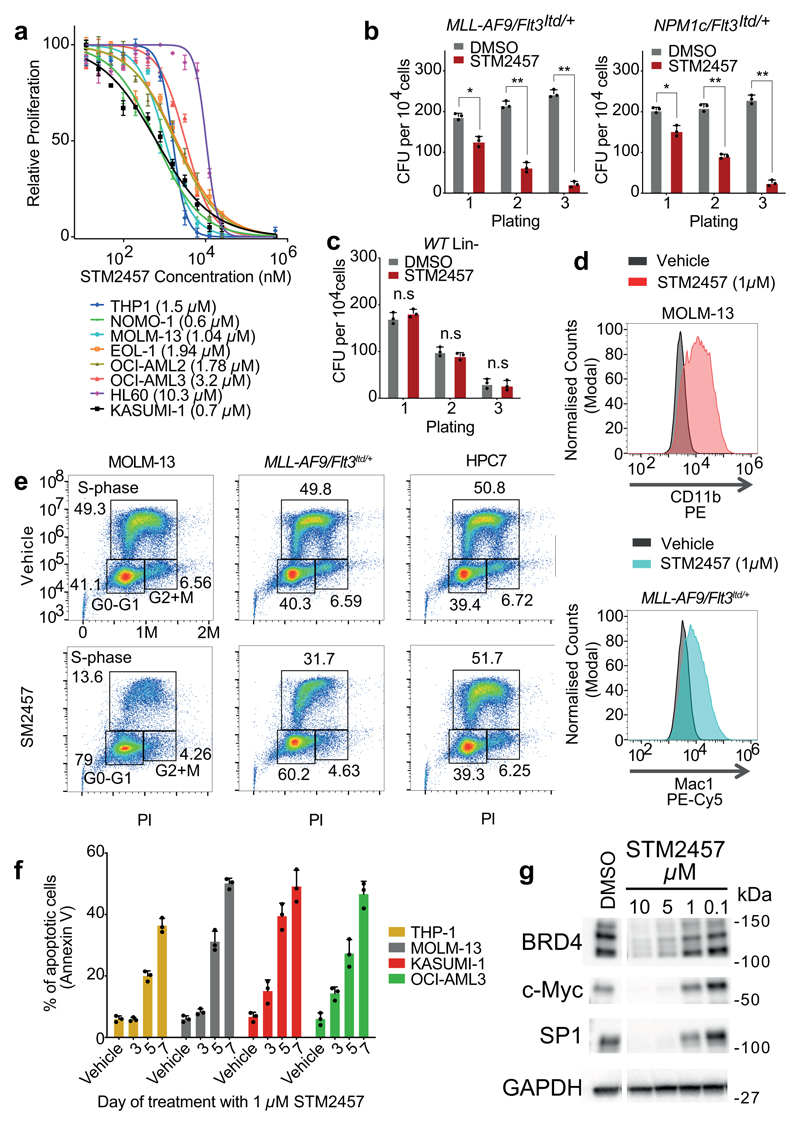
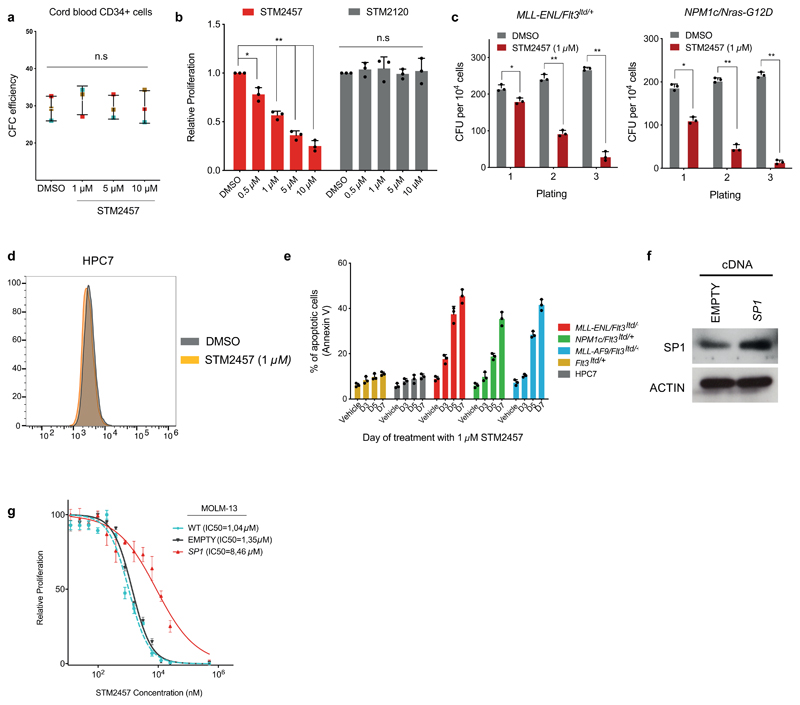
To study the anti-leukaemic potential of STM2457 we examined the proliferation of a panel of human AML cell lines post-treatment and detected significant growth reduction in a concentration-dependent manner (Fig. 2a) while we found that STM2457 did not affect the colony-forming ability of normal human cord blood CD34+ cells (Extended Data Fig. 3a). We also observed no impact on the proliferation of MOLM-13 cells treated with the control small molecule STM2120, unlike our observations with STM2457 (Extended Data Fig. 3b). Additionally, treatment with STM2457 significantly reduced the clonogenic potential of primary murine AML cells (Fig. 2b and Extended Data Fig. 3c), while having no effect on normal haematopoietic stem and progenitor cells (HSPCs) (Fig. 2c). Pharmacological inhibition of METTL3 also caused significant myeloid differentiation6,11 and cell cycle arrest in MOLM-13 and primary murine AML cells (Fig. 2d, e). In contrast, the same effects were not identified using the non-leukaemic haemopoietic cell line HPC7 (Fig. 3e and Extended Data Fig. 3d). Moreover, treatment with STM2457 induced apoptosis in human and mouse AML models but not in normal non-leukaemic haemopoietic cells (Fig. 2f and Extended Data Fig. 3e). To assess the impact of pharmacological inhibition of METTL3 on two known METTL3 biomarkers associated with AML, SP16,12 and BRD413,14, we treated MOLM-13 cells with STM2457 and observed a dose-dependent reduction of SP1 and BRD4 protein levels (Fig. 2g). Notably, ectopic expression of SP1 significantly reduced the sensitivity of MOLM-13 cells to STM2457 (Extended Data Fig. 3f, g). These data establish that the catalytic function of METTL3 is important for leukaemia growth, in line with previous findings6,7,15.
Fig. 2. Pharmacological inhibition of METTL3 affects AML cells.
a) Dose-response curves of an AML cell line panel to STM2457 (mean +/- s.d., n=3). b) Colony forming efficiency of primary murine MLL-AF9/Flt3Itd/+ and NPM1c/Flt3Itd/+ AML cells treated with vehicle or STM2457 (mean +/- s.d., n=3). Half maximum inhibitory concentration (IC50) per cell line is illustrated in brackets. c) Colony forming efficiency of WT Lin- cells treated with vehicle or STM2457 (mean +/- s.d., n=3). d) CD11b and Mac1 levels of MOLM-13 and MLL-AF9/Flt3Itd/+ primary murine cells, respectively, treated with vehicle or STM2457. e) BrdU staining and cell cycle analysis in MOLM-13, HPC7 and MLL-AF9/Flt3Itd/+ primary murine cells treated with vehicle or STM2457. f) Percentage of apoptotic cells in a human AML cell line panel, following treatment with STM2457 at the indicated time-points (mean +/- s.d., n=3). g) Western blot analysis of BRD4, c-MYC, SP1 and GAPDH in MOLM-13 cells treated with the indicated doses of STM2457 or vehicle (n=3). two-tailed Student’s t-test; *P < 0.01; **P < 0.0001, n.s. not significant; WT, wild-type.
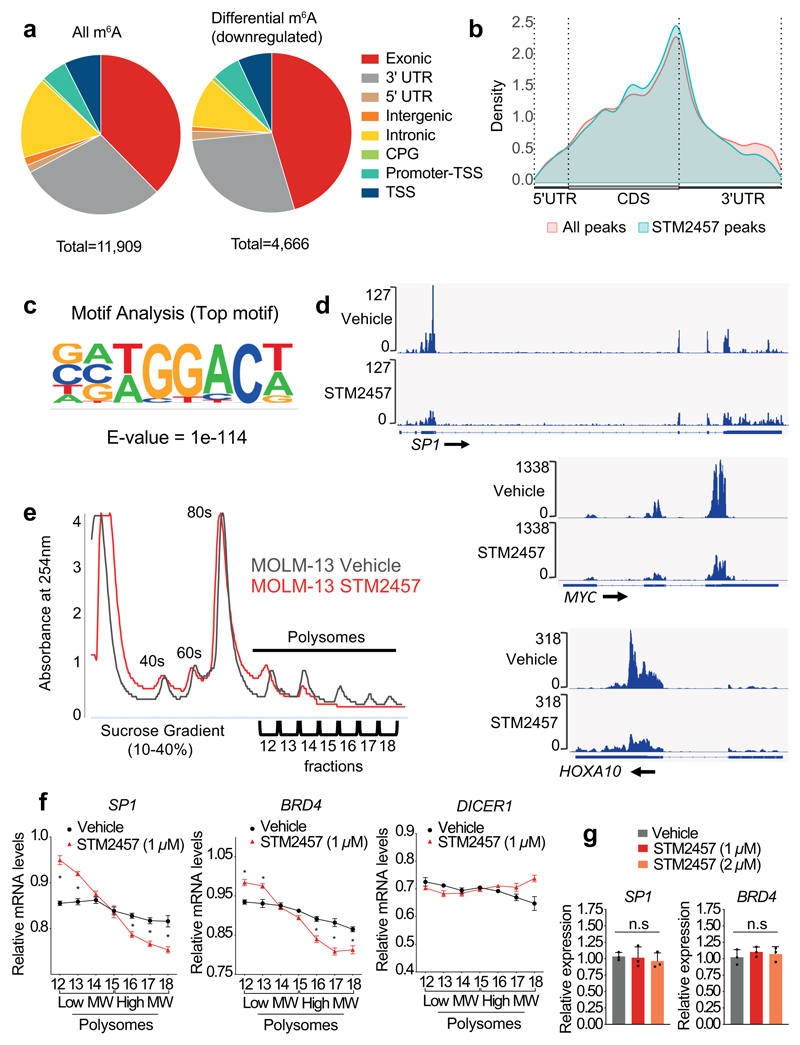
Fig. 3. STM2457 reduces m6A levels and causes mRNA translation defects.
a) Genomic distribution of all m6A peaks called (left) and/or the genomic distribution of downregulated m6A peaks (right) on poly-A+-enriched RNAs from STM2457-treated MOLM-13 cells. b) The distribution of all (red) or down-regulated (light blue) m6A peaks of MOLM-13 cells upon treatment with STM2457. c) Motif analysis of the sequences under depleted peaks, following treatment with STM2457 (hypergeometric test). d) Genomic visualization of the m6A-meRIP normalized signal for SP1, MYC and HOXA10 in MOLM13 cells following treatment with vehicle or STM2457. e) Polysome fractionation analysis in MOLM-13 cells treated with vehicle or STM2457. Absorbance was continuously measured at 254 nm. f) RT-qPCR quantification of SP1, BRD4 and DICER1 mRNAs in each polysome fraction presented as a percentage of total mRNA (mean +/- s.d., n=3). g) RT-qPCR quantification of SP1 and BRD4 in total RNA samples isolated from MOLM-13 cells treated with vehicle or STM2457 (mean +/- s.d., n=3). UTR, untranslated region; CPG, CPG island; TSS, transcription start site; CDS, coding sequence; nm, nanometres; MW, molecular weight; n.s., not significant; two-tailed Student’s t-test; *P < 0.05.
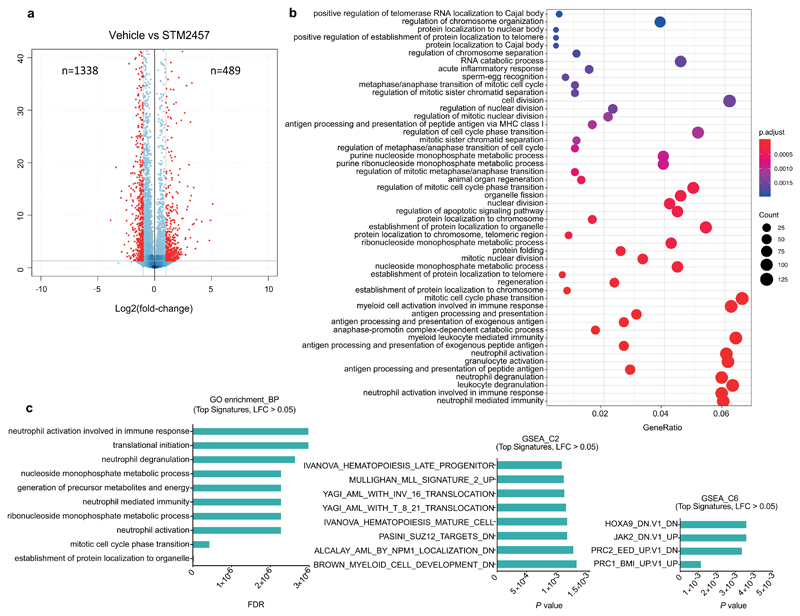
We next sought to investigate the molecular mechanism by which STM2457 affects AML. RNAseq analysis of MOLM-13 cells treated with STM2457 revealed 1,338 up-regulated and 489 down-regulated genes (Extended Data Fig. 4a and Supplementary Table 1). Gene ontology (GO) analysis of the differentially expressed genes showed enrichment in pathways related to myeloid differentiation, cell cycle and leukaemia progression (Extended Data Fig. 4b, c) in close agreement with our phenotypic observations (Supplementary Table 2). To examine the impact of the pharmacological inhibition of METTL3 on m6A levels we performed m6A-meRIP-seq in MOLM-13 cells treated with STM2457. This identified 11,909 m6A peaks on poly-A+-enriched RNA, of which 4,666 were reduced upon STM2457 treatment, indicating that they were METTL3-catalytic dependent (Fig. 3a and Supplementary Table 3). We observed no major changes between the general m6A distribution and the distribution upon treatment with STM2457 (Fig. 3a, b). Importantly, motif analysis identified the m6A-associated DRACH motif16 as the top candidate (Fig. 3c), validating the specificity of STM2457.
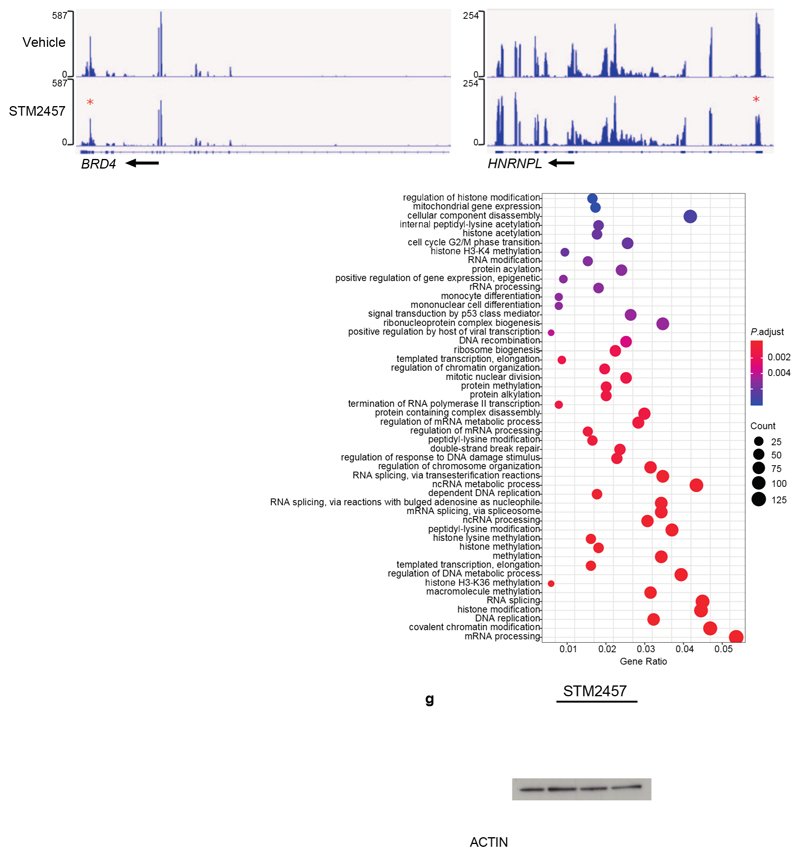
We next compared our m6A-meRIP-seq findings to previously published meRIP-seq dataset6 using METTL3 knock-down (KD) in MOLM-13 cells. This analysis identified a significant overlap in the differentially m6A-methylated poly-A+ RNAs as well as in the differential m6A peaks (Extended Data Fig. 5a, b and Supplementary Table 4), including many known and novel METTL3-specific m6A substrates (Fig. 3d and Extended Data Fig. 5c). The substrate and peak differences observed could be attributed to the more specific catalytic inhibition of METTL3 by STM2457 compared to prolonged METTL3 KD which potentially disrupts the overall m6A methyltransferase complex17. m6A-meRIP and qPCR validation revealed that treatment with STM2457 leads to reduced m6A levels in METTL3-dependent core leukaemogenic m6A substrates including HOXA1018 and MYC19, while no difference observed in METTL3-independent m6A substrates (Extended Data Fig. 5d), thus validating the specificity of our m6A profiling. GO analysis of the differential m6A-meRIP candidates revealed enrichment of pathways involved in chromatin modification, DNA damage and RNA splicing (Extended Data Fig. 5e and Supplementary Table 5). These findings are consistent with a nuclear function for METTL3 catalytic activity, bolstering the previously reported chromatin-based mechanism required for AML cell survival6, and the connections of m6A with nuclear biological processes20–22.
We and others have shown that genetic inhibition of METTL3 and METTL14 leads to mRNA translational defects and ribosomal stalling6,7,15,23. We therefore examined whether isolated catalytic inhibition of METTL3 causes similar translational defects. Polysome profiling revealed loss of high polysome fractions following treatment with STM2457 in MOLM-13 cells (Fig. 3e). Validation of the polysome fractions using qPCR indicated a significant reduction of known METTL3-dependent substrates in the high molecular weight fractions and an increase in the lower, suggesting ribosomal stalling (Fig. 3f). In contrast, a METTL3-independent m6A substrate, DICER1, remained unaffected by the treatment with STM2457 (Fig. 3f). Crucially, the overall RNA expression levels of the METTL3 biomarkers BRD4 and SP1 showed no alterations (Fig. 3g), while protein levels were greatly reduced (Fig. 2g), verifying that the effects on mRNA are at the translational and not at the transcriptional level. Furthermore, treatment with STM2457 maintained the expression levels of METTL3 or DICER1 (Extended Data Fig. 5f) as well as the protein levels of METTL3, METTL14, DDX3X and DICER1 (Extended Data Fig. 5g) further suggesting that the impact on mRNA translation is not global but rather specific. Altogether, this mechanistic analysis illustrates that catalytic inhibition of METTL3 causes gene expression defects consistent with an effect on the mRNA translational efficiency of m6A substrates.
In vivo efficacy of STM2457
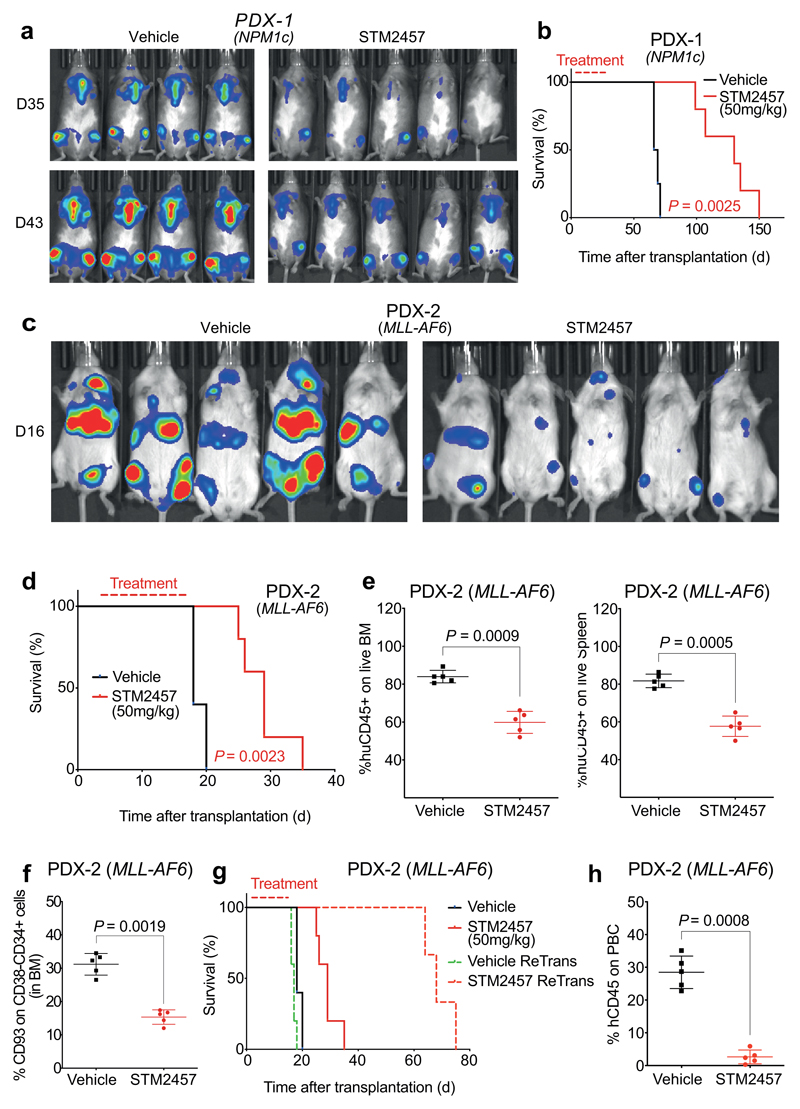
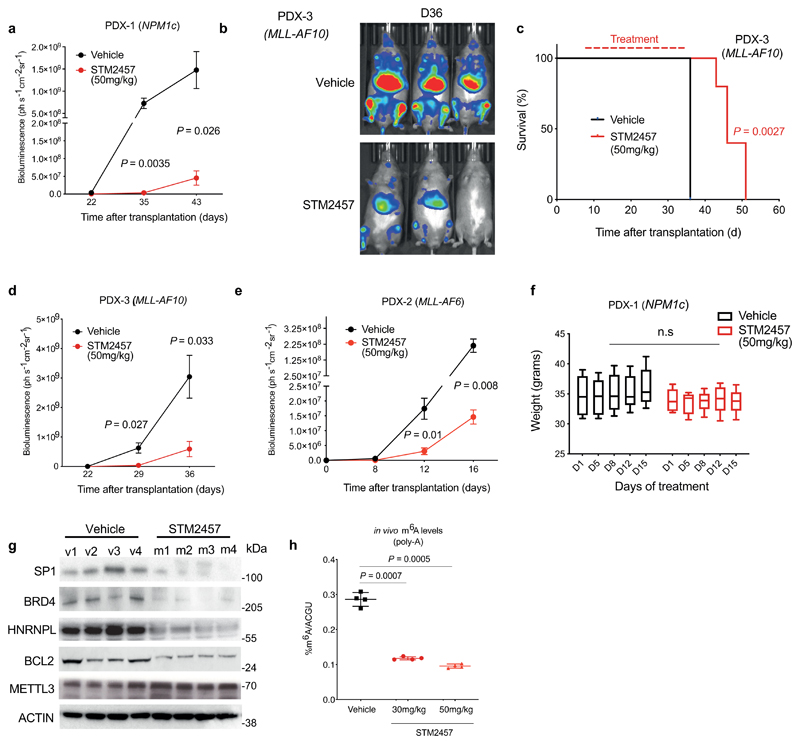
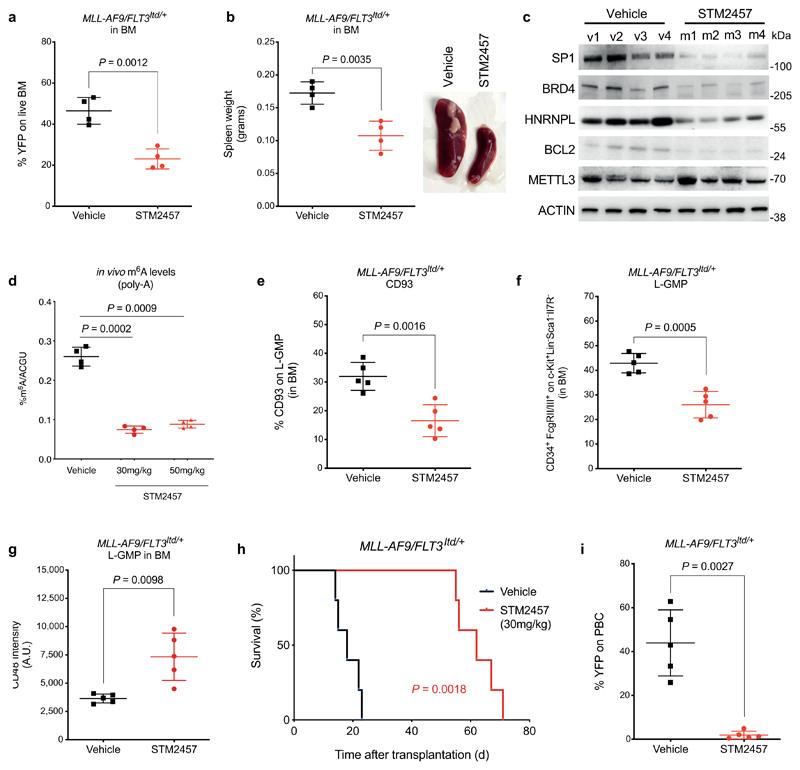
Following the positive evidence for strong pharmacological inhibition of METTL3 in vitro, we performed in vivo studies using clinically relevant AML models. Initially, we utilised 3 human AML patient derived xenografts (PDX) of different genotypes. Daily treatment with STM2457 led to impairment of engraftment and AML expansion in vivo and significantly prolonged the mouse lifespan (Fig. 4a-d and Extended Data Fig. 6a-e) with no overt toxicity or effect on mouse body weight (Extended Data Fig. 6f). The anti-leukaemic effect was also confirmed by the reduction of human CD45+ cells in bone marrow and spleen following treatment (Fig. 4e). Effective METTL3 target inhibition by STM2457 in vivo was demonstrated by the selective reduction of key METTL3 m6A substrates at the protein level while METTL3 levels remained unchanged (Extended Data Fig. 6g). Additionally, total m6A levels on poly-A+-enriched RNA were significantly reduced following treatment with STM2457 (Extended Data Fig. 6h). In parallel with the PDX models, we used a primary murine MLL-AF9/Flt3Itd/+ in vivo model with similar anti-leukaemic observations regarding reduction in the engrafted AML cells, reduction in spleen size, selective reduction of METTL3 biomarkers as well as reduction of m6A on poly-A+-enriched RNA (Extended Data Fig. 7a-d).
Fig. 4. STM2457 prevents AML expansion and reduces key leukaemia stem cells in vivo.
a) Bioluminescence imaging of AML PDX-1 (NPM1c) treated with vehicle or 50 mg/kg STM2457 (n=5). b) Kaplan-Meier survival of AML PDX-1 (NPM1c) after treatment with vehicle or 50 mg/kg STM2457 at indicated times (n=5). c) Bioluminescence imaging of AML PDX-2 (MLL-AF6) treated with vehicle or 50 mg/kg STM2457 (n=5). d) Kaplan-Meier survival of AML PDX-2 (MLL-AF6) after treatment with vehicle or 50 mg/kg STM2457 at indicated times (n=5). e) Percentage of CD45+ cells in live bone marrow and spleen after treatment with vehicle or 50 mg/kg STM2457 (n=5). f) Percentage of CD93+ on CD38-/CD34+ cells in bone marrow after treatment with vehicle or 50 mg/kg STM2457 (n=5). g) Kaplan-Meier survival after re-transplantation of AML PDX-2 (MLL-AF6) which was treated with vehicle or 50 mg/kg STM2457 at indicated times (n=5). Treatment (in red) and non-dashed lines in red or black refer to the primary transplantation illustrated in Fig. 4d. h) Percentage of human CD45+ cells in peripheral blood after re-transplantation of AML PDX-2 (MLL-AF6) (n=5). Related to Fig. 4g. PBC, peripheral blood count; d, day; two-tailed Student’s t-test; Log-rank (Mantel–Cox) test was used for survival comparisons.
Having established the significant anti-leukaemic effect of STM2457 in vivo, we went on to investigate the effect of pharmacological inhibition of METTL3 at the core leukaemia stem cell level. Previous studies have shown that CD93+24 and L-GMP25 subpopulations are directly connected to generation and maintenance of primary murine and human patient AMLs driven by MLL rearrangement. Interestingly, we observed that the CD93+ and L-GMP populations were significantly reduced following treatment with STM2457, revealing a strong dependency on the catalytic function of METTL3 (Fig. 4f and Extended Data Fig. 7e, f). Furthermore, CD48+ intensity was increased upon treatment with STM2457 (Extended Data Fig. 7g), thus revealing loss of self-renewal at the leukaemia stem cell level, in concordance with our in vitro and ex vivo observations. To show that METTL3 inhibition results in functional impairment of leukemic stem cells, we performed re-transplantation experiments using murine or patient-derived AML cells from primary transplants treated with vehicle or STM2457. We observed a significant lifespan prolongation and a marked decrease in the presence of AML cells in peripheral blood, exclusively upon initial treatment with STM2457 (Fig. 4g, h and Extended Data Fig. 7h, i). In summary, the pharmacological inhibition of METTL3 in vivo impairs AML expansion by affecting the AML stem cell/leukaemia-propagating compartment.
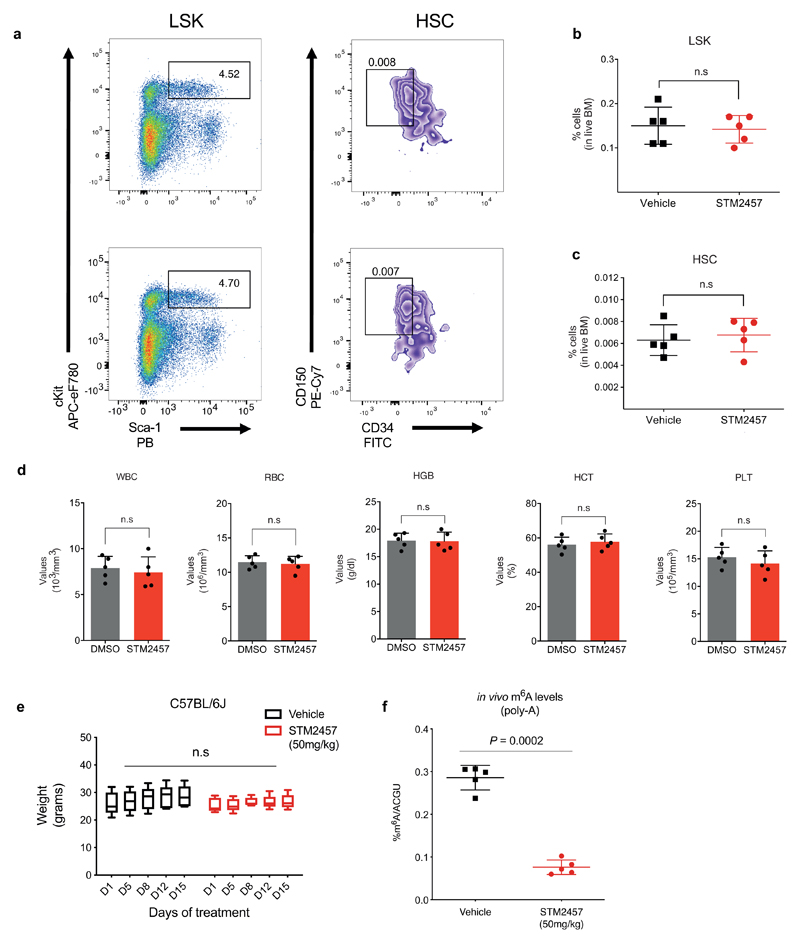
Finally, we evaluated the potential toxicity of the established anti-leukaemic dose of STM2457 in vivo. No significant changes were observed in the numbers of bone marrow-derived hematopoietic stem cells (HSCs) and early progenitors (Lin−, Sca1+, Kit+), peripheral blood counts or mouse body weight (Extended Data Fig. 8a-e). We also confirmed effective catalytic inhibition of METTL3 as the m6A levels on poly-A+-enriched RNA were significantly reduced after treatment with STM2457 (Extended Data Fig. 8f). These data suggest that small molecule inhibition of METTL3 is detrimental for the maintenance of AML, but has no significant or lasting impact on normal haematopoiesis.
Here we present the characterisation of STM2457, the first bioavailable inhibitor of the m6A writer METTL3. Critically, we show that catalytic inhibition of METTL3 via STM2457 targets key stem cell populations of AML which reverses the AML phenotype, preventing or prolonging the development of AML in re-transplantation experiments. Hence, our findings present a promising targeting strategy of the leukemic stem cell subpopulation responsible for AML persistence/recurrence and provide a rationale for future investigations of combined pharmacological inhibition of METTL3 with mainstream anti-AML therapies26,27. Overall, our efforts further highlight the impact of m6A hijacking on the AML status, as previously shown6,7,28–30. To our knowledge, this is the first study demonstrating in vivo activity and therapeutic efficacy of inhibitors of an RNA methyltransferase against cancer.
Methods
METTL3/14 RF/MS methyltransferase assay
The enzymatic assay was established to determine IC50 values for the inhibition of RNA methyltransferase activity. The enzyme used was full-length his-tagged METTL3 co-expressed with full length FLAG-tagged METTL14 in a baculovirus expression system. The enzyme complex was purified using standard affinity chromatography. Enzymatic reactions were performed at room temperature in 384-well plates using a final reaction volume of 20 μL containing 20 mM TrisCl pH 7.6, 1 mM DTT, 0.01% Tween-20. 5 nM final concentration of METTL3/14 was pre-incubated with various compound concentrations for 10 minutes, followed by addition of 0.2 μM final concentration synthetic RNA substrate (5’P-uacacucgaucuggacuaaagcugcuc-3’) and 0.5 μM final concentration S-adenosyl methionine (SAM). The reaction was incubated for further 60 minutes at room temperature, and then quenched by the addition of 40 μL 7.5% TCA with internal standard. After termination, plates were sealed, centrifuged and stored at 4°C until analysis.
METTL3 activity was assessed using the RapidFire™ mass spectrometry (RF/MS) platform to measure the S-adenosyl homocysteine (SAH) product. Stopped and stable assay plates were analyzed on the Agilent RF300 integrated autosampler/solid-phase extraction (SPE) system coupled to an ABSciex 4000 mass spectrometer for the quantification of the SAH and normalized to the ratio of signal of two internal standards. The mass transition for the product (SAH) was 384.9/135.9 Da. Transitions of the internal standard were used for normalization of matrix effects.
Compound IC50 values were calculated by measuring enzyme activity over a dilution series of inhibitor concentrations. Percent inhibition was normalized to control wells without RNA substrate and without inhibition (DMSO only). Data were evaluated using a four-parameter logistic equation in GraphPad Prism (Version 9).
X-ray crystallography: Cloning, protein expression and purification
Production of METTL3-14 truncated protein complex for crystallography has been based on previously published data31. Untagged METTL3 (354-580) and His-tagged METTL14 (107-395) were synthetically cloned into the vector pTriIJ-HV (Evotec). Recombinant virus was produced for each protein and BIICs generated and stored at -80°C. For expression, Sf21 cells grown in Sf900II SFM media plus 5 μg/ml gentamicin were infected with both, METTL3 and METTL14 P2 BIICs at an MOI of 1 (0.5 + 0.5). The infected culture was incubated for 72h at 27°C with shaking at 110 rpm, before harvesting by centrifugation and storing at -80°C. Thawed cells were lysed in 20 mM Tris pH 8.0, 200 mM KCl, 10% glycerol, 0.4% Triton-X 100 and 5 mM imidazole supplemented with Complete EDTA-free protease inhibitor tablets (Roche) and 10 u/ml Benzonase. Samples were homogenised for 20-30 s with an IKA Ultra-Turrax and sonicated in a Branson probe sonicator (cycles of 30s on, 30s off for 4 minutes at 40% amplitude). Sample was centrifuged at 45,000 rpm for 45 min to remove insoluble material and loaded on 5 ml HisTrap FF column, washed with 20 mM Tris pH 8.0, 200 mM KCl, 10% glycerol, 20 mM imidazole and eluted with 0-100% gradient of 20 mM Tris pH 8.0, 200 mM KCl, 10% glycerol, 300 mM imidazole over 20 CV. TEV cleavage was carried out with dialysis o/n at 4°C (20 mM Tris pH 8.0, 200 mM KCl, 10% glycerol, 5 mM imidazole), at TEV ratio 1:50; in the presence of 3 mM reduced/oxidised glutathione mixture. This was followed by subtractive affinity chromatography using 1 ml HisTrap FF and size-exclusion on a 16/60 S200 column (20 mM Tris pH 8.0, 200 mM KCl). Purified protein complex was concentrated to 11 mg/ml and snap-frozen in liquid nitrogen for storage at -80°C.
X-ray crystallography: Crystallisation and soaking
Protein complex was diluted two-fold with 200 mM KCl and after centrifugation, mixed at 1:1 ratio with 200 mM Mg acetate and 20% w/v PEG3350. Crystals grew after several days at RT in both, hanging and sitting drops, and contained SAH carried over from insect cells. Seeding was used to improve crystals reproducibility. To replace SAH with STM2457, crystals were transferred into reservoir solution with 5 mM compound (5% DMSO) for incubation o/n at RT. This was followed by transfer into a fresh drop of soaking solution for another 6 h and subsequent cryo-protection in soaking solution supplemented with 15% glycerol before flash-freezing.
X-ray crystallography: Data collection and structure determination
Data was collected to 3 Å at Diamond Light Source I04-1 beamline and processed using Aimless32. PDB 5L6D was used as Phaser33 molecular replacement model. Iterative cycles of refinement using REFMAC534 and model building using Coot (v10.11.4)35 were performed. STM2457 was fitted and restraints created using SMILES string and AFITT36. Final structure statistics can be found in Supplementary Table 7, 2% of residues are Ramachandran outliers. The structure was deposited with PDB access code 7O2I.
STM2457 selectivity profiling
The selectivity profile of STM2457 was assessed by testing the level of inhibition in a panel of methyltransferases and kinases. Inhibition of 4 RNA methyltransferases was tested at Evotec AG, Hamburg using RFMS assays equivalent to the METTL3 assay described above. The IC50 was determined from a dilution series of STM2457 with a top concentration of 120 μM and the degree of inhibition at 10μM compound was inferred from this. Additionally, the level of inhibition of a panel of 41 DNA and protein methyltransferases was assessed in a radiometric assay measuring substrate methylation using tritiated SAM by Reaction Biology (Malvern, PA) at 10 μM STM2457 in duplicate. Data were plotted using GraphPad Prism (Version 9).
Selectivity testing against 489 kinases was carried out using a binding assay by KINOMEscan, DiscoverX (Eurofins) at 10 μM STM2457 in duplicate.
METTL3 cellular target engagement
Cellular target engagement of STM2457 was measured by thermal shift using the InCell Pulse Assay (DiscoverX). HeLa cells were transfected with pICP-hMETTL3-eLP (human METTL3 Met1-Leu580) or pICP-mMETTL3-eLP (mouse METTL3 Met1-Leu580), using Fugene HD (Promega, #E2311) following the supplier’s protocol. 24 hours post transfection, cells were frozen and stored in liquid nitrogen until the day of the assay. On the day of the assay 100 nL compound dilutions (11 point 3-fold dilutions, top concentration in assay: 25 μM) were spotted into the assay plate (Greiner Dilution, 384-well, PP, transparent, #784201). The transfected cells were thawed in a water bath at 37°C and cryoprotectant was exchanged with Opti-MEM lacking phenol red (Gibco, Cat #11058-021). 20 μL of the cell suspension was added to each well of the assay plate to give a final cell number of 1360 cells/well. Plates were sealed with aluminium foil and incubated for 1 hour at 37°C. Afterwards, plates were incubated for 15 minutes upside down in a water bath at 45°C, further incubated for 10 minutes at room temperature, and finally centrifuged briefly to gather the liquid in the bottom of each well. Subsequently, 25 μL of detection solution (InCELL Hunter Detection Kit, DiscoverX, #96-0079L; working solution: 16.7 v/v EA reagent, 16.7 v/v lysis buffer and 66.7% substrate reagent) was added to each well and the solution was transferred to the measurement plate (Corning, 384-well, PS, black, Flat Bottom, #3575). The plate was sealed with aluminium foil and incubated at room temperature and slow shaking for 30 minutes. Finally, the assay plate was centrifuged for 1 minute at 100 x g and room temperature and luminescence was measured using an EnVision multimode plate reader (Perkin Elmer). Dose response curves were obtained from three biological replicates. All data in this section were plotted using GraphPad Prism (Version 9).
Cell culture
MOLM-13, THP-1, NOMO-1, EOL-1, KASUMI-1 and HL-60 were cultured in RPMI-1640 (Invitrogen) supplemented with 10% FBS (Life Technologies) and 1% penicillin/streptomycin/glutamine. OCI-AML2 and OCI-AML3 were cultured in alpha-MEM (Lonza) supplemented with 20% FBS (Life Technologies) and 1% penicillin/streptomycin/glutamine. HPC-7 was cultured in IMDM (Invitrogen) supplemented with 10% FBS, 100ng ml-1 SCF (Peprotech), 7.48 x 10⁻⁵ M 1-thioglycerol (Sigma), 1% penicillin/streptomycin/glutamine. 32D was cultured in RPMI (Invitrogen) supplemented with 10% FBS, 10 ng ml-1 IL-3 (Peprotech) and 1% penicillin/streptomycin/glutamine. 293T were cultured in DMEM (Invitrogen) supplemented with 10% FBS (Life Technologies) and 1% penicillin/streptomycin/glutamine. HeLa cells were cultured in MEM Eagle culture medium (10% FBS, 2 mM L-Glutamine, 1% NEAA) at 37°C and 5% CO2. All cancer cell lines were obtained from the Sanger Institute Cancer Cell Collection and negative for mycoplasma contamination. Human cell lines employed are not listed in the cross-contaminated or misidentified cell lines database curated by the International Cell Line Authentication Committee (ICLAC).
Isolation of haematopoietic progenitors
Flt3ITD/+ mice37 were kindly provided by Gary Gilliland and crossed with Rosa26Cas9/+ mice. Freshly isolated bone marrow from 6- to 10-week-old female Rosa26Cas9/+, Flt3ITD/+; Rosa26Cas9/+ or moribund Npm1flox−cA/+; Flt3ITD/+, Npm1flox−cA/+; NrasG12D/+ mice were used. Bone marrow cells were exposed to erythrocyte lysis (BD PharmLyse, BD Bioscience), followed by magnetic bead selection of Lin- cells using the Lineage Cell Depletion Kit (Miltenyi Biotec) according to the manufacturer’s instructions. Lin- were cultured in X-VIVO 20 (Lonza) supplemented with 5% FBS (Life Technologies) 10ng ml-1 IL3 (Peprotech), 10ng ml-1 IL6 (Peprotech) and 50ng ml-1 of SCF (Peprotech). Retrovirus constructs pMSCV-MLL-AF9-IRES-YFP and pMSCV-MLL-ENL-IRES-Neo were used with package plasmid psi-Eco to produce retrovirus. 293T cells (Life Technologies) were cultured and prepared for transduction in 10 cm plates. For virus production, 5 μg of the above plasmids and 5 μg psi-Eco packaging vector were transfected drop wise into the 293T cells using 47.5 μl TransIT LT1 (Mirus) and 600 μl Opti-MEM (Invitrogen). The resulting viral supernatant was harvested as previously described. Transduction of primary mouse cells was performed in 6-well plates as mentioned above. After transduction, transduced cells were sorted for YFP (for MLL-AF9) or selected with neomycin (for MLL-ENL).
For in vivo experiments related to Extended Data 8, 6 to 10-week-old female Rosa26Cas9/+ mice were treated daily for two weeks with either vehicle or 50 mg/kg STM2457 (STORM). Four weeks post-treatment, bone marrow cells from these mice was freshly dissected (as mentioned above) and blocked with anti-mouse CD16/32 (BD Pharmigen, cat. no. 553142) and 10% mouse serum (Sigma). For the identification of LK/LSK and LT-HSC staining was performed using CD4 PE/Cy5 (Biolegend, cat. no. 100514), CD5 PE/Cy5 (Biolegend, cat. no. 100610), CD8a PE/Cy5 (Biolegend, cat. no. 100710), CD11b PE/Cy5 (Biolegend, cat. no. 101210), B220 PE/Cy5 (Biolegend, cat. no. 103210), TER-119 PE/Cy5 (Biolegend, cat. no. 116210), GR-1 PE/Cy5 (Biolegend, cat. no. 108410), SCA-1 Pacific Blue (Biolegend, cat. no. 122520), CD150 PE/Cy7 (Biolegend, cat. no. 115913), CD34 FITC (BD Pharmigen, cat. no. 553733) and CD117 APC-eFluor780 (eBioscience, cat. no. 47-1171). In each of the multi-colour flow cytometry experiments we included the fluorescence minus one (FMO) controls. FMO controls provides a measure of spillover in a given channel. This allows for correct gating and selection of only the stained cells in the experimental sample. Flow cytometry analysis was performed using a LSRFortessa instrument (BD) and resulting data were subsequently analyzed using FlowJo (v10, BD).
For blood counts, 20 μl of blood was collected from the tail-vein of the mice using a capillary pipette containing anticoagulants (EDTA). The EDTA anti-coagulated blood samples were used to obtain a complete blood count with a Hemavet Mascot Multispecies Hematology System Counter 1500R (CDC Technologies, Inc., Oxford, CT). Samples were counted no longer than five minutes after blood was drawn.
For re-plating assays using the STM2457 inhibitor, 10,000 lineage negative cells and primary murine AML cells were plated in three wells of 6-well-plate of M3434 methylcellulose (Stem Cell Technologies) in the presence of 1μM STM2457. The colonies were counted 7 days later and further 10,000 cells re-seeded and re-counted after a week until the 3rd replating. All data in this section were plotted using GraphPad Prism (version 9).
Flow cytometry analyses of AML cells
Cells were treated with vehicle (DMSO) or STM2457 and stained at the indicated timepoints with anti-mouse CD11b PE/Cy5 (Biolegend, cat. no. 101210) and anti-human CD11b PE (eBiosciences, cat. no. 9012-0118). Data were analyzed using LSRFortessa (BD) and FlowJo (v10, BD).
Apoptosis levels were measured in human and/or mouse AML cells treated with vehicle (DMSO) or STM2457 at indicated timepoints, using Annexin V (Life Technologies, cat. no. V13242). Data were analyzed by using LSRFortessa (BD) instruments.
Cell cycle levels were measured in human and/or mouse AML cells treated with vehicle (DMSO) or STM2457 at indicated timepoints, by using bromodeoxyuridine (BrdU) using the FITC BrdU Flow Kit (BD Pharmingen, 559619) or the APC BrdU Flow Kit (BD Pharmigen, 51-9000019AK). Data were analyzed by using LSRFortessa (BD) instruments.
For PDX experiments related to Figure 4 and Extended Data 6, 6- to 10-week-old NSG female mice were injected with 106 patient-derived AML cells by intravenous injection. For primary transplants, indicated doses of STM2457 or vehicle were delivered to the mice via intraperitoneal injection (IP) on day 5 (PDX-2) or day 10 post-transplant (PDX1,3), once daily for total 12 or 14 days (12-14 treatments). Then bone marrow and spleen cells from these mice were freshly dissected (as mentioned above) and flow-cytometry analysis was performed after staining with Alexa Fluor® 700 CD45 (Biolegend, cat. no. 368513), PE CD93 (eBioscience™, cat. no. 12093841), PerCP/Cyanine5.5 CD33 (Biolegend, cat. no. 303414), APC CD34 Clone 8G12 (Biolegend, cat. no. 345804), APC/Cyanine7 CD38 (Biolegend, cat. no. 303533), Biotin anti-human CD19 (Biolegend, cat. no. 302203), Biotin anti-human CD3 (Biolegend, cat. no. 300403), Brilliant Violet 605™ CD123 (Biolegend, cat. no. 306025), Brilliant Violet 421™ CD45RA (Biolegend, cat. no. 304129), PE/Cy7 CD90 (Biolegend, cat. no. 328123) and streptavidin SA BV510 (Biolegend, cat. no. 405233).
For primary and secondary transplantation experiments using primary murine MLL-AF9/Flt3ITD/+, 6- to 10-week-old NSG female mice were injected with 106 AML cells by intravenous injection. For primary transplants, indicated doses of STM2457 or vehicle were delivered to the mice via intraperitoneal injection (IP) on day 7 post-transplant, once daily for total 10 days. Then bone marrow cells from these mice was freshly dissected (as mentioned above) and blocked with anti-mouse CD16/32 (BD Pharmigen, cat. no. 101323) and 10% mouse serum (Sigma). For the identification of L-GMP and CD93 populations, staining was performed using Brilliant Violet 711 CD11b (Biolegend, cat. no. 101241), Brilliant Violet 605 Gr15 (Biolegend, cat. no. 108439), APC-CD48 (Biolegend, cat. no. 103411), APC-eFluor 780 CD117 (eBioscience™ cat. no. 47117182), Biotin Ly-6A/E (Sca-1) (Biolegend, cat. no. 108103), Biotin anti-mouse CD127 (IL-7Rα) (Biolegend, cat. no. 135005), Biotin Cd3, B220, Ter119 (Biolegend, cat. no. 559971) and PE CD93 (Biolegend, cat. no. 136503). In each of the multi-colour flow cytometry experiments we included the fluorescence minus one (FMO) controls. FMO controls provide a measure of spillover in a given channel. This allows for correct gating and select only the stained cells in the experimental sample. Flow cytometry analysis was performed using a LSRFortessa instrument (BD) and resulting data were subsequently analyzed using FlowJo (v10, BD). All data in this section were plotted using GraphPad Prism (Version 9).
Adult primary leukemia and cord blood sample drug and proliferation assays
All cord blood samples were obtained with informed consent (REC 07-MRE05-44) under the approval of East of England - Cambridge South Research Ethics Committee. Cord-blood-derived CD34+ cells were tested for colony-forming efficiency in StemMACS HSC-CFU semi-solid medium (Miltenyi Biotec) in the presence of the indicated concentration of STM2457 or DMSO. Colonies were counted by microscopy 12–14 days (CD34+ cells) after plating. All data in this section were plotted using GraphPad Prism (Version 9).
Western blot analysis
Cells were treated with Vehicle (DMSO) or the indicated concentrations of STM2457 and after 72 hours cell pellets resuspended in whole cell lysis buffer (50 mM Tris-HCl pH=8, 450 mM NaCl, 0.1% NP-40, 1mM EDTA), supplemented with 1 mM DTT, protease inhibitors (Sigma), and phosphatase inhibitors (Sigma). Protein concentrations were assessed by Bradford assay (Bio-Rad) and an equal amount of protein was loaded per track. Prior to loading, the samples were supplemented with SDS-PAGE sample buffer and DTT was added to each sample. 10-40 μg of protein was separated on SDS-PAGE gels, and blotted onto polyvinylidene difluoride membranes (Millipore).
Drug and Proliferation Assays
All suspension cells were plated in 96-well plates in triplicate at 5,000–10,000 cells per well and treated for 72 hours with vehicle or the indicated concentrations of STM2457 and STM2120 (0.04-50 μM). On day 4, an equal volume for all wells was split using fresh media and compound, such that the resulting cell density in each well matched the initial seeding density. Plates were measured on day 6 using CellTiter 96 AQueous Non-Radioactive Cell Proliferation Assay (Promega) in order to calculate the relative cell proliferation. All the compounds were dissolved in DMSO.
For the rescue experiments, cDNA was obtained by reverse transcription of MOLM13 cell RNA with Supercript III (ThermoFisher Scientific), then the SP1 full-length coding sequence was amplified by PCR and cloned into pHIV-ZsGreen plasmid (Addgene 18121) by Gibson assembly (Gibson Assembly Cloning Kit, NEB), using the HpaI site. MOLM13 cells were transduced with the SP1 or empty lentiviral vectors, then GFP+ cells were isolated by flow cytometry sorting after 4 days and employed in proliferation and western blot assays as descripted above. All data in this section were plotted using GraphPad Prism (Version 9).
Antibodies
Western blot experiments were performed using the following antibodies: anti-METTL3 from Bethyl Laboratories (A301-568A), anti-METTL14 from Abcam (ab98166), anti-DICER1 from Abcam (ab14601), anti-DDX3X from Abcam (ab128206), anti-ACTIN from Abcam (ab8227), anti-BRD4 (N-term) from Abcam (ab128874), anti-BRD4 (C-term) from Bethyl Laboratories (A301-985A), anti-BCL2 from Abcam (ab32124), anti-SP1 from Merck (07-645), anti-HNRNPL from Abcam (ab6106), anti-c-MYC from Santa Cruz Biotechnology (sc5605) and anti-GAPDH from Santa Cruz Biotechnology (sc47724) and Goat anti-Rabbit from Cell Signaling Technology (7074S). HRP activity was revealed using the SuperSignal™ West Pico Plus kit (ThermoScientific, 34580). For the m6A-RIP experiments the following antibodies were used: anti-N6-methyladenosine antibody (m6A), clone 17-3-4-1 from Merck (MABE 1006) and IgG Isotype Control from Merck (NI03).
Generation and bioluminescent imaging of primary murine and PDX models
Generation of AML PDX models and lentiviral transduction for transgenic expression of enhanced firefly luciferase was performed as described in detail by Vick, et al. 38. For primary and secondary transplantation experiments using primary murine MLL-AF9/Flt3ITD/+, 6- to 10-week-old NSG female mice were injected with 106 AML cells by intravenous injection. Indicated doses of STM2457 or vehicle were delivered to the mice via intraperitoneal injection (IP) on day 10 post-transplant, once daily for total two weeks (14 treatments). STM2457 was dissolved in 20%(w/v) 2-hydroxyproply beta-cyclodextrin vehicle (Sigma, H107). At day 10 post-transplant, the tumor burdens of the animals were detected using IVIS Lumina II (Caliper) with Living Image version 4.3.1 software (PerkinElmer). Briefly, 100 μl of 30 mg/ml D-luciferin (BioVision) was injected into the animals intraperitoneally. Ten min after injection, the animals were maintained in general anesthesia by isoflurane and put into the IVIS chamber for imaging. The detected tumor burdens were measured and quantified by the same software. Diseased mice were assessed blindly by qualified animal technicians from the Sanger mouse facility. Mice were housed in specific pathogen-free conditions in the Wellcome Sanger Institute animal facilities. All cages were on a 12:12-h light:dark cycle (lights on, 07:30) in a temperature-controlled and humidity-controlled room. Room temperature was maintained at 72 ± 2 °F (22.2 ± 1.1 °C), and room humidity was maintained at 30–70%. The animals were culled when the tumor burden was 109 photons per second or higher. All animal studies were carried out in accordance with the Animals (Scientific Procedures) Act 1986, UK and approved by the Ethics Committee at the Sanger Institute. Randomization and blinding were not applied. All data in this section were plotted using GraphPad Prism (Version 9).
STM2457 pharmacokinetic analysis
Three C57BL6/J mice were given IP injections of 30 mg/kg STM2457 and sampled serially up to 24 hours after dosing. Blood was collected from the tail vein at the indicated timepoints. Plasma was isolated by centrifugation, and 20 μL of plasma or blood was mixed with a precipitant solution of 120 μL acetonitrile and internal standard. Supernatant from this precipitation was diluted 1:1 v/v in water and 2.5 uL injections were characterised by LC-MS on a TSQ triple quadrupole mass spectrometer attached to an Accela pump (Thermo) and an HTS-CTC PAL autosampler. STM2457 was resolved on Hypersil Gold C18 solid phase (30 X 2.1 mm, 1.9 μm particles, Thermo) with an increasing gradient of 5-95% B over 30 seconds. Mobile phases consisted of 0.1% formic acid in water (A) and acetonitrile (B) and the flow was held at 1.0 ml/min. Blood to plasma ratio was determined using results from the appropriate samples, and the LLOQ was set at 10 ng/ml. All data in this section were plotted using GraphPad Prism (Version 9).
RNA nucleoside quantification by mass spectrometry
For Figures 1g-h and Extended Data 2c, MOLM-13 cells were grown in RPMI-1640 supplemented with 10% fetal bovine serum and maintained in culture between 0.3 and 1.5 x 10⁶ cells/ml. Cells were treated with Vehicle (DMSO) or 1 μM STM2457 for the timepoints indicated (24 hours for 1G and 1H, 48 hours for S1C). For animal experiments related to Extended Data 6 and 7, 6- to 10-week-old NSG female mice were injected with 1 x 10⁶ patient-derived AML cells by intravenous injection. Indicated doses of STM2457 or vehicle were delivered to the mice via IP on day 5 (PDX-2) or 8 post-transplantation (PDX1,3), once daily for total 12 or 14 days, respectively. Then, whole bone marrow from these mice was dissected and AML cells were purified using flow sorting (hCD45 or YFP). For in vivo experiments related to Extended Data 8, 6 to 10-week-old female Rosa26Cas9/+ mice were treated daily for two weeks with either vehicle or 50 mg/kg STM2457 (STORM) and whole bone marrow from these mice was dissected. Subsequent total RNA extraction from cells of all origins was performed using the RNeasy Mini Kit (Qiagen) and polyA+ RNA was purified using a Dynabeads mRNA purification kit (Invitrogen), in both cases following the manufacturer’s recommendations. Nucleosides were prepared from all poly A+ RNA by addition of nuclease digest mix. Each 100 uL volume contained 62.5 units of Benzonase (Sigma Aldrich), 5 units of Antarctic Phosphatase (NEB) and 10 mU/μL of Phosphodiesterase I (PDEI) from Crotalus adamanteus venom (Sigma Aldrich) made up in a buffer composed of 20 mM Tris-HCl (pH 8), 20 mM MgCl2 and 100 mM NaCl. Nucleosides were liberated by digestion at 37ºC overnight. The following morning the sample was cooled to room temperature and 100 μl of ice cold 2x Mass Spec buffer was added (0.1% formic acid containing internal standard).
In all cases, nucleosides were quantified by LC-MS using a Sciex 4500 triple quadrupole mass spectrometer attached to either a U3000 or 1290 liquid chromatograph (Thermo Scientific or Agilent, respectively). Nucleosides were separated across a HSS T3 column (2mm x 10mm with 1.8 μm particles, Waters) using an increasing gradient of 2-15% mobile phase B. The mobile phases were 0.1% v/v formic acid in water or acetonitrile for mobile phase A and B, respectively, and the flow was held at 300 μL/min. Nucleoside concentrations were extrapolated from a concentration curve of external standards and expressed as modified nucleoside relative to the total amount of canonical nucleosides. All data in this section were plotted using GraphPad Prism (Version 9).
Polysome fractionation
5 × 10⁷ MOLM-13 cells treated with vehicle (DMSO) or 1μM STM2457 for 72 hours and then further treated with 0.1 mg ml–1 cycloheximide for 5 min at 37°C. Then they were lysed and polysomes were fractionated on a sucrose gradient as previously described39. Relative RNA abundance in each fraction was then quantified by RT–qPCR. All data in this section were plotted using GraphPad Prism (Version 9).
Quantitative RT–PCR
Total RNA or RNA isolated from the polysome fractions or the m6A immunoprecipitation assays was isolated from MOLM-13 cells using the RNeasy Mini Kit (Qiagen). For cDNA synthesis, total RNA was reverse-transcribed with the SuperScript VILO cDNA Synthesis kit (Life Technologies). The levels of specific RNAs was measured using the Step One Plus real-time PCR machine (Applied Biosciences) and the Fast SYBRGreen PCR mastermix (Applied Biosciences) according to the manufacturer’s instructions. For experiments related to Figure 3f-g and Extended Data 5f, the BRD4, SP1, DICER1 and METTL3 mRNA levels were normalized to, the housekeeping gene, GAPDH. For experiments related to Extended Data 5f, the BRD4, SP1, BCL2, HOXA10, ARPC5 and DDX3X mRNA levels were normalized were normalized to IgG control groups. All samples, including the template controls, were assayed in triplicates. The relative quantification of target gene expression was performed with the standard curve or comparative cycle threshold (CT) method. The primer sequences are listed in the Supplementary Table 6. All data in this section were plotted using GraphPad Prism (Version 9).
m6A RNA immunoprecipitation and sequencing
Total RNA was isolated from MOLM-13 cells treated with vehicle (DMSO) or 1 μM STM2457 or 48 hours using the RNAeasy midi kit (Qiagen). Successively polyA+ RNA was purified from 300 μg total RNA using Dynabeads mRNA purification kit (Invitrogen). 500 ng of polyA+ purified RNA was used for each immunoprecipitation reaction. m6A RNA immunoprecipitation was performed using the Magna MeRIP m6A kit (Millipore) according to the manufacturer’s instructions.
Single-end 50-bp stranded libraries and sequenced using HiSeq 2500. Multiplexed reads were split on the basis of their barcodes using Illumina Basespace. Reads were trimmed to remove the TruSeq adaptor using trim_galore with parameters ‘-q 0 -a AGATCGGAAGAGCACACGTCTGAACTCCAGTCAC–phred33–fastqc’.
Read quality was assessed using FastQC (v11.8)40 To control for ribosomal contamination, reads were first mapped to hg38 rDNA sequences using bwa (v7.17) (default parameters) and reads that matched were removed from downstream analyses. The remaining read data were filtered for PCR duplicates using SAMtools (v1.10)41.
Filtered non-ribosomal reads were next mapped to the hg38 genome using hisat2 (v2.1) with default parameters42. Mapped reads were filtered to remove those mapping to more than one unique genomic locus (multihits) by keeping only reads with flag NH:i:1 in the output bam file from hisat2 (v2.1). Reads were further filtered to remove the ones with mapping quality less than 20 using SAMtools (v1.10). Genome coverage bedgraph files were generated using genomeCoverageBed from the BEDTools (v2.27.1) suite of tools43. Coverage files were converted to bigwig format using bedGraphToBigWig (v377). Statistical analysis and results of differentially methylated peaks in vehicle- and STM2457-treated cells was performed using the R package MeTDiff (v1.0)44 and the GENCODE human gene annotation GRCh38 v97 from Ensembl and are provided in Supplemental Table 3. Metagene plots were generated using the R/Bioconductor package Guitar (v2.2.0)45. Peak and RNA overlaps illustrated in Extended Data Fig. 5A, B are presented in Supplemental Table 4 and the relevant data from MOLM13 with METTL3 knockdown were derived from previously published study6. The m6A peaks were analysed for enrichment of known and de novo motifs using the software HOMER (v4.10)46. Genes that showed significant differential m6A were further tested for Gene Ontology (GO) enrichment of known Biological Processes (BP) using the R/Bioconductor package clusterProfiler (v3.14.3)47. Functional enrichment results are provided in Supplemental Table 5.
RNA sequencing
Input samples from the m6A RNA immunoprecipitation experiments were used to characterize the transcriptional profiles of vehicle versus STM2457-treated cells. The RNA-seq analysis of the input samples (vehicle n=2, STM2457 n=2) was performed using the nf-core/rnaseq bioinformatics pipeline (workflow container 1.4.2) under default parameters with hisat2 as the specified aligner48. Differential gene expression analysis was conducted using the R/Bioconductor package DESeq2 (v1.26.0)49. Genes showing an absolute log-fold change greater than one (|log2FoldChange | > 0.5) at an adjusted p-value for False Discovery Rate (FDR) less than 0.05 (padj < 0.05) were defined as being differentially expressed between vehicle and STM2457-treated cells. Results of the differential expression analyses between these two conditions (padj ≤ 0.05) are given in Supplemental Table 1. Functional profiling of the differentially expressed genes was performed using over-representation and Gene Set Enrichment Analyses (GSEA) of GO terms (Domain: Biological Process) and annotated gene sets available in the Molecular Signatures Database (MSigDB), as implemented in the R/Bioconductor package clusterProfiler (v3.14.3)47. Functional enrichment results for the down-regulated genes (log2FoldChange ≤ 0.7, padj < 0.05) are given in Supplemental Table 2.
Statistical analysis
Statistical analyses performed using two-tailed Student’s T-test, log-rank (Mantel–Cox) test (for survival comparisons) and one-way Anova, all included in the figure legends. Results were considered significant for a p-value (or adjusted p-value when multiple testing) below 0.05. Statistical significance of the overlap between two groups of gene sets were computed using Fisher’s exact test using the R/Bioconductor package GeneOverlap (v1.22)50.
Data accessibility
The datasets related to STM2457 used in this study can be accessed from ENA: PRJEB41662. The previously published datasets from Barbieri et al can be accessed from the Gene Expression Omnibus database with accession number GSE94613.
The STM2457 structure is deposited with PDB access code 7O2I. Additional details related to the chemical characterisation of STM2457 could be found in the relevant published patent (WO2020201773) on WIPO.
Extended Data
Extended Data Figure. 1. STM2457 is a specific small molecule inhibitor of METTL3 with no evidence of off-target effects.
a) Chemical structures of STM1760 and STM2120. b) Biochemical activity assay showing inhibition of the METTL3/METTL14 enzyme complex using a dose-range of STM1760. c) Surface plasmon resonance (SPR) sensorgram showing the binding of STM2457 to the METTL3/METTL14 protein complex. d) SPR sensorgram showing reduced binding of STM2457 to the METTL3/METTL14 protein complex in the presence of 50 µM SAM, illustrating that STM2457 is SAM competitive. e) SPR assay showing single-cycle binding kinetics of STM2457. f) Biochemical activity assay showing no inhibition of METTL16, NSUN1 and NSUN2 RNA methyltransferases using a dose-range of STM2457. g) Methyltransferase dendrograms showing that 10 µM STM2457 has selective inhibitory activity for METTL3/METTL14 over the indicated RNA and protein methyltransferases. h) Treatment with 10 µM STM2457 did not inhibit (ie result in less than 50% control activity) any of the 468 kinases in the ScanMax (DiscoverX) kinase panel tested (marked by green dots).
Extended Data Figure. 2. Binding of STM2457 to the SAM pocket of METTL3.
a) Overlay of crystal structures of METTL3/METTL14 in complex with STM2457 (carbon atoms in cyan) and METTL3/14 in complex with SAM (carbon atoms in magenta, PDB code 7O2I). The position of K513 is shown in lines of the corresponding color for each structure. b) Cellular thermal shift target engagement assay measuring binding affinity of STM2457 against human and mouse METTL3 proteins expressed in HeLa cells. The IC50 represents the concentration of STM2457 at which 50% of METTL3 is bound to STM2457. (mean +/- s.d., n=3). c) Quantification of m6A levels on poly-A+-enriched RNA using RNA-mass spectrometry after 48 hours of in vitro treatment of MOLM-13 with 1 µM of STM2457 or vehicle (DMSO). (mean +/- s.d., n=3). d) Quantification of m6Am, m62A and m7G levels on poly-A+-enriched RNA 24 hours of treatment of MOLM-13 with the indicated STM2457 concentrations (mean +/- s.d., n=3). e) STM2457 in vivo pharmacokinetic profile in mouse blood and brain tissue using a dose of 50 mg/kg. f) STM2457 in vivo PK/PD relationship in non-tumour bearing animals from the PK study shown in (e), demonstrating inhibition of m6A in spleen tissue over a range of STM2457 blood concentrations (n=3). two-tailed Student’s t-test.
Extended Data Figure. 3. Treatment with STM2457 triggers colony forming deficiency and apoptosis in AML cells.
a) Colony-forming efficiency of CD34+ human cord blood cells (n?=?3) in the presence of 1, 5, or 10?µM STM2457 (mean?±?s.d., n=3). These changes are not significant at the 95% confidence level according to one-way Anova on repeated measures. Error bars refer to variation across 3 different individuals (blue, brown and red square). b) Proliferation assay in MOLM-13 cells after treatment with the indicated doses of STM2457 and STM2120, illustrating no sensitivity to the latter at any tested dose (mean ± s.d., n=3). c) Colony forming efficiency of primary murine MLL-ENL/Flt3ITD/+ and NPM1c/NRAS-G12D AML cells treated with 1 μM STM2457 showing decreased clonogenic potential compared with vehicle-treated (DMSO) controls (mean ± s.d., n=3). d) Mac1 levels were used to assess differentiation of non-leukaemic haemopoietic cell line HPC7. Flow cytometry comparison on day 4 post-treatment between vehicle (DMSO) and 1 µM STM2457. e) Selective increased apoptosis in AML cells but not in non-leukaemic haematopoietic cells, following treatment with 1 µM of STM2457 at the presented time points (mean ± s.d., n=3). f) Western blot for SP1 and ACTIN in MOLM-13 cells transduced with plasmids expressing SP1 cDNA or an empty control (n=3). g) Dose-response curves of MOLM-13 cells to STM2457 after transduction with vectors expressing SP1 cDNA or an empty control, showing selective decrease of drug sensitivity upon ectopic expression the former. The dose-response curve of parental MOLM-13 (WT, light blue) shown in Fig. 2a is illustrated for comparison purposes. (mean ± s.d., n = 3). d, days; two-tailed Student’s t-test; *P < 0.05, **P < 0.01
Extended Data Figure. 4. Differential expression analysis of AML cells after treatment with STM2457.
a) Volcano plot for MOLM13 cells treated with 1 µM STM2457 versus control samples after 48 hours of treatment, showing significantly dysregulated genes in red (Padj = 0.01). b) Extended gene ontology analysis of the differentially expressed genes post-treatment with 1 µM STM2457 in MOLM-13 cells. c) Representative GO signatures of the differentially expressed genes post-treatment with STM2457 in MOLM-13 cells. LFC, Log Fold Change.
Extended Data Figure. 5. Pharmacological inhibition of METTL3 significantly reduces m6A on leukaemia-associated substrates.
a) Overlap between METTL3-dependent m6A poly-A+ RNAs in MOLM-13 cells either treated with 1 µM STM2457 or with genetic downregulation of METTL3 from Barbieri et al7. b) Overlap between differential downregulated m6A peaks in MOLM-13 cells either treated with 1 µM STM2457 or with genetic downregulation of METTL3 from Barbieri et al7. c) Genomic visualization of the m6A-meRIP normalized signal in MOLM13 cells following treatment with vehicle (DMSO) or 1 µM STM2457 for the METTL3-dependent m6A substrates BRD4 and HNRNPL (red stars indicate loss of m6A signal). d) m6A-meRIP-qPCR analysis of METTL3-dependent and METTL3-independent m6A substrates normalized to input in MOLM-13 cells treated for 24 or 48 hours with either vehicle (DMSO) or 1 µM STM2457 (mean ± s.d., n=3). e) Gene ontology analysis of differentially m6A-methylated mRNAs upon treatment with 1 µM STM2457. f) RT-qPCR quantification of METTL3 and DICER1 in total RNA samples from MOLM-13 cells treated with vehicle or STM2457 (mean +/- s.d., n=3). g) Western blot for METTL3, METTL14, DDX3X, DICER1 and ACTIN in MOLM-13 cells treated with 10, 5 and 1 µM of STM2457 or vehicle (DMSO) for 72 hours (n=3). two-tailed Student’s t-test; n.s., not significant; KD, knockdown.
Extended Data Figure. 6. STM2457 shows high efficacy and strong target engagement in PDX models.
a) Quantification of luminescence for the animal experiment depicted in Fig. 4a (mean ± s.d, n=5). b) Bioluminescence imaging of mice transplanted with AML PDX-3 (MLL-AF10) treated with vehicle or 50 mg/kg STM2457 (n=5). c) Kaplan-Meier survival of AML PDX-3 (MLL-AF10) following 12 consecutive treatments with vehicle or 50 mg/kg STM2457 at indicated times (n=5). d) Quantification of luminescence for the animal experiment depicted in Extended Data Fig. 4c (mean ± s.d, n=5). e) Quantification of luminescence for the animal experiment depicted in Fig. 4c (mean ± s.d, n=5). f) Body weight for the animal experiment depicted in Fig. 4a (n=5). Statistical significance was determined by two-tailed Mann–Whitney U test and box plots showing median, IQR and extremes. g) Western blot for SP1, BRD4, HNRNPL, BCL2, METTL3 and ACTIN protein levels in AML PDX-3 (MLL-AF6) treated with vehicle or 50 mg/kg STM2457 (n=4). h) RNA-mass spectrometry quantification of m6A levels on poly-A+-enriched RNA from bone marrow of AML PDX-3 (MLL-AF10) treated in vivo with vehicle, 30 mg/kg STM2457 or 50 mg/kg STM2457 (mean ± s.d., n=4). D, day; n.s. not significant; two-tailed Student’s t-test; Log-rank (Mantel–Cox) test was used for survival comparisons.
Extended Data Figure. 7. STM2457 treatment is efficacious and targeted in primary murine AML.
a) Percentage of YFP+ MLL-AF9/Flt3Itd/+ cells in the bone marrow of mice treated with vehicle or 30 mg/kg STM2457 (mean ± s.d., n=4). b) Spleen weight of MLL-AF9/Flt3Itd/+ murine AML models following treatment with vehicle or 30 mg/kg STM2457 (mean ± s.d., n=4). c) Western blot showing SP1, BRD4, HNRNPL, BCL2, METTL3 and ACTIN protein levels in murine AML (MLL-AF9/Flt3Itd/+) models treated with either vehicle or 30 mg/kg STM2457 (n=4). d) RNA-mass spectrometry quantification of m6A levels on poly-A+-enriched RNA in vivo from AML murine models (MLL-AF9/Flt3Itd/+) treated with vehicle, 30 mg/kg STM2457 or 50 mg/kg STM2457 (mean ± s.d., n=4). e) Percentage of CD93+ cells in the bone marrow of MLL-AF9/Flt3Itd/+ murine models following treatment with either vehicle or 30 mg/kg STM2457 (mean ± s.d., n=5). f) Percentage of L-GMP cells in the bone marrow of MLL-AF9/Flt3Itd/+ murine models following treatment with either vehicle or 30 mg/kg STM2457 (mean ± s.d., n=5). g) CD48 levels of L-GMP cells in the bone marrow of MLL-AF9/Flt3Itd/+ murine models following treatment with either vehicle or 30 mg/kg STM2457 (mean ± s.d., n=5). h) Kaplan-Meier survival after re-transplantation of cells isolated from primary transplanted animals with MLL-AF9/Flt3Itd/+ treated and treated with either vehicle or 30 mg/kg STM2457 (n=5). i) Percentage of YFP+ cells in the peripheral blood 12 days after re-transplantation with MLL-AF9/Flt3Itd/+ (mean ± s.d., n=5). D, day; BM, bone marrow; PBC, peripheral blood count; n.s. not significant; two-tailed Student’s t-test; Log-rank (Mantel–Cox) test was used for survival comparisons.
Extended Data Figure. 8. Pharmacological inhibition of METTL3 has no lasting effects on normal haematopoiesis.
a-c) Quantification of LSK (Lin-/Ska1+/c-Kit+) and HSC (LSK/CD150+/CD34-) compartments in bone marrow from WT C57BL/6J mice following 14 consecutive daily treatments with either vehicle or 50 mg/kg STM2457 (mean ± s.d., n=5). d) Blood count results from animal experiments related to a-c. e) Body weight of mice from animal experiments related to a-d (n = 5). Statistical significance was determined by two-tailed Mann–Whitney U test and box plots showing median, IQR and extremes. f) RNA-mass spectrometry quantification of m6A levels on poly-A+-enriched RNA from healthy bone marrow related to the animal experiments a-d, following 14 days of consecutive treatments with either vehicle or 50 mg/kg STM2457 (mean ± s.d., n=5). HSC, hematopoietic stem cells; two-tailed Student’s t-test; n.s., not significant.
Supplementary Material
Acknowledgments
T.K. was supported by grants from Cancer Research UK (grant reference RG17001) and ERC (project number 268569), in addition to benefiting from core support from the Wellcome Trust (Core Grant reference 092096), Cancer Research UK (grant reference C6946/A14492) and Kay Kendall Leukaemia Fund project grant (grant reference RG88664). K.T. was funded by a Wellcome Trust Sir Henry Wellcome Fellowship (grant reference RG94424). K.T and M.E. were funded by Leukaemia UK (G108148). I.J. was funded by ERC (Consolidator Grant 681524). I.J. and K.T. were funded by Cambridge-LMU Strategic Partnership Award. G.S.V. was funded by a Cancer Research UK Senior Cancer Fellowship (C22324/A23015). We thank Bee Ling Ng, Jennifer Graham, Sam Thompson and Christopher Hall for help with flow cytometry and the Cambridge Blood and Stem Cell Biobank for human AML and cord blood sample processing; the staff of the Sanger Institute Core Sequencing facility for sequencing and the staff of the Sanger Institute Research Support Facility for help with mouse experiments. We thank David Hardick, Beth Thomas, Yaara Ofir-Rosenfeld and Alexandra Sapetschnig at Storm Therapeutics for comments and advice, and Kerstin Danker, Mark Ridgill, Coralie Hoareau, and their colleagues at Evotec for drug discovery services and lead optimization support.
Footnotes
Author Contributions
K.T., T.K. and O.R. conceived the study and designed the experiments; K.T., W.B., E.Y., M.A., E.S.P., D.A., J.R., E.D.B, M.G., D.L., A.G.H., B.A., R.S., N.A.W., R.F., P.G. and M.E. conducted chemical, biochemical and molecular experiments. K.T., E.Y., J.R., E.D.B and M.G. performed animal experiments. G.T. and J.M.L.D. performed bioinformatics analyses. E.S.P. performed x-ray crystallography, assisted by W.B. in data analysis and interpretation. E.Y. and D.A. performed polysome profiling with help and supervision from N.I. and K.T. A.J.B., I.J. and G.S.V. helped with data analysis, interpretation and direction. K.T., T.K., E.Y., M.E. and O.R. wrote the manuscript with help from all authors. All authors discussed the results and commented on the manuscript.
Competing interests
T.K. is a co-founder of Abcam Plc and Storm Therapeutics Ltd, Cambridge, UK and Scientific Advisor to Foghorn Therapeutics and EpiVario. E.Y. is funded by Storm Therapeutics Ltd, Cambridge, UK. W.B., M.A., G.T., D.L., B.A., R.F., A.G.H., N.A.W., P.G. and O.R. are employees of Storm Therapeutics Ltd, Cambridge, UK. E.S.P. is an employee of Evotec (UK) Ltd, Abingdon, UK. George S. Vassiliou is a consultant for Kymab, Cambridge, UK. Storm Therapeutics Ltd is the owner of a patent application (WO2020201773) covering the development of METTL3 RNA methyltrasferase inhibitors.
References
- 1.Dominissini D, et al. Topology of the human and mouse m6A RNA methylomes revealed by m6A-seq. Nature. 2012;485:201–206. doi: 10.1038/nature11112. [DOI] [PubMed] [Google Scholar]
- 2.Meyer KD, et al. Comprehensive analysis of mRNA methylation reveals enrichment in 3′ UTRs and near stop codons. Cell. 2012;149:1635–1646. doi: 10.1016/j.cell.2012.05.003. [DOI] [PMC free article] [PubMed] [Google Scholar]
- 3.Liu J, et al. A METTL3-METTL14 complex mediates mammalian nuclear RNA N6-adenosine methylation. Nat Chem Biol. 2014;10:93–95. doi: 10.1038/nchembio.1432. [DOI] [PMC free article] [PubMed] [Google Scholar]
- 4.Wang X, et al. Structural basis of N(6)-adenosine methylation by the METTL3-METTL14 complex. Nature. 2016;534:575–578. doi: 10.1038/nature18298. [DOI] [PubMed] [Google Scholar]
- 5.Tzelepis K, et al. A CRISPR Dropout Screen Identifies Genetic Vulnerabilities and Therapeutic Targets in Acute Myeloid Leukemia. Cell Rep. 2016;17:1193–1205. doi: 10.1016/j.celrep.2016.09.079. [DOI] [PMC free article] [PubMed] [Google Scholar]
- 6.Barbieri I, et al. Promoter-bound METTL3 maintains myeloid leukaemia by m(6)A-dependent translation control. Nature. 2017;552:126–131. doi: 10.1038/nature24678. [DOI] [PMC free article] [PubMed] [Google Scholar]
- 7.Vu LP, et al. The N(6)-methyladenosine (m(6)A)-forming enzyme METTL3 controls myeloid differentiation of normal hematopoietic and leukemia cells. Nat Med. 2017;23:1369–1376. doi: 10.1038/nm.4416. [DOI] [PMC free article] [PubMed] [Google Scholar]
- 8.Schapira M. Structural Chemistry of Human RNA Methyltransferases. ACS Chem Biol. 2016;11:575–582. doi: 10.1021/acschembio.5b00781. [DOI] [PubMed] [Google Scholar]
- 9.Li F, et al. A Radioactivity-Based Assay for Screening Human m6A-RNA Methyltransferase, METTL3-METTL14 Complex, and Demethylase ALKBH5. J Biomol Screen. 2016;21:290–297. doi: 10.1177/1087057115623264. [DOI] [PubMed] [Google Scholar]
- 10.Melnyk S, Pogribna M, Pogribny IP, Yi P, James SJ. Measurement of plasma and intracellular S-adenosylmethionine and S-adenosylhomocysteine utilizing coulometric electrochemical detection: alterations with plasma homocysteine and pyridoxal 5′-phosphate concentrations. Clin Chem. 2000;46:265–272. [PubMed] [Google Scholar]
- 11.Ripperger T, et al. The heteromeric transcription factor GABP activates the ITGAM/CD11b promoter and induces myeloid differentiation. Biochim Biophys Acta. 2015;1849:1145–1154. doi: 10.1016/j.bbagrm.2015.07.005. [DOI] [PubMed] [Google Scholar]
- 12.O’Connor L, Gilmour J, Bonifer C. The Role of the Ubiquitously Expressed Transcription Factor Sp1 in Tissue-specific Transcriptional Regulation and in Disease. Yale J Biol Med. 2016;89:513–525. [PMC free article] [PubMed] [Google Scholar]
- 13.Choe J, et al. mRNA circularization by METTL3-eIF3h enhances translation and promotes oncogenesis. Nature. 2018;561:556–560. doi: 10.1038/s41586-018-0538-8. [DOI] [PMC free article] [PubMed] [Google Scholar]
- 14.Dawson MA, et al. Inhibition of BET recruitment to chromatin as an effective treatment for MLL-fusion leukaemia. Nature. 2011;478:529–533. doi: 10.1038/nature10509. [DOI] [PMC free article] [PubMed] [Google Scholar]
- 15.Weng H, et al. METTL14 Inhibits Hematopoietic Stem/Progenitor Differentiation and Promotes Leukemogenesis via mRNA m(6)A Modification. Cell Stem Cell. 2018;22:191–205.:e199. doi: 10.1016/j.stem.2017.11.016. [DOI] [PMC free article] [PubMed] [Google Scholar]
- 16.Dominissini D, Moshitch-Moshkovitz S, Salmon-Divon M, Amariglio N, Rechavi G. Transcriptome-wide mapping of N(6)-methyladenosine by m(6)A-seq based on immunocapturing and massively parallel sequencing. Nat Protoc. 2013;8:176–189. doi: 10.1038/nprot.2012.148. [DOI] [PubMed] [Google Scholar]
- 17.Tzelepis K, Rausch O, Kouzarides T. RNA-modifying enzymes and their function in a chromatin context. Nat Struct Mol Biol. 2019;26:858–862. doi: 10.1038/s41594-019-0312-0. [DOI] [PMC free article] [PubMed] [Google Scholar]
- 18.Alharbi RA, Pettengell R, Pandha HS, Morgan R. The role of HOX genes in normal hematopoiesis and acute leukemia. Leukemia. 2013;27:1000–1008. doi: 10.1038/leu.2012.356. [DOI] [PubMed] [Google Scholar]
- 19.Delgado MD, Leon J. Myc roles in hematopoiesis and leukemia. Genes Cancer. 2010;1:605–616. doi: 10.1177/1947601910377495. [DOI] [PMC free article] [PubMed] [Google Scholar]
- 20.Liu J, et al. N (6)-methyladenosine of chromosome-associated regulatory RNA regulates chromatin state and transcription. Science. 2020;367:580–586. doi: 10.1126/science.aay6018. [DOI] [PMC free article] [PubMed] [Google Scholar]
- 21.Mikutis S, et al. meCLICK-Seq, a Substrate-Hijacking and RNA Degradation Strategy for the Study of RNA Methylation. ACS Central Science. 2020 doi: 10.1021/acscentsci.0c01094. [DOI] [PMC free article] [PubMed] [Google Scholar]
- 22.Xiang Y, et al. RNA m(6)A methylation regulates the ultraviolet-induced DNA damage response. Nature. 2017;543:573–576. doi: 10.1038/nature21671. [DOI] [PMC free article] [PubMed] [Google Scholar]
- 23.Lin S, Choe J, Du P, Triboulet R, Gregory RI. The m(6)A Methyltransferase METTL3 Promotes Translation in Human Cancer Cells. Mol Cell. 2016;62:335–345. doi: 10.1016/j.molcel.2016.03.021. [DOI] [PMC free article] [PubMed] [Google Scholar]
- 24.Iwasaki M, Liedtke M, Gentles AJ, Cleary ML. CD93 Marks a Non-Quiescent Human Leukemia Stem Cell Population and Is Required for Development of MLL-Rearranged Acute Myeloid Leukemia. Cell Stem Cell. 2015;17:412–421. doi: 10.1016/j.stem.2015.08.008. [DOI] [PMC free article] [PubMed] [Google Scholar]
- 25.Krivtsov AV, et al. Transformation from committed progenitor to leukaemia stem cell initiated by MLL-AF9. Nature. 2006;442:818–822. doi: 10.1038/nature04980. [DOI] [PubMed] [Google Scholar]
- 26.Ellison RR, et al. Arabinosyl cytosine: a useful agent in the treatment of acute leukemia in adults. Blood. 1968;32:507–523. [PubMed] [Google Scholar]
- 27.Daver N, et al. New directions for emerging therapies in acute myeloid leukemia: the next chapter. Blood Cancer J. 2020;10:107. doi: 10.1038/s41408-020-00376-1. [DOI] [PMC free article] [PubMed] [Google Scholar]
- 28.Li Z, et al. FTO Plays an Oncogenic Role in Acute Myeloid Leukemia as a N(6)-Methyladenosine RNA Demethylase. Cancer Cell. 2017;31:127–141. doi: 10.1016/j.ccell.2016.11.017. [DOI] [PMC free article] [PubMed] [Google Scholar]
- 29.Huang Y, et al. Small-Molecule Targeting of Oncogenic FTO Demethylase in Acute Myeloid Leukemia. Cancer Cell. 2019;35:677–691.:e610. doi: 10.1016/j.ccell.2019.03.006. [DOI] [PMC free article] [PubMed] [Google Scholar]
- 30.Moroz-Omori EV, et al. METTL3 inhibitors for epitranscriptomic modulation of cellular processes. bioRxiv. 2020:2020.2009.2025.311803. doi: 10.1101/2020.09.25.311803. [DOI] [PMC free article] [PubMed] [Google Scholar]
- 31.Sledz P, Jinek M. Structural insights into the molecular mechanism of the m(6)A writer complex. Elife. 2016;5 doi: 10.7554/eLife.18434. [DOI] [PMC free article] [PubMed] [Google Scholar]
- 32.Evans PR, Murshudov GN. How good are my data and what is the resolution? Acta Crystallogr D Biol Crystallogr. 2013;69:1204–1214. doi: 10.1107/S0907444913000061. [DOI] [PMC free article] [PubMed] [Google Scholar]
- 33.McCoy AJ, et al. Phaser crystallographic software. J Appl Crystallogr. 2007;40:658–674. doi: 10.1107/S0021889807021206. [DOI] [PMC free article] [PubMed] [Google Scholar]
- 34.Winn MD, Murshudov GN, Papiz MZ. Macromolecular TLS refinement in REFMAC at moderate resolutions. Methods Enzymol. 2003;374:300–321. doi: 10.1016/S0076-6879(03)74014-2. [DOI] [PubMed] [Google Scholar]
- 35.Emsley P, Cowtan K. Coot: model-building tools for molecular graphics. Acta Crystallogr D Biol Crystallogr. 2004;60:2126–2132. doi: 10.1107/S0907444904019158. [DOI] [PubMed] [Google Scholar]
- 36.Wlodek S, Skillman AG, Nicholls A. Automated ligand placement and refinement with a combined force field and shape potential. Acta Crystallogr D Biol Crystallogr. 2006;62:741–749. doi: 10.1107/S0907444906016076. [DOI] [PubMed] [Google Scholar]
- 37.Lee BH, et al. FLT3 mutations confer enhanced proliferation and survival properties to multipotent progenitors in a murine model of chronic myelomonocytic leukemia. Cancer Cell. 2007;12:367–380. doi: 10.1016/j.ccr.2007.08.031. [DOI] [PMC free article] [PubMed] [Google Scholar]
- 38.Vick B, et al. An advanced preclinical mouse model for acute myeloid leukemia using patients’ cells of various genetic subgroups and in vivo bioluminescence imaging. PLoS One. 2015;10:e0120925. doi: 10.1371/journal.pone.0120925. [DOI] [PMC free article] [PubMed] [Google Scholar]
- 39.Panda AC, Martindale JL, Gorospe M. Polysome Fractionation to Analyze mRNA Distribution Profiles. Bio Protoc. 2017;7 doi: 10.21769/BioProtoc.2126. [DOI] [PMC free article] [PubMed] [Google Scholar]
- 40.Andrews S. 2010. (Available online http://www.bioinformatics.babraham.ac.uk/projects/fastqc)
- 41.Li H, et al. The Sequence Alignment/Map format and SAMtools. Bioinformatics. 2009;25:2078–2079. doi: 10.1093/bioinformatics/btp352. [DOI] [PMC free article] [PubMed] [Google Scholar]
- 42.Kim D, Paggi JM, Park C, Bennett C, Salzberg SL. Graph-based genome alignment and genotyping with HISAT2 and HISAT-genotype. Nat Biotechnol. 2019;37:907–915. doi: 10.1038/s41587-019-0201-4. [DOI] [PMC free article] [PubMed] [Google Scholar]
- 43.Quinlan AR, Hall IM. BEDTools: a flexible suite of utilities for comparing genomic features. Bioinformatics. 2010;26:841–842. doi: 10.1093/bioinformatics/btq033. [DOI] [PMC free article] [PubMed] [Google Scholar]
- 44.Cui X, et al. MeTDiff: A Novel Differential RNA Methylation Analysis for MeRIP-Seq Data. IEEE/ACM Trans Comput Biol Bioinform. 2018;15:526–534. doi: 10.1109/TCBB.2015.2403355. [DOI] [PubMed] [Google Scholar]
- 45.Cui X, et al. Guitar: An R/Bioconductor Package for Gene Annotation Guided Transcriptomic Analysis of RNA-Related Genomic Features. Biomed Res Int. 2016;2016:8367534. doi: 10.1155/2016/8367534. [DOI] [PMC free article] [PubMed] [Google Scholar]
- 46.Heinz S, et al. Simple combinations of lineage-determining transcription factors prime cis-regulatory elements required for macrophage and B cell identities. Mol Cell. 2010;38:576–589. doi: 10.1016/j.molcel.2010.05.004. [DOI] [PMC free article] [PubMed] [Google Scholar]
- 47.Yu G, Wang LG, Han Y, He QY. clusterProfiler: an R package for comparing biological themes among gene clusters. OMICS. 2012;16:284–287. doi: 10.1089/omi.2011.0118. [DOI] [PMC free article] [PubMed] [Google Scholar]
- 48.Ewels PA, et al. The nf-core framework for community-curated bioinformatics pipelines. Nat Biotechnol. 2020;38:276–278. doi: 10.1038/s41587-020-0439-x. [DOI] [PubMed] [Google Scholar]
- 49.Love MI, Huber W, Anders S. Moderated estimation of fold change and dispersion for RNA-seq data with DESeq2. Genome Biol. 2014;15:550. doi: 10.1186/s13059-014-0550-8. [DOI] [PMC free article] [PubMed] [Google Scholar]
- 50.Shen L, ISoMaM’ S. 2020. Available online, http://shenlab-sinai.github.io/shenlabsinai/
Associated Data
This section collects any data citations, data availability statements, or supplementary materials included in this article.
Supplementary Materials
Data Availability Statement
The datasets related to STM2457 used in this study can be accessed from ENA: PRJEB41662. The previously published datasets from Barbieri et al can be accessed from the Gene Expression Omnibus database with accession number GSE94613.
The STM2457 structure is deposited with PDB access code 7O2I. Additional details related to the chemical characterisation of STM2457 could be found in the relevant published patent (WO2020201773) on WIPO.


